ecological site classification - forestry commissionfile/esc_manual.pdf · the ecological site...
TRANSCRIPT
Ecological Site Classification

ESC Spatial Analysis A l i
2 | Ecological Site Classification | Stephen Bathgate | 20-May-11
Ecological Site Classification (ESC) A fundamental consideration in forestry establishment is whether tree species can meet the site expectations – in particular will the trees grow within the climatic and soil constraints of a given location. To assist forest practitioners Forest Research developed the Ecological Site Classification (ESC) tool, described in Pyatt et al 2001 (FC Bulletin 124), to draw together expert knowledge and site data into a system for tactical and strategic analysis of tree species suitability in Great Britain. To apply ESC in site level planning, the climatic suitability and productivity of a number of key broadleaved and conifer species can be assessed using the ESC software to generate predictions species suitability and productivity (measured as yield class – maximum cubic metres per hectare growth per annum). Due to the lack of accurate soils data the output must be refined through site visits to determine soil moisture and soil nutrient properties. This document describes how to apply the ESC stand level tool in assisting with species or native woodland choice in Britain.
Contents 3-4 Ecological Site Classification Overview 5-6 Ecological Site Classification Data 7 Accessing ESC online 8-9 Adding a site 10 Ecological Site Classification Site Report 11 Adjusting soil quality directly 12 Adjusting soil quality by humus form 13 Adjusting soil moisture regime by soil properties 14 Adjusting soil quality by soil type and lithology 15 Adjusting soil quality by indicator plants 16-18 Species Analysis 19-20 Future Climate Analysis 21-22 Species Descriptions 23 References
ESC Spatial Analysis A l i
3 | Ecological Site Classification | Stephen Bathgate | 20-May-11
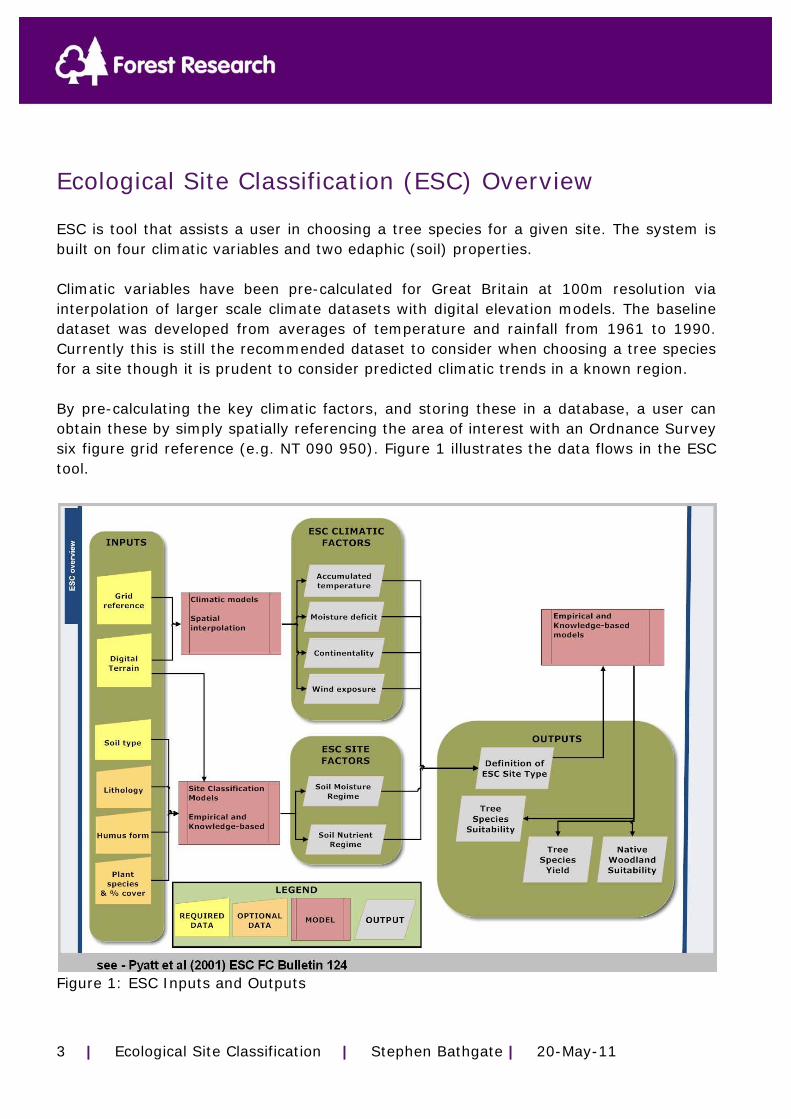
Ecological Site Classification (ESC) Overview ESC is tool that assists a user in choosing a tree species for a given site. The system is built on four climatic variables and two edaphic (soil) properties. Climatic variables have been pre-calculated for Great Britain at 100m resolution via interpolation of larger scale climate datasets with digital elevation models. The baseline dataset was developed from averages of temperature and rainfall from 1961 to 1990. Currently this is still the recommended dataset to consider when choosing a tree species for a site though it is prudent to consider predicted climatic trends in a known region. By pre-calculating the key climatic factors, and storing these in a database, a user can obtain these by simply spatially referencing the area of interest with an Ordnance Survey six figure grid reference (e.g. NT 090 950). Figure 1 illustrates the data flows in the ESC tool.
Figure 1: ESC Inputs and Outputs

ESC Spatial Analysis A l i
4 | Ecological Site Classification | Stephen Bathgate | 20-May-11
The four climatic variables are accumulated temperature (AT or AT5), continentality (CT), detailed aspect method scoring (DAMS) and moisture deficit (MD). AT is a measure of climatic warmth while continentality reflects the length of the growing season. DAMS describes the exposure and windiness of a site, but ESC does not predict windthrow hazard as this requires consideration of other factors such as management regimes. The fourth climatic factor is moisture deficit which indicates climatic wetness or dryness. Soils have two properties for the purposes of ESC. Soil moisture regime (SMR) indicates the availability of soil moisture, ranging from very dry to very wet, and this is calculated from a mixture of information including rooting depth, texture and moisture deficit. Soil nutrient regime (SNR) reflects the nutrient status of the soil from very poor to very rich and a sixth class carbonate, which only supports a limited range of tree species. ESC assumes that the practitioner will wish to plant species that match any site constraints. Site amelioration techniques such as intensive drainage or fertilisation can alter soil properties such that they are favourable for different species, but climatic constraints cannot be overcome. Maps of soil properties are not available at sufficient resolution to be of use in site level planning. The default ESC soil properties give a very general indication of fertility and soil moisture but are not reliable enough for species choice. Users of the ESC method are encouraged to derive soil properties through site-based assessments of soil and vegetation to ensure the validity of the system outputs. Software has been developed to automate the soil quality methods described in the ESC bulletin. ESC models calculate species performance against each climatic and soil variable and rate the result as very suitable, suitable or unsuitable. Very suitable conditions are likely to be optimal for growth while suitable conditions indicate that a species may grow well but at a slower rate. Unsuitable conditions suggest the species may grow very slowly or perhaps not at all. Yield predictions from ESC are based on the maximum YC expected for a species in British conditions modified by the accumulated temperature response and the next most limiting factor. These provide an indication of productivity but there will be site to site variation that the models cannot account for. The overall suitability score is governed by the poorest result, so a species very suitable according to climate and soil moisture regime (SMR) can still be ranked unsuitable overall if soil nutrient regime (SNR) is unfavourable. Note that suitability is no direct indication of species resilience to pests or disease, nor do the climatic or soil variables predict the occurrence of these threats.
ESC Spatial Analysis A l i
5 | Ecological Site Classification | Stephen Bathgate | 20-May-11
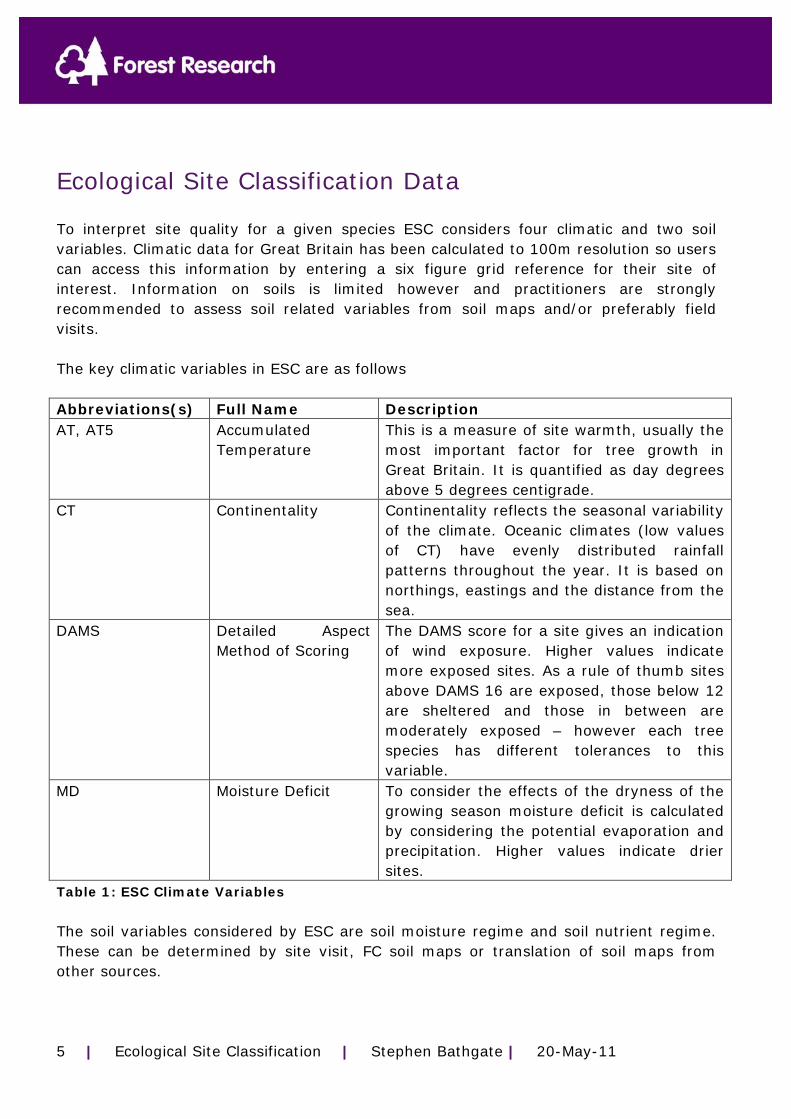
Ecological Site Classification Data To interpret site quality for a given species ESC considers four climatic and two soil variables. Climatic data for Great Britain has been calculated to 100m resolution so users can access this information by entering a six figure grid reference for their site of interest. Information on soils is limited however and practitioners are strongly recommended to assess soil related variables from soil maps and/or preferably field visits. The key climatic variables in ESC are as follows Abbreviations(s) Full Name Description AT, AT5 Accumulated
Temperature This is a measure of site warmth, usually the most important factor for tree growth in Great Britain. It is quantified as day degrees above 5 degrees centigrade.
CT Continentality Continentality reflects the seasonal variability of the climate. Oceanic climates (low values of CT) have evenly distributed rainfall patterns throughout the year. It is based on northings, eastings and the distance from the sea.
DAMS Detailed Aspect Method of Scoring
The DAMS score for a site gives an indication of wind exposure. Higher values indicate more exposed sites. As a rule of thumb sites above DAMS 16 are exposed, those below 12 are sheltered and those in between are moderately exposed – however each tree species has different tolerances to this variable.
MD Moisture Deficit To consider the effects of the dryness of the growing season moisture deficit is calculated by considering the potential evaporation and precipitation. Higher values indicate drier sites.
Table 1: ESC Climate Variables The soil variables considered by ESC are soil moisture regime and soil nutrient regime. These can be determined by site visit, FC soil maps or translation of soil maps from other sources.

ESC Spatial Analysis A l i
6 | Ecological Site Classification | Stephen Bathgate | 20-May-11
Abbreviation(s) Full Name Description SMR Soil Moisture Regime The measure of soil moisture ranging from
very dry to very wet. Soil moisture regime can be calculated from soil texture, rooting depth, location and stoniness. Default values exist for soils in the FC soil classification system.
SNR Soil Nutrient Regime A given soil is classed with respect to fertility using the SNR score. This ranges from very poor to very rich, with a sixth class known as carbonate. The SNR for a given soil can be determined by soil type, lithology or indicator plants.
Table 2: ESC Soil Variables The recommended determination of soil factors is through a site visit where soil type and texture are used to derive SMR and indicator plants derive SNR. Stand level tools can simplify application of the methods described in Forestry Commission Bulletin 124.

ESC Spatial Analysis A l i
7 | Ecological Site Classification | Stephen Bathgate | 20-May-11
Accessing Ecological Site Classification ESC is provided as a stand level tool accessible via a web browser via the internet. Registration is required so that users can save site-specific data and access it again later. For the majority of Forestry Commission (FC) staff there is no need to register. Simply open the following url in a web browser: https://www.eforestry.gov.uk/forestdss?app=esc The system will prompt for a username and password (figure 2). FC staff should enter the username in the format firstname.lastname (e.g. stephen.bathgate ) while the password is the same as that used to access FC systems (i.e. the domforestry password that must be changed at least once every two months). Note that the password is kept synchronised so it should always be the same as that used for logging into a FC pc. Figure 2: Login Screen
ESC Spatial Analysis A l i
8 | Ecological Site Classification | Stephen Bathgate | 20-May-11
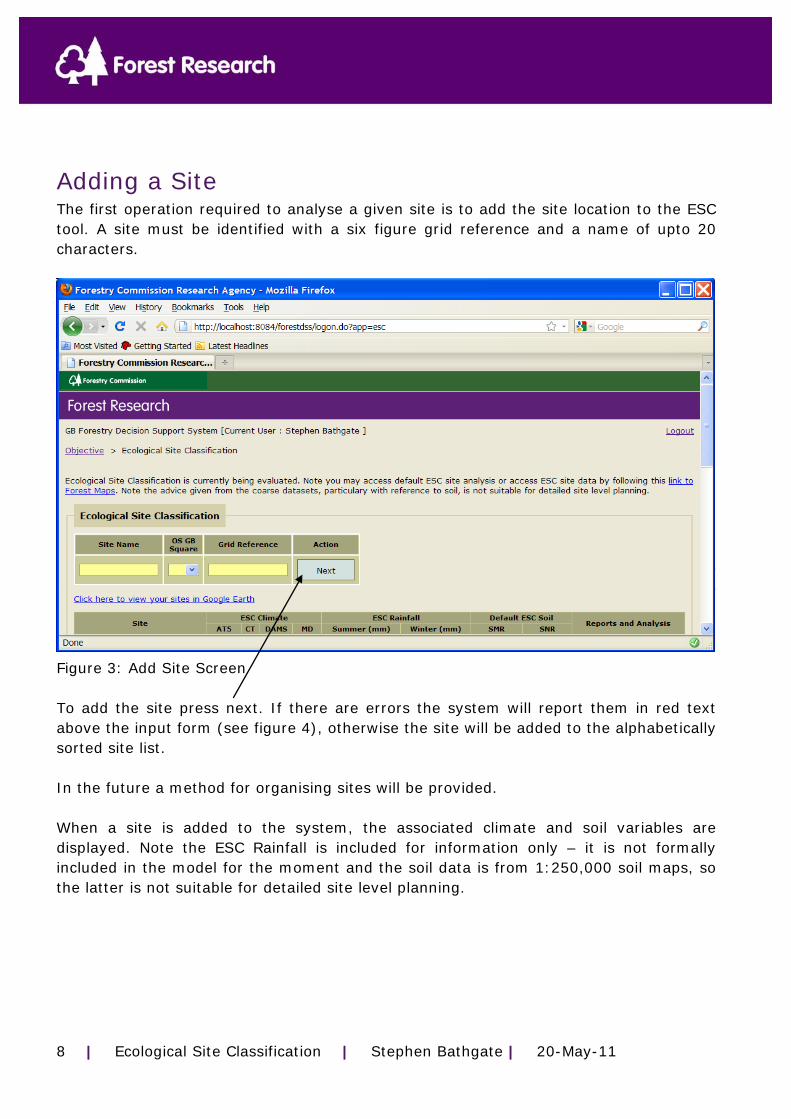
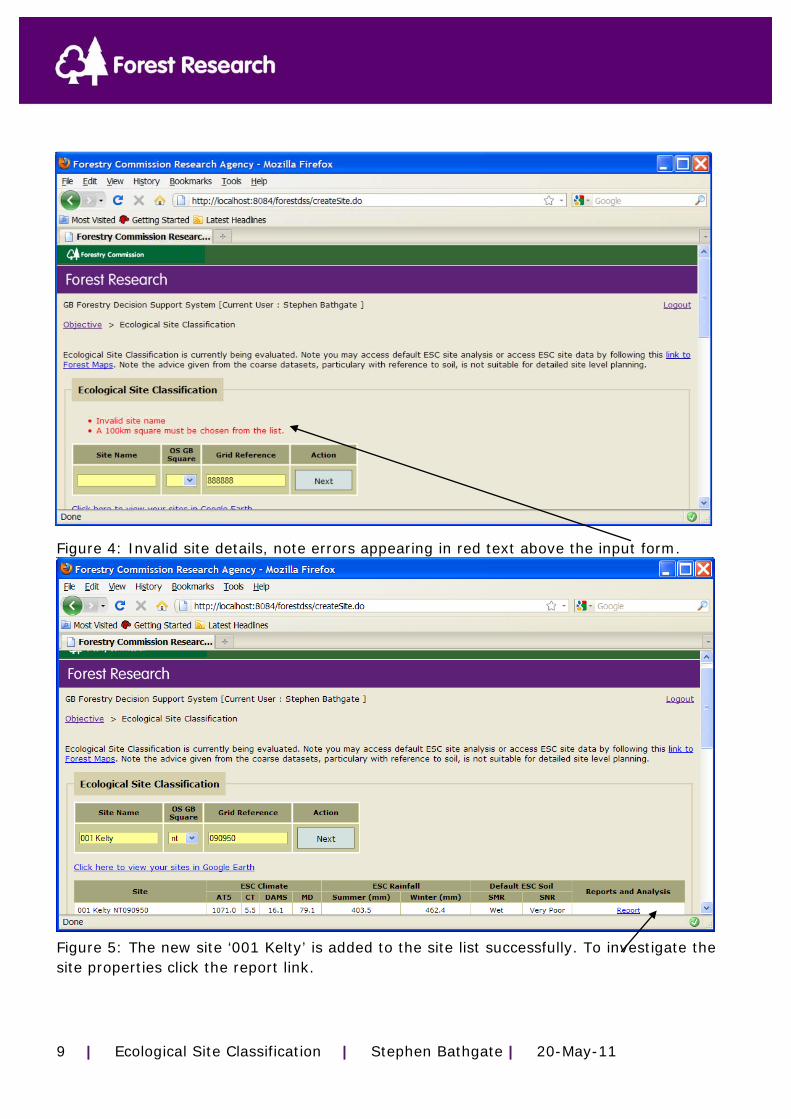
Adding a Site The first operation required to analyse a given site is to add the site location to the ESC tool. A site must be identified with a six figure grid reference and a name of upto 20 characters. 1 = species is very suitable for the climatic conditions of the site 2 = species is suitable for the site, but conditions may constrain growth potential 3 = species is unsuitable for the site. The species may not establish, suffer poor growth/form and/or may be particularly vulnerable to disease and pests. Generally planting unsuitable species is only recommended when the objective is scrub woodland. Due to the analysis being focussed on climatic variables, if a species is unsuitable, site amelioration techniques are unlikely to be effective. Studies have indicated that fertilisers even applied at luxurious rates will not overcome limiting climatic factors. Convention in the FC is to colour species suitability using a traffic light metaphor, where green is very suitable, yellow is suitable and red is unsuitable. Figure 1 illustrates the concept with a suitability map of Silver Birch and Figure 2 is a contrasting example with Ash. Figure 3: Add Site Screen To add the site press next. If there are errors the system will report them in red text above the input form (see figure 4), otherwise the site will be added to the alphabetically sorted site list. In the future a method for organising sites will be provided. When a site is added to the system, the associated climate and soil variables are displayed. Note the ESC Rainfall is included for information only – it is not formally included in the model for the moment and the soil data is from 1:250,000 soil maps, so the latter is not suitable for detailed site level planning.
ESC Spatial Analysis A l i
9 | Ecological Site Classification | Stephen Bathgate | 20-May-11
Figure 1: Silver Birch Suitability (green=very suitable) Figure 4: Invalid site details, note errors appearing in red text above the input form. Figure 5: The new site ‘001 Kelty’ is added to the site list successfully. To investigate the site properties click the report link.
ESC Spatial Analysis A l i
10 | Ecological Site Classification | Stephen Bathgate | 20-May-11
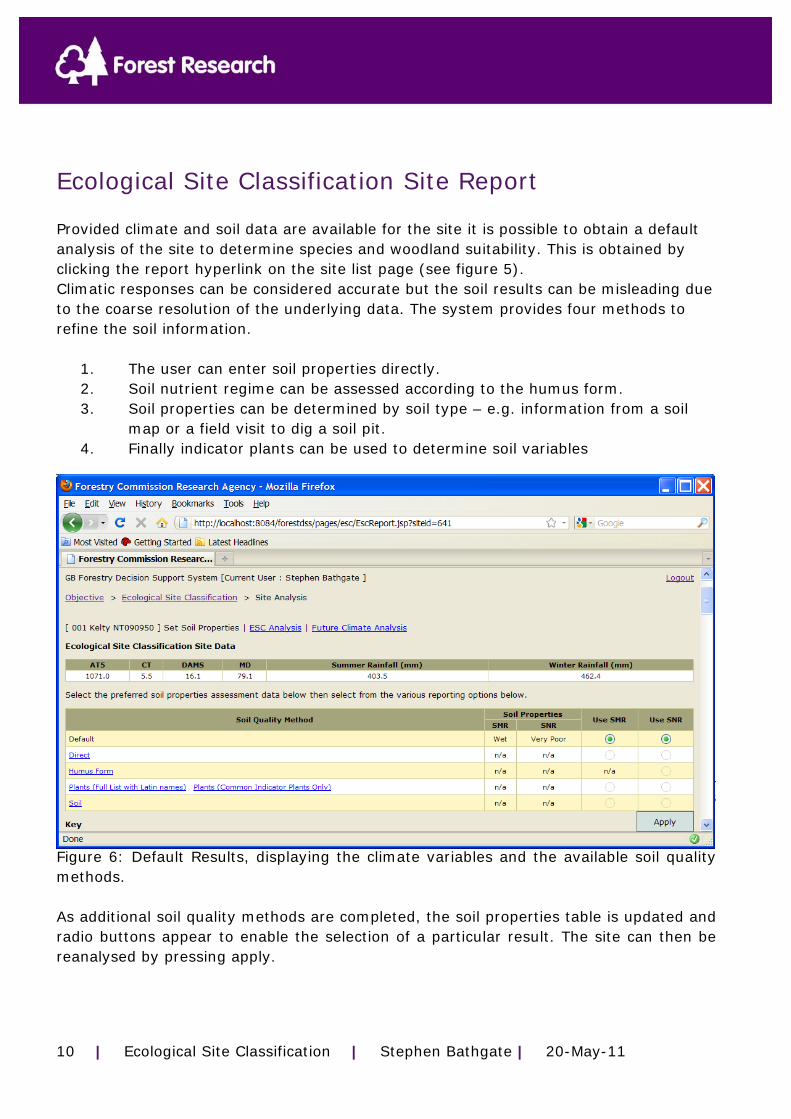
Ecological Site Classification Site Report Provided climate and soil data are available for the site it is possible to obtain a default analysis of the site to determine species and woodland suitability. This is obtained by clicking the report hyperlink on the site list page (see figure 5). Climatic responses can be considered accurate but the soil results can be misleading due to the coarse resolution of the underlying data. The system provides four methods to refine the soil information.
1. The user can enter soil properties directly. 2. Soil nutrient regime can be assessed according to the humus form. 3. Soil properties can be determined by soil type – e.g. information from a soil
map or a field visit to dig a soil pit. 4. Finally indicator plants can be used to determine soil variables
Data Dictionary Species productivity can be calculated from ESC in the form of a site yield class for a given species. The yield classes presented in this study are the site potential yields assuming optimal soil conditions. Soil effects can reduce yields differently across tree Figure 6: Default Results, displaying the climate variables and the available soil quality methods. As additional soil quality methods are completed, the soil properties table is updated and radio buttons appear to enable the selection of a particular result. The site can then be reanalysed by pressing apply.
ESC Spatial Analysis A l i
11 | Ecological Site Classification | Stephen Bathgate | 20-May-11
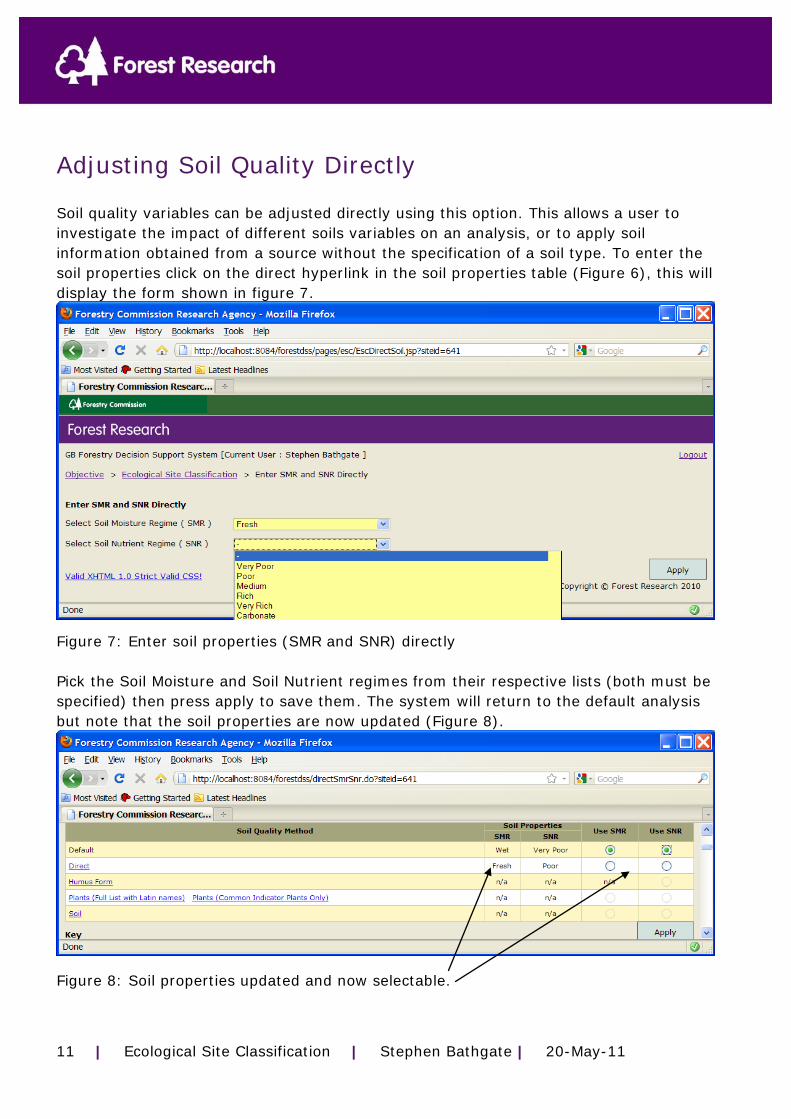
Adjusting Soil Quality Directly Soil quality variables can be adjusted directly using this option. This allows a user to investigate the impact of different soils variables on an analysis, or to apply soil information obtained from a source without the specification of a soil type. To enter the soil properties click on the direct hyperlink in the soil properties table (Figure 6), this will display the form shown in figure 7.
Figure 7: Enter soil properties (SMR and SNR) directly Pick the Soil Moisture and Soil Nutrient regimes from their respective lists (both must be specified) then press apply to save them. The system will return to the default analysis but note that the soil properties are now updated (Figure 8). Figure 8: Soil properties updated and now selectable.

ESC Spatial Analysis A l i
12 | Ecological Site Classification | Stephen Bathgate | 20-May-11
Adjusting Soil Quality by Humus Form Soil nutrient regime can be determined by studying the humus form on a site. Note this method cannot identify the carbonate class and is not as reliable as estimations based on soil type and/or indicator plants. Click on the humus form link in the soil properties table, this will result in display of the form in figure 9. Figure 9: Choosing humus form Confirm the selection by pressing apply which will cause the system to return to the site analysis.
ESC Spatial Analysis A l i
13 | Ecological Site Classification | Stephen Bathgate | 20-May-11
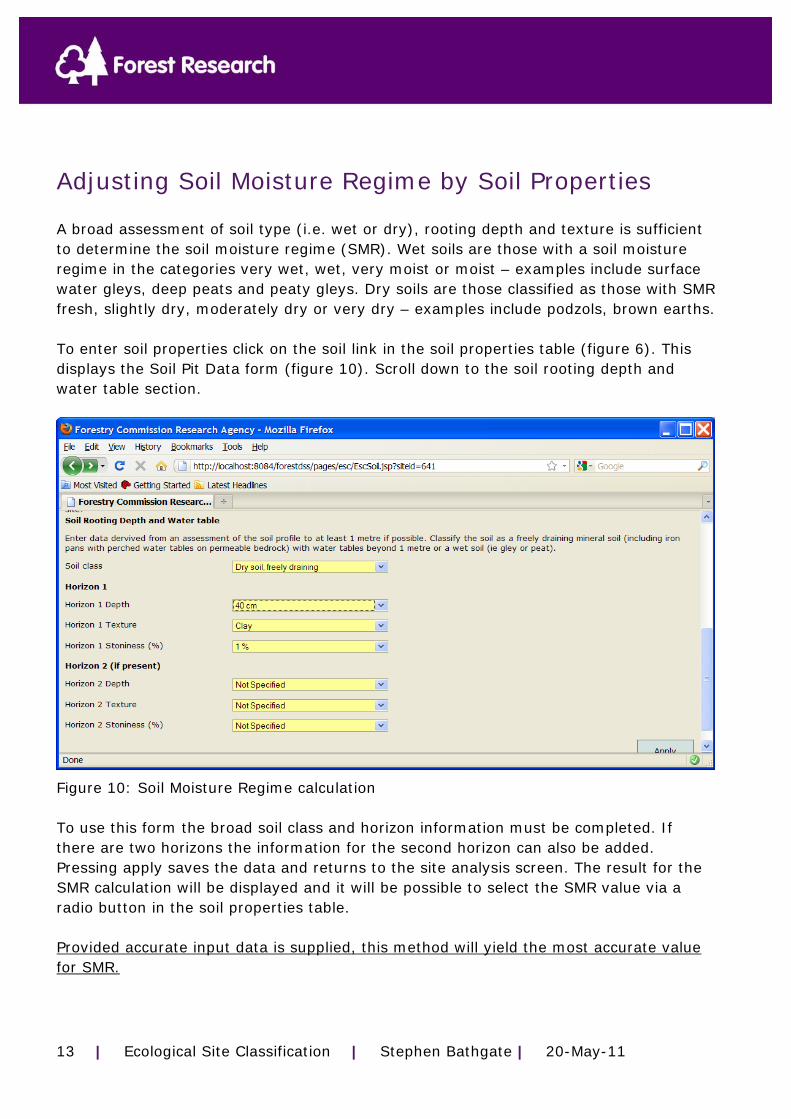
Adjusting Soil Moisture Regime by Soil Properties A broad assessment of soil type (i.e. wet or dry), rooting depth and texture is sufficient to determine the soil moisture regime (SMR). Wet soils are those with a soil moisture regime in the categories very wet, wet, very moist or moist – examples include surface water gleys, deep peats and peaty gleys. Dry soils are those classified as those with SMR fresh, slightly dry, moderately dry or very dry – examples include podzols, brown earths. To enter soil properties click on the soil link in the soil properties table (figure 6). This displays the Soil Pit Data form (figure 10). Scroll down to the soil rooting depth and water table section. Figure 10: Soil Moisture Regime calculation To use this form the broad soil class and horizon information must be completed. If there are two horizons the information for the second horizon can also be added. Pressing apply saves the data and returns to the site analysis screen. The result for the SMR calculation will be displayed and it will be possible to select the SMR value via a radio button in the soil properties table. Provided accurate input data is supplied, this method will yield the most accurate value for SMR.
ESC Spatial Analysis A l i
14 | Ecological Site Classification | Stephen Bathgate | 20-May-11
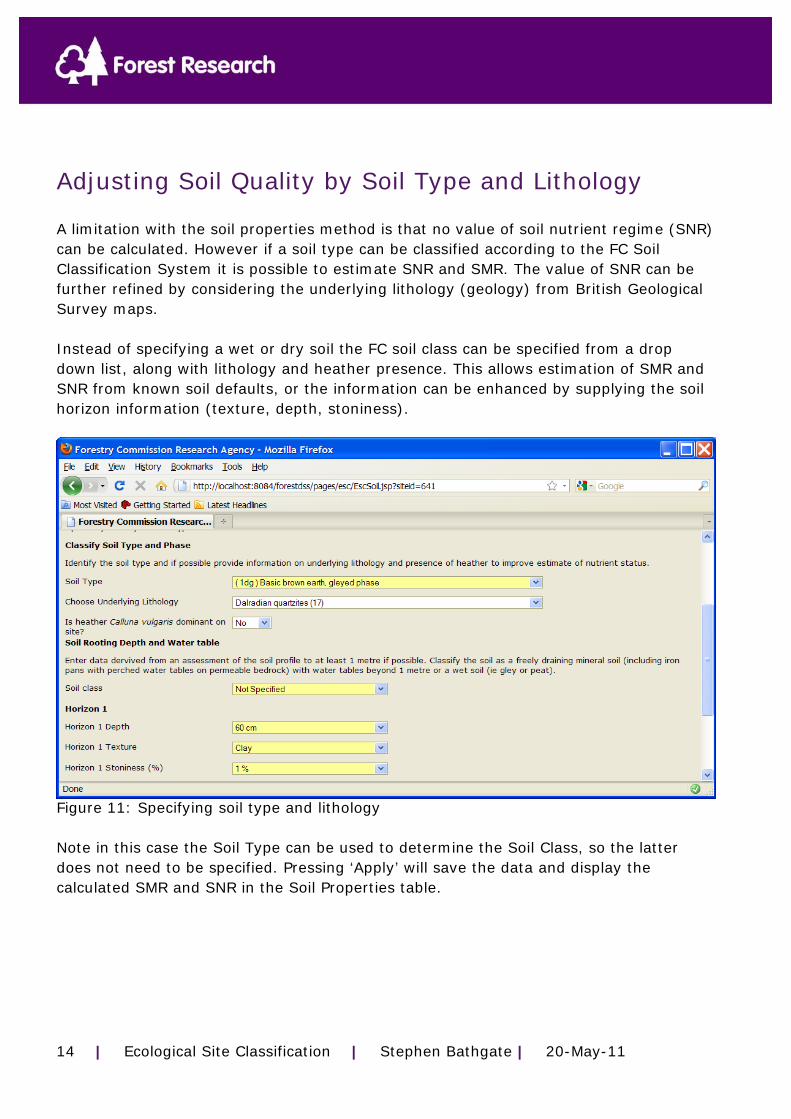
Adjusting Soil Quality by Soil Type and Lithology A limitation with the soil properties method is that no value of soil nutrient regime (SNR) can be calculated. However if a soil type can be classified according to the FC Soil Classification System it is possible to estimate SNR and SMR. The value of SNR can be further refined by considering the underlying lithology (geology) from British Geological Survey maps. Instead of specifying a wet or dry soil the FC soil class can be specified from a drop down list, along with lithology and heather presence. This allows estimation of SMR and SNR from known soil defaults, or the information can be enhanced by supplying the soil horizon information (texture, depth, stoniness). Figure 11: Specifying soil type and lithology Note in this case the Soil Type can be used to determine the Soil Class, so the latter does not need to be specified. Pressing ‘Apply’ will save the data and display the calculated SMR and SNR in the Soil Properties table.
ESC Spatial Analysis A l i
15 | Ecological Site Classification | Stephen Bathgate | 20-May-11
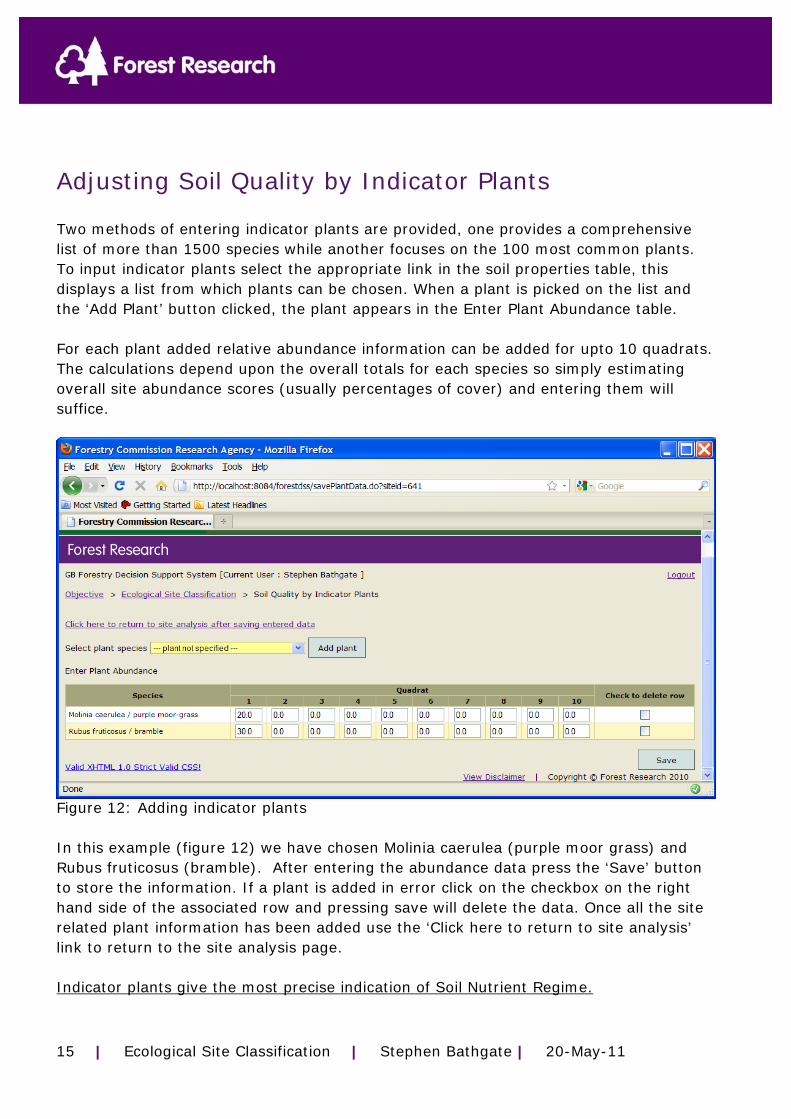
Adjusting Soil Quality by Indicator Plants Two methods of entering indicator plants are provided, one provides a comprehensive list of more than 1500 species while another focuses on the 100 most common plants. To input indicator plants select the appropriate link in the soil properties table, this displays a list from which plants can be chosen. When a plant is picked on the list and the ‘Add Plant’ button clicked, the plant appears in the Enter Plant Abundance table. For each plant added relative abundance information can be added for upto 10 quadrats. The calculations depend upon the overall totals for each species so simply estimating overall site abundance scores (usually percentages of cover) and entering them will suffice. Figure 12: Adding indicator plants Figure 12: Adding indicator plants In this example (figure 12) we have chosen Molinia caerulea (purple moor grass) and Rubus fruticosus (bramble). After entering the abundance data press the ‘Save’ button to store the information. If a plant is added in error click on the checkbox on the right hand side of the associated row and pressing save will delete the data. Once all the site related plant information has been added use the ‘Click here to return to site analysis’ link to return to the site analysis page. Indicator plants give the most precise indication of Soil Nutrient Regime.
ESC Spatial Analysis A l i
16 | Ecological Site Classification | Stephen Bathgate | 20-May-11
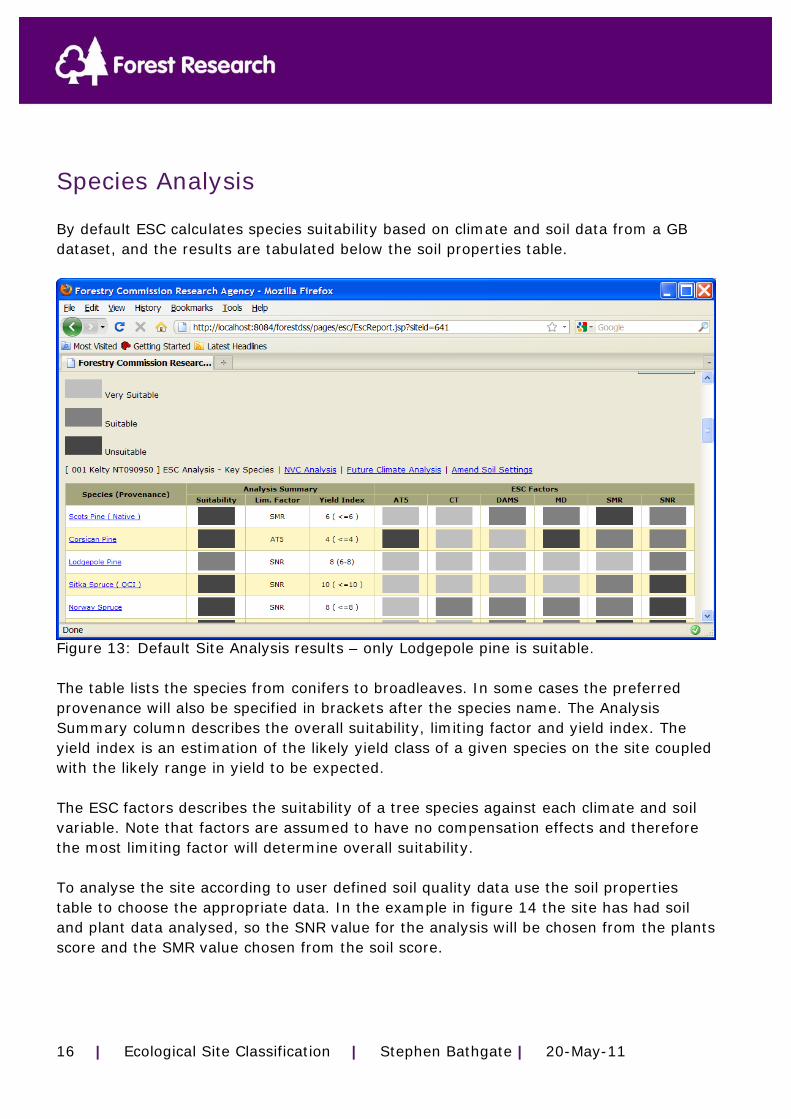
Species Analysis By default ESC calculates species suitability based on climate and soil data from a GB dataset, and the results are tabulated below the soil properties table. Figure 13: Default Site Analysis results – only Lodgepole pine is suitable. The table lists the species from conifers to broadleaves. In some cases the preferred provenance will also be specified in brackets after the species name. The Analysis Summary column describes the overall suitability, limiting factor and yield index. The yield index is an estimation of the likely yield class of a given species on the site coupled with the likely range in yield to be expected. The ESC factors describes the suitability of a tree species against each climate and soil variable. Note that factors are assumed to have no compensation effects and therefore the most limiting factor will determine overall suitability. To analyse the site according to user defined soil quality data use the soil properties table to choose the appropriate data. In the example in figure 14 the site has had soil and plant data analysed, so the SNR value for the analysis will be chosen from the plants score and the SMR value chosen from the soil score.
ESC Spatial Analysis A l i
17 | Ecological Site Classification | Stephen Bathgate | 20-May-11
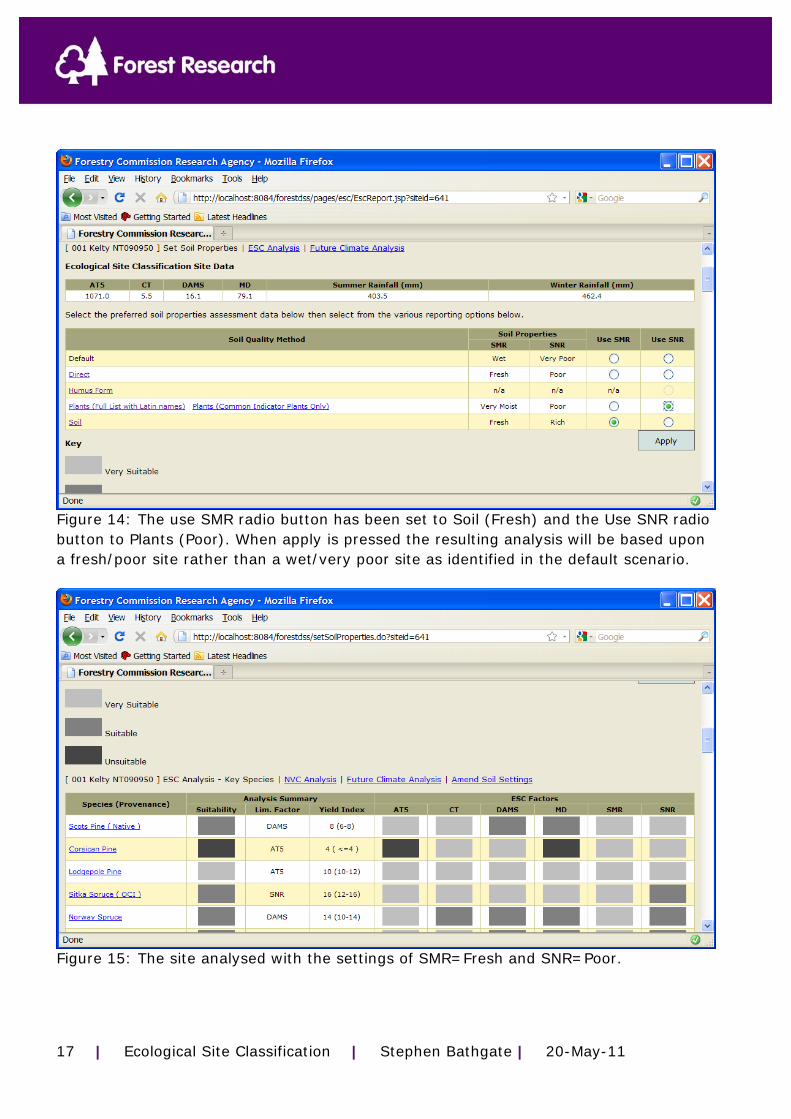
Figure 14: The use SMR radio button has been set to Soil (Fresh) and the Use SNR radio button to Plants (Poor). When apply is pressed the resulting analysis will be based upon a fresh/poor site rather than a wet/very poor site as identified in the default scenario. Figure 15: The site analysed with the settings of SMR=Fresh and SNR=Poor.
ESC Spatial Analysis A l i
18 | Ecological Site Classification | Stephen Bathgate | 20-May-11
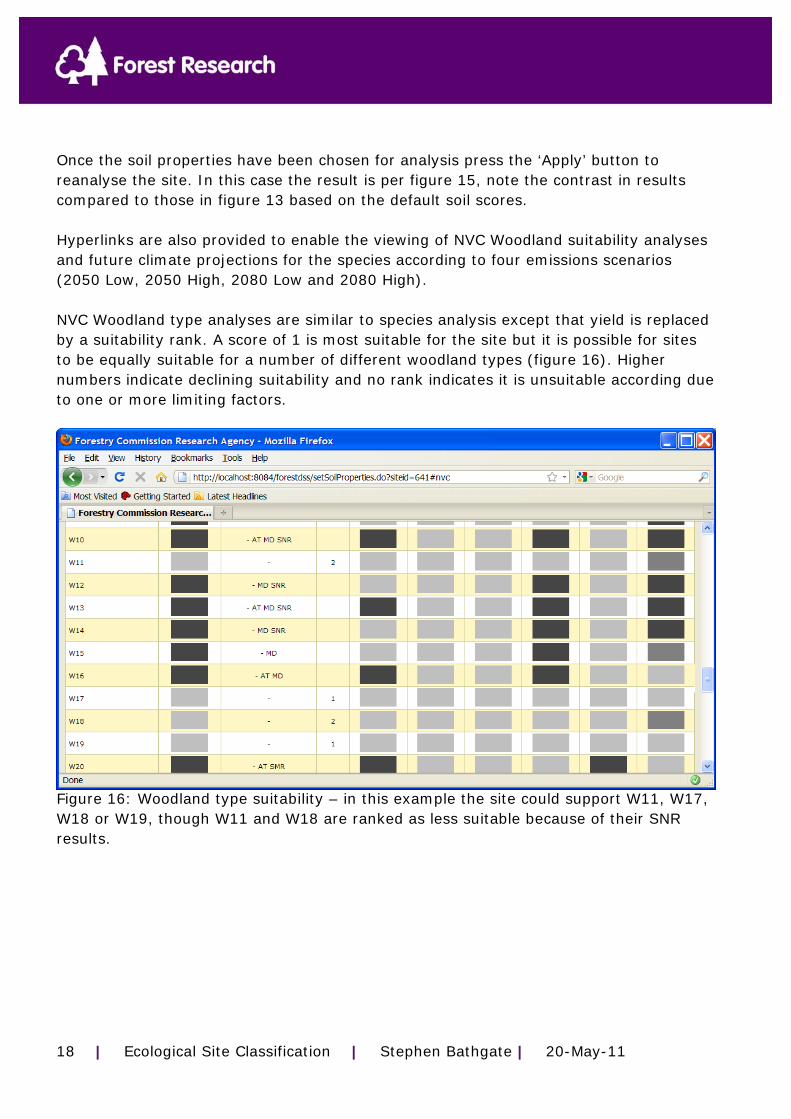
Once the soil properties have been chosen for analysis press the ‘Apply’ button to reanalyse the site. In this case the result is per figure 15, note the contrast in results compared to those in figure 13 based on the default soil scores. Hyperlinks are also provided to enable the viewing of NVC Woodland suitability analyses and future climate projections for the species according to four emissions scenarios (2050 Low, 2050 High, 2080 Low and 2080 High). NVC Woodland type analyses are similar to species analysis except that yield is replaced by a suitability rank. A score of 1 is most suitable for the site but it is possible for sites to be equally suitable for a number of different woodland types (figure 16). Higher numbers indicate declining suitability and no rank indicates it is unsuitable according due to one or more limiting factors. Figure 16: Woodland type suitability – in this example the site could support W11, W17, W18 or W19, though W11 and W18 are ranked as less suitable because of their SNR results.
ESC Spatial Analysis A l i
19 | Ecological Site Classification | Stephen Bathgate | 20-May-11
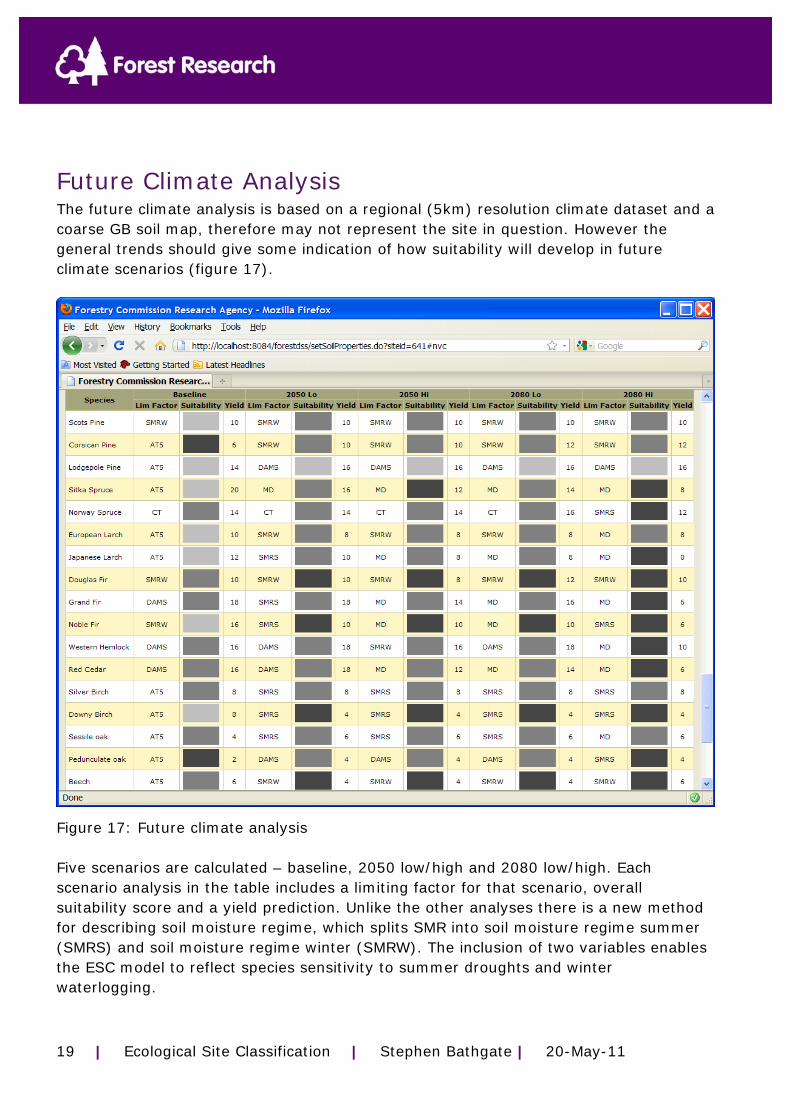
Future Climate Analysis The future climate analysis is based on a regional (5km) resolution climate dataset and a coarse GB soil map, therefore may not represent the site in question. However the general trends should give some indication of how suitability will develop in future climate scenarios (figure 17). Figure 17: Future climate analysis Five scenarios are calculated – baseline, 2050 low/high and 2080 low/high. Each scenario analysis in the table includes a limiting factor for that scenario, overall suitability score and a yield prediction. Unlike the other analyses there is a new method for describing soil moisture regime, which splits SMR into soil moisture regime summer (SMRS) and soil moisture regime winter (SMRW). The inclusion of two variables enables the ESC model to reflect species sensitivity to summer droughts and winter waterlogging.

ESC Spatial Analysis A l i
20 | Ecological Site Classification | Stephen Bathgate | 20-May-11
In figure 17 we can see that Beech while suitable in the baseline climate may become unsuitable due to winter waterlogging(SMRW) in the future while Downy Birch becomes unsuitable to drier summers (SMRS). Until such time as more detail is available, the future climate analysis should be considered as a means of assessing risk associated with a given species in the future. Consulting the species suitability charts will indicate the degree of tolerance against climate and soil factors.
ESC Spatial Analysis A l i
21 | Ecological Site Classification | Stephen Bathgate | 20-May-11
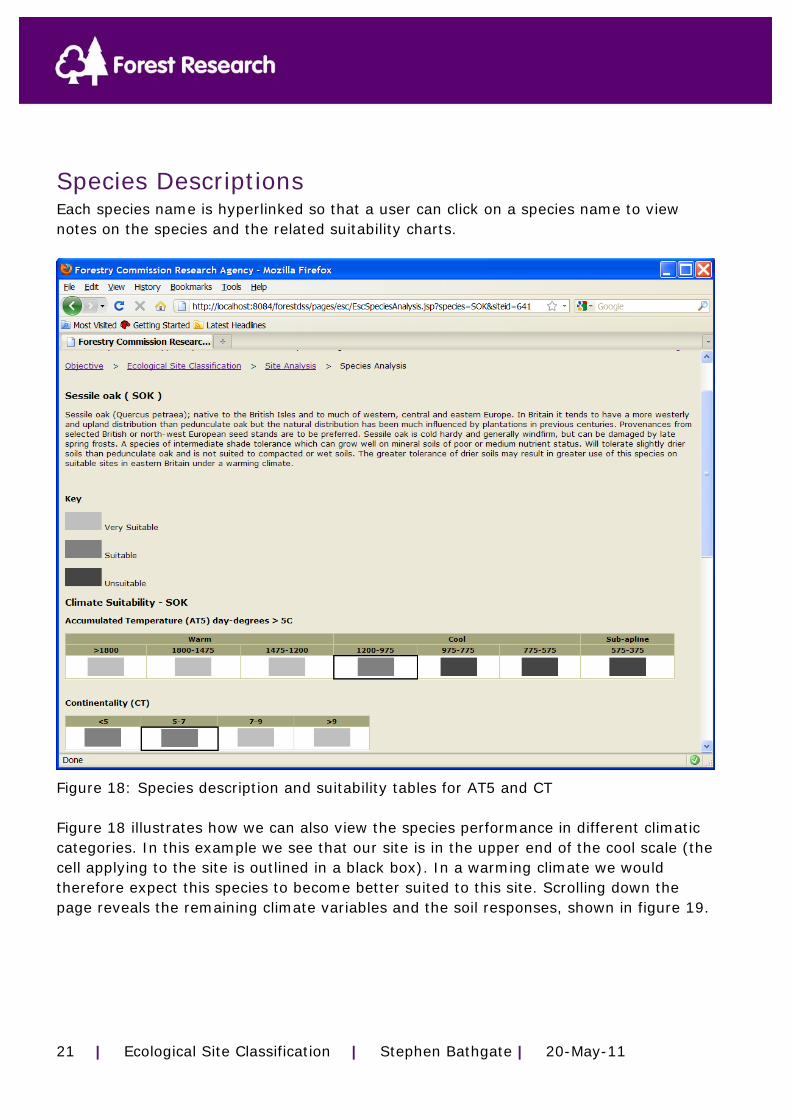
Species Descriptions Each species name is hyperlinked so that a user can click on a species name to view notes on the species and the related suitability charts. Figure 18: Species description and suitability tables for AT5 and CT Figure 18 illustrates how we can also view the species performance in different climatic categories. In this example we see that our site is in the upper end of the cool scale (the cell applying to the site is outlined in a black box). In a warming climate we would therefore expect this species to become better suited to this site. Scrolling down the page reveals the remaining climate variables and the soil responses, shown in figure 19.
ESC Spatial Analysis A l i
22 | Ecological Site Classification | Stephen Bathgate | 20-May-11
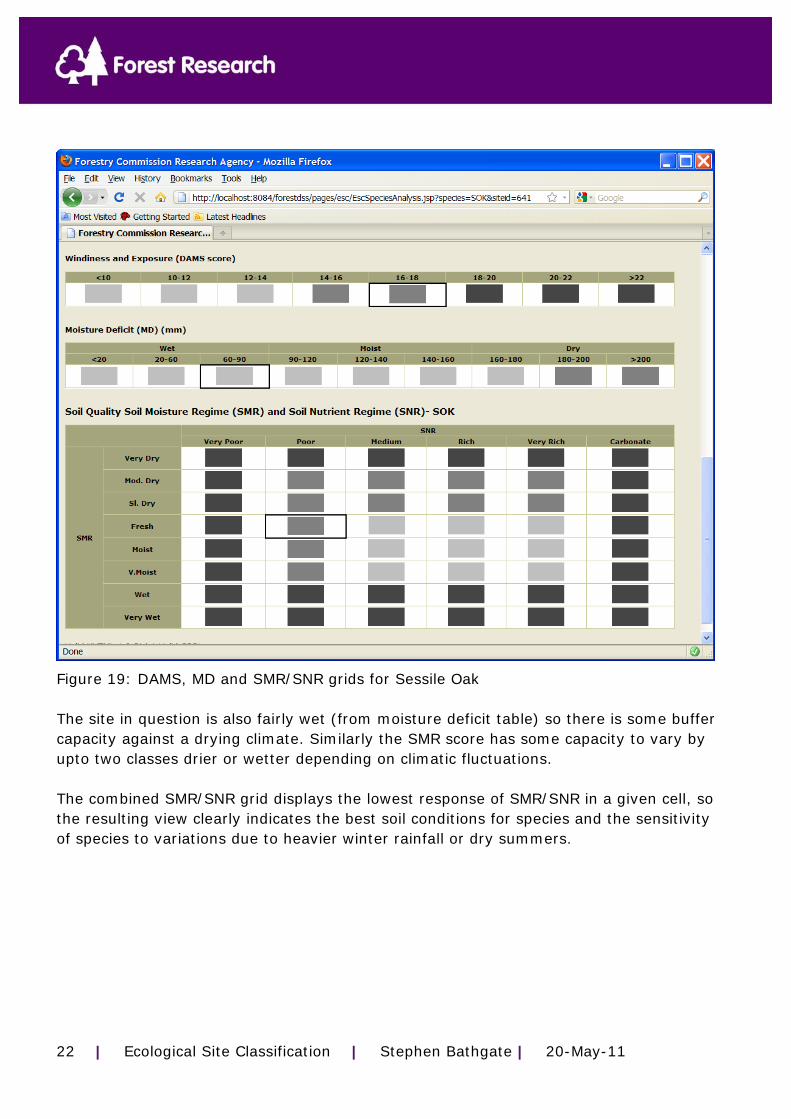
Figure 19: DAMS, MD and SMR/SNR grids for Sessile Oak The site in question is also fairly wet (from moisture deficit table) so there is some buffer capacity against a drying climate. Similarly the SMR score has some capacity to vary by upto two classes drier or wetter depending on climatic fluctuations. The combined SMR/SNR grid displays the lowest response of SMR/SNR in a given cell, so the resulting view clearly indicates the best soil conditions for species and the sensitivity of species to variations due to heavier winter rainfall or dry summers.

ESC Spatial Analysis A l i
23 | Ecological Site Classification | Stephen Bathgate | 20-May-11
References “An Ecological Site Classification for Forestry in Great Britain”, Graham Pyatt, Duncan Ray and Jane Fletcher, Forestry Commission Bulletin 124, 2001.