ecology of the european otter - natural england
TRANSCRIPT
Ecology of theEuropean OtterLutra lutra
Conserving Natura 2000 RiversEcology Series No. 10
Ecology of the European OtterConserving Natura 2000 Rivers
Ecology Series No. 10
Paul Chanin
For more information on this document, contact:
English NatureNorthminster HousePeterboroughPE1 1UATel: +44 (0) 1733 455100Fax: +44 (0) 1733 455103
This document was produced with the support of the European Commission’s LIFE Nature programme. Itwas published by Life in UK Rivers, a joint venture involving English Nature (EN), the CountrysideCouncil for Wales (CCW), the Environment Agency (EA), the Scottish Environment Protection Agency(SEPA), Scottish Natural Heritage (SNH), and the Scotland and Northern Ireland Forum for EnvironmentalResearch (SNIFFER).
© (Text only) EN, CCW, EA, SEPA, SNH & SNIFFER 2003
ISBN 185716 716 3
Catalogue code: IN11.1
A full range of Life in UK Rivers publications can be ordered from:
The Enquiry ServiceEnglish NatureNorthminster HousePeterboroughPE1 1UAEmail: [email protected]: +44 (0) 1733 455100Fax: +44 (0) 1733 455103
This document should be cited as: Chanin P (2003). Ecology of the European Otter. Conserving Natura 2000Rivers Ecology Series No. 10. English Nature, Peterborough.
Technical Editor: Lynn ParrSeries Ecological Coordinator: Ann Skinner
Cover design: Coral Design Management, Peterborough.Printed by Astron Document Services, Norwich, on Revive, 75% recycled post-consumer waste paper,Elemental Chlorine Free. 1M.
Cover: Paul Glendell/English Nature

Conserving Natura 2000 Rivers
This account of the ecological requirements of the European otter (Lutra lutra) has been produced aspart of Life in UK Rivers – a project to develop methods for conserving the wildlife and habitats ofrivers within the Natura 2000 network of protected European sites.The project’s focus has been theconservation of rivers identified as Special Areas of Conservation (SACs) and of relevant habitats andspecies listed in annexes I and II of the European Union Directive on the Conservation of NaturalHabitats and of Wild Fauna and Flora (92/43/EEC) (the Habitats Directive).
One of the main products is a set of reports collating the best available information on the ecologicalrequirements of each species and habitat, while a complementary series contains advice on monitoringand assessment techniques. Each report has been compiled by ecologists who are studying thesespecies and habitats in the UK, and has been subject to peer review, including scrutiny by a TechnicalAdvisory Group established by the project partners. In the case of the monitoring techniques, furtherrefinement has been accomplished by field-testing and by workshops involving experts andconservation practitioners.
Life in UK Rivers is very much a demonstration project, and although the reports have no officialstatus in the implementation of the directive, they are intended as a helpful source of information fororganisations trying to set ‘conservation objectives’ and to monitor for ‘favourable conservation status’for these habitats and species.They can also be used to help assess plans and projects affecting Natura2000 sites, as required by Article 6.3 of the directive.
As part of the project, conservation strategies have been produced for seven different SAC rivers inthe UK. In these, you can see how the statutory conservation and environment agencies havedeveloped objectives for the conservation of the habitats and species, and drawn up action plans withtheir local partners for achieving ‘favourable conservation status’.
Understanding the ecological requirements of river plants and animals is a prerequisite for settingconservation objectives, and for generating conservation strategies for SAC rivers under Article 6.1 ofthe European Habitats Directive.Thus, the questions these ecology reports try to answer include:
What water quality does the species need to survive and reproduce successfully?
Are there other physical conditions, such as substrate or flow, that favour these species or cause them to decline?
What is the extent of interdependence with other species for food or breeding success?
For each of the 13 riverine species and for the Ranunculus habitat, the project has also published tablessetting out what can be considered as ‘favourable condition’ for attributes such as water quality andnutrient levels, flow conditions, river channel and riparian habitat, substrate, access for migratory fish,and level of disturbance. ‘Favourable condition’ is taken to be the status required of Annex I habitatsand Annex II species on each Natura 2000 site to contribute adequately to ‘favourable conservationstatus’ across their natural range.
Titles in the Conserving Natura 2000 Rivers ecology and monitoring series are listed inside the backcover of this report, and copies of these, together with other project publications, are available via theproject website: www.riverlife.org.uk.
1
Ecology of the European Otter

Conserving Natura 2000 Rivers
2
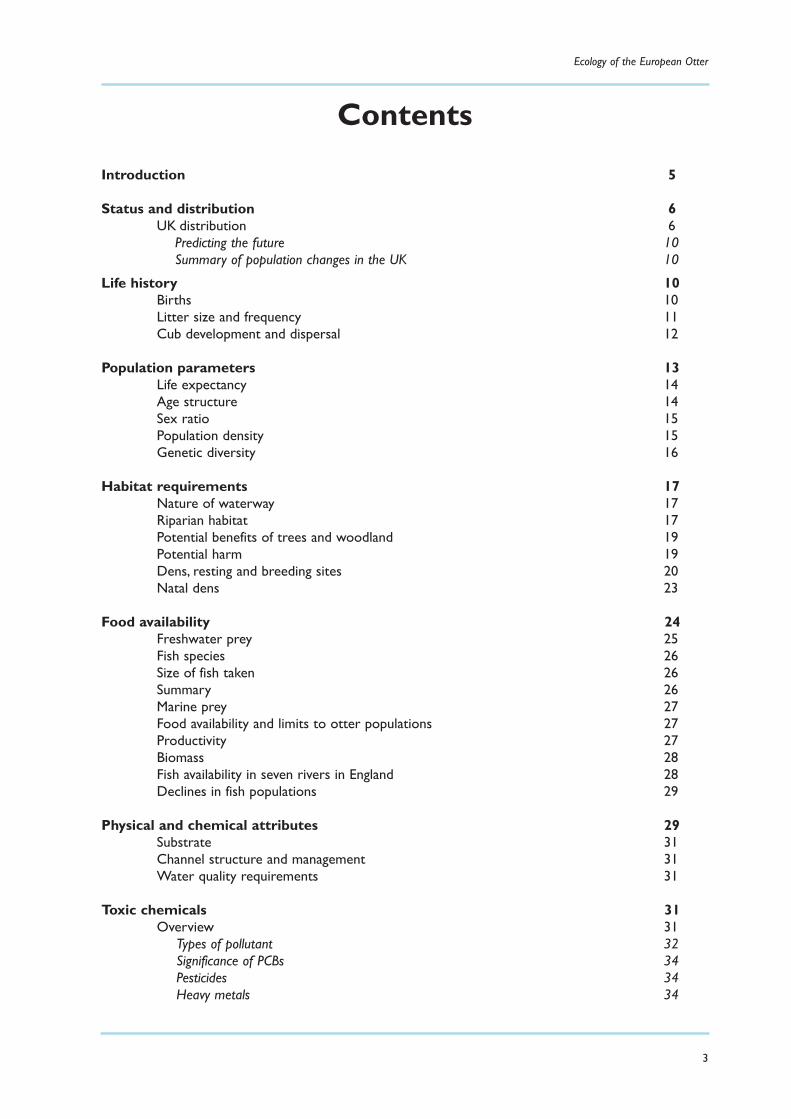
Contents
Introduction 5
Status and distribution 6UK distribution 6
Predicting the future 10Summary of population changes in the UK 10
Life history 10Births 10Litter size and frequency 11Cub development and dispersal 12
Population parameters 13Life expectancy 14Age structure 14Sex ratio 15Population density 15Genetic diversity 16
Habitat requirements 17Nature of waterway 17Riparian habitat 17Potential benefits of trees and woodland 19Potential harm 19Dens, resting and breeding sites 20Natal dens 23
Food availability 24Freshwater prey 25Fish species 26Size of fish taken 26Summary 26Marine prey 27Food availability and limits to otter populations 27Productivity 27Biomass 28Fish availability in seven rivers in England 28Declines in fish populations 29
Physical and chemical attributes 29Substrate 31Channel structure and management 31Water quality requirements 31
Toxic chemicals 31Overview 31
Types of pollutant 32Significance of PCBs 34Pesticides 34Heavy metals 34
Ecology of the European Otter
3
Conserving Natura 2000 Rivers
4
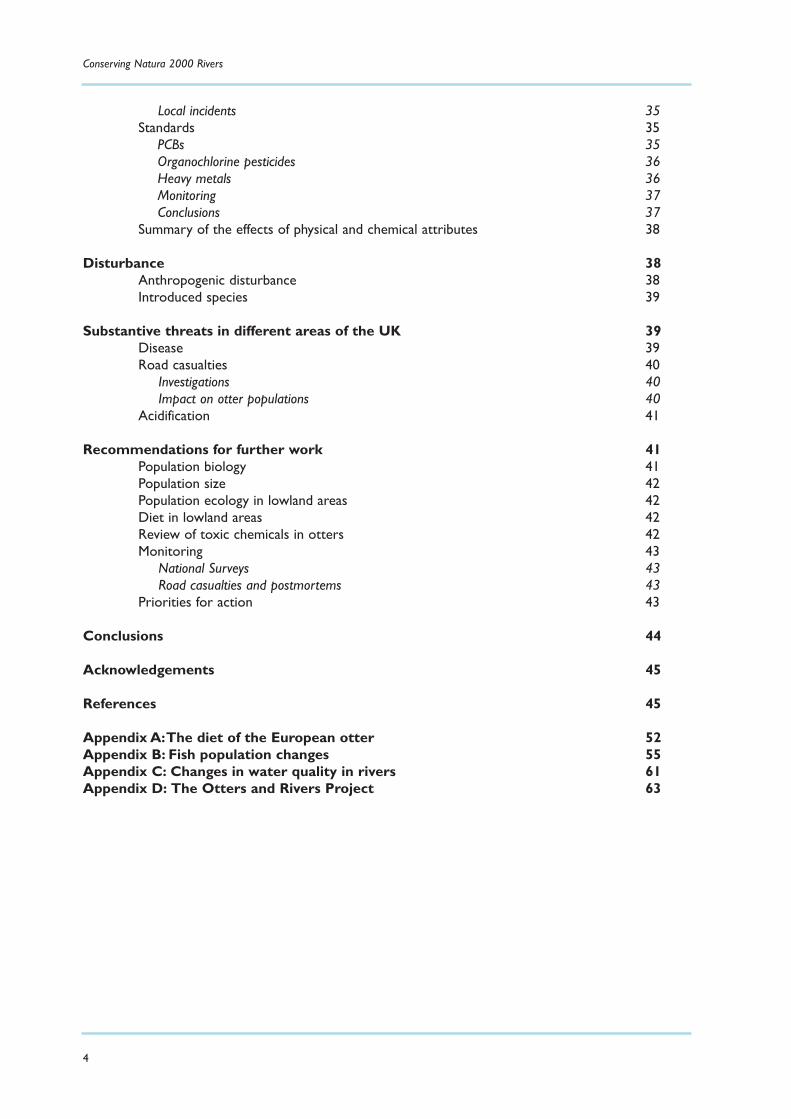
Local incidents 35Standards 35
PCBs 35Organochlorine pesticides 36Heavy metals 36Monitoring 37Conclusions 37
Summary of the effects of physical and chemical attributes 38
Disturbance 38Anthropogenic disturbance 38Introduced species 39
Substantive threats in different areas of the UK 39Disease 39Road casualties 40
Investigations 40Impact on otter populations 40
Acidification 41
Recommendations for further work 41Population biology 41Population size 42Population ecology in lowland areas 42Diet in lowland areas 42Review of toxic chemicals in otters 42Monitoring 43
National Surveys 43Road casualties and postmortems 43
Priorities for action 43
Conclusions 44
Acknowledgements 45
References 45
Appendix A:The diet of the European otter 52Appendix B: Fish population changes 55Appendix C: Changes in water quality in rivers 61Appendix D: The Otters and Rivers Project 63

Introduction
Over the last two decades the literature on the European (or Eurasian) otter appears to haveincreased at an exponential rate.There is a wealth of information on diet, distribution and levels oftoxic chemicals in otters, their faeces and their prey. While these aspects of biology are relatively easyto study (though not necessarily to interpret), others, such as population dynamics, density, homeranges and movements, are more difficult to investigate in such a rare and elusive animal. Thus, areview of existing data reveals an abundance of information in some areas and a paucity in others.
The principles of conservation management for otters were first established by the reports of the JointOtter Group (O’Connor et al. 1977, 1979) and focused very strongly on perceived detrimental factorssuch as habitat destruction, disturbance by humans and lack of resting or breeding sites.The reportsemphasised the experimental nature of these practices and it has become clear, as more has beenlearned about otters, that the animals are more resilient than had been previously supposed. Manypeople working in the field of otter conservation are aware of this fact but there is still a need toelucidate more clearly factors that are truly detrimental to otters so that activities can be focusedmost effectively.
As large, warm-blooded top predators, otters are insulated against many of the small-scaleenvironmental factors that can have a marked impact on the survival of riparian invertebrates andplants (temperature, rates of flow, water chemistry, etc.). Since individual otters can have home rangesextending over tens of kilometres, populations depend on the conditions in catchments, or even groupsof catchments, which may encompass a wide range of physical states in the riparian environment. Forthese reasons, determining ‘favourable conditions’ and setting targets for conservation-led managementis not feasible in the way that it might be for smaller organisms.
This report consists of two sections:
1 A review of current knowledge about otters.The report attempts to evaluate such data, to highlight areas where there are disagreements and to indicate where long-held beliefs about the needs of otters are not supported by recent studies.
2 Four appendices reporting on short investigations into matters related to the review:
Ecology of the European Otter
5
Paul Glendell/English Nature
Although there is a lot of information available about the biology and distribution of the otter, a great dealstill remains to be discovered about its general ecology, such as home range, density and population dynamics.
a) A summary of dietary studies.
b) Changes in fish populations in a number of rivers in the Midlands and southern England over the last 30 years.
c) Changes in water quality in some of these rivers.
d) The work of the Otters and Rivers Project.
Status and distribution
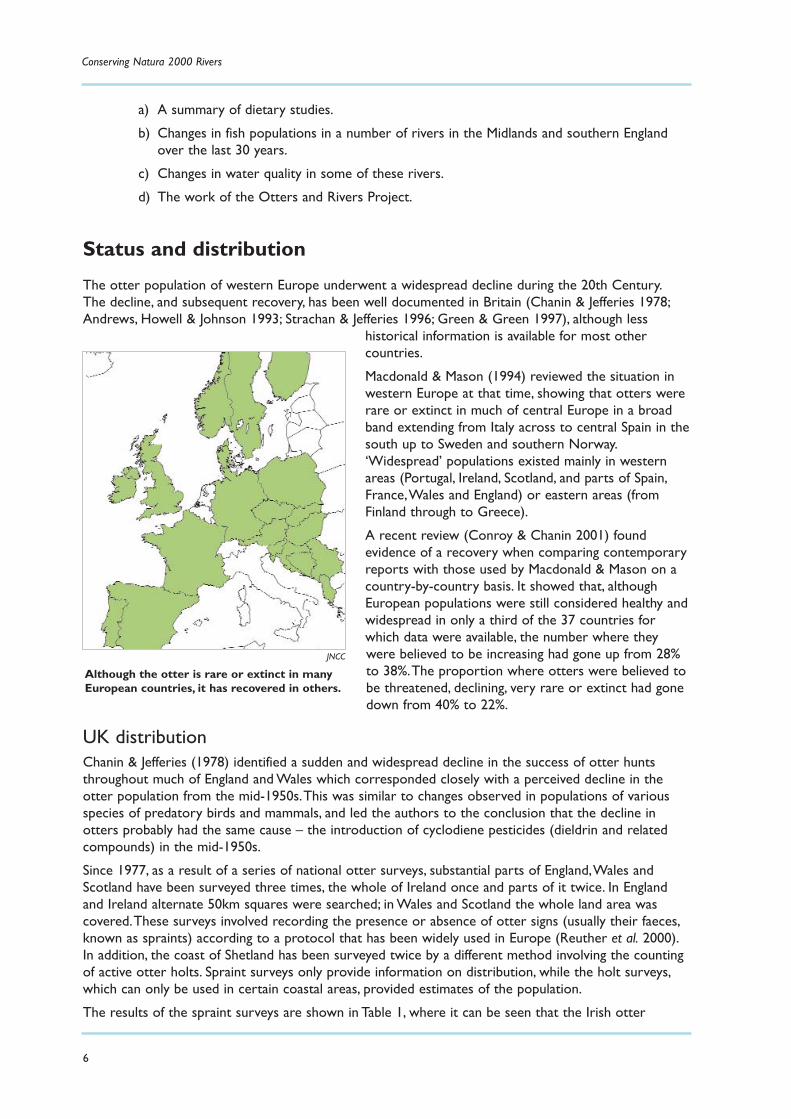
The otter population of western Europe underwent a widespread decline during the 20th Century.The decline, and subsequent recovery, has been well documented in Britain (Chanin & Jefferies 1978;Andrews, Howell & Johnson 1993; Strachan & Jefferies 1996; Green & Green 1997), although less
historical information is available for most othercountries.
Macdonald & Mason (1994) reviewed the situation inwestern Europe at that time, showing that otters wererare or extinct in much of central Europe in a broadband extending from Italy across to central Spain in thesouth up to Sweden and southern Norway.‘Widespread’ populations existed mainly in westernareas (Portugal, Ireland, Scotland, and parts of Spain,France,Wales and England) or eastern areas (fromFinland through to Greece).
A recent review (Conroy & Chanin 2001) foundevidence of a recovery when comparing contemporaryreports with those used by Macdonald & Mason on acountry-by-country basis. It showed that, althoughEuropean populations were still considered healthy andwidespread in only a third of the 37 countries forwhich data were available, the number where theywere believed to be increasing had gone up from 28%to 38%.The proportion where otters were believed tobe threatened, declining, very rare or extinct had gonedown from 40% to 22%.
UK distributionChanin & Jefferies (1978) identified a sudden and widespread decline in the success of otter huntsthroughout much of England and Wales which corresponded closely with a perceived decline in theotter population from the mid-1950s.This was similar to changes observed in populations of variousspecies of predatory birds and mammals, and led the authors to the conclusion that the decline inotters probably had the same cause – the introduction of cyclodiene pesticides (dieldrin and relatedcompounds) in the mid-1950s.
Since 1977, as a result of a series of national otter surveys, substantial parts of England,Wales andScotland have been surveyed three times, the whole of Ireland once and parts of it twice. In Englandand Ireland alternate 50km squares were searched; in Wales and Scotland the whole land area wascovered.These surveys involved recording the presence or absence of otter signs (usually their faeces,known as spraints) according to a protocol that has been widely used in Europe (Reuther et al. 2000).In addition, the coast of Shetland has been surveyed twice by a different method involving the countingof active otter holts. Spraint surveys only provide information on distribution, while the holt surveys,which can only be used in certain coastal areas, provided estimates of the population.
The results of the spraint surveys are shown in Table 1, where it can be seen that the Irish otter
Conserving Natura 2000 Rivers
6
JNCC
Although the otter is rare or extinct in manyEuropean countries, it has recovered in others.
population was widespread and abundant in the early 1980s, when in Britain the distribution was muchmore patchy.
In the first survey of Scotland, otters were widespread throughout the islands, northern Strathclyde,the Highland Region north of the Great Glen fault, and Dumfries and Galloway. Here, for the mostpart, signs of otters were found at 90% or more of the sites searched. However, signs were much moredifficult to find in the Central Region between the firths of Clyde and Forth, or in the Borders Region(under 25% of sites), while other areas were intermediate. By the time of the third survey, there hadbeen a substantial increase in the number of positive sites – in most regions it exceeded 90% and wasonly below 80% in the Fife, Lothian and Borders regions (59%, 63% and 28%, respectively).
The first survey of Wales revealed a more patchy distribution, with otters present in most countiesnorth or west of Glamorgan and Gwent, though at a much lower levels than in Scotland. Rather lownumbers of positive sites were found in the Cambrian mountains and in Clwyd. By the third survey, thetotal number of positive sites had increased by more than two and a half times, and otters werepresent in every county and hydrometric area except Anglesey, where the population appeared to havebecome extinct between the first and second surveys. Otters have returned to Anglesey since the thirdsurvey (Ruth Warren, pers. comm.).The highest frequency of signs in this survey were in the Tywi(70%), Severn (74%), Cleddau (78%) and Wye (82%) catchments.
The first survey in England revealed a very low proportion of sites with signs of otters, which werefound mainly in peripheral areas: the Southwest, the Welsh borders, north Norfolk and, more sparsely,in northern England. At this time, otters appeared to be close to extinction throughout much ofcentral England. By the time of the third survey the number of positive sites had quadrupled, and in twoareas (Welsh borders and the Southwest) more than 60% of sites were positive.The greatest increasebetween the first and third surveys was in western parts of England, but signs of otters were recordedin all regions, including Kent, and on all major catchments, including the Thames,Trent and Great Ouse.
The increase between the first and third surveys was not universal, and in East Anglia the number ofpositive sites decreased from 20 in the first survey to eight in the second (out of a total of 623).Theincrease from this to 52 sites by the time of the third survey is believed to be due, at least in part, tothe reintroduction of otters by the Otter Trust.
A fourth survey of England was carried out between 2000 and 2002. The number of positives sites hadincreased to 34% over the whole country (Crawford 2003) and increases were recorded in allEnvironment Agency regions. Otters were recorded in 73% of the 105 Local Environment Agency Plan(LEAP) areas that correspond to individual river catchments (sub-catchments in the case of very largerivers or groups of catchments for very small ones). In some regions the increase in positive sites wasless than expected. In the Severn Trent Region, re-colonisation of the lower reaches of the Severn andof the Warwickshire Avon was slow in contrast with the Trent catchment where the number of positivesites had tripled from 6% to 24%. In the Northwest, a modest increase from 29% to 34% included asubstantial increase in the north on the Eden catchment (from 43% to 71%), as well as a slight increasein central areas (west Cumbria) and little change in the southern half of the region.
The fourth Welsh survey and a survey of Northern Ireland have also been completed and the resultswill be published later in 2003. The fourth Scottish survey will be completed by the end of 2004 and
Ecology of the European Otter
7
Table 1. Results of National Surveys expressed as percentage of sites where signs were found.
No. Sites1 1977-812 1984-6 1991-4 2000-2 Ireland 2373 92% Scotland 2650 57% 65% 83% Wales 1102 20% 38% 53% England 2940 6% 10% 24% 34%
Data from Chapman & Chapman (1982); Green & Green (1997);Andrews, Howell & Johnson (1993); Strachan & Jefferies(1996), Crawford (2003). 1Data selected only from sites which were surveyed in all three surveys. 2Dates within which allsurveys were completed. Irish survey was carried out in 1980–81, others in 1977–1979.
Conserving Natura 2000 Rivers
8
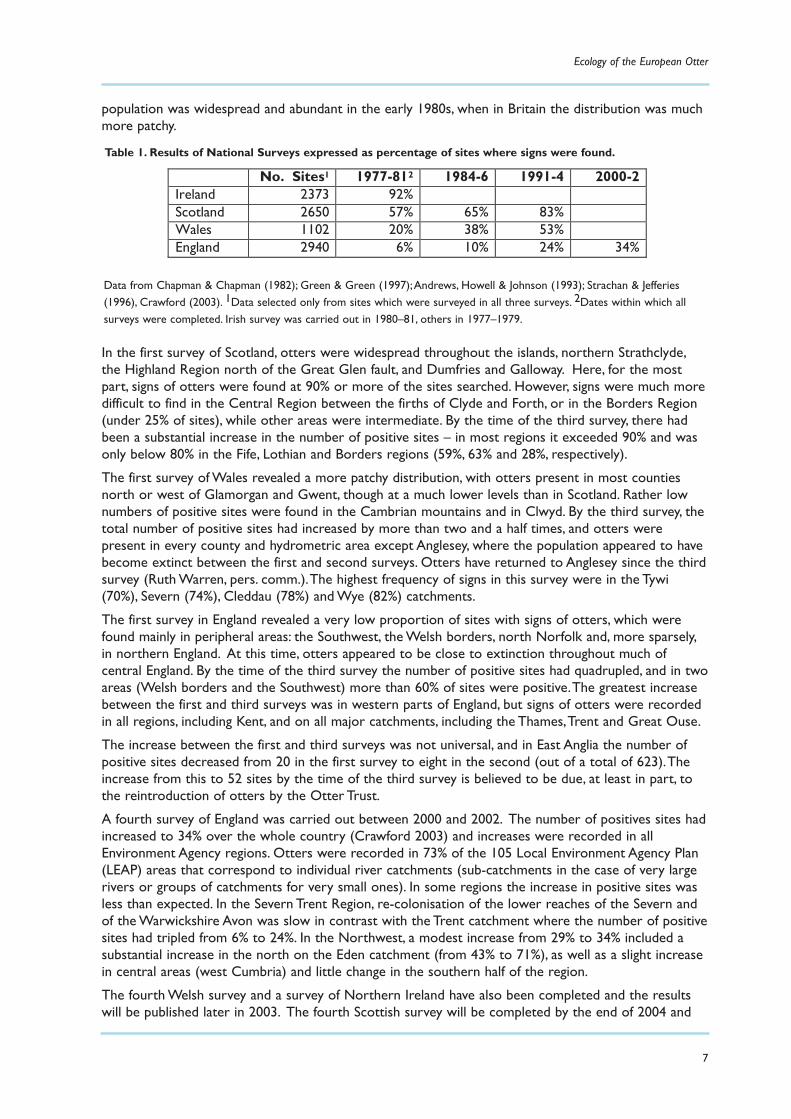
Figure 1. Distribution of otters in Britain based on the National Surveys of 1991-1994 (1980-81 for Ireland).English distribution based on Water Authority areas (with Severn and Trent catchments divided);Welsh distribution based onhydrometric areas; Scottish distribution based on administrative regions; Ireland by 100km square. Results for rivers on theborder between England and Wales are combined for the whole catchment (Dee, Severn and Wye). Intensity of shading isdirectly proportional to percentage of sites with signs of otters.
9
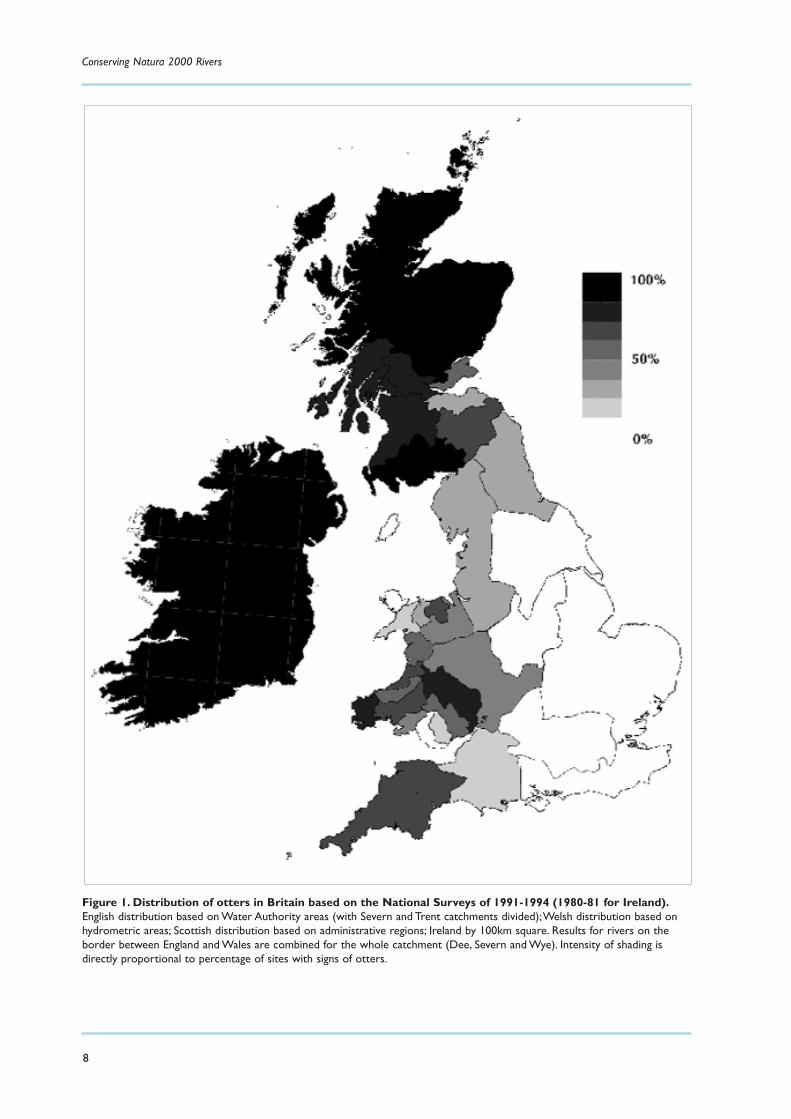
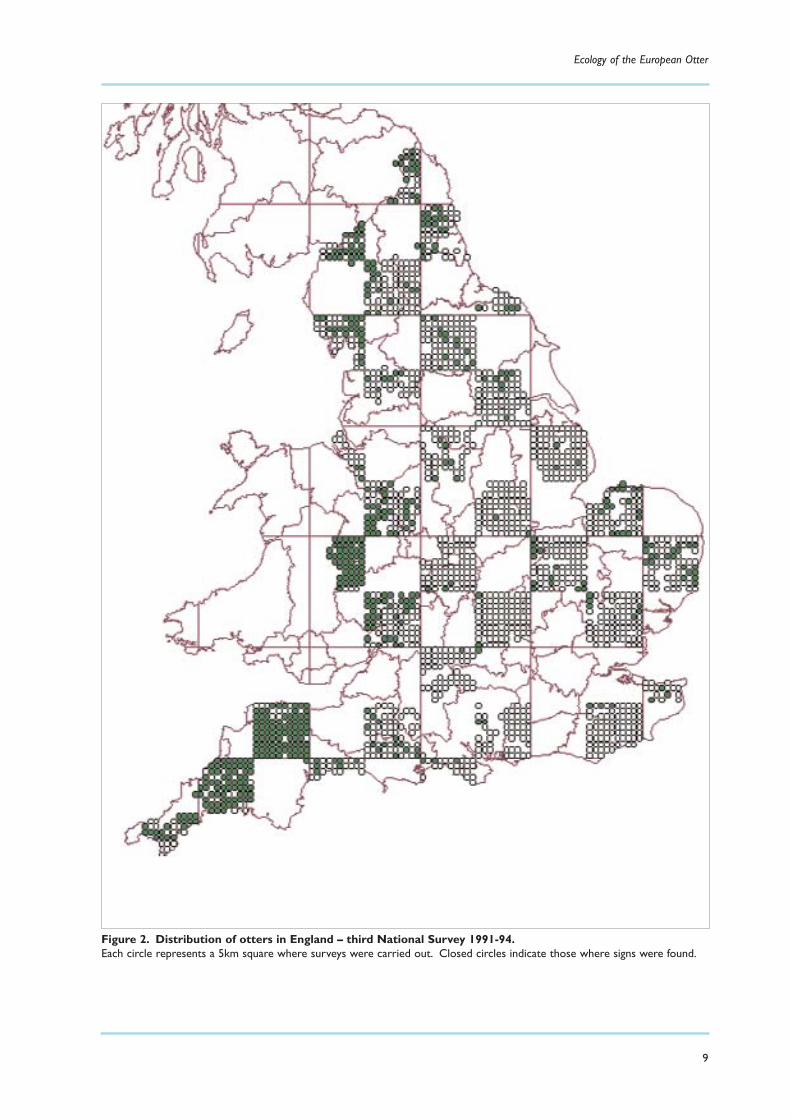
Figure 2. Distribution of otters in England – third National Survey 1991-94.Each circle represents a 5km square where surveys were carried out. Closed circles indicate those where signs were found.
Ecology of the European Otter
the results published during 2005. Figure 1 summarises the status of otters in Britain at the time of thethird national survey, while Figure 2 shows the distribution in England at that time in more detail.
In the absence of recent data for Scotland and Wales, it is not possible to provide a comparablecontemporary map, but shaded maps for all four English surveys are provided in Crawford (2003)which also includes a 'dot-map' at 10 km scale, together with detailed maps for each region.
Predicting the futureStrachan & Jefferies (1996) used data from the first three national surveys to calculate the rate ofrecovery for each region of England and for Wales, and predicted that by the time of the fourth survey43% of sites in England and 70% of sites in Wales would have signs of otters.
The results for England proved to be lower than Strachan and Jeffries' predictions (36% for comparablesites). On a regional basis, predictions for Northumbria and the Wessex and Thames regions were closeto the actual result, while the results for Severn-Trent,Anglia and the Southwest were higher thanpredicted (by approximately 33%, 25% and 14% respectively). In the North West and Yorkshire regionsthe results were approximately 30% lower than predicted.
Crawford (2003) did not discuss the discrepancy between predicted and actual results in Yorkshire butdid comment on a perceived slowing down in the rate of recolonisation in the North West Region,pointing out that the recovery appeared to be proceeding better in the north than in the south of theregion.
Summary of population changes in the UKThe otter population of the UK underwent a dramatic decline from the mid-1950s until at least themid-1970s, when systematic surveys first began.The greatest declines were in England and Wales andalthough otters were generally widespread in Scotland in the 1970s, very low populations wererecorded in lowland areas in south-central Scotland.
Since the first surveys the population has increased in most areas, but there have been some regionalvariations from this.Thus, otters appear to have declined to extinction in Anglesey by the time of thesecond survey (though they have returned since the third survey). In East Anglia the populationcontinued to decline into the 1980s, though it has begun to recover since, probably as a result of theintroduction of captive-bred animals.
The most recent survey shows a continuation of the recovery throughout England, although it appearsto be slower than expected in some northern areas.
Life history
BirthsBirths in Britain have been recorded throughout the year and breeding has been considered to beaseasonal, at least on the mainland (Chanin 1991). However in a recent study in Scotland found thatotters from the mainland tended to have their young in the winter (November to January) and anumber of studies elsewhere in Europe have demonstrated that seasonal breeding can occur. The lackof evidence for it may in some places reflect insufficient data, or the pooling of data from large areas.
In many of these areas it has been possible to demonstrate seasonal changes in the availability of prey(Table 2), and that births occur at such a time as to maximise the abundance of prey when females arelactating (Beja 1996a; Kruuk 1995; Pikulik & Sidorovich 1996; Heggberget & Christensen 1994).
The evidence for a lack of seasonal breeding in mainland UK comes from data gathered by Harris(1968), which include a substantial dataset from Stephens (1957).This comprises 134 instances wherethe age of cubs was estimated by otter hunters or naturalists and the date of birth calculated.To thisHarris has added a further 30 records from the literature. Curiously, while Stephens’ data showapproximately equal numbers of young born in each month, Harris’ additional data are highly biasedtowards the colder months – 25 births estimated for the period October to March, five from April to
Conserving Natura 2000 Rivers
10

September. Whether this represents a biologically significant difference is difficult to determine. It isclear that many (perhaps most) of Stephens’ records were based on sightings in the hunting field wherethe animals may not have been observed closely, while a high proportion of Harris’ came from animalsthat had been handled and, in some cases, weighed.
A very limited set of data from southwest England, from which more accurate estimates of birth couldbe determined at autopsy, yielded information from six breeding females, each of which probably gavebirth between September and February (Simpson 1998). Unfortunately, Bradshaw (1999), whilereporting that 16 of the females in her sample were pregnant or lactating, provides no information ondates.
On the evidence currently available it would appear that while births have been recorded throughoutthe year in England and Wales, the possibility of seasonality should not yet be excluded.
Litter size and frequencyKruuk, Conroy & Moorhouse (1987) have suggested that litters of otters recorded in fresh water arelarger than those on the coast. Mean litter size ranged between 2.3 and 2.8 for four inland studies
Ecology of the European Otter
11
Table 2. Records of seasonal breeding.
Area Habitat Births Authors Sweden Inland Late winter Erlinge 1967a Portugal Inland January–March Beja 1996a Belarus Inland April and May Sidorovich 1991 Shetland, UK Coastal May and June Kruuk 1995 Denmark Both Summer Elmeros & Madsen 1999 Norway Coastal Summer and autumn Heggberget & Christensen 1994 Portugal Coastal October–December Beja 1996a Scotland Inland Winter Conroy & Bacon in prep.
Geoff Liles
An aerial view of a woodland and scrub otter breeding site in west Wales.The woodland and scrub is totallyundisturbed, and largely impenetrable because of dense brambles.

(Mason & Macdonald 1986)and between 1.55 and 1.95for three coastal studies(Kruuk et al. 1987).
These discrepancies may bepartly explained by theways in which observationswere obtained. Heggberget& Christensen (1994)found that litter sizes ofcoastal otters at birthaveraged 2.5 (based onautopsies), whereas littersthat were observed whenthe young had becomemobile, averaged 2.0 cubs.If, as seems likely, thecoastal data referred toabove are based oncounting cubs and the
inland observations on data from corpses, part of the difference may simply reflect mortality in theearly stages of the otters’ lives.
Other places where litter sizes have been estimated for the same population at different stages includeBelarus (Sidorovich 1991) and Upper Lusatia in Germany (Ansorge, Schipke & Zinke 1997). Sidorovichrecorded mean litter sizes of 2.7 from embryos (n=7), 2.6 at one month old (n=42) and 2.1 afterleaving the den at about three months (n=133). Ansorge et al. recorded an average of 2.7 for counts ofembryos and placental scars (n=14) and 2.1 for observations of cubs (n=48).
Kruuk (1995) reported annual births for some females but that not all adult females produced cubseach year. It was not possible to distinguish between females that failed to conceive and those that losta litter of cubs at a very young age, before emergence from the natal den.
Cub development and dispersalWatt (1993) studied otters living on the coast ofMull and recorded the development of huntingabilities in cubs. He found that as they grew, not onlydid their reliance on their mother for fooddecrease, but their hunting ability increased and theproportion of the diet formed by unprofitable crabsdeclined. By 13 months old, young otters wereentirely self-sufficient at foraging and becameindependent from their mothers but continued tocatch a higher proportion of crabs than experiencedadults. Watt concluded that this long period ofdependence in his study area (about three monthsmore than for otters in Shetland) reflected a lowerabundance of prey.
In Sweden, Erlinge (1968) found that the distancescovered by family groups of otters increased as theyoung developed, until by the age of one year, groupstravelled up to 7 km in one night. He found that theyoung otters dispersed when they were about oneyear old.
Conserving Natura 2000 Rivers
12
Geoff Liles
Orphaned otter cub being hand-raised. Thelitters of freshwater otters tend to be larger thanthose of otters that live in coastal areas.
A greater tussock sedge (Carex paniculata) natal den site within woodland ona small stream in Pembrokeshire,Wales.
Geoff Liles
Jenkins (1980) followed the movements of one young male otter by injecting it with radioactive zinc (asZn65Cl) and testing spraints with a Geiger counter. Up to the age of around eight months the animal’sactivities were confined to the loch on which it was raised, together with the inlet streams. It thenbegan to exploit the nearby river Dee and extended its range on this river over the succeedingmonths.At the age of one year, it had been recorded along 68 km of the river, travelling distances ofmore than 20 km in one night.
A similar pattern of range expansion was reported for the North American river otter (L. canadensis)by Melquist & Hornocker (1983) who radio-tracked several young animals, some of which dispersed at12–13 months of age. One young male travelled 104 km in 30 days and established a home range 32km from its natal area. One female travelled 195 km in 50 days but then settled into a range adjacentto its mother’s and partly overlapping it.Two other males had not dispersed from the natal range whencontact was lost at 16 and 25 months old.
Population parameters
Reliable information on the demographic characteristics of otter populations is only available from thestudy of dead otters. Most of these have died as a result of human activity (road kills and thosedrowned in fishing apparatus), and in most studies relatively few died a ‘natural’ death. Most authorscombine these data, although the two types of sample represent different parts of the population (seebelow).
The age of otters is usually determined from growth lines in teeth supplemented by cranialdevelopment in animals under two years of age (Heggberget, 1984).
Life expectancyGorman et al. (1998) analysed data from 391 otters from three areas in the UK (England and Wales,
Ecology of the European Otter
13
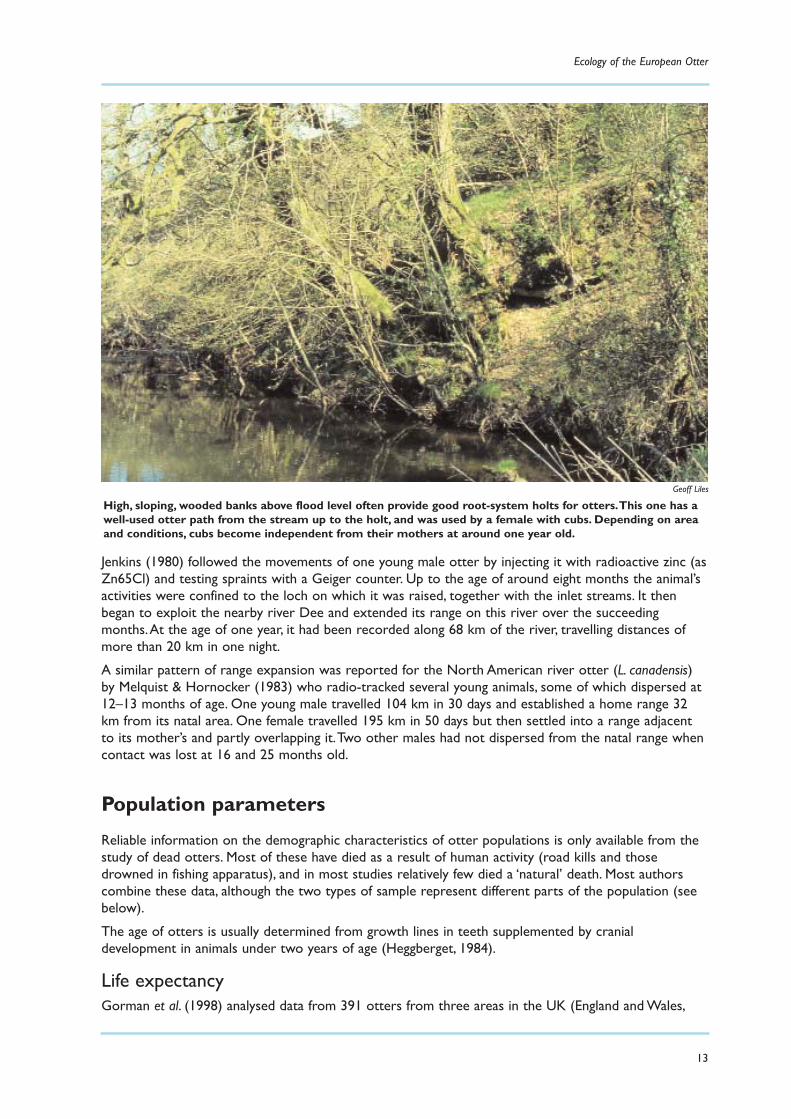
High, sloping, wooded banks above flood level often provide good root-system holts for otters.This one has awell-used otter path from the stream up to the holt, and was used by a female with cubs. Depending on areaand conditions, cubs become independent from their mothers at around one year old.
Geoff Liles
n=97; mainland Scotland, n=148; Shetland; n=146), separating the samples into violent deaths andnatural or non-violent deaths. Life tables were constructed from each of these, taking the ‘violent death’sample as an indicator of the age structure of the population and non-violent deaths as an indicator ofthe normal age at death. Estimates of the numbers of otters born were based on age-specific fecundityrates of animals in the sample.
No difference could be detected between males and females so the data were combined.There was,however, a significant difference in the median age at death between otters from Shetland (four years)and those from England and Wales (three years).The median age for mainland Scottish otters was four– not significantly different from either of the other samples.The maximum age at death in this samplewas 16 years. Age-specific mortality for Scottish otters fluctuated between 0.1 and 0.4 up to the age ofsix, and then increased rapidly. Otters from England and Wales showed a higher mortality than Scotlandin all age-classes greater than two, and mortality was higher than 0.5 at all ages greater than three. Asmaller sample of otters from southwest England studied by Simpson (1998) also suggested a low lifeexpectancy for otters in this region. Age was determined for 28 otters submitted between 1990 and1993, and none was more than four years old.
Elsewhere in Europe, substantial samples of otters have been aged from three areas: the IberianPeninsula (Ruiz-Olmo, Delibes & Zapata 1998; n=106), Norway (Heggberget, 1991; n=410) and easternGermany (Hauer,Ansorge & Zinke 2000; n=1027).These authors all estimated age from growth lines inteeth, and their results are broadly similar, with median ages at death of three to four years, and themaximum age ranging between 12 and 16 years.
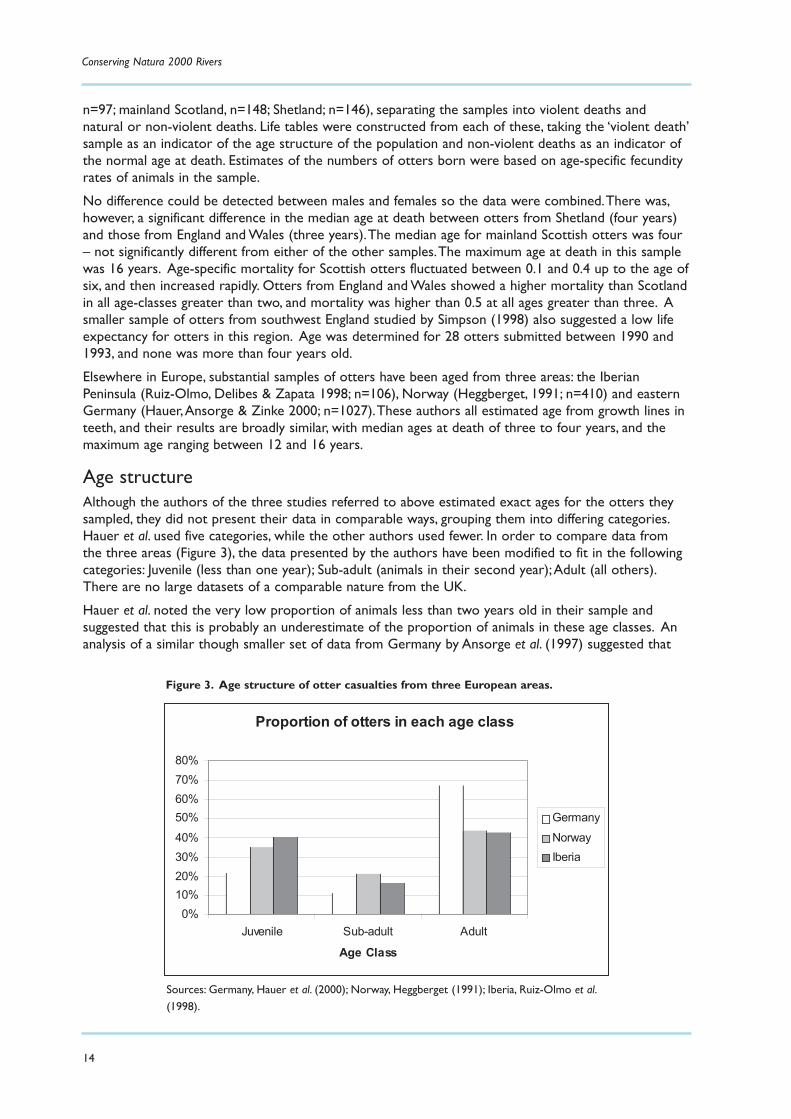
Age structureAlthough the authors of the three studies referred to above estimated exact ages for the otters theysampled, they did not present their data in comparable ways, grouping them into differing categories.Hauer et al. used five categories, while the other authors used fewer. In order to compare data fromthe three areas (Figure 3), the data presented by the authors have been modified to fit in the followingcategories: Juvenile (less than one year); Sub-adult (animals in their second year);Adult (all others).There are no large datasets of a comparable nature from the UK.
Hauer et al. noted the very low proportion of animals less than two years old in their sample andsuggested that this is probably an underestimate of the proportion of animals in these age classes. Ananalysis of a similar though smaller set of data from Germany by Ansorge et al. (1997) suggested that
Conserving Natura 2000 Rivers
14
Proportion of otters in each age class
0%10%20%30%40%50%60%70%80%
Juvenile Sub-adult Adult
Age Class
GermanyNorwayIberia
Figure 3. Age structure of otter casualties from three European areas.
Sources: Germany, Hauer et al. (2000); Norway, Heggberget (1991); Iberia, Ruiz-Olmo et al.(1998).
the proportion of juveniles in this sample was underestimated by about 50%.
The only substantial set of data for England and Wales is provided by Bradshaw (1999) who estimatedage on the basis of the animals’ weight and reproductive condition. Bradshaw used different age-classesto those illustrated in Figure 3, and her assessment of juveniles was based on growth curves for twocaptive-reared otter cubs and should therefore be treated with some caution. Otters calculated to beunder five months (males < 3.0 kg; females < 2.1 kg) were described as juveniles. Females larger thanthis were assumed to be sub-adults (6–18 months) if they showed no signs of reproduction (immatureuterus and absence of nipples). Adult males were discriminated by possessing a baculum (penis bone)length >60mm. Only 3% of this sample consisted of juveniles, 23% were classified as sub-adult and 74%as adult.
Sex ratioThe proportion of male otters in the samples studied is normally in the range 50–60%. Bradshaw’sstudy is at the extreme, with 61% of the sample being male otters. In her case the disparity wasgreatest in adult otters (65% male), whereas Hauer et al. found a greater disparity in the juvenile andsub-adult age classes (66% and 71% male, respectively).
Male-biased sex ratios in mortality samples from mustelid populations are not unusual and arefrequently ascribed to differences in behaviours such as dispersal, territory size and distances travelled.
Population densityThere are considerable difficulties in determining the density of otters. In part this relates to thedifficulties of monitoring such rare and elusive animals, but even if the number is accurately known,there is no obvious solution to the problem of which spatial units to use. Otter territory sizes havemost frequently been measured in terms of length of waterway, but this is not particularly useful inplaces where part or all of the range consists of lakes or ponds, or when comparing very largewaterways with small ones.
This problem is clearly exemplified in data recorded by Durbin (1996) who found that in the case of amale and female otter with overlapping territories, the male had a home range encompassing 50 km ofriver, compared to 24 km for the female. However, when he calculated the area of water within eachterritory, the female otter had a ‘larger’ range than the male (34 ha compared to 29 ha).
A small number of values for population density have been calculated in Britain, in most cases on thebasis of very small sample sizes. Harris et al. (1995) calculated otter densities in East Anglia andPerthshire from estimates of land area using data supplied by DJ Jefferies.They reported that an area of75 km2 in East Anglia contained three otters, while in Perthshire, 57 km2 contained four otters.Thesevalues correspond to densities of one otter per 25 km2 and one per 14 km2, respectively. From this,together with average values for the lengths of waterway in England,Wales and Scotland respectively,Harris et al. (1995) calculated densities of one adult otter per 24 km of water in Scotland and oneindividual per 27 km in England and Wales. Clearly, the density of otters per unit of land area will varywith the proportion of it that is open water, and these average values conceal considerable localvariation.
Kruuk et al. (1993) calculated otter density as ranging from 2–50 ha of water per otter, which wasequivalent to one individual every 3–50 km of stream (median value of one otter per 15 km of stream).
A study of otters using DNA fingerprinting (Coxon et al. 1999) revealed minimum numbers of otterspresent on the Tone and Itchen catchments during one year to be 23 and 13 otters, respectively. Thearea of the Itchen catchment is 473 km2, while the Tone is approximately 400 km2, corresponding toone otter per 36 km2 and one individual per 17 km2 respectively. These data include sub-adult, andpossibly juvenile animals, which were excluded by Harris, and also transient as well as resident animals.They are also minimum estimates, since it is likely that not every otter present in the catchment duringthe year of the study was recorded.
These data not only demonstrate the difficulty of obtaining values for otter densities, but also that they
Ecology of the European Otter
15
can vary widely.The data from Kruuk et al. in particular varies by a factor of 17 from the lowest to thehighest. It is evident that there is no basis at the moment for determining a ‘normal or ‘desirable’density of otters to set as a target.
One indication that the otter population may have reached a high level comes from observations bySimpson (1998) who found that 16% of otters received for post mortem analysis in southwest Englandsuffered from bite wounds inflicted by other otters.These are found in both sexes, though morefrequently in males. In this case, they had led to severe injury, infection and in some cases, probably,death.The pattern of wounding – lesions around the face and head or around the perineal area –suggested a stylised form of fighting, which suggests that this is the result of territorial behaviour, andthat it was exacerbated by high densities of animals in the area. Although such fighting has beenreported elsewhere (e.g. Erlinge 1968), it has not previously been recorded at this high a frequencyduring post mortems. Bradshaw (2001) has also observed wounds in the groins of male otters, includingdamaged bacula and one case of castration.
Genetic diversityStudies of mitochondrial DNA in 30 wild otters from Denmark (Mucci et al. 1999) and 76 fromGermany (Cassens et al. 2000) showed low levels of variability. Smaller samples from outside their owncountries were analysed by these authors, and they had similarly low levels of variability with little orno basis for discriminating between populations.The authors consider that this may reflect theinfluence of a genetic bottleneck – but in the last Ice Age rather than in recent times, and possiblycombined either with stabilising selection or an unusually low level of mutation.
By contrast, Dallas & Piertney (1998) investigating microsatellite polymorphism in the chromosomalDNA of 32 otters from Britain and Germany, found that variability at 13 loci was within the normalrange for mammalian species. Using 10 of these loci, Dallas et al. (1999) investigated genetic diversity inotters from Scotland, comparing otters on the mainland with those from islands at different distancesfrom the mainland.The results revealed a predictable decline in diversity from mainland populations tothe more isolated island populations, with particularly low levels in the Shetland Islands.
Mainland otters were categorised as from northern or southern parts of the country and analysedseparately since the southern population had undergone a significant decline and was believed to havebeen separated from the northern one for a period corresponding to several otter generations.Despite this, the loss of genetic diversity was small and the authors concluded that recovery wouldsoon occur, now that the two populations are again in contact with one another.
Coxon et al. (1999) used the technique pioneered by Dallas and his colleagues in an attempt to carryout ‘genetic fingerprinting’ of DNA extracted from otter spraint from three rivers in south westEngland and one in southern England.They also analysed the tissues of 153 carcasses found in theregion.This revealed a substantially lower level of genetic diversity in southern otters compared tothose in Scotland, consistent with a significant bottleneck corresponding to the decline in the 20thCentury.
Among the dead otters sampled (almost entirely from the Southwest) the number of alleles per locusfor nine microsatellites ranged from four to six (mean 5.0) compared to 6–10 (mean 6.7) for Dallas &Piertney’s original sample. The smaller number of individuals sampled by spraint analysis from the riversyielded even lower diversity.Thus, for six loci on three rivers in Devon and Somerset, the number ofalleles per locus ranged between two and five (mean 3.7, n=44). On the river Itchen in Hampshirethere was a maximum of three alleles per locus (mean 2.3, n=13) and one was monomorphic.
The isolated Hampshire otters are thought to be derived from a founder population of only threeanimals released on to the river in 1993, and illustrate one consequence of small-scale reintroductions.However, the recolonisation of neighbouring catchments by natural spread is likely, in due course, tolead to this population being linked to a larger gene pool.
Conserving Natura 2000 Rivers
16
Habitat requirements
Nature of waterwayOtters have been recorded as exploiting virtually all types of water and waterway in the UK. Althoughpopulations in England and Wales are confined mainly to fresh water, they readily exploit suitablecoastal habitats in Scotland as well as elsewhere, such as Portugal (Beja 1995). The importance ofestuaries to otters is more difficult to ascertain. In the third English survey, 25 estuarine sites weresurveyed in Devon and Cornwall (where otters are widespread) and 40% of these had signs of otters,compared to 68% of non-estuarine sites in the area.
Otters have been recorded on still waters (canals, lakes, ponds and reservoirs) as well as rivers andstreams of all sizes. Evidence from radiotracking (Jefferies et al. 1986) and from studies of thedistribution of road casualties (Chanin 2001) shows that otters will use tiny streams and ditchesincluding dry watercourses as regular routes. Jefferies (1988) reports one otter crossing a watershedby travelling 1.8 km overland in Norfolk.
Riparian habitatHabitat destruction was first identified as a potential threat to otter populations by the Joint OtterGroup (O’Connor et al. 1977), largely on the basis that there had been considerable changes to riparianhabitats in the previous decade or so, which roughly coincided with the period in which otterpopulations had declined. Chanin & Jefferies (1978), while concluding that toxic chemicals had beenresponsible for the initial decline of the otter, suggested that one reason for the apparent slowrecovery of the otter might be degradation of its habitat in subsequent years.
Early attempts to assess otter habitat requirements involved seeking correlations between thedistribution of spraints and a range of habitat features, such as the presence or absence of trees andwoodland, cover, potential den sites, human activities and various physical attributes of the waterways(Jenkins & Burrows 1980; Macdonald & Mason 1983; Bas, Jenkins & Rothery 1984). Macdonald &Mason’s study was particularly influential, being based on surveys at over 50 sites in Wales and theWelsh borders, and using multivariate analysis of the distribution of otter signs plus 15 habitat variables.They concluded that the presence of ash and sycamore trees was particularly important, together withpotential den sites, the majority of which were found under the roots of these two species as well asrhododendron bushes, oak and elm trees.
Ecology of the European Otter
17
Paul Glendell/English Nature
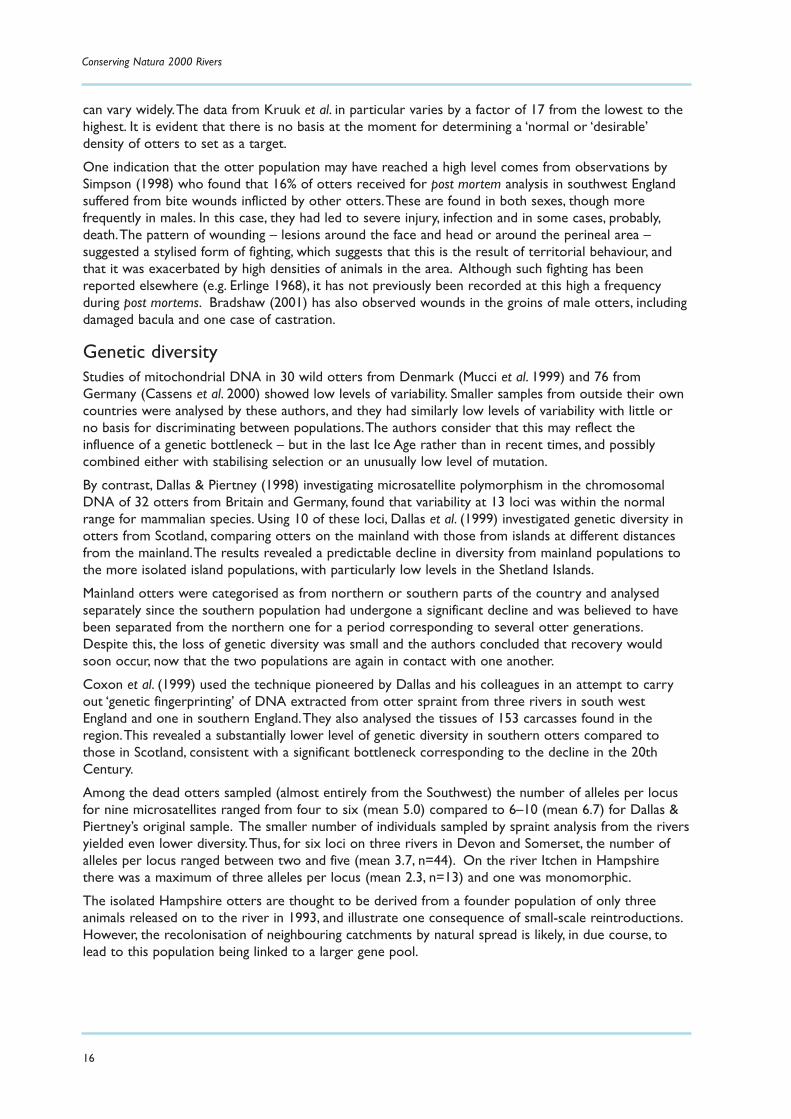
Otters can be found in a variety of wetlands, including estuaries, although fewer individuals have beenrecorded in estuary sites in Britain than in other habitats.
Other studies based on spraints have pointed to the importance of the presence of trees andwoodland or other cover, as well as the impact of human activities, while some have also demonstrateda relationship with food supply (e.g. O’Sullivan 1993; Prenda & Granado-Lorencio 1996;Thom 1997;White et al. in press).
Partly as a result of these studies and the Joint Otter Group Report, and possibly because it seemednatural, there has been a strong tendency for people concerned with otter conservation to put greatemphasis on the importance to otters of bankside vegetation, particularly trees and scrub that mightprovide good cover or potential den sites. However, there is now considerable doubt as to whetherthis has any direct benefit to otters, not least because otters thrive in situations where there are notrees and little cover, such as Shetland.
A major problem with all such studies is in the use ofspraint as an indicator of the preferences of otters. Mostrecent authors are careful to describe their studies interms of predictions of, or correlations with, ottersprainting activity, butthis begs thequestion of what‘sprainting activity’means. Many authorshave used thenumbers or densityof spraints in a waythat suggests itshould correlate withthe ‘activity’ of ottersor perhaps theamount of timeotters spend inparticular places.
On inland watersotter spraints are notdeposited at randomon the waterside butat particular featuresof the riparian
Conserving Natura 2000 Rivers
18
Both photos by Geoff Liles
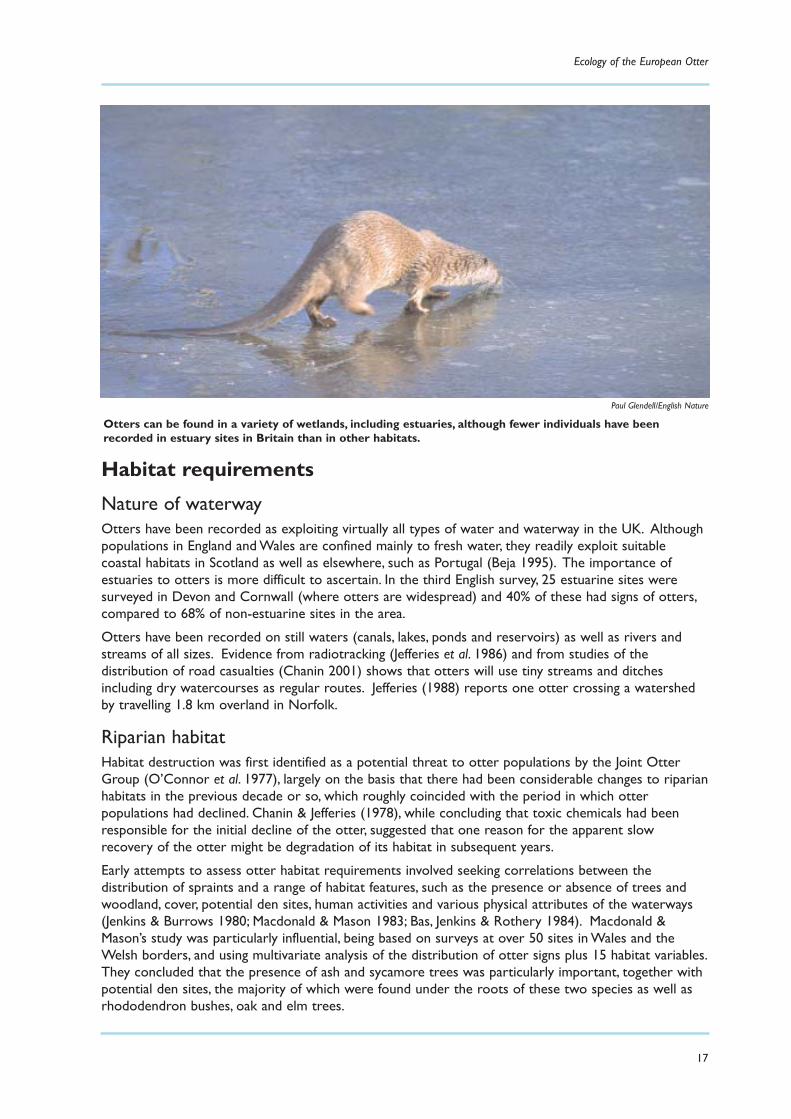
Left: A typical mid-river boulder sprainting site with easy access for otters and spraint deposited on top.Right: Fresh spraint (oily and dark with small fish bones) on a boulder.
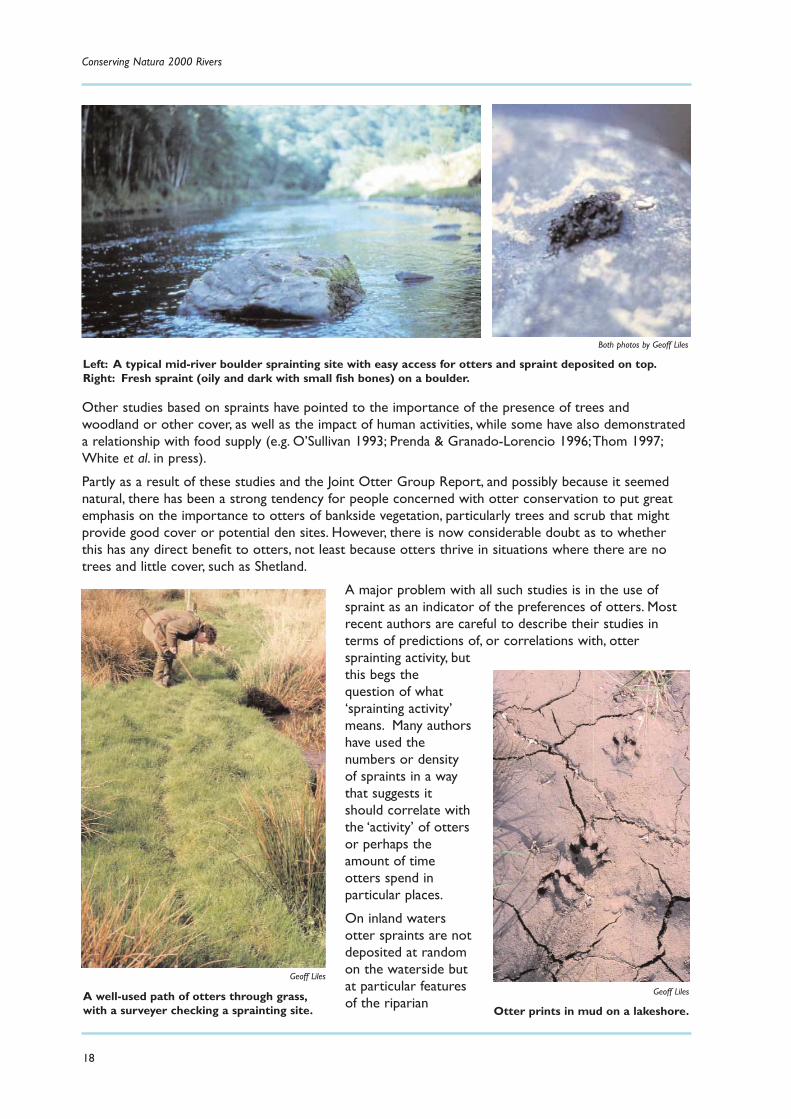
A well-used path of otters through grass,with a surveyer checking a sprainting site.
Geoff Liles
Geoff Liles
Otter prints in mud on a lakeshore.
landscape such as the bases of large trees, boulders, bridges, confluences of streams, and so on. Spraintnumbers are known to vary seasonally (e.g. Conroy & French 1985) and Thom (1997) found differencesin the spatial distribution of signs between seasons as well as differences in numbers. In an unpublishedstudy of a river in Devon with a well-established otter population, Hilary Marshall (pers. comm.) foundconsiderable variation in spraint numbers between years. During the summer months when rainfall islow (June, July,August), the mean number of spraints found per month over a five-year period was 32.6,with a maximum of 60.0 and minimum of 4.7. Averaged over whole years there was still a five-folddifference between the year with the least spraints and the one with the most.
Thom (1997) used GIS techniques to investigate the spatial distribution of otter signs in the upper Tynecatchment. Attempts to predict the presence or absence of spraint using logistic regression models atvarious spatial scales did not lead to consistent results, but Thom concluded that models includingaltitude, the abundance of minnows and the presence of heavy metals in eel tissues were the mostimportant determinants of spraint distribution.
Durbin (1998) obtained a much more precise measurement of habitat use from a study based ontracking five otters for periods of between three months and a year on the rivers Dee and Don inScotland. He recorded more than 800 hours of otter activity within a three-year period. Durbin usedthe total amount of active time spent in a particular habitat as an indicator of use, and compared thiswith habitat availability as an index of preference. Separate indices were used for habitat length andhabitat area. Although he found that all otters spent more of their time in relatively wide sections ofriver with large numbers of boulders and many trees, when he analysed his data on the basis of area,there was no preference for wide streams or trees, and most otters spent a disproportionate amountof their time in narrow, gravelly streams. Durbin found no evidence to suggest that otters activelyavoided agricultural areas or areas of human activity, either when foraging or for resting.
In a review of otter habitat use and conservation, Kruuk et al. (1998) pointed out the difficulty ofinferring ‘habitat requirements’ from studies of ‘habitat preference’. Individual (or species) preferencesfor particular habitats do not necessarily have any significance in terms of survival. Using data collectedby Durbin (1998) together with information from other radio-tracking studies they had undertaken,they concluded that the most significant determinant of otter usage of freshwater habitats wasabundance of prey. Reedbeds and islands were also found to be important as they were frequently usedas rest sites, while marshy areas were valuable as foraging areas for frogs.They found no evidence thatthe presence of trees, woodland or other forms of bankside cover influenced otter activity, andsuggested that earlier emphasis on the importance of these may have been biased by patterns of ottersprainting activity.They also pointed out that otters thrive in areas where there is very little cover(such as Shetland).
Potential benefits of trees and woodlandAlthough it is now clear that otters do not ‘need’ trees or actively seek out wooded areas, there are anumber of indirect benefits in allowing or encouraging tree and shrub growth beside waterways.Mason & Macdonald (1982) demonstrated that such riparian vegetation can significantly add to theavailability of invertebrate prey for fish populations, which, in turn, will be of benefit to otters.
Potential harm Encouraging the growth of trees and shrubs in riparian habitats undoubtedly benefits many organismsother than otters, including many species of invertebrates, fish and birds, but there may also be negativeeffects in some places. For example, water voles require dense growth of herbaceous bankside andemergent vegetation (Strachan 1998), and the promotion of scrub or planting of trees is detrimental tothem. Some species of ground and water beetles of national importance depend on the presence oferoding riverbanks (Bielinski 1993), and it is important that these conditions should not be disturbed inthe mistaken belief that it will benefit otters.
Ecology of the European Otter
19

Dens, resting and breeding sitesNumerous words have been used to describe places where otters sleep, including, ‘den’, ‘holt’, ‘couch’and ‘resting site’. Holt and couch are words coined by hunters and refer respectively to covered anduncovered resting sites. However, the word holt is associated by many with the idea of a hole in theground (usually under the roots of a bankside tree), and many people regard a couch as an uncoverednest-like structure. Kruuk and colleagues describe above-ground resting sites as couches.The terms‘rock holt’ and ‘stick-pile holt’ are self explanatory, but some other structures do not fit easily intothese two categories – bundles of reeds with a den in the centre, for example. A further problem withholts is that of finding them without the aid of a radio-tracked otter.
Many authors have recorded the presence of ‘potential holts’, which consist of tunnels, cavities or othercovered structures that may be used by otters. It is not usually possible to determine how many ofthese are actually used, although spraints may be found beside some of them. Radio-tracking studiesenable actual resting sites to be identified, and it is notable that a high proportion of these consist ofplaces that would not be identified as potential holt sites in a survey (e.g. Green, Green & Jefferies1984). So far, no-one has tried to compare the number of potential sites identified by a survey with thenumber of actual sites revealed by radio-tracking.
In coastal areas such asShetland and the OuterHebrides, otter dens(holts) frequentlyconsist of burrows inpeat (Kruuk 1995).These may besubstantial, conspicuousstructures, somealmost as large as amain badger sett,though without thelarge spoil heapsoutside.Where femaleswith cubs have been inresidence, impressivepiles of spraint mayaccumulate outside theentrance, sometimes upto 0.5 m across and 0.1m high. Coastal holtsare mostly within 100m of the shore andmay also be veryfrequent, with densitiesup to three or four perkm in some areas(Conroy & Kruuk1995).
In freshwater habitats,holts (in the form oftunnels) are lessconspicuous andprobably lessnumerous, thoughresting sites of other
Conserving Natura 2000 Rivers
20
A typical root system holt in a large sycamore on the River Clwyd,Wales.Both photos by Geoff Liles

Ecology of the European Otter
21
Otters will use a varietyof places as resting sites.Top: A cavity behind anold, collapsing wall inPembroke town. Centre:The root plate of a fallentree, with hole leadinginto a cavity, used by aradio-tracked otter.Bottom: Dense bramblescrub on the River Teifiused by radio-trackedotters for a daytimeresting site.
All photos by Geoff Liles
kinds are much more common. Based on his experiences while otter hunting, Coghill (1980)summarised the types of resting site recorded in the upper reaches of the Severn catchment. Heidentified 256 sites, of which 42% were under the roots of trees (90% ash or sycamore). About 20% ofsites were described as ‘lying rough’ in reed or osier beds, young forestry plantations, islands,rhododendron bushes, bracken, hedges, scrub, etc. Most of these were within 10 m of water but somewere up to 50 m away. Stick heaps and rock holts formed 13% and 10% of sites, and various types ofenclosed drain a further 11%.The remaining ‘miscellaneous’ category included badger setts, rabbitburrows, ‘hollow islands’, and a car body being used for bank protection.
Thom (1997) identified 212 potential holt sites in 200 km of the Tyne catchment, of which 58% wereunder trees (with half of these under ash or sycamore). A further third were in rocky banks, stone-filled gabions or caves, and the remainder consisted of piles of debris or holes in the bank.Thompointed out that although the overall density was approximately one holt per km of stream, thedistribution was very clumped, with 30% of 5 km stretches of river having none, and seven 5 kmsections having more than 10 potential holt sites.There is no information on how many of these siteswere used by otters or of the abundance of other potential resting sites.
In a radio-tracking study of otters in Perthshire, Green et al. (1984) found that individual otters usedconsiderable numbers of resting sites and frequently lay up in relatively open areas. One male used 27sites over a period of three months, and two-thirds of these were above ground, ranging from densevegetation or under piles of sticks and branches (flood debris), to depressions in the bank where thevegetation was no more than 0.3 m high.They commented that fewer than 10% of the sites used forresting by otters would have been recognised as such without radiotracking.
Durbin (1993) found similar numbers of resting sites in his study of five otters, with the numberrecorded for individual otters depending on the length of time they were followed. Otters tracked forthe longest periods had 27 and 30 holts corresponding to densities of 1.1 sites per km and 0.36 sites per km for a female and a male otter respectively. Durbin noted that many sites were only used on oneor a few occasions and that otters had smaller numbers of sites that were frequently used.
Conserving Natura 2000 Rivers
22
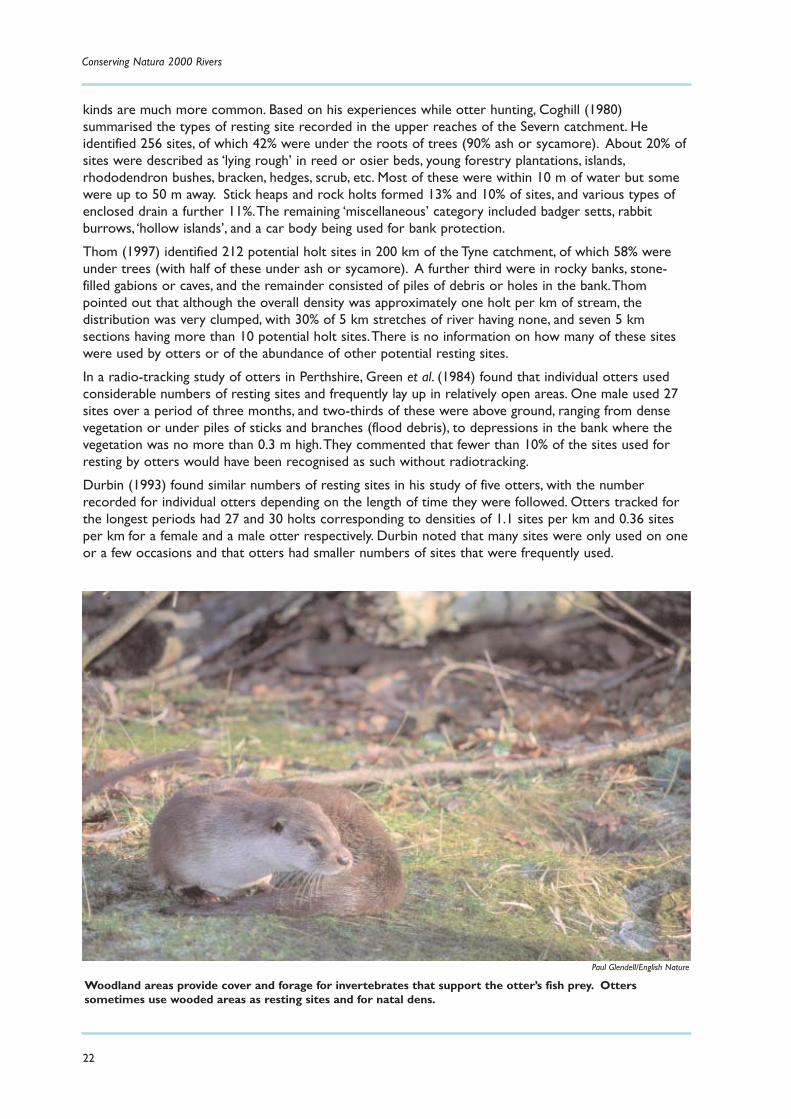
Paul Glendell/English Nature
Woodland areas provide cover and forage for invertebrates that support the otter’s fish prey. Otterssometimes use wooded areas as resting sites and for natal dens.
Kruuk et al. (1998) reported that four otters tracked for a total of 669 days spent 58% of their day-time resting periods in couches (29) and the remainder in holts (9). Most couches were in thick cover,in shrubs (9), reeds (3) or rushes (3).Three were on islands and the remainder under the bank, fallentrees, boulders, etc. Four holts were in artificial embankments formed by boulders, three in field drainsand two in soil. None of these otters used a holt under tree roots while being radio-tracked.
Beja (1996b) located a total of 21 resting sites used by three coastal otters in Portugal and one livingon an estuarine stream. None was underground and all were in thick vegetation such as brambles oramong piles of boulders.
Unpublished observations by Kruuk and colleagues indicate that otters will rest under roads, inindustrial buildings, close to quarries, and at other sites close to high levels of human activity.Theseobservations clearly indicate that otters are very flexible in their use of resting sites and do notnecessarily avoid ‘disturbance’ in terms of noise or proximity to human activity.
A common feature is that many of these resting sites are in places where the risk of direct physicaldisturbance is low (islands, reeds, dense scrub, culverts, piles of rocks, etc.). Although there is noevidence to suggest that the availability of such sites limits otter populations in the UK, some concernhas been expressed that this may be the case in areas where riverbanks are completely devoid ofnatural cover. Where this occurs over very long lengths of river (kilometres rather than hundreds ofmetres) the provision of even small areas of dense scrub at intervals may be beneficial.
The construction of artificial dens may serve a similar purpose and there is evidence that these arereadily used by otters. Cowell et al. (2001) found otter fur in 13 of 19 such ‘log-pile holts’ when theyrebuilt them. On the whole, the benefits of dense scrub to wildlife other than otters are such that thisshould be a preferred option, although there is no reason why both should not be provided.
Natal densStudies on Shetland show that otters are born in natal holts that may not be the same as those usedfor rearing young or by adult otters (Moorhouse 1988).The piles of spraint, which are conspicuous atother holts, are not visible, and natal holts are difficult to find, with simple inconspicuous entrances andlittle evidence of the presence of otters.They are often some distance from the coast. On Lunna Ness,where Moorhouse carried out most of his observations, all were more than 150 m from the shore andone was 500 m from the coast.
Kruuk et al. (1998) have pointed out that three natal holts described by Harper (1981) were occupiedby cubs that were several months old, which had probably not been born there.Thus there are onlytwo descriptions of dens in which otters are known to have given birth.Taylor & Kruuk (1990) describeone they found in a reedbed on a Scottish loch.The den was a few centimetres above water level in asmall clearing in the reeds close to a ditch 0.8 m wide and 0.7 m deep. It consisted of a mass of reeds0.9 m by 0.75 m and about 0.4 m high, with a tunnel passing under it and a small side chamber.Theauthors believed that the reeds may have been bitten off.
Durbin (1996) located a natal holt in a narrow strip of deciduous woodland about 150 m from themain river (Don) and 3.5 m from a small tributary 0.7 m wide.The holt was under a pile of boulders 60m2 and 2.5 m high. Individual boulders ranged from 0.5 m to 1.5 m across. Five entrances were located,but it was not known whether they were connected within the pile.The pile had probably been formedduring clearance of a nearby arable field, and had a covering of vegetation, suggesting that this hadhappened a while ago.
Location of natal holts during field surveys would appear to be extremely difficult, and the aboveobservations suggest that they may be some distance from major rivers and areas frequently used byother otters.This might be a defence against cannibalism, which has been reliably recorded in oneinstance (Simpson & Coxon 2000).
There is no evidence as yet to suggest that the availability of natal holts limits the distribution of otters.Female otters seem to use sites well away from main watercourses and even appear willing to sitethem away from water altogether.
Ecology of the European Otter
23
Food availability
There are probably more than a hundred reports on the food and feeding habits of the European otterin the literature.This is at least in part because this is one of the easiest aspects of otter biology tostudy, since otter spraints are relatively easy to find and collect, and the prey remains within them arerelatively easy to identify.The technique of spraint analysis is not without problems, however, and thedifficulties of extrapolating from the contents of spraints to the actual diet of otters have been widelydiscussed (see particularly Carss & Parkinson 1996; Carss & Elston 1996; Carss & Nelson 1998;Jacobsen & Hansen 1996).
The results of dietary studies may be presented in a variety of ways, and while early studies tended toreport the frequency of occurrence or volume of prey remains in spraints, more recently, manyworkers have attempted to calculate the biomass or energy value of each prey type ingested. Aconsequence of this is that comparisons between studies are difficult to make other than in thebroadest terms. In addition, many studies only cover part of the year or involve rather small samplesizes.
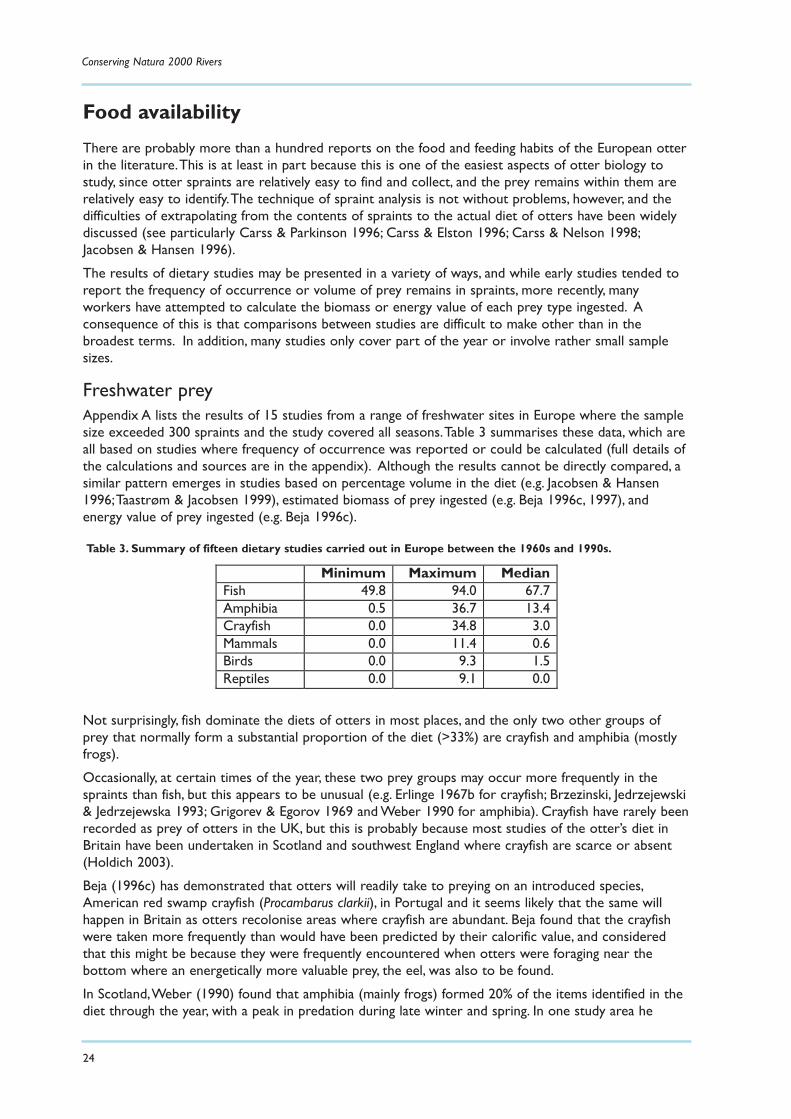
Freshwater preyAppendix A lists the results of 15 studies from a range of freshwater sites in Europe where the samplesize exceeded 300 spraints and the study covered all seasons.Table 3 summarises these data, which areall based on studies where frequency of occurrence was reported or could be calculated (full details ofthe calculations and sources are in the appendix). Although the results cannot be directly compared, asimilar pattern emerges in studies based on percentage volume in the diet (e.g. Jacobsen & Hansen1996;Taastrøm & Jacobsen 1999), estimated biomass of prey ingested (e.g. Beja 1996c, 1997), andenergy value of prey ingested (e.g. Beja 1996c).
Not surprisingly, fish dominate the diets of otters in most places, and the only two other groups ofprey that normally form a substantial proportion of the diet (>33%) are crayfish and amphibia (mostlyfrogs).
Occasionally, at certain times of the year, these two prey groups may occur more frequently in thespraints than fish, but this appears to be unusual (e.g. Erlinge 1967b for crayfish; Brzezinski, Jedrzejewski& Jedrzejewska 1993; Grigorev & Egorov 1969 and Weber 1990 for amphibia). Crayfish have rarely beenrecorded as prey of otters in the UK, but this is probably because most studies of the otter’s diet inBritain have been undertaken in Scotland and southwest England where crayfish are scarce or absent(Holdich 2003).
Beja (1996c) has demonstrated that otters will readily take to preying on an introduced species,American red swamp crayfish (Procambarus clarkii), in Portugal and it seems likely that the same willhappen in Britain as otters recolonise areas where crayfish are abundant. Beja found that the crayfishwere taken more frequently than would have been predicted by their calorific value, and consideredthat this might be because they were frequently encountered when otters were foraging near thebottom where an energetically more valuable prey, the eel, was also to be found.
In Scotland,Weber (1990) found that amphibia (mainly frogs) formed 20% of the items identified in thediet through the year, with a peak in predation during late winter and spring. In one study area he
Conserving Natura 2000 Rivers
24
Minimum Maximum Median Fish 49.8 94.0 67.7 Amphibia 0.5 36.7 13.4 Crayfish 0.0 34.8 3.0 Mammals 0.0 11.4 0.6 Birds 0.0 9.3 1.5 Reptiles 0.0 9.1 0.0
Table 3. Summary of fifteen dietary studies carried out in Europe between the 1960s and 1990s.

reported that 55% of prey remains inthe spring were amphibian.
It is probable, therefore, that in much ofthe UK, only fish and frogs make asignificant contribution to the diet ofotters in freshwater habitats at present,the latter on a seasonal basis. In someareas, crayfish may become seasonallyimportant as the otter populationrecovers, and there may be other,locally important, food sources incertain areas, such as mountain hares inupland rivers of Scotland (Conroy &Calder 2000).
Fish speciesA number of authors have attemptedto assess the preferences of ottersbetween fish species, but these studiesare confounded by the difficulties ofaccurately assessing both theproportion of each fish species in thediet and the availability of each fishspecies.
It is generally the case that otters takemost of the species that are present,and take a much higher proportion ofabundant species than of scarce species.There is also a widely held belief thatotters ‘prefer’ slower-moving species(or at least find them easier to catch),and that they therefore tend to preydisproportionately on cyprinids andother coarse fish compared tosalmonids, and on eels in preference toall other fish. However, there is littleunequivocal evidence from the wild tosupport this.
In two studies that involved very carefulestimation of the numbers of eachspecies of prey taken and the numberspresent in the study area,Thom (1997) found no evidence for selection by species in his study area onthe Tyne in Northumberland. Conversely,Taastrøm & Jacobsen (1999) found some evidence in theirDanish study areas that otters preferred percids (perch and ruffe) and avoided cyprinids.This is thereverse of the situation reported by Wise (1978) who found that the ratio of perch to cyprinids in thediet was much lower than in the lake she was studying.
The fact that in one study area,Taastrøm & Jacobsen recorded cyprinids in the spraints of otters inJanuary when none was caught by electro-fishing, clearly illustrates the difficulties of such studies.Otters can travel considerable distances (many kilometres) in the time it takes for food to travelthrough the gut. Although the minimum passage time for one meal is around three hours, the remainsof a meal can still be detected 24 hours later (Jurisch & Geidezis 1997).
Ecology of the European Otter
25
Geoff Liles
Above and below: Otters eat a wide range of fish, includingperch, ruffe and minnows.They are also very fond of eels.
Geoff Liles
In addition, most studies assume that the proportion of prey available to the otter is the same as thatrecorded by electro-fishing.This is confounded by three factors:
Electro-fishing does not sample all species and sizes of fish equally effectively. Eels are particularly difficult to sample (Knights et al. 2001).
Differences in fish behaviour, both between species and through the year.
Different foraging strategies by otters (hunting along the bottom versus hunting for mid-water species, or at the sides of streams, rather than in the middle).
Size of fish takenOtters have been recorded feeding on a very wide range of fish from <50 mm in length and 1 g inweight (Kruuk et al. 1993), up to 900 mm in length and weighing 6.3 kg (Carss, Kruuk & Conroy 1990).Even larger specimens (20 kg+) have been reported by carp fishermen (Mitchell-Jones, pers. comm.).Where it has been possible to obtain accurate estimates of the sizes of prey available there is someevidence of selection. Both Kruuk et al. (1993) and Thom (1997) found that otters caughtdisproportionate numbers of salmonids between 70 and 90 mm long. However, when Thom looked atother species of fish, different sizes were favoured – eels between 150 and 200 mm, and minnowssmaller than 50 mm were taken more frequently than expected from their abundance. In a Danishstudy where the diet was dominated by cyprinids,Taastrøm & Jacobsen (1999) found significantcorrelations between the size of prey in the diet and in the environment for most species in most oftheir study areas. However, there was evidence of size selection of cyprinids and percids in some areas.They noted that otters rarely took eels smaller than 180 mm or larger than 420 mm.
Carss et al. (1990) showed that some otters will concentrate their predation on adult salmon duringthe spawning season, particularly taking male salmon, which are more active and therefore morevulnerable to predation than females. Some otters obtained most of their daily food requirements bycatching a single salmon each night. At the other end of the size scale,Weir & Bannister (1973) foundthat spraint collections from a small river in Norfolk consisted entirely of stickleback remains in April1969 and March 1970 (monthly sample sizes not given; 1,200 spraints were collected from January1969 to March 1970).
SummaryThroughout most of their range in Europe the diet of otters in fresh water is dominated by fish.Amphibia and crayfish may also form a substantial proportion of the diet in some areas, though theirsignificance varies seasonally, crayfish being taken mainly in the summer and frogs usually in winter andspring.
Among fish species there is no evidence of strong avoidance for any species, and otters normally takeeach in approximate proportion to its abundance. Otters may take very small fish (sometimes in largenumbers) or very large fish, sometimes concentrating on one of these extremes for short periodswhen availability is high.They do not appear to prey on extremely small fish (less than 30 mm inlength), although the size of these prey makes it more difficult to recognise the remains and todiscriminate them from prey ingested by larger fish that were subsequently consumed by otters.
Variations in the composition of the diet are more likely to be related to changes in the availability ofdifferent prey species than to preferences by otters.
In terms of conservation management there is no evidence that either the range of sizes or of speciesof fish are likely to have an impact on the ability of otters to exploit an area, and it is more likely thatthe abundance of fish will be a limiting factor.Thus, very small streams with dense populations of smallfish may be as valuable to otters as larger rivers with large fish more sparsely distributed. However,because fish availability may vary through the year, where the number of prey species available is verysmall, there may be benefit in adopting habitat management strategies to promote the abundance ofother species such as frogs.
Conserving Natura 2000 Rivers
26
Marine preyThe diet of otters living and feeding on the coast is also dominated by fish, but generally to a muchgreater extent than for those foraging in fresh water (see review in Appendix A). In these studies fishformed more than 90% of the diet in all but one area – Mull, where Watt (1995) found that crabsformed approximately 10% of the items recorded in spraints. He noted, however, that crabs were takenmuch more frequently by young otters than by adults, and that as the young otters developed andbecame more efficient at catching fish, the proportion of crabs in their diet declined. In Shetland, Kruuk(1995) found that crabs were taken rarely, and mainly by inexperienced otters, except in years whenfish were scarce.
On Mull,Watt found that the size of fish taken by otters was similar to the size recorded in his fishtraps. On Shetland, however, otters tended to take fewer of the very small fish (such as butterfish) inrelation to their abundance and relatively more of the larger fish, such as eelpout.
Food availability and limits to otter populationsStudies by Hans Kruuk and colleagues (summarised in Kruuk 1995) have demonstrated that in someareas (Scottish rivers and islands, parts of Africa and Asia), otter populations are limited by their foodsupply. Ultimately, when otters have fully recolonised the areas in which they declined, this is likely tobe the case throughout the range of the European otter in Britain.At the moment, however, theabsence of otters from some areas is determined principally by historical events (the decline from the1950s to 1970s), and the fact that they have not yet had time to recolonise the whole of their formerrange.
Strachan & Jefferies (1996) concluded that biomass was unlikely to limit otter populations throughoutmuch of England since reports from regional offices of the National Rivers Authority indicated thatmost rivers reached targets of a sampling biomass of 15 g m-2 for salmonid fisheries and 20 g m-2 forcyprinid fisheries, with some exceptions in Wessex and the Thames catchment. Nevertheless, theavailability of food should not be ignored either because a lack of food in some areas may preventrecolonisation by otters, or because, if there is more food available, otter populations will be higher.This has conservation benefits, since larger otter populations would be more resilient and lessvulnerable to other deleterious factors (such as road casualties, short-term pollution events), and mightalso lead to more rapid recolonisation through enhanced recruitment.
ProductivityIn an attempt to demonstrate that the otter populations in central England were not limited by foodavailability, Brazier & Mathias (2001) tried to estimate the minimum productivity required for an otterpopulation to survive. Using data from a wide range of sources, they calculated averages for overnightdistance travelled by otters, daily food consumption (by captive otters) and the proportion of fish inthe diet. From these they calculated that each year, on average, each otter needed to harvest 5 g of fishper m2 of its home range in order to survive. In other words, rivers with an annual productivity above5 g m-2 year-1 should support otters, but those with a lower level would not.
There are a number of problems with this approach, of which the greatest is in determining the areaover which an otter forages. Brazier & Mathias used the average distance travelled per night multipliedby an ‘average’ stream width of 6.3 m.This overlooks the fact that a considerable part of an otter’stravelling time is not spent hunting, but moving from one foraging site to another and also makes ratherbroad assumptions about the sizes of rivers involved in the various studies quoted from. A calculationbased on home range sizes could have been more accurately determined for at least some of thestudies but would not have been usable without accurate information on the numbers of ottersforaging within each range.
More problematic was the fact that information on fish productivity could not be calculated from thecontemporary records available to the authors, and they had to rely on estimates of productivity basedon studies carried out 15 years previously. From these data they concluded that fish productivity was
Ecology of the European Otter
27
Conserving Natura 2000 Rivers
28
between 10 and 20 times greater than the requirements of otters, and that the absence of otters fromareas of central and southern England was not due to lack of prey.
BiomassSince biomass is strongly correlated with productivity,and is more easily calculated, and data are morereadily available, it is probably more realistic to use this as an indicator of prey available for otters.One approach is to look at figures for biomass in places where otter populations are known to existand try to determine a lower limit.
Kruuk et al. (1993) demonstrated that otters could successfully exploit oligotrophic streams populatedmainly by salmonids with densities between 9 and 14 g per m2. Calculations of the main prey of coastalotters in Shetland showed that the biomass varied mainly between 2.5 and 11 g per m2 throughoutmost of the year (Kruuk, Nolet & French 1988) but with a dramatic increase during August (to 62 gper m2). Otters in this population were shown to be in poor condition at times of year when fishbiomass was low.They also tended to produce their young in summer so that when metabolic demandson breeding females were greatest (shortly before weaning) fish were most abundant.
Ruiz-Olmo (1998) carried out an investigation on the influence of altitude on otters in Spain,supplementing surveys of otter signs with systematic direct observation as a means of estimating theabundance of otters and detecting evidence of breeding. Fish populations were assessed by electro-fishing. Ruiz-Olmo demonstrated a decline in otter abundance with altitude, as well as a decline in fishbiomass and number of fish species. From 300 to 800 m above sea level otters were recorded atbetween 20 and 30% of sites surveyed, fish biomass was between 20 and 280 g per m2 and two to 10species of fish were present.Thirty out of 36 ‘breeding events’ were recorded in this zone.
Above this height, all values declined progressively.There was no evidence of breeding above 1000 m,only one species of fish was present at sites above 1200 m, and although signs of otters were recordedup to 1800 m, they were few in number. Biomass at these sites was much lower. Ruiz-Olmo noted thatotters were present at sites with biomass values of 10–20 g per m2 and quoted a study by Nores et al.(1990) in which signs of otters were not found at sites with 1.8–3.3 g fish per m2 but were foundwhere the biomass was between 18 and 60 g per m2.
From these rather sparse data one may suggest a rule of thumb to the effect that otter populations cansurvive and breed where fish biomass exceeds 10 g per m2. Where the fish biomass is below thisfigure throughout the year there is a possibility that they may not be able to do so.
Thus the UK Environment Agency targets for fish biomass (15 g per m2 for salmonid fisheries and 20 gper m2 for coarse fisheries) are well above the level considered to be required by otters, and wherethese targets are achieved, food supply is unlikely to prevent otters becoming established – although itwill still determine carrying capacity.
Since the number of otters that can be supported by a river system will depend on the food availableto them, any action that increases the productivity of fish will benefit the otter population.The logicalextension of this is that the ‘target’ should be as high as possible while remaining appropriate to thenutrient status of the river. At the other end of the scale it is possible that biomass levels lower than 5g m-2 may be so low as to prevent colonisation by otters.
Fish availability in seven rivers in EnglandIn order to place these values in context, an attempt was made to summarise information held by theEnvironment Agency on the fish populations of seven rivers.These data were based on standardelectro-fishing techniques, which tend to underestimate fish populations, particularly eels, and shouldthus be regarded as minima. Details of the findings are reported in Appendix B, and these may besummarised as follows:
There have been changes in fish biomass over the past 30 years, with strong evidence of an increase in the southwest region.
Ecology of the European Otter
29
On some rivers in the past 30 years there may have been insufficient fish for otters to survive.
There is no evidence from these rivers to suggest that otters will be prevented by lack of fish from re-colonising UK rivers .
Declines in fish populationsOver the final third of the 20th Century there was evidence that, in some places, fish populationsincreased (see Appendix B). Recently, however, concern has been expressed about declines in somespecies, notably salmon and eels. Declines in adult salmon have been taking place over a long period,but although these fish are taken by otters, and for short periods may form the staple diet of someindividuals (Carss et al. 1990), they do not form a substantial part of the diet throughout the year.Thereis no evidence that declines in the number of salmon returning to spawn have any impact on otternumbers.
Declines in fry and parr could be much more significant, but only if they result in an overall decline inbiomass. If declines in salmon fry and parr are compensated by an increase in trout, as on the RiverOtter (Appendix B), otters will be unaffected.
Concerned has also been expressed about declines in eel populations (Farr-Cox 1996). Therecruitment of glass eels in Europe has declined since the 1970s, and there is also anecdotal evidenceof declines in yellow and silver eel stocks (Knights et al. 2001). Knights et al. reviewed the historicalevidence for this and carried out surveys on the rivers Severn, Dee, Piddle and Frome at sites wherethere was verifiable information on the historic abundance of eels.The authors concluded that, althoughthere had been a decline in recruitment of glass eels, the apparent decline in yellow and silver eels wasmore likely to be due to changes in fishing effort.This was a result of competition from farmed eelsleading to lower prices and resulting in lower yields from the wild fisheries.
They found that most rivers flowing west had higher populations of eels extending further up riverthan those discharging into the North Sea, and concluded that naturally lower recruitment in theeastern rivers (further from Atlantic currents) had led to lower populations in these rivers.The densityof eels declined from sea to source in all rivers, but upstream lower densities led to faster growth sobiomass did not decline to the same degree, particularly in western rivers.
One significant conclusion of this study is that conventional multi-species electro-fishing techniquesresult in eel densities being under-recorded by a factor of two to five times.Thus, where eels form asignificant part of the fish population, biomass estimates from normal fish sampling may be well belowthe actual level. The effect will be correspondingly small where eels are relatively scarce.
Physical and chemical attributes
Although it is possible to demonstrate that some physical attributes of rivers, such as width, correlatewith occupation of sites by otters (Chanin unpubl.), it is most likely that the reasons for this areconsequences of otter behaviour and the availability of food, rather than direct effects.The fact thatstream width is negatively correlated with biomass of fish, at least in some areas (Kruuk et al. 1993;Appendix B), suggests that any apparent preference for stream size is likely to be influenced by foodavailability. Since stream width is correlated with a number of other variables (depth, altitude, currentspeed) any apparent relationships between these and otter spraint distribution may be due to the samefactor.
Thom (1997) found that altitude was a significant predictor of the distribution of otter signs andsuggested that this might be a consequence of thermo-regulatory effects. However, otters successfullyforage in Spanish streams at heights exceeding 1000 m (Ruiz-Olmo 1998) and live in areas of northernEurope where snow cover lasts for many months of the year, which suggests that some other factormay be involved.Accidental captures of otters in lobster pots show that they are capable of diving to depths of 15 m
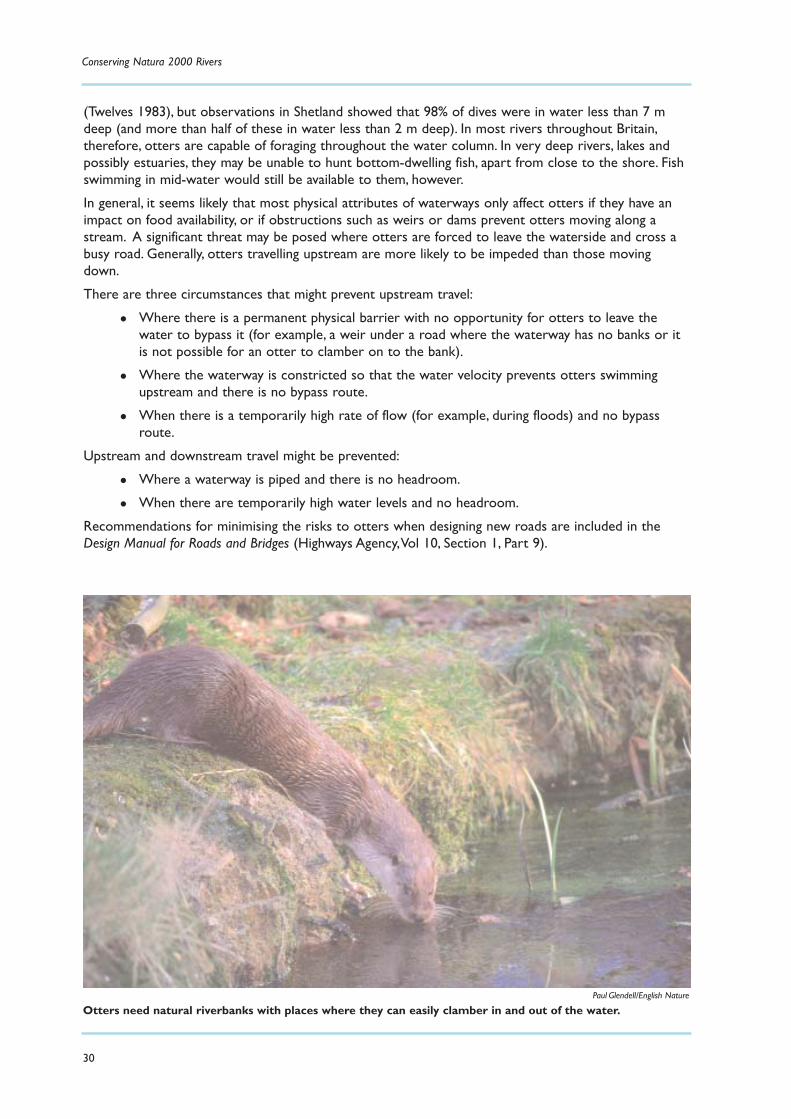
Conserving Natura 2000 Rivers
30
(Twelves 1983), but observations in Shetland showed that 98% of dives were in water less than 7 mdeep (and more than half of these in water less than 2 m deep). In most rivers throughout Britain,therefore, otters are capable of foraging throughout the water column. In very deep rivers, lakes andpossibly estuaries, they may be unable to hunt bottom-dwelling fish, apart from close to the shore. Fishswimming in mid-water would still be available to them, however.
In general, it seems likely that most physical attributes of waterways only affect otters if they have animpact on food availability, or if obstructions such as weirs or dams prevent otters moving along astream. A significant threat may be posed where otters are forced to leave the waterside and cross abusy road. Generally, otters travelling upstream are more likely to be impeded than those movingdown.
There are three circumstances that might prevent upstream travel:
Where there is a permanent physical barrier with no opportunity for otters to leave the water to bypass it (for example, a weir under a road where the waterway has no banks or it is not possible for an otter to clamber on to the bank).
Where the waterway is constricted so that the water velocity prevents otters swimming upstream and there is no bypass route.
When there is a temporarily high rate of flow (for example, during floods) and no bypass route.
Upstream and downstream travel might be prevented:
Where a waterway is piped and there is no headroom.
When there are temporarily high water levels and no headroom.
Recommendations for minimising the risks to otters when designing new roads are included in theDesign Manual for Roads and Bridges (Highways Agency,Vol 10, Section 1, Part 9).
Otters need natural riverbanks with places where they can easily clamber in and out of the water.Paul Glendell/English Nature
Ecology of the European Otter
31
SubstrateSubstate characteristics are only likely to affect otters if they affect food supply, and it is possible thatsiltation in particular may have a significant impact.
Changing farming practices have led to concern about the impact of soil erosion. In particular, increasesin winter cereal cropping, reseeding of pasture, the use of tramlines, removal of hedges and the plantingof maize have all added to the amount of topsoil being lost from fields and carried into ditches andstreams ( MAFF 1999a). Excessive poaching by cattle along unfenced river banks is a further cause oferosion.
Extreme levels of input to streams can cause the blanketing and loss of a wide range of plants andanimals, leading ultimately to decline in fish stocks. Lower levels of very fine sediment may have a lessobvious but equally serious effect by infiltrating gravel spawning grounds of salmonid fish and preventingthe inflow of oxygenated water to the eggs. Run-off is greatest during the winter at the time when theeggs are developing, thereby exacerbating the effect (Environment Agency undated a).
The impact of this on the otter population is difficult to predict, but there are extensive areas inEngland at risk from this form of pollution (MAFF 1999b), and since the food supply of the otter maybe affected, its potential significance should not be ignored.
Channel structure and management In the past, the simplification of the channel often involved in flood prevention and drainage worksinevitably led to a loss of structural diversity and a reduction in biological diversity and biomass.Brooker (1985) reported declines in fish biomass of more than 80% in some schemes, as well asdeclines in fish diversity.
This has been recognised as an issue in otter conservation management, and Otters and River HabitatManagement (Environment Agency 1999) addresses the point clearly. The Water Vole ConservationHandbook (Strachan 1998) also provides advice on management of channel structure, and since much ofthis has the potential to lead to an increase in food availability, it is therefore of benefit to otters.TheEnvironment Agency has published a series of case studies of river restoration, which clearly illustratewhat can be done to rehabilitate rivers that have been degraded by over-engineering (EnvironmentAgency undated b). Significant benefits could accrue from such schemes where they increase the foodsupply for otters.
Man-made structures associated with highly regulated rivers, such as weirs, bridges and bankreinforcements, are not avoided by otters and may be used as sprainting sites.There are also manyinstances of otters finding suitable resting sites among boulders and stone-filled gabions used in bankreinforcement.
Water quality requirements Within the range of natural values, water chemistry has little impact on otters other than by affectingfood supply. For example, moderate eutrophication may benefit otters by leading to an increase in theabundance of certain fish, although excessive eutrophication is detrimental when it leads to the reverseeffect. Otters are not directly affected by pH values within normal ranges, but where acid rain leads toexcessive acidity in watercourses, it can have an adverse effect on food supply.The impacts of toxicpollutants on otters are potentially extremely serious, and are considered in the following section.
Toxic chemicals
OverviewThe first evidence that toxic chemicals might be responsible for the decline of otter populations inBritain came from an analysis of hunting records (Chanin & Jefferies 1978).The authors concluded from

Conserving Natura 2000 Rivers
32
the timing of the decline that the introduction of dieldrin and related pesticides was the most likelycause.
During the 1980s and 1990s there were a substantial number of reports on pollutants in otters, theirspraints and their prey in the UK and Europe (Mason 1989; Kruuk & Conroy 1996; Kruuk, Conroy &Webb 1997; Simpson 1998; Bradshaw 1999; and Jefferies & Hanson 2001). Smit et al. (1994, 1996)undertook a major investigation into otters and polychlorinated biphenyl compounds (PCBs) in TheNetherlands – Development of Otter-based Quality Objectives for PCBs (DOQOP).
Mason (1995) provided a detailed overview of otters and pollutants and this is updated in Mason &Wren (2001), a review the ecotoxicology in carnivores that includes a substantial section on otters.Publications by Smit et al., (1994, 1996) summarise their work on the DOQOP project and theProceedings of the International Conference on Otter Toxicology held on Skye in 2000 (Conroy,Yoxonand Gutleb, 2002) includes a number of relevant review papers.
Types of pollutantMason (1989) categorised contaminants that might have an effect on otters as:
Those having an indirect effects (mainly on food supply)
Organic pollution from sewage treatment works, farms and the brewing, food and dairying industries.
Eutrophication as a result of run-off from farms and sewage treatment works.
Acidification mainly in the form of acid rain.
Acid mine waste.
Those with mainly direct effects
Oil spillage, mainly in coastal areas.
Radioactivity.
Those with effects as a result of bioaccumulation:
Metals, particularly mercury, but also cadmium and lead.
Pesticides and PCBs.
Mason concluded that PCBs have been the most important factor in limiting otter populations inEurope, while heavy metals may have had local effects but were not responsible for declines on a widescale.This view is widely held in Europe, but there are some who consider that the situation in Britainis not so simple (Kruuk & Conroy 1996; Kruuk 1997; Jefferies & Hanson 2001).
In the following review, attention is focused on bioaccumulating compounds, particularlyorganochlorine.
Significance of PCBsPCBs are normally used (and found in the environment) as mixtures of several components(congeners) with differing levels of toxicity. Mason has argued repeatedly and persuasively for theimportance of these compounds both as a cause of the decline of otters in Britain (and elsewhere) andin hindering its recovery (Mason 1997). In particular, he has pointed out that:
Concentrations of PCBs tend to be lower in countries or regions where otter populations are thriving or widespread, and vice versa.
Otter populations have declined in countries where PCB production has occurred and in areas downwind of production sources.
PCB levels in fish correlate with those in spraints.
In Britain the highest occupancy of sites in the national surveys occurs where PCBs in spraints are lowest.
Ecology of the European Otter
33
At a local level, both in Wales and around Glasgow, sprainting intensity was negatively correlated with PCBs.
The toxic effects of PCBs are mediated particularly by their effect on vitamin A metabolism (Smit etal.,1996; Murk et al., 1998). Simpson et al. (2000) has shown a strong negative correlation between thelevels of Vitamin A in otters and the levels of PCBs in road casualties from southwest Britain.
An alternative view was presented by Strachan & Jefferies (1996) who pointed to evidence implicatingdieldrin (and related compounds), at least in the initial phases of the otter’s decline.This hassubsequently been amplified by Jefferies & Hanson (2001) who presented data to support theircontention that the introduction of dieldrin was responsible for the decline of the otter in Britain fromthe mid-1950s, and that PCBs were not implicated, either in the initial decline or in slowing the otter’srecovery. Jefferies analysed otter tissues from as early as 1962 and pointed out that concentrations ofdieldrin were much higher in the 1960s than subsequently, with many otters having concentrationsexceeding the critical level for foxes (1 mg per kg wet weight). By the mid-1970s, concentrations in allotters analysed had declined below this. In contrast, although PCBs were first used in the 1930s, theywere only found at trace levels in otters during the 1960s and early 1970s, increasing in concentrationafter that time.
Jefferies & Hanson pointed out that there was a close link in time between the introduction of dieldrinand related compounds in 1955 and the recorded onset of the otter’s decline in 1957. In addition, thevery marked coincidence in time with declines in predatory birds such as peregrine falcon andsparrowhawk is very convincing. Ornithologists using much more substantial databases were unable todetect any effect of PCBs on populations, whereas the evidence against dieldrin is almostoverwhelming.
The most difficult observation to reconcile with the PCB hypothesis is that levels of PCBs in otters inShetland are considerably higher than elsewhere (Kruuk & Conroy 1996) despite the fact that thispopulation of otters is known to be thriving. Kruuk & Conroy also pointed out that individual otters (inShetland and elsewhere in Scotland) with high levels of PCBs were in good condition and breedingsuccessfully.
The evidence that PCBs can have an adverse effect on the physiology of mammals is clear (Leonards etal. 1994) but Kruuk (1997) has pointed out that it is important not to confuse effects on individualswith effects on populations. He also observed that by using inappropriate ‘environmental standards’ wemight condemn as unsuitable areas that are, in fact, good otter habitat.Thus, otters in Shetland have arelatively high concentration of PCBs but the population is thriving and increased from the 1980s tothe 1990s (Kruuk & Conroy 1996).The geometric mean for a sample of 14 animals from Shetland was64% higher than the value at which reproductive failure occurs in mink, a frequently quoted ‘level ofconcern’ in otters. Kruuk & Conroy reported levels between 10 and 20 times higher than this inapparently healthy animals, one of which was lactating.
Mason reported in 1998 that, following a decline of 8% per year in PCB concentrations in otters overthe period 1983–1992, he no longer considered that PCBs were a threat to otters in Britain.
It is clear that there have been disagreements over the significance of PCBs in the decline and recoveryof the otter population in Britain. Mason believes PCBs may have been responsible for the initial declineand limited the population during the 1980s and early 1990s, but no longer do so. Jefferies believes thatorganochlorine pesticides were responsible for the initial decline of otters in Britain. Kruuk questionswhether the levels of contamination that Mason has put forward as having an adverse impact onindividual otters have had significant impacts on populations.The only consensus would appear to bethat at the beginning of the 21st Century, PCBs are not limiting otter populations in the UK.
Elsewhere in Europe there is a more general consensus that PCBs have had a significant impact onotter populations, but despite this, the evidence is not clear-cut. In Scandinavia, Christensen (1995)found no evidence of PCB stress or reproductive failure in the coastal Norwegian otter population, andconcluded that the lower densities of otters on the western coast could not be explained by PCBs.However, she noted that high levels of PCBs in fish from southern and central coasts might be a cause
for concern and that the disappearance of otters in southern Norway could be caused by PCBs. Rooset al. (2001) reported that changes in PCB levels correlated closely with changes in Swedish otterpopulations, and suggested that the recovery of the otter population in southern Sweden may beprevented by the high levels of PCBs in that area.
PesticidesMason, Ford & Last (1986) recorded the presence of one or more of lindane (HCH), dieldrin and DDT(and its metabolites) in the tissues of 23 otters collected over a wide area of Britain. Levels of thesecompounds were low in otters from Orkney and Shetland, but elsewhere the pattern was variable.Lindane was generally found in low concentrations (below 20 mg per kg of lipid in muscle tissue), butdieldrin and DDT reached higher levels (up to 66 and 116 mg per kg, respectively).
Similar values to these, though a little lower, were recorded 10 years later by Kruuk & Conroy (1996)for otters in Scotland. Meanwhile, in southwest England, Simpson (1998) found Dieldrin and DDT in allotters analysed (56) but in most cases at low levels and with a significant decline from 1989–96.Lindane was not detectable in 75% of Simpson’s samples and was at very low levels in the remainder.
The sample of 122 otters analysed by Jefferies & Hanson (2001) included animals that died over theperiod 1965–89.They were able to demonstrate a decline in residues of dieldrin over this period, butnoted that high values were recorded in the period 1965–69, long after the start of the decline ofotters and following bans on its use for seed dressings in 1962 and sheep dip in 1966.
Roos et al. (2001) reported a decline in concentrations of DDT of more than 70% between the 1970sand early 1990s in Sweden, but concluded that these changes did not explain changes in otterpopulations as well as spatial and temporal changes in PCBs.They also detected a decline inconcentrations of DDT in fish of more than 80% in most areas.
The Environment Agency’s review of its pesticide monitoring programme (Environment Agency undatedc) shows that Environmental Quality Standards (EQS) for both Aldrin and HCH were breached in 1998(one and eight times, respectively). All these failures were close to the Thames Estuary (rivers Medwayand Blackwater), with four of the HCH failures in estuarine sites, the remainder in fresh water. Allwere at concentrations below 0.1 g l-1. Otters are currently scarce or absent in this area, but this isprobably because they have not yet had time to recolonise it.
No other pesticides have been directly linked to otter declines, but there were over 200 EQS failuresfor organophosphate and synthetic pyrethroid compounds used in sheep dips in 1998 (EnvironmentAgency undated c). Many of these were scattered throughout the sheep farming areas of Wales,Northumbria and Cumbria, but there was a substantial concentration of sites in the Yorkshire areaassociated with the textile industry. Biological surveys in Wales revealed a loss of invertebrates at 9% ofsites visited.
Sheep dips were the origin of 24% of pollution incidents recorded in 1998, and that number hadincreased markedly since 1996.This reflects a shift from the use of organophosphates to syntheticpyrethroids, which are safer for humans but more toxic to aquatic organisms.The impact on otters islikely to be indirect, resulting from a reduction in fish that have lost their invertebrate food supply.
Heavy metals Mercury may be a more serious contaminant of otters than other heavy metals, along with cadmiumand lead.
Mason, Last & Macdonald (1986) found relatively low levels of mercury, cadmium and lead in tissuefrom 36 otters that died between 1982 and 1985, mainly in Wales and Scotland.They concluded thatthese contaminants did not generally reach levels that might cause mortality, but were close to levelsthat led to sublethal effects in other mammals.
Kruuk, Conroy & Webb (1997) found mean concentrations of mercury in 112 otters that died between1986 and 1992 in Scotland to be similar to those recorded by Mason et al. (1986).They noted that asmall proportion of animals had concentrations of mercury sufficiently high to pose a risk to their
Conserving Natura 2000 Rivers
34
survival (for example at times of food stress). Nevertheless, they concluded that this was not likely tohave an impact on the population.
An indirect effect of heavy metal pollution was suggested by Thom (1997). He considered that otterpopulations on the South Tyne River might be limited by the availability of minnows, whose distributionwas negatively correlated with the concentrations of lead in eels.Local incidentsWhile nationally there is a downward trend in concentrations of most pollutants in water, a number ofincidents over the years demonstrate that local effects can have at least temporary effects on otterpopulations. In southwest England there have been a few examples of accidental releases of insecticidesfrom the textile industry and damage to pesticide dumps.These have had short-term and dramaticeffects. Similarly, sudden influxes of highly enriched water (from sewage, slurry or silage effluent) leadingto excessive eutrophication may have a serious, if short-term, impact on the food supply. Over longerperiods the possibility of leaching from unregulated pesticide dumps cannot be ignored.
In Sweden, Olsson, Jensen & Reutergårdh (1978) demonstrated seasonal fluctuations in PCB levels infish in lakes.These increased by two to five times in April when high flows brought in sediments fromrivers. Similar effects might be expected where high levels of toxic chemicals trapped in sediments arereleased during dredging or other river management work.
Standards
PCBsGiven the unresolved controversy as to whether PCBs have been a significant threat to otterpopulations in Britain, it is difficult to make firm recommendations on water quality standards for theseand other toxic chemicals.Two principal approaches have been used to set such standards.
Mason used information on the toxicity of PCBs to mink to set standards for otter tissues, and fromthese calculated appropriate levels for spraints using a mathematical model.This has been criticised ontwo grounds. Firstly, that the use of mink was inappropriate since the mink are much more sensitive toPCBs than otters (Kruuk 1997). Secondly, that experimental tests to corroborate the relationshipbetween body burden of PCBs and concentrations in spraint did not yield predicted results (Smit et al.1994; Gutleb & Kranz 1998; Conroy & Carss 2001).
Ecology of the European Otter
35
Standards for levels in spraints from Mason & Macdonald (1994)
Critical levels Concentrations in spraints >16 mg per kg of PCB and dieldrin singly or combined
or
Concentrations in spraints of total organochlorines >20 mg per kg
Levels of concernConcentrations in spraints: 9–16 mg per kg of PCB and dieldrin singly or combined
or
Concentrations in spraints of total organochlorines: 16–20 mg per kg
Maximum allowable concentrationsConcentrations less than the level of concern but greater than the no effects level
'No effects' levelsLess than 4 mg per kg for all individual contaminants as described above.
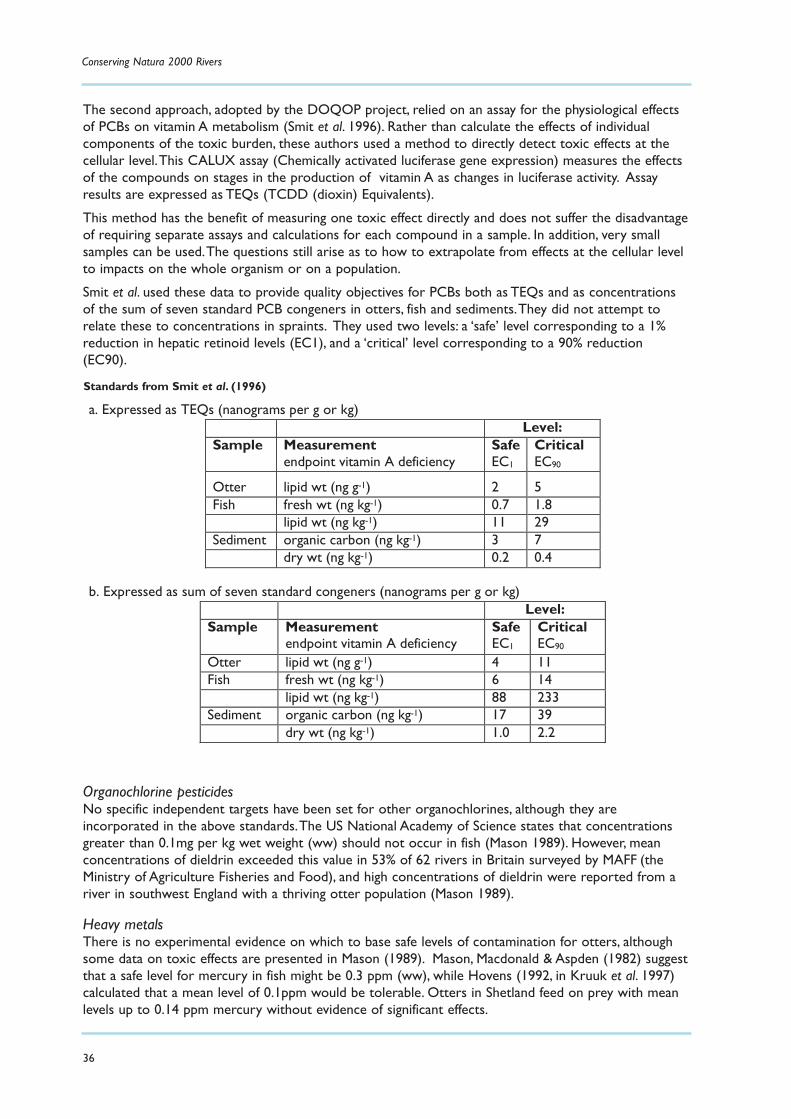
The second approach, adopted by the DOQOP project, relied on an assay for the physiological effectsof PCBs on vitamin A metabolism (Smit et al. 1996). Rather than calculate the effects of individualcomponents of the toxic burden, these authors used a method to directly detect toxic effects at thecellular level.This CALUX assay (Chemically activated luciferase gene expression) measures the effectsof the compounds on stages in the production of vitamin A as changes in luciferase activity. Assayresults are expressed as TEQs (TCDD (dioxin) Equivalents).
This method has the benefit of measuring one toxic effect directly and does not suffer the disadvantageof requiring separate assays and calculations for each compound in a sample. In addition, very smallsamples can be used.The questions still arise as to how to extrapolate from effects at the cellular levelto impacts on the whole organism or on a population.
Smit et al. used these data to provide quality objectives for PCBs both as TEQs and as concentrationsof the sum of seven standard PCB congeners in otters, fish and sediments.They did not attempt torelate these to concentrations in spraints. They used two levels: a ‘safe’ level corresponding to a 1%reduction in hepatic retinoid levels (EC1), and a ‘critical’ level corresponding to a 90% reduction(EC90).
Organochlorine pesticidesNo specific independent targets have been set for other organochlorines, although they areincorporated in the above standards.The US National Academy of Science states that concentrationsgreater than 0.1mg per kg wet weight (ww) should not occur in fish (Mason 1989). However, meanconcentrations of dieldrin exceeded this value in 53% of 62 rivers in Britain surveyed by MAFF (theMinistry of Agriculture Fisheries and Food), and high concentrations of dieldrin were reported from ariver in southwest England with a thriving otter population (Mason 1989).
Heavy metalsThere is no experimental evidence on which to base safe levels of contamination for otters, althoughsome data on toxic effects are presented in Mason (1989). Mason, Macdonald & Aspden (1982) suggestthat a safe level for mercury in fish might be 0.3 ppm (ww), while Hovens (1992, in Kruuk et al. 1997)calculated that a mean level of 0.1ppm would be tolerable. Otters in Shetland feed on prey with meanlevels up to 0.14 ppm mercury without evidence of significant effects.
Conserving Natura 2000 Rivers
36
a. Expressed as TEQs (nanograms per g or kg) Level: Sample Measurement
endpoint vitamin A deficiency Safe EC1
Critical EC90
Otter lipid wt (ng g-1) 2 5 Fish fresh wt (ng kg-1) 0.7 1.8 lipid wt (ng kg-1) 11 29 Sediment organic carbon (ng kg-1) 3 7 dry wt (ng kg-1) 0.2 0.4
b. Expressed as sum of seven standard congeners (nanograms per g or kg)
Level: Sample Measurement
endpoint vitamin A deficiency Safe EC1
Critical EC90
Otter lipid wt (ng g-1) 4 11 Fish fresh wt (ng kg-1) 6 14 lipid wt (ng kg-1) 88 233 Sediment organic carbon (ng kg-1) 17 39 dry wt (ng kg-1) 1.0 2.2
Standards from Smit et al. (1996)
Kruuk et al. (1997) illustrate the difficulty of extrapolating safe levels for humans to otters by calculatingthat otters in Shetland have an annual intake of mercury approximately 40 times higher than thatrecommended for people.
MonitoringEven if there is no agreed basis on which to set targets or standards for levels of pollutants, there isagreement that high levels of PCBs, organochlorine pesticides and heavy metals are all potentiallydetrimental to otters, and it is therefore important to monitor the levels of these in otter populationsand their environments.
Simpson (1998) and Bradshaw (1999) demonstrated the benefits of carrying out large-scale, long-termmonitoring of dead otters (killed mainly in road accidents) although these can only provide usefulsamples when looked at over a relatively large area. Sampling of prey or water (via the EnvironmentAgency’s monitoring schemes) provides much more detailed information at the catchment or evenstream level, though this may not provide a good indication of impact on otter populations.
The use of spraints for monitoring pollutant levels in otters is still controversial, and at theInternational Conference on Otter Toxicology held on Skye in 2000, it was agreed that further work isnecessary before a full understanding of this will be possible. Mason & Macdonald’s (1994) calculationsof safe and critical levels were based on a mathematical model, and some attempts to test thisexperimentally have led to unpredicted results (Smit et al. 1994; Gutleb & Kranz 1998). For example, itis not clear whether the concentrations of pollutants in spraints reflect the most recent mealconsumed by an otter, or are influenced by food consumed over a longer period of time.
Until these issues are resolved, the use of spraints as a monitoring tool should be undertaken withcaution. High levels of contaminants in spraints should certainly give cause for concern, since theyindicate that the otters have been exposed to the pollutants. However, the standards set by Mason maynot be appropriate. Further work is needed to confirm this.
ConclusionsFurther information on levels of toxic chemicals in several river catchments is set out in Appendix C.
From these data and the reports cited above some conclusions can be drawn:
In the UK and parts of Europe levels of toxic chemicals in otters, their prey and in fresh water are declining.This has taken place alongside a recovery in the otter population, but there is no agreement as to how the two phenomena are linked.
It is possible, perhaps likely, that different pollutants have affected otter populations in different areas and at different times.
The possibility of new pollutants (such as synthetic pyrethroids) having an impact on otter populations either directly, or via their prey, cannot be ignored, and vigilance for future contaminants is essential.
While various standards have been set, some on a firm physiological basis, there is not universal agreement that these are appropriate. Effects on individuals do not necessarily mean that there will be effects on populations, and there is evidence that populations can thrive when otters carry pollutant burdens higher than some of the standards that have been suggested.
Ultimately, the most desirable objective is to eliminate toxic chemicals from waterways entirely, and the only logical target is zero or at least as low as possible. In practice, as otter populations recover and contamination of waterways by many pollutants declines, the most important conservation objective should be to continue monitoring to ensure that known pollutants continue to decline and to detect the appearance of new ones.
The possibility of local, possibly temporary, high levels of pollutants having a significant effect on otters or their prey should not be ignored.
Ecology of the European Otter
37
On these grounds, monitoring of pollutant levels in otters and their environment is essential and it would be desirable to agree a national strategy for doing this.
It is clear that the volume and complexity of the literature on otters and toxic chemicals is such that a full review is beyond the scope of this project.With the publication of Jefferies’ data on toxic chemicals in otters dating back to the 1960s (Jefferies & Hanson 2001), it may be timely to consider a full review of studies of pollutants and British otter populations,incorporating the published literature and using data on watercourses held by the Environment Agency.
Summary of the effects of physical and chemical attributesAlthough there is no evidence to suggest that either physical or chemical attributes of waterways areinhibiting the continued spread of otters, both of these have the potential to limit the ultimate size ofthe population by their effects on the food supply.
Currently, the effects are most likely to be mediated by the impacts of siltation, inappropriate channelstructure and the use of certain pesticides.There are regional variations in the extent of these but it isprobable that, nationally, significant efforts to remedy or mitigate them could have a substantial impactof the ultimate size of the otter population rather than its distribution.
Disturbance
Anthropogenic disturbanceAs with habitat destruction, the suggestion that human activity might cause significant disturbance tootters dates back to the report of the Joint Otter Group. In the UK this appeared to be supported bythe fact that the otter population declined most in the central, southern and southeastern parts ofBritain where the human population is highest, while otters survived well in Scotland and, to a lesserextent, in southwest England where human densities are lower. Despite the fact that there is increasingevidence that otters habituate readily to many forms of human disturbance, there is still a widespreadbelief that disturbance is detrimental to otters.
Jefferies (1987) reviewed much of the anecdotal evidence available at the time and demonstrated thatotter activity was not significantly affected by various forms of anthropogenic disturbance (includingwalkers, anglers and dogs), though he noted that there was less evidence available for female otterswith cubs and suggested that these might have more stringent requirements. Since then, furtherevidence has accrued.
A common response to the sounds of anglers or walkers with dogs is for radio-tracked otters to moveto a position where they can see the origin of the disturbance, then dive and swim underwater for 50m or so before surfacing and resting on the bank for five to 30 minutes, then resuming their previousactivity (Durbin 1993).
Perhaps the most dramatic demonstration of the ability of otters to live in highly disturbed areas is therecolonisation of Glasgow. During the first survey of Scotland, few sites within the conurbation ofGlasgow had signs of otter, but this had increased to 12% by the time of the second. In the third survey,63% of sites within the conurbation had signs of otters and breeding had been recorded at four urbansites (Green & Green 1997).
In England, officers of the Otters and Rivers Project (OARP) have reported the presence of otters in80 cities and towns, and they are described as being frequent or resident in 49 of these.There wasevidence of otters breeding in nine towns and near several others.
In Shetland, where the otter population is considered to be healthy, otters regularly breed under theislands’ ferry terminals and under the jetties of Europe’s largest oil terminal at Sullom Voe.
From these reports it seems safe to conclude that the recovery of the otter population is not beingimpeded by human disturbance.
Conserving Natura 2000 Rivers
38
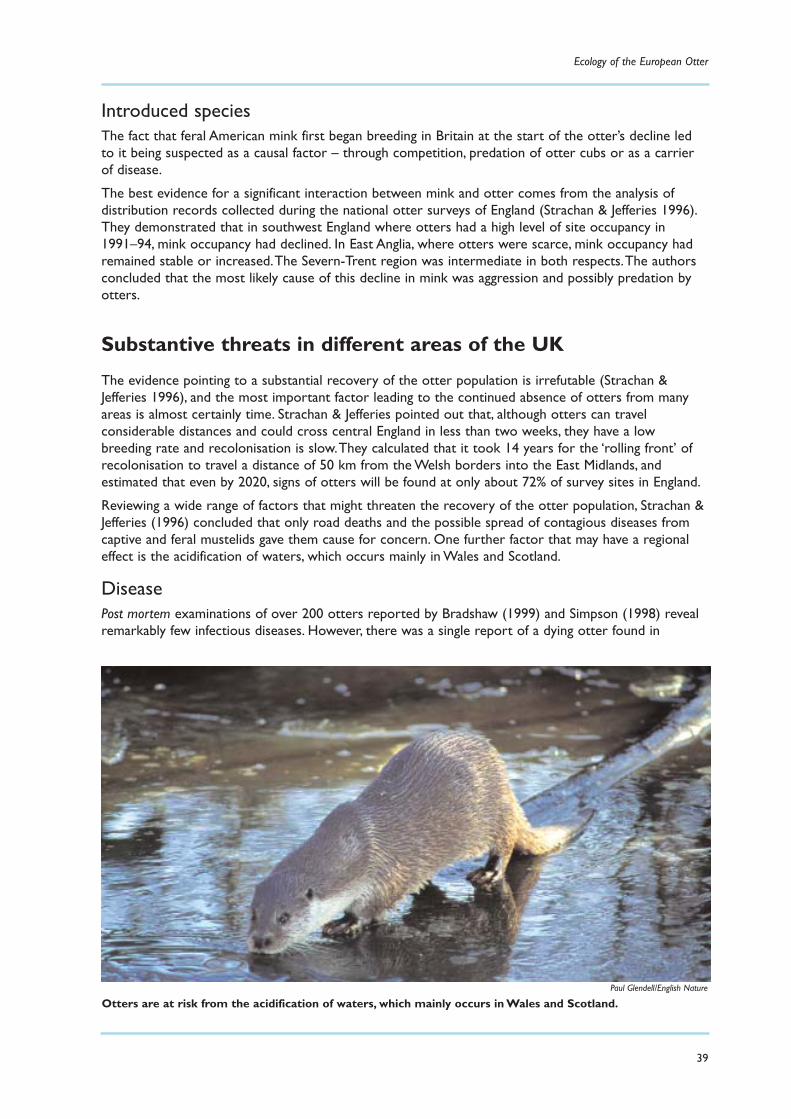
Introduced speciesThe fact that feral American mink first began breeding in Britain at the start of the otter’s decline ledto it being suspected as a causal factor – through competition, predation of otter cubs or as a carrierof disease.
The best evidence for a significant interaction between mink and otter comes from the analysis ofdistribution records collected during the national otter surveys of England (Strachan & Jefferies 1996).They demonstrated that in southwest England where otters had a high level of site occupancy in1991–94, mink occupancy had declined. In East Anglia, where otters were scarce, mink occupancy hadremained stable or increased.The Severn-Trent region was intermediate in both respects.The authorsconcluded that the most likely cause of this decline in mink was aggression and possibly predation byotters.
Substantive threats in different areas of the UK
The evidence pointing to a substantial recovery of the otter population is irrefutable (Strachan &Jefferies 1996), and the most important factor leading to the continued absence of otters from manyareas is almost certainly time. Strachan & Jefferies pointed out that, although otters can travelconsiderable distances and could cross central England in less than two weeks, they have a lowbreeding rate and recolonisation is slow.They calculated that it took 14 years for the ‘rolling front’ ofrecolonisation to travel a distance of 50 km from the Welsh borders into the East Midlands, andestimated that even by 2020, signs of otters will be found at only about 72% of survey sites in England.
Reviewing a wide range of factors that might threaten the recovery of the otter population, Strachan &Jefferies (1996) concluded that only road deaths and the possible spread of contagious diseases fromcaptive and feral mustelids gave them cause for concern. One further factor that may have a regionaleffect is the acidification of waters, which occurs mainly in Wales and Scotland.
DiseasePost mortem examinations of over 200 otters reported by Bradshaw (1999) and Simpson (1998) revealremarkably few infectious diseases. However, there was a single report of a dying otter found in
Ecology of the European Otter
39
Paul Glendell/English Nature
Otters are at risk from the acidification of waters, which mainly occurs in Wales and Scotland.
Norfolk with symptoms and lesions very similar to those of Aleutian disease, an immune deficiencyvirus associated with captive mink (Wells, Keymer & Barnett 1989). DNA from this virus was isolatedfrom a single otter in Spain, though the pathogenicity of the strain identified was unknown (Mañas et al.2001).
Road casualtiesInvestigationsConcern about the increasing numbers of otters found dead on roads led the Highways Agency tocommission research into this phenomenon (Philcox, Grogan & Macdonald 1999; Grogan, Philcox &Macdonald in prep). Philcox et al. obtained data on 673 casualties over the whole of Britain between1971 and 1996, and noted a marked increase in numbers from the mid-1980s. Part of this could beattributed to an increasing awareness of the need to report and collect otter casualties, but it was notpossible to determine the extent to which increases in road length, traffic and otter numbersinfluenced this trend. A high proportion of these casualties (22%) occurred in southwest England.Apart from the Scottish Islands, Philcox et al. found that this region had the highest number ofcasualties per unit area.
In Wales, Liles & Colley (2000, 2001) undertook a study of road deaths for the Environment AgencyWales,Welsh Water and the Wildlife Trusts.The first report identified sites where mitigation should becarried out and established priorities, while the second described procedures for implementing thesemeasures. Information on adjacent habitat and the nature of each mortality site was recorded and apreliminary effort was made to identify factors that could be used in a predictive model, but none waspresented. However, 58% of casualties occurred away from bridges or culverts at sites described by theauthors as ‘watersheds’, ‘short cuts’ or ‘enigmas’.
Two further studies on road casualties have been commissioned by the Highways Agency – oneregional, in southwest England carried out in 2000, and one national, carried out during 2001 and 2002.
An investigation into otter mortality on the trunk roads and motorways in Devon and Cornwallidentified over 200 actual or potential casualty sites along 320 km of the A30, A38 and M5 (Chanin2001). Potential sites were places where the road crossed or ran adjacent to a river, but seven of the30 sites where casualties had occurred were away from water.Thirty-seven casualties were recordedon these roads between 1990 and 2000, a disproportionate number occurring on the A30 in Cornwallwhere it ran along the watersheds between rivers draining to the north and to the south of thepeninsula. Apart from crossings where the passage of otters was permanently blocked (by impassableweirs, for example), it was not possible to predict where otters were most likely to be killed. A uniquefeature of this study was that sites where otters had not been killed were examined, as well as thosewhere they had. It was therefore possible to compare the frequency of casualties at particular types ofstructure with the ‘abundance’ of those structures along the roads. It was notable that, although otterswere unlikely to be killed at high viaducts, there was no relationship between size or type of structureand the likelihood of casualties occurring.
Following this, a national project to identify sites for mitigation on trunk roads was carried out during2001 and 2002. The project was managed by Halcrow and guided by an advisory panel, includingrepresentatives from statutory and non-statutory organisations involved in otter conservation, as wellas knowledgeable individuals.
Impact on otter populationsSince 1992 the Southwest Region of the Environment Agency has arranged for otter carcasses to becollected and subjected to post mortem examination (Simpson 1998) and has maintained records of allcasualties reported to it. From 1990 to 2000, more than 250 otters have been killed on the roads ofthe Southwest (Figure 4), and the increase in numbers over this time has given some cause for anxiety,with a total of 50 animals recorded in 1999. However, these data include animals killed in areas whereotters are still recolonising (notably Somerset, Dorset and Hampshire), and if only otters reported inDevon and Cornwall are included there is some evidence to suggest that the annual kill is levelling off(Figure 4).
Conserving Natura 2000 Rivers
40
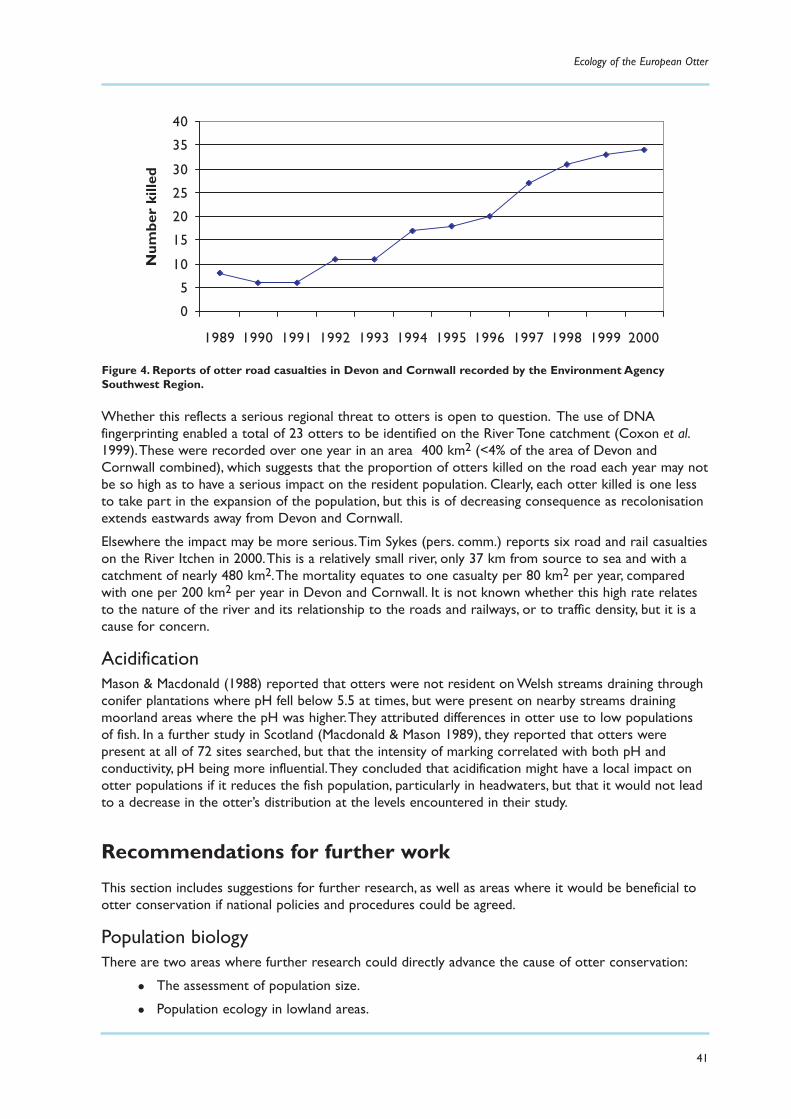
Whether this reflects a serious regional threat to otters is open to question. The use of DNAfingerprinting enabled a total of 23 otters to be identified on the River Tone catchment (Coxon et al.1999).These were recorded over one year in an area 400 km2 (<4% of the area of Devon andCornwall combined), which suggests that the proportion of otters killed on the road each year may notbe so high as to have a serious impact on the resident population. Clearly, each otter killed is one lessto take part in the expansion of the population, but this is of decreasing consequence as recolonisationextends eastwards away from Devon and Cornwall.
Elsewhere the impact may be more serious.Tim Sykes (pers. comm.) reports six road and rail casualtieson the River Itchen in 2000.This is a relatively small river, only 37 km from source to sea and with acatchment of nearly 480 km2.The mortality equates to one casualty per 80 km2 per year, comparedwith one per 200 km2 per year in Devon and Cornwall. It is not known whether this high rate relatesto the nature of the river and its relationship to the roads and railways, or to traffic density, but it is acause for concern.
AcidificationMason & Macdonald (1988) reported that otters were not resident on Welsh streams draining throughconifer plantations where pH fell below 5.5 at times, but were present on nearby streams drainingmoorland areas where the pH was higher.They attributed differences in otter use to low populationsof fish. In a further study in Scotland (Macdonald & Mason 1989), they reported that otters werepresent at all of 72 sites searched, but that the intensity of marking correlated with both pH andconductivity, pH being more influential.They concluded that acidification might have a local impact onotter populations if it reduces the fish population, particularly in headwaters, but that it would not leadto a decrease in the otter’s distribution at the levels encountered in their study.
Recommendations for further work
This section includes suggestions for further research, as well as areas where it would be beneficial tootter conservation if national policies and procedures could be agreed.
Population biologyThere are two areas where further research could directly advance the cause of otter conservation:
The assessment of population size.
Population ecology in lowland areas.
Ecology of the European Otter
41
0
5
10
15
20
25
30
35
40
1989 1990 1991 1992 1993 1994 1995 1996 1997 1998 1999 2000
Num
ber
kille
d
Figure 4. Reports of otter road casualties in Devon and Cornwall recorded by the Environment AgencySouthwest Region.
Population sizeBarring further large-scale changes in the environment, it seems likely that otters will continue tocolonise those parts of Britain where they declined to extinction during the third quarter of the 20thCentury. Long-term monitoring by national surveys will enable this recovery to be charted, butwhether the population densities in those areas recover to former levels will be more difficult toascertain.
National long-term conservation objectives for otters tend to be set on the basis of their distribution;that by a certain date otters should be found over a particular area, rather than on the basis ofpopulation size or density. However, judging from recent correspondence, there is also a need to obtaininformation on numbers of otters inhabiting particular areas, Special Areas of Conservation (SACs) andNational Parks, for example.
Good estimates of the population of otters in Shetland (with defined confidence limits) have beendetermined by Kruuk et al. (1989) and Conroy & Kruuk (1995), but other estimates of otter numbersand density in Britain are based on inadequate data and should be treated with considerable caution.
Determining the population in freshwater habitats is only likely to be practical in the near future by theuse of DNA fingerprinting of otter spraints, a technology that is promising but still in its infancy. If thereis a need to know numbers of otters for conservation purposes, a higher priority should be given todeveloping this technique, and serious consideration should be given to seeking funding andcommissioning further research.
Population ecology in lowland areasTo date, all studies of otter movements, social organisation and habitat use in the UK (other than thoseusing spraints) have been undertaken in Scotland.While there is no reason to believe that otters inlowland areas of England would behave differently, comparative data are lacking and there isconsiderable scope for studies using radiotelemetry and DNA fingerprinting to investigate otter biologyin these areas as the population recovers.There are substantial difficulties in carrying out such work interms of resources, development of techniques (DNA fingerprinting) and catching the animals(radiotelemetry). Nevertheless, consideration should be given to promoting such research, particularlyin areas where preliminary studies have been carried out, such as parts of Yorkshire and the Itchencatchment in Hampshire.
Diet in lowland areasIn reviewing the literature on otter diet it has become clear that, although numerous studies have beencarried out in Europe as a whole, there are remarkably few from lowland Britain. Apart from twoprojects on a eutrophic lake in south Devon in the 1970s (Chanin 1981;Wise, Linn & Kennedy 1981),most substantial studies of the diet of otters in Britain have been undertaken on the coast or onupland rivers and streams in Scotland.
As otters return to central and southern England, the opportunities for such a study continue toincrease and although it is unlikely to have a major impact on otter conservation, there would be valuein promoting such work. One situation where such information may usefully support conservationmeasures is where otters come into conflict with still-water fisheries and consideration should be givento commissioning research on this topic.
Review of toxic chemicals in ottersConsiderable numbers of otters and spraints have been analysed for toxic chemicals. Reports arescattered through the literature and it is very difficult to obtain an overview of the data.The longest-term study, dating back to the 1960s and carried out by DJ Jefferies, is now approaching publication(Jefferies & Hanson 2001).The Centre for Ecology and Hydrology at Banchory, Aberdeenshire, holds alarge number of unanalysed samples dating back to the early 1990s and covering much of Scotland(James Conroy, pers. comm.).
Conserving Natura 2000 Rivers
42
The data on water quality obtained for this report and described briefly in Appendix D demonstratethat there is information available to provide a background to the pollutant burdens of otters. Areview of these data covering the whole of Britain over the past 40 years and describing changes inspace and time would make it possible to provide a coherent picture of the impact of toxic chemicalson the UK otter population in the second half of the 20th Century. This would also provide a valuablefoundation for evaluating future changes.
Monitoring National SurveysThe repeated surveys of otters in Britain provide a unique record of changes in the distribution of athreatened species over a period of nearly 25 years.The fact that there is not yet a policy for thefuture of these surveys is a serious cause for concern.
There is an urgent need for a review of the method and approach to otter surveys and data storage asa basis for determining a policy for their future. Such a review should not only take into account theneed for continuity, but also national arrangements for monitoring mammals, should these be agreed,and the proposed scheme for monitoring otters throughout Europe (Reuther et al. 2000).
Road casualties and postmortemsThe current system of collecting and recording otter road casualties has developed on an ad hoc basisin the three main regions where otters are abundant: southwest England,Wales and Scotland.There isno formalised scheme for Northern Ireland (Conroy & Carss 2001).There is a need to develop anational policy on dealing with road casualties, ideally with regional mechanisms for collecting carcassesand forwarding them for postmortem examination.There should also be nationally agreed protocolsfor data recording and for carrying out postmortem examinations. Data from postmortems should beregularly reviewed as a means of monitoring changes in the health of the otter population in terms ofcondition, clinical diseases and pollutant burdens.
Data from road casualty sites should be regularly reviewed in order to identify places where mitigationmight usefully be carried out.The Highways Agency has put considerable resources into investigatingotter road casualties, revised its Design Manual for Roads and Bridges to incorporate the needs of ottersand undertaken to carry out mitigation where appropriate. However, its responsibilities only extend totrunk roads and motorways, and there is an additional need to involve local authorities withresponsibility for roads in monitoring and mitigation schemes. Local and regional offices of theEnvironment Agency would form a useful focus for such work.
Priorities for actionHigh priority
Population monitoring schemes (National Surveys).
Monitoring of road casualties (postmortems).
Monitoring of road casualties for purposes of mitigation.
Dietary studies where there are conflicts with still-water fisheries.
Medium priority
Review of the impact of toxic chemicals.Development of DNA fingerprinting.
Low priority
Studies of otter population biology in lowland areas of England and Wales.
Dietary studies in lowland areas of England and Wales.
Ecology of the European Otter
43

Conclusions
This review has shown that, at present, there is no evidence to suggest that the recolonisation ofBritain by otters will not continue.The impact of some factors that had previously been considered toimpose constraints on otters’ ability to exploit some waterways may have been over-estimated –anthropogenic disturbance and the availability of suitable resting sites, for example.While the actualeffects of toxic chemicals in the past are only now being elucidated, there is a general consensus that allthe likely candidates for causing the decline in otter populations are now present at low levels and thatthey are unlikely to inhibit recolonisation in much of Britain.
There is scope for further clarification of the biology of otters, particularly in lowland areas, and it isimportant to ensure that the population continues to be monitored, both in terms of its distributionand various aspects of the health of individuals (disease, pollutants, etc.).
The greatest potential for enhancing the long-term conservation status of otters lies in tackling factorsthat reduce the food supply below its natural level. One of these, the effects of pollution by sheep dips,is being undertaken by the Environment Agency, which has promoted a Sheep Dip Strategy involvingthe production of a code of practice under the Groundwater Regulations 1998 (Environment Agencyundated c).The agency is also aware of, and addressing the issues of, siltation and channel management,but significant improvements in these areas will involve a wide range of interests, such as theconstruction and road-building industries, agriculture, forestry and flood prevention. English Nature hasproduced position papers on managing floodplains to reduce flood risk and enhance biodiversity, andon reducing pollution from diffuse agricultural sources, the latter focusing particularly on SACs andSSSIs (Sites of Special Scientific Interest).
In the past the otter has been used as a ‘flagship’ species for conservation activities on a relatively smallscale.Whether it can be used to promote long-term, sustainable strategies for management ofwaterways at the catchment level is unclear, but there is no doubt that if it can, there would besignificant benefits to the otter population, as well as the aquatic and riparian environment generally.
Conserving Natura 2000 Rivers
44
Steve Chadd/English Nature
Acknowledgements
I would like to thank many colleagues who have provided me with information, ideas, contacts andother forms of help. Ann Skinner’s patience and support is particularly appreciated.
The following have been particularly helpful in making certain sources of information available to meand discussing their views on otters and conservation: Jessa Battersby (JNCC), Johnny Birks (VincentWildlife Trust), Jim Conroy, Don Jefferies, Hans Kruuk,Tony Mitchell-Jones (English Nature), LisaSchneidau and staff of the Otters and Rivers Project (see Appendix D).
The help and support I have had from Environment Agency staff has been overwhelming. Lyn Jenkins,Teg Jones and Andrew Crawford have been particularly kind, and I would like to thank Nichola Salterfor helping me get to the bottom of the silt problem. The patience of staff in the water quality andfisheries sections of the Southwest,Thames and Midland regions (listed in appendices B and D) is verymuch appreciated.
Piran White, Adam Grogan and Beth Simmons have kindly helped me by making unpublished data andpapers available.
I am extremely grateful to Graham Scholey, Jim Conroy, Liz Halliwell, Ruth Warren,Tim Sykes and TonyMitchell-Jones for their helpful comments on the first draft of this report.
References
Andrews E, Howell P & Johnson K (1993). Otter Survey of Wales 1991.Vincent Wildlife Trust, London.
Ansorge H, Schipke R & Zinke O (1997). Population structure of the otter, Lutra lutra: Parameters and model for acentral European region. Z. Saugetierk 62, 3, 143–151.
Bas N, Jenkins D & Rothery P (1984). Ecology of otters in northern Scotland 5:The distribution of otter (Lutralutra) faeces in relation to bankside vegetation on the river Dee in summer 1981. Journal of Applied Ecology 21, 2,507–513.
Beja PR (1995). Structure and seasonal fluctuations of rocky littoral fish assemblages in south-western Portugal:implications for otter prey availability Journal of Marine Biological Association UK 75, 4, 833–847.
Beja PR (1996a). Seasonal breeding and food resources of otters, Lutra lutra (Carnivora, Mustelidae), in south-westPortugal:A comparison between coastal and inland habitats. Mammalia 60, 1, 27–34.
Beja PR (1996b).Temporal and spatial patterns of rest-site use by four female otters Lutra lutra along the south-west coast of Portugal. Journal of Zoology 39, 4, 741–753.
Beja PR (1996c). An analysis of otter Lutra lutra predation on introduced American crayfish Procambarus clarkii inIberian streams. Journal of Applied Ecology 33, 5, 1156–1170.
Beja PR (1997). Predation by marine-feeding otters (Lutra lutra) in south-west Portugal in relation to fluctuatingfood resources Journal of Zoology 242, 3, 503–518.
Bielinski A (1993). Otters in Northumberland. In: Morris, PA (ed) Proceedings of the National Otter Conference:Mammal Society, Bristol, 38–40.
Bradshaw AV (1999). Aspects of otter Lutra lutra mortality in England and Wales. Unpublished PhD thesis, Universityof Cardiff,Wales.
Bradshaw AV (2001). Unpublished paper presented at the Mammal Society Annual Conference, April 2001.
Brazier M & Mathias L (2001). Otters – fish prey availability, biomass and sustainability – a preliminary report. R&DTechnical Report W256. Environment Agency, Bristol. 43 pp.
Brooker, MP (1985).The ecological effects of channelization. Geographical Journal 151, 63–69.
Brzezinski M, Jedrzejewski W & Jedrzejewska B (1993). Diet of otters (Lutra lutra) inhabiting small rivers in theBialowieza National Park, eastern Poland. Journal of Zoology 230, 3, 495–501.
Ecology of the European Otter
45

Carss DN & Elston DA (1996). Errors associated with otter Lutra lutra faecal analysis. 2: Estimating prey sizedistribution from bones recovered in spraints. Journal of Zoology 238, 2, 319–332.
Carss DN & Nelson KC (1998). Cyprinid prey remains in otter Lutra lutra faeces: some words of caution. Journalof Zoology 245, 2, 238–244.
Carss DN & Parkinson SG (1996). Errors associated with otter Lutra lutra faecal analysis. 1:Assessing general dietfrom spraints. Journal of Zoology 238, 2, 301–317.
Carss DN, Kruuk H & Conroy JWH (1990). Predation on adult Atlantic salmon, Salmo salar L, by otters, Lutra lutra(L), within the river Dee system, Aberdeenshire, Scotland. Journal of Fish Biology 37, 6, 935–944.
Cassens, I,Tiedemann R, Suchentrunk F & Hartl GB (2000). Mitochondrial DNA variation in the European otter(Lutra lutra) and the use of spatial autocorrelation analysis in conservation. Journal of Heredity 91, 1, 31–35.
Chanin P (1981).The diet of the otter and its relations with the feral mink in two areas of southwest England.Acta Theriol. 26, 83–95.
Chanin P (1991). Otter. In: Corbet GB & Harris S (eds). The Handbook of British Mammals. Blackwell ScientificPublications, Oxford, 424-431.
Chanin P (2001). Otter Road Casualties: A survey of the A30,A38 and M5 in Devon and Cornwall. Unpublished report.Highways Agency, London. 58pp.
Chanin P & Jefferies DJ (1978).The decline of the otter Lutra lutra L in Britain: an analysis of hunting records anddiscussion of causes. Biol. J. Linn. Soc .10, 3, 305–328.
Chapman PJ & Chapman LL (1982). Otter Survey of Ireland 1980-81. Vincent Wildlife Trust, London.
Christensen H (1995). Determinants of otter (Lutra lutra) distribution in Norway. Unpublished PhD thesis,University of Trondheim,Trondheim, Norway.
Coghill I (1980). Otter resting sites in North Wales. Unpublished paper presented at the Mammal Society AnnualConference, April 1980.
Conroy J & Calder D (2000). Otters Lutra lutra killing mountain hares, Lepus timidus. IUCN Otter Spec. GroupBull.17, 1, 52–55.
Conroy JWH & Carss DN (2001). Review of contaminant data for otters in Scotland & Northern Ireland. Unpublishedreport to the Scotland and Northern Ireland Forum for Environmental Research (SNIFFER), Edinburgh. 143pp.
Conroy JWH,Yoxon P & Gutleb AC (eds) (2002). Proceedings of the First Otter Toxicology Conference. InternationalOtter Survival Fund, Isle of Skye, Scotland.
Conroy J & Chanin P (2001).The distribution and status of the European Otter (Lutra lutra) – a Review. In:Conroy JWH, Gutleb A & Yoxon P (eds). Proceedings of the Otter Toxicology Conference, Skye 2000. InternationalOtter Survival Fund. Broadford, Skye.
Conroy JWH & French DD (1985). Monitoring Otters in Shetland. Unpublished report to Shetland Oil TerminalAdvisory Group, ITE project 815. Institute of Terrestrial Ecology, Banchory.
Conroy JWH & Kruuk H (1995). Changes in otter numbers in Shetland between 1988 and 1993. Oryx 29, 3,197–204.
Cowell D,Thomas G, Liles G, Bradshaw A, Midgley L & Slater F (2001). Monitoring the use of artificial log pileholts using hair analysis from bedding. IUCN Otter Spec. Group Bull. 18, 1, 6–10.
Coxon K, Chanin P, Dallas JF & Sykes T (1999).The use of DNA fingerprinting to study the population dynamicsof otters (Lutra lutra) in southern Britain: a feasibility study. R&D Technical Report W202, Environment Agency,Swindon. 123 pp.
Crawford A (2003). Fourth Otter Survey of England.Technical Report W1-061/TR. Environment Agency, Bristol.
Dallas JF & Piertney SB (1998). Microsatellite primers for the European otter. Molecular Ecology 7, 9, 1248–1251.
Dallas JF, Bacon PJ, Carss DN, Conroy JWH, Green R, Jefferies DJ, Kruuk H, Marshall F, Piertney SB & Racey PA(1999). Genetic diversity in the European otter, Lutra lutra, in Scotland: Evidence from microsatellite polymorphismBiol. J. Linn. Soc. 68, 1–2, 73–86.
Conserving Natura 2000 Rivers
46
Durbin LS (1993). Food and habitat utilisation of otters (Lutra lutra L) in a riparian habitat – the River Don in north-eastScotland. Unpublished PhD thesis, University of Aberdeen.
Durbin LS (1996). Individual differences in spatial utilization of a river-system by otters Lutra lutra. Acta Theriol 412, 137–147.
Durbin LS (1998). Habitat selection by five otters Lutra lutra in rivers of northern Scotland. Journal of Zoology 245,1, 85–92.
Elmeros M & Madsen AB (1999). On the reproduction biology of otters (Lutra lutra) from Denmark. Z. Saugetierk64, 4, 193–200.
Environment Agency (1999). Otters and river habitat management. Environment Agency, Bristol.
Environment Agency (undated a). Diffuse pollution from agriculture: a field guide. R&D publication 13. EnvironmentAgency, Bristol.
Environment Agency (undated b). River rehabilitation: Practical aspects from 16 case studies. Output from R&Dproject W1-027. Environment Agency, Bristol.
Environment Agency (undated c). Pesticides 1998:A summary of monitoring of the aquatic environment in England andWales. Environment Agency, Bristol.
Erlinge S 1967a). Home range of the otter Lutra lutra L in Southern Sweden. Oikos 18, 186–209.
Erlinge S (1967b). Food habits of the fish otter (Lutra lutra L) in south Swedish habitats. Viltrevy 4, 371–443.
Erlinge S (1968).Territoriality of the otter Lutra lutra L. Oikos 19, 81–98.
Farr-Cox F (1996). Eel populations in rivers in the 'Somerset' catchment. Somerset Archaeology and Natural History140, 5, 209–212.
Gorman ML, Kruuk H, Jones C, McClaren G & Conroy JWH (1998).The demography of European otters Lutralutra. Symp. Zool. Soc. Lond. 71, 107–118.
Green R & Green J (1997). Otter Survey of Scotland 1991–1994 . Vincent Wildlife Trust, London.
Green J, Green R & Jefferies DJ (1984).A radio-tracking survey of otters Lutra lutra on a Perthshire river system.Lutra 27, 85–145.
Grigor'ev ND, Egorov YE (1969). On the biocenotic connections of the American mink with the river otter in theBashkir SSR. Sb Trudy Vsesoyuznogo Nauchno-Issledovatel Skogo Instituta Zhivotnogo Syr'ya I Pushniny 22, 26–32.
Grogan AL, Philcox CK & Macdonald DW (2001). Nature conservation and roads: advice in relation to otters.Unpublished report to the Highways Agency, London.
Gutleb AC & Kranz A (1998). Estimation of polychlorinated biphenyl (PCB) levels in livers of the otter (Lutra lutra)from concentrations in scats and fish. Water Air and Soil Pollution 106, 3–4, 481–491.
Harper RJ (1981). Sites of 3 otter (Lutra lutra) breeding holts in fresh-water habitats. Journal of Zoology 195, 4,554–556.
Harris CJ (1968). Otters: a study of the recent Lutrinae. Weidenfeld and Nicholson, London.
Harris S, Morris P, Wray S & Yalden P (1995). A review of British mammals. Joint Nature Conservation Committee,Peterborough.
Hauer S,Ansorge H & Zinke O (2000). A long-term analysis of the age structure of otters (Lutra lutra) fromeastern Germany. Z. Saugetierk 65, 360–368.
Heggberget TM (1984). Age determination in the European otter Lutra lutra lutra. Z. Saugetierk 49, 5, 299–305.
Heggberget TM (1991). Sex and Age distribution in European otters (Lutra lutra) killed by human activity. Habitat 6,123–125.
Heggberget TM & Christensen H (1994). Reproductive timing in European otters on the coast of Norway.Ecography 17, 4, 339–348.
Holdich D (2003) Ecology of the White-clawed Crayfish. Conserving Natura 2000 Rivers Ecology Series No. 1. EnglishNature, Peterborough.
Ecology of the European Otter
47
Hovens JPM (1992). Microverontreinigingen in water-bodems en visbiota in Nederland: de visotter (Lutra lutra) alsnormsteller. Stichting Otterstation, Groningen, Nederland.
Jacobsen L & Hansen HM (1996). Analysis of otter (Lutra lutra) spraints 1: Comparison of methods to estimateprey proportions; 2: Estimation of the size of prey fish. Journal of Zoology 238, 1, 167–180.
Jefferies DJ (1987).The effects of angling interests on otters, with particular reference to disturbance. In: Anglingand wildlife in fresh waters (ITE symposium No. 19). Institute of Terrestrial Ecology, Grange over Sands.
Jefferies DJ (1988). Otters Crossing Watersheds. J. Otter Trust 2, 2, 17–19.
Jefferies DJ & Hanson HM (2001).The role of dieldrin in the decline of the otter in Britain: the analytical data. In:Conroy JWH, Gutleb A & Yoxon P (eds). Proceedings of the Otter Toxicology Conference, Skye 2000. InternationalOtter Survival Fund, Broadford, Skye.
Jefferies DJ,Wayre P, Jessop RM & Mitchell-Jones AJ (1986). Reinforcing the native otter Lutra lutra population inEast Anglia – an analysis of the behaviour and range development of the first release group. Mammal Review, 16, 2,65–79.
Jenkins D (1980). Ecology of otters in northern Scotland: I otter (Lutra lutra) breeding and dispersion in mid-Deeside,Aberdeenshire, in 1974-79. J. Anim. Ecol. 49, 713–735.
Jenkins D & Burrows GO (1980). Ecology of otters in northern Scotland: III the use of faeces as indicators ofotter (Lutra lutra) density and distribution. J. Anim. Ecol. 49, 755–744.
Jurisch C & Geidezis L (1997). Minimum passage rate of fishes through the digestive tract of otters Lutra lutraLinne., 1758 (Mustelidae). Mammalia, 61, 1, 123–126.
Knights B, Bark A, Ball M,Williams F,Winter E & Dunn S (2001). Eel and elver stocks in England and Wales – statusand management options. R&D Technical report W248. Environment Agency, Bristol.
Kruuk H (1995). Wild otters: Predation and populations. Oxford University Press, Oxford.
Kruuk H (1997).The significance of PCBs in otters: a reply. IUCN Otter Spec. Group Bull. 14, 2, 54–56.
Kruuk H & Conroy JWH (1996). Concentrations of some organochlorines in otters (Lutra lutra L) in Scotland -implications for populations. Environmental Pollution, 92, 2, 165–171.
Kruuk H, Carss DN, Conroy JWH, Durbin L (1993). Otter (Lutra lutra L) numbers and fish productivity in rivers innorth-east Scotland. Symp. Zool. Soc. Lond. 65, 171–191.
Kruuk H, Carss DN, Conroy JWH & Gaywood MJ (1998). Habitat use and conservation of otters (Lutra lutra) inBritain: a review. Symp. Zool. Soc. Lond. 71, 119–134.
Kruuk H, Conroy JWH, & Moorhouse A (1987). Seasonal reproduction, mortality and food of otters Lutra lutra Lin Shetland. Symp. Zool. Soc. Lond. 58, 263–278.
Kruuk H, Conroy JWH & Webb A (1997). Concentrations of mercury in otters (Lutra lutra L) in Scotland inrelation to rainfall. Environmental Pollution 96, 1, 13–18.
Kruuk H, Moorhouse A, Conroy JWH, Durbin L & Frears S (1989). An estimate of numbers and habitatpreferences of otters Lutra lutra in Shetland, UK. Biol. Conserv. 49, 4, 241–254.
Kruuk H, Nolet B & French D (1988). Fluctuations in numbers and activity of inshore demersal fishes in Shetland.Journal of Marine Biological Association UK, 68, 601–617.
Leonards PEG, Smit MD, de Jongh AWJJ & van Hattum B (1994). Evaluation of dose-response relationships for theeffect of PCBs on the reproduction of mink (Mustela vison). Institute for Environmental Studies, Free University ofAmsterdam,Amsterdam.
Liles G & Colley R (2000). Otter (Lutra lutra) road deaths in Wales. Unpublished report to the EnvironmentAgency, Cardiff.
Liles G & Colley R (2001). Otter (Lutra lutra) road mortalities: a procedure for the implementation of mitigationmeasures. Unpublished report to the Environment Agency, Cardiff.
Macdonald SM & Mason CF (1983). Some factors influencing the distribution of otters (Lutra lutra). MammalReview, 13, 1, 1–10.
Conserving Natura 2000 Rivers
48
Macdonald SM & Mason CF (1994). Status and Conservation need of the otter (Lutra lutra) in the western Palaearctic.Council of Europe, Strasbourg. 54 pp.
MAFF (1999a). Controlling soil erosion: an advisory booklet for the management of agricultural land. MAFF Publications,London.
MAFF (1999b). Controlling soil erosion: a manual for the assessment and management of agricultural land at risk ofwater erosion in lowland England. MAFF Publications, London.
Mañas S, Ceña JC, Ruiz-Olmo J, Palazón S, Domingo M,Wolfinbarger JB & Bloom ME (2001).Aleutian mink diseaseparvovirus in wild riparian carnivores in Spain. J.Wildlife Diseases, 37, 1, 138–144.
Mason CF (1989).Water pollution and otter distribution: a review. Lutra, 32, 2, 97–131.
Mason CF (1995). Habitat quality, water quality and otter distribution. Hystrix 7, 195–207.
Mason CF (1997).The significance of PCBs in otters at national and regional scales. IUCN Otter Spec. Bull., 14, 1,3–12.
Mason CF (1998). Decline in PCB levels in otters (Lutra lutra). Chemosphere, 36, 9, 1969–1971.
Mason CF & Macdonald SM (1982).The input of terrestrial invertebrates from tree canopies to a streamFreshwater Biology, 12, 305–311.
Mason CF & Macdonald,SM (1986). Otters: Ecology and conservation. Cambridge University Press, Cambridge.
Mason CF & Macdonald SM (1988). Metal contamination in mosses and otter distribution in a rural welsh riverreceiving mine drainage. Chemosphere, 17, 6, 1159–1166.
Mason CF & Macdonald SM (1989). Acidification and otter (Lutra lutra) distribution in Scotland Water Air and SoilPollution, 43, 3-4, 365–374.
Mason,CF & Macdonald SM (1994). PCBs and organochlorine pesticide residues in otters (Lutra lutra) and in otterspraints from SW England and their likely impact on populations. Science of the Total Environment 144, 305–312.
Mason CF, Ford TC & Last NI (1986). Organochlorine residues in British otters. Bulletin of EnvironmentalContamination and Toxicology, 36, 5, 656–661.
Mason CF, Last NI & Macdonald SM (1986). Mercury, cadmium, and lead in British otters. Bulletin of EnvironmentalContamination and Toxicology, 37, 6, 844–849.
Mason CF, Macdonald SM, & Aspden VJ (1982). Metals in freshwater fishes in the United Kingdom 1980-81.Vincent Wildlife Trust, London.
Melquist WE & Hornocker MG (1983). Ecology of river otters in west central Idaho. Wildlife Monographs 83, 1–60.
Moorhouse A (1988). Distribution of holts and their utilisation by the European otter (Lutra lutra L) in a marineenvironment. Unpublished MSc thesis, University of Aberdeen.
Mucci N, Pertoldi C, Madsen AB, Loeschcke V & Randi E (1999). Extremely low mitochondrial DNA control-region sequence variation in the otter Lutra lutra population of Denmark. Hereditas, 130, 3, 331–336.
Murk AJ, Leonards PEG, van Hattum B, Luit R, vander Weiden MEJ & Smit M (1998). Application of biomarkers forexposure and effect of polyhalogenated aromatic hydrocarbons in naturally exposed European otters (Lutra lutra).Environmental Toxicology and Pharmacology 6, 2, 91–102.
Nores C, Hernández-Palacios O, García-Gaona JF & Naves J (1990). Distribución de señales de nutria (Lutra lutra)en el medio ribereño cantábrico en relación con los factores ambientales. Revta Bio.l Uni. Oviedo, 8, 107–117.
O'Connor FB, Sands TS, Barwick D, Chanin P, Frazer JFD, Jefferies DJ, Jenkins D & Neal E (1977). Otters 1977:Thereport of the Joint Otter Group). Nature Conservancy Council, London.
O'Connor FB,Wood MS, Chanin P, Jefferies DJ, Jenkins D, Neal E, Rudge J, Sands TS & Weir V (1979). Otters 1979:The second report of the Joint Otter Group. Society for the Promotion of Nature Conservation, Lincoln.
Olsson M, Jensen S & Reutergårdh L (19780. Seasonal variation of PCB levels in fish – an important factor inplanning aquatic monitoring programs. Ambio 7, 66–69.
Ecology of the European Otter
49

O'Sullivan WM (1993). Studies of the distribution, ecology, habitat requirements and mortality of the otter (Lutra lutra) inCo. Cork and effects of drainage and toxic contamination of the species. Unpublished PhD thesis, University College,Cork.
Philcox CK, Grogan AL & Macdonald DW (1999). Patterns of otter Lutra lutra road mortality in Britain J. Appl. Ecol.36, 5, 748–762.
Pikulik MM & Sidorovich VE (1996). Seasonal prevalence in otter reproduction and amphibian availability. DokladyAkademii Nauk Belarusi, 40, 6, 80–83.
Prenda J & Granado-Lorencio C (1996).The relative influence of riparian habitat structure and fish availability onotter Lutra lutra L: sprainting activity in a small Mediterranean catchment. Biol. Conserv. 76, 1, 9–15.
Reuther C, Dolch D, Green R, Jahrl J, Jefferies D, Krekemeyer A, Kucerova M, Madsen AB, Romanowski J, Roche K,Ruiz-Olmo J,Teubner J & Trinidae A (2000). Surveying and monitoring distribution and population trends of theEuropean otter (Lutra lutra). Habitat 12, 1–148.
Roos A, Greyerz E, Olsson M & Sandegren F (2001).The otter (Lutra lutra) in Sweden – population trends inrelation to DDT and total PCB concentrations during 1968-99. Environmental Pollution, 111, 457–469.
Ruiz-Olmo J (1998). Influence of altitude on the distribution, abundance and ecology of the otter (Lutra lutra).Symp. Zool Soc. Lond. 71, 159–178.
Ruiz-Olmo J, Delibes M & Zapata SC (1998). External morphometry, demography and mortality of the otter Lutralutra (Linnaeus, 1758) in the Iberian peninsula. Galemys, 10, 239–251.
Shore RF & Rattner BA (eds) (2001). Ecotoxicology of Wild Mammals. John Wiley, London. 730 pp.
Sidorovich VE (1991). Structure, reproductive status and dynamics of the otter population in Belorussia. ActaTheriol 36, 1–2, 153–161.
Simpson VR (1998). A post mortem study of otters (Lutra lutra) found dead in south west England. R&D Technicalreport W148. Environment Agency, Swindon.
Simpson VR & Coxon KE (2000). Otter Cannibalism. British Wildlife, 11, 423–426.
Simpson VR, Bain MS, Brown R, Brown BF & Lacey RF (2000). A long-term study of vitamin A deficiency andpolychlorinated hydrocarbon levels in otters Lutra lutra in south west England. Environmental Pollution, 110,267–275.
Smit MD, Leonards PEG, Hattum B van & de Jongh AWJJ (1994). PCBs in European otter (Lutra lutra) populations.Institute for Environmental Studies (Free University of Amsterdam),Amsterdam. 77 pp.
Smit MD, Leonards PEG, Murk AJ, de Jongh AWJJ & van Hattum B (eds) (1996). Development of otter-based qualityobjectives for PCBs. Institute for Environmental Studies, (Free University of Amsterdam),Amsterdam. 129 pp.
Stephens MN (1957). The otter report. Universities Federation for Animal Welfare, London.
Strachan R (1998). Water vole conservation handbook. Wildlife Conservation Research Unit, Oxford.
Strachan R, & Jefferies DJ (1996). Otter Survey of England 1991–1994. Vincent Wildlife Trust, London.
Taastrøm HM & Jacobsen L (1999).The diet of otters (Lutra lutra L) in Danish freshwater habitats: comparisons ofprey fish populations. Journal of Zoology 248, 1, 1–13.
Taylor PS & Kruuk H (1990).A record of an otter (Lutra lutra) natal den. Journal of Zoology 222, 4, 689–692.
Thom TJ (1997). Factors affecting the distribution of otter (Lutra lutra L) signs in the upper Tyne catchment, NE England.Unpublished PhD Thesis, University of Durham.
Twelves J (1983). Otter (Lutra lutra) mortalities in lobster creels. Journal of Zoology 201, 4, 585–588.
Watt JP (1993). Prey selection by coastal otters (Lutra lutra L). Unpublished PhD Thesis, University of Aberdeen.
Watt J (1995). Seasonal and area related variations in the diet of otters Lutra lutra on Mull. Journal of Zoology 237,2, 179–194.
Weber JM (1990). Seasonal exploitation of amphibians by otters (Lutra lutra) in north-east Scotland. Journal ofZoology 220, 4, 641–651.
Conserving Natura 2000 Rivers
50

Weir V & Bannister KE (1973).The food of the otter in the Blakeney area. Trans. Norf. Norw. Nats. Soc. 22, 377–382.
Wells GAH, Keymer IF, Barnett KC (1989). Suspected aleutian disease in a wild otter (Lutra lutra). Vet. Rec. 125, 9,232–235.
White PCL, McClean CJ,Woodroffe GL, Baker JE & Hutchings CE (in press).A spatial analysis of habitat use by areinforced otter population using GIS. J. Appl. Ecol.
Wise MH (1978). The feeding ecology of otters and mink in Devon. Unpublished PhD Thesis, University of Exeter.
Wise MH, Linn IJ & Kennedy CR (1981). A comparison of the feeding biology of mink Mustela vison and otterLutra lutra. Journal of Zoology 195, 181–213.
Ecology of the European Otter
51

Conserving Natura 2000 Rivers
52
Appendix A:The diet of the European otter
The following tables summarise the diets of otters, determined by a wide range of studies throughoutEurope. Criteria for inclusion in the list were that the study had to cover the whole year, include morethan 300 spraints (or observations) and be compatible with other data.
In each case the values used were recalculated to express the diet in the form of percentageoccurrence of items, excluding non-significant matter (plant material, insects, small crustaceans ormolluscs). Summaries of the data are provided (and included in the main text).
All studies in fresh water are based on analysis of spraints. Some studies in coastal areas are based onspraint analysis; others on direct observation.
Country N Fish Mammal Bird Reptile Amphibia Crayfish
Ireland 1709 62.6 0.2 1.5 0.0 10.1 25.6
Poland 379 80.0 0.3 0.0 0.0 18.3 1.3 Spain 367 57.0 5.5 1.3 0.9 0.5 34.8 Spain 598 66.2 0.6 0.3 2.2 12.3 18.3 Sweden 14615 67.7 0.6 9.3 0.0 8.1 14.3 England 353 94.0 4.3 1.1 0.0 0.6 0.0 England 607 91.4 7.1 1.0 0.0 0.5 0.0 England 858 86.6 0.4 4.9 0.0 8.1 0.0 Scotland 1180 74.9 3.0 1.8 0.0 20.3 0.0 Spain 2145 70.4 0.4 6.7 9.1 13.4 0.0 Ireland 2349 51.1 0.0 2.0 0.0 15.9 20.9 Portugal 2883 53.2 0.0 0.5 1.4 16.4 28.6 Hungary 873 76.5 1.5 7.2 0.8 14.0 0.0 Finland 1506 65.2 11.4 3.2 0.0 17.1 3.0 Belarus 641 49.8 0.2 1.4 0.0 36.7 11.8
Table A1. Diets of otters in freshwater habitats, expressed as frequency of occurrence (%).
N = sample sizeSee list at end of appendix for sources of data
Table A2. Summaries for freshwater habitats.
Fish Mammal Bird Reptile Amphibia Crayfish
Maximum 94.0 11.4 9.3 9.1 36.7 34.8
Minimum 49.8 0.0 0.0 0.0 0.5 0.0
Mean 69.8 2.4 2.8 1.0 12.8 10.6
Median 67.7 0.6 1.5 0.0 13.4 3.0
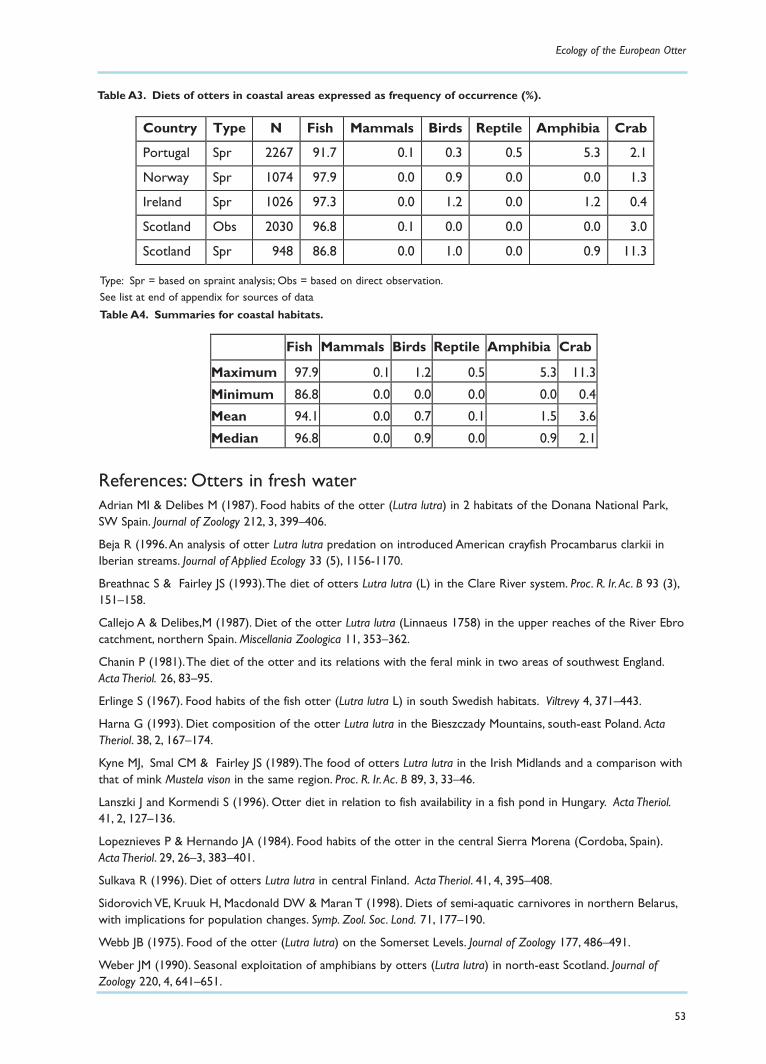
Ecology of the European Otter
53
References: Otters in fresh waterAdrian MI & Delibes M (1987). Food habits of the otter (Lutra lutra) in 2 habitats of the Donana National Park,SW Spain. Journal of Zoology 212, 3, 399–406.
Beja R (1996.An analysis of otter Lutra lutra predation on introduced American crayfish Procambarus clarkii inIberian streams. Journal of Applied Ecology 33 (5), 1156-1170.
Breathnac S & Fairley JS (1993).The diet of otters Lutra lutra (L) in the Clare River system. Proc. R. Ir. Ac. B 93 (3),151–158.
Callejo A & Delibes,M (1987). Diet of the otter Lutra lutra (Linnaeus 1758) in the upper reaches of the River Ebrocatchment, northern Spain. Miscellania Zoologica 11, 353–362.
Chanin P (1981).The diet of the otter and its relations with the feral mink in two areas of southwest England.Acta Theriol. 26, 83–95.
Erlinge S (1967). Food habits of the fish otter (Lutra lutra L) in south Swedish habitats. Viltrevy 4, 371–443.
Harna G (1993). Diet composition of the otter Lutra lutra in the Bieszczady Mountains, south-east Poland. ActaTheriol. 38, 2, 167–174.
Kyne MJ, Smal CM & Fairley JS (1989).The food of otters Lutra lutra in the Irish Midlands and a comparison withthat of mink Mustela vison in the same region. Proc. R. Ir. Ac. B 89, 3, 33–46.
Lanszki J and Kormendi S (1996). Otter diet in relation to fish availability in a fish pond in Hungary. Acta Theriol.41, 2, 127–136.
Lopeznieves P & Hernando JA (1984). Food habits of the otter in the central Sierra Morena (Cordoba, Spain).Acta Theriol. 29, 26–3, 383–401.
Sulkava R (1996). Diet of otters Lutra lutra in central Finland. Acta Theriol. 41, 4, 395–408.
Sidorovich VE, Kruuk H, Macdonald DW & Maran T (1998). Diets of semi-aquatic carnivores in northern Belarus,with implications for population changes. Symp. Zool. Soc. Lond. 71, 177–190.
Webb JB (1975). Food of the otter (Lutra lutra) on the Somerset Levels. Journal of Zoology 177, 486–491.
Weber JM (1990). Seasonal exploitation of amphibians by otters (Lutra lutra) in north-east Scotland. Journal ofZoology 220, 4, 641–651.
Table A3. Diets of otters in coastal areas expressed as frequency of occurrence (%).
Country Type N Fish Mammals Birds Reptile Amphibia Crab
Portugal Spr 2267 91.7 0.1 0.3 0.5 5.3 2.1
Norway Spr 1074 97.9 0.0 0.9 0.0 0.0 1.3
Ireland Spr 1026 97.3 0.0 1.2 0.0 1.2 0.4
Scotland Obs 2030 96.8 0.1 0.0 0.0 0.0 3.0
Scotland Spr 948 86.8 0.0 1.0 0.0 0.9 11.3
Type: Spr = based on spraint analysis; Obs = based on direct observation.See list at end of appendix for sources of data
Table A4. Summaries for coastal habitats.
Fish Mammals Birds Reptile Amphibia Crab
Maximum 97.9 0.1 1.2 0.5 5.3 11.3
Minimum 86.8 0.0 0.0 0.0 0.0 0.4
Mean 94.1 0.0 0.7 0.1 1.5 3.6
Median 96.8 0.0 0.9 0.0 0.9 2.1

Conserving Natura 2000 Rivers
54
References: Coastal otters
Beja PR (1991). Diet of otters (Lutra lutra) in closely associated freshwater, brackish and marine habitats in south-west Portugal. Journal of Zoology 225, 1, 141–152.
Heggberget TM & Moseid KE (1994). Prey selection in coastal Eurasian otters Lutra lutra. Ecography 17, 4, 331–338.
Murphy KP & Fairley JS (1985). Food of otters Lutra lutra on the south shore of Galway Bay. Proc. R. Ir. Ac. B 85, 4,47–55.
Kruuk H & Moorhouse A (1990). Seasonal and spatial differences in food selection by otters (Lutra lutra) inShetland. Journal of Zoology 221, 4, 621–637.
Watt J (1995). Seasonal and area related variations in the diet of otters Lutra lutra on Mull. Journal of Zoology 237,2, 179–194.
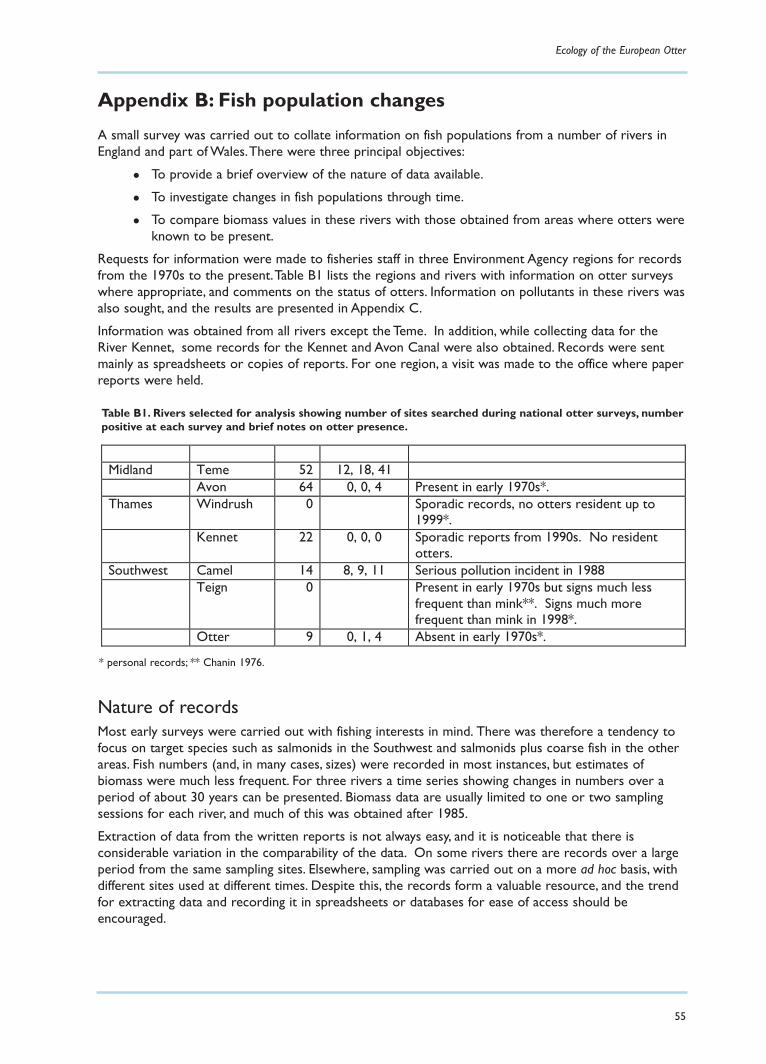
Ecology of the European Otter
55
Appendix B: Fish population changes
A small survey was carried out to collate information on fish populations from a number of rivers inEngland and part of Wales.There were three principal objectives:
To provide a brief overview of the nature of data available.
To investigate changes in fish populations through time.
To compare biomass values in these rivers with those obtained from areas where otters were known to be present.
Requests for information were made to fisheries staff in three Environment Agency regions for recordsfrom the 1970s to the present.Table B1 lists the regions and rivers with information on otter surveyswhere appropriate, and comments on the status of otters. Information on pollutants in these rivers wasalso sought, and the results are presented in Appendix C.
Information was obtained from all rivers except the Teme. In addition, while collecting data for theRiver Kennet, some records for the Kennet and Avon Canal were also obtained. Records were sentmainly as spreadsheets or copies of reports. For one region, a visit was made to the office where paperreports were held.
Nature of recordsMost early surveys were carried out with fishing interests in mind. There was therefore a tendency tofocus on target species such as salmonids in the Southwest and salmonids plus coarse fish in the otherareas. Fish numbers (and, in many cases, sizes) were recorded in most instances, but estimates ofbiomass were much less frequent. For three rivers a time series showing changes in numbers over aperiod of about 30 years can be presented. Biomass data are usually limited to one or two samplingsessions for each river, and much of this was obtained after 1985.
Extraction of data from the written reports is not always easy, and it is noticeable that there isconsiderable variation in the comparability of the data. On some rivers there are records over a largeperiod from the same sampling sites. Elsewhere, sampling was carried out on a more ad hoc basis, withdifferent sites used at different times. Despite this, the records form a valuable resource, and the trendfor extracting data and recording it in spreadsheets or databases for ease of access should beencouraged.
Table B1. Rivers selected for analysis showing number of sites searched during national otter surveys, numberpositive at each survey and brief notes on otter presence.
Midland Teme 52 12, 18, 41 Avon 64 0, 0, 4 Present in early 1970s*. Thames Windrush 0 Sporadic records, no otters resident up to
1999*. Kennet 22 0, 0, 0 Sporadic reports from 1990s. No resident
otters. Southwest Camel 14 8, 9, 11 Serious pollution incident in 1988 Teign 0 Present in early 1970s but signs much less
frequent than mink**. Signs much more frequent than mink in 1998*.
Otter 9 0, 1, 4 Absent in early 1970s*.
* personal records; ** Chanin 1976.
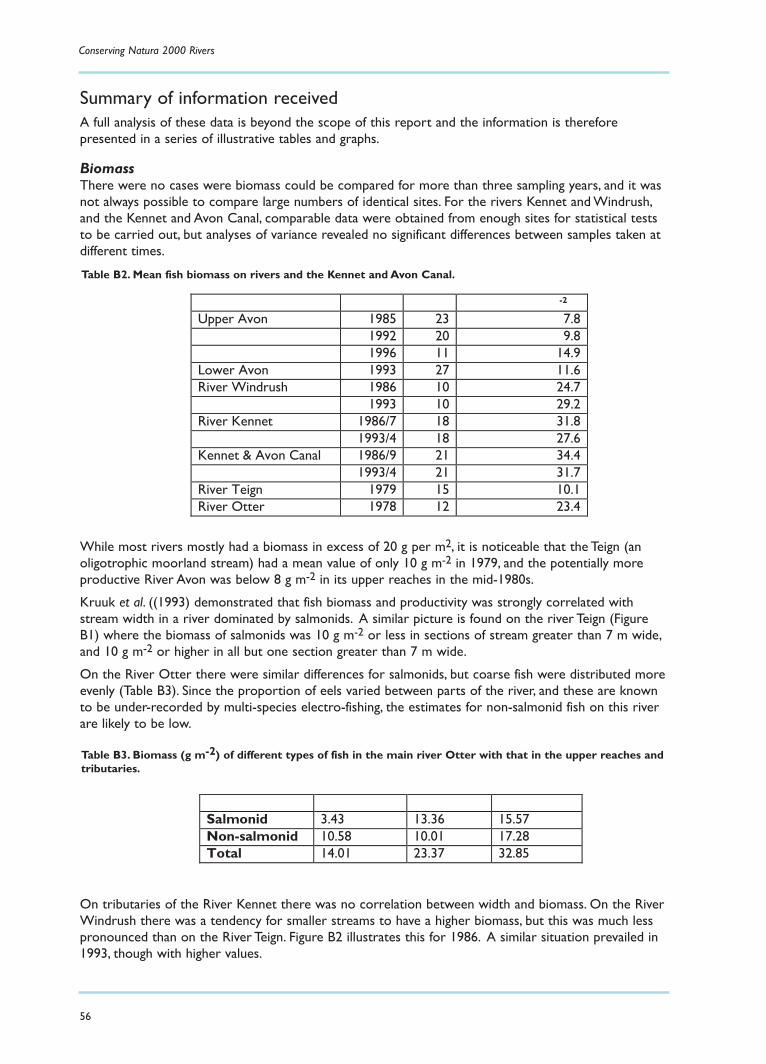
Conserving Natura 2000 Rivers
56
Summary of information receivedA full analysis of these data is beyond the scope of this report and the information is thereforepresented in a series of illustrative tables and graphs.
BiomassThere were no cases were biomass could be compared for more than three sampling years, and it wasnot always possible to compare large numbers of identical sites. For the rivers Kennet and Windrush,and the Kennet and Avon Canal, comparable data were obtained from enough sites for statistical teststo be carried out, but analyses of variance revealed no significant differences between samples taken atdifferent times.
While most rivers mostly had a biomass in excess of 20 g per m2, it is noticeable that the Teign (anoligotrophic moorland stream) had a mean value of only 10 g m-2 in 1979, and the potentially moreproductive River Avon was below 8 g m-2 in its upper reaches in the mid-1980s.
Kruuk et al. ((1993) demonstrated that fish biomass and productivity was strongly correlated withstream width in a river dominated by salmonids. A similar picture is found on the river Teign (FigureB1) where the biomass of salmonids was 10 g m-2 or less in sections of stream greater than 7 m wide,and 10 g m-2 or higher in all but one section greater than 7 m wide.
On the River Otter there were similar differences for salmonids, but coarse fish were distributed moreevenly (Table B3). Since the proportion of eels varied between parts of the river, and these are knownto be under-recorded by multi-species electro-fishing, the estimates for non-salmonid fish on this riverare likely to be low.
On tributaries of the River Kennet there was no correlation between width and biomass. On the RiverWindrush there was a tendency for smaller streams to have a higher biomass, but this was much lesspronounced than on the River Teign. Figure B2 illustrates this for 1986. A similar situation prevailed in1993, though with higher values.
Table B2. Mean fish biomass on rivers and the Kennet and Avon Canal.
-2
Upper Avon 1985 23 7.8 1992 20 9.8 1996 11 14.9
Lower Avon 1993 27 11.6 River Windrush 1986 10 24.7
1993 10 29.2 River Kennet 1986/7 18 31.8
1993/4 18 27.6 Kennet & Avon Canal 1986/9 21 34.4
1993/4 21 31.7 River Teign 1979 15 10.1 River Otter 1978 12 23.4
Table B3. Biomass (g m-2) of different types of fish in the main river Otter with that in the upper reaches andtributaries.
Salmonid 3.43 13.36 15.57 Non-salmonid 10.58 10.01 17.28 Total 14.01 23.37 32.85
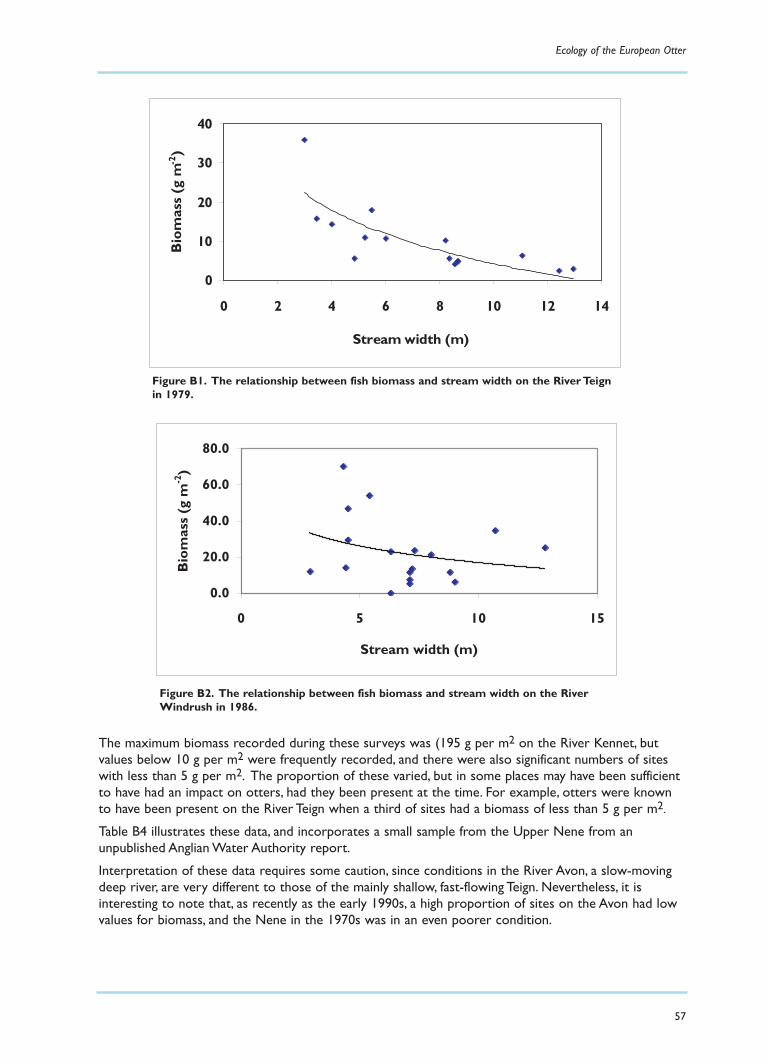
Ecology of the European Otter
57
The maximum biomass recorded during these surveys was (195 g per m2 on the River Kennet, butvalues below 10 g per m2 were frequently recorded, and there were also significant numbers of siteswith less than 5 g per m2. The proportion of these varied, but in some places may have been sufficientto have had an impact on otters, had they been present at the time. For example, otters were knownto have been present on the River Teign when a third of sites had a biomass of less than 5 g per m2.
Table B4 illustrates these data, and incorporates a small sample from the Upper Nene from anunpublished Anglian Water Authority report.
Interpretation of these data requires some caution, since conditions in the River Avon, a slow-movingdeep river, are very different to those of the mainly shallow, fast-flowing Teign. Nevertheless, it isinteresting to note that, as recently as the early 1990s, a high proportion of sites on the Avon had lowvalues for biomass, and the Nene in the 1970s was in an even poorer condition.
Figure B1. The relationship between fish biomass and stream width on the River Teignin 1979.
0
10
20
30
40
0 2 4 6 8 10 12 14
Stream width (m)
Bio
mas
s (g
m-2
)
Figure B2. The relationship between fish biomass and stream width on the RiverWindrush in 1986.
0.0
20.0
40.0
60.0
80.0
0 5 10 15
Stream width (m)
Bio
mas
s (g
m-2
)
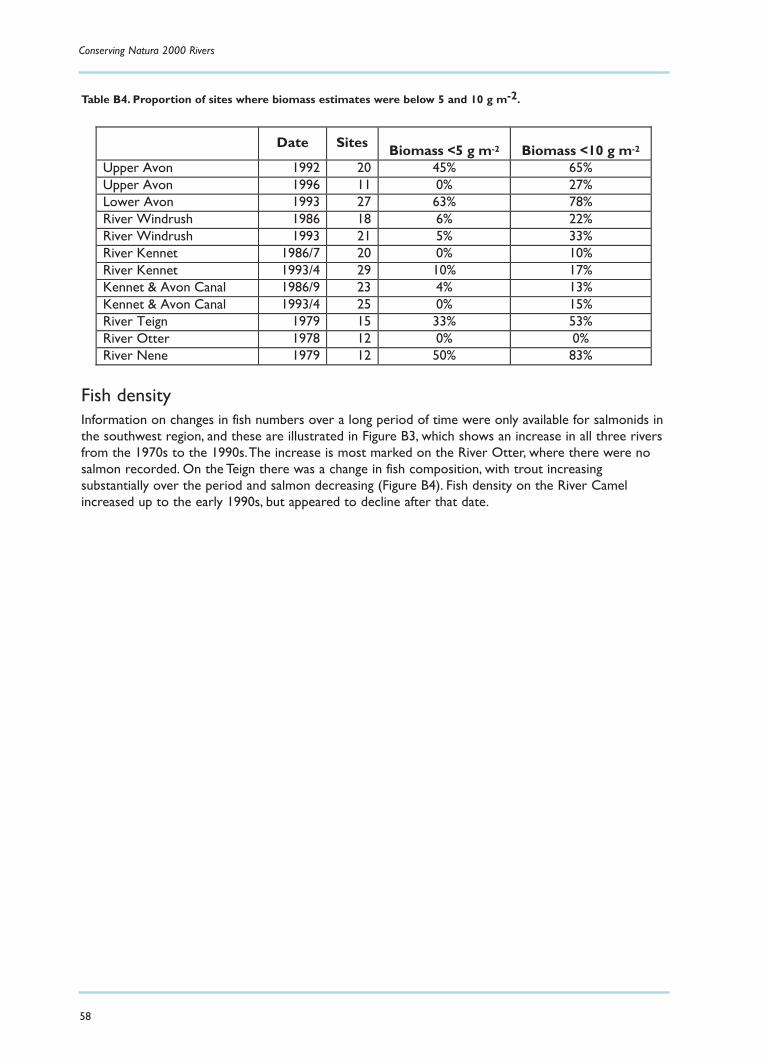
Conserving Natura 2000 Rivers
58
Fish densityInformation on changes in fish numbers over a long period of time were only available for salmonids inthe southwest region, and these are illustrated in Figure B3, which shows an increase in all three riversfrom the 1970s to the 1990s.The increase is most marked on the River Otter, where there were nosalmon recorded. On the Teign there was a change in fish composition, with trout increasingsubstantially over the period and salmon decreasing (Figure B4). Fish density on the River Camelincreased up to the early 1990s, but appeared to decline after that date.
Table B4. Proportion of sites where biomass estimates were below 5 and 10 g m-2.
Date Sites Biomass <5 g m-2 Biomass <10 g m-2 Upper Avon 1992 20 45% 65% Upper Avon 1996 11 0% 27% Lower Avon 1993 27 63% 78% River Windrush 1986 18 6% 22% River Windrush 1993 21 5% 33% River Kennet 1986/7 20 0% 10% River Kennet 1993/4 29 10% 17% Kennet & Avon Canal 1986/9 23 4% 13% Kennet & Avon Canal 1993/4 25 0% 15% River Teign 1979 15 33% 53% River Otter 1978 12 0% 0% River Nene 1979 12 50% 83%
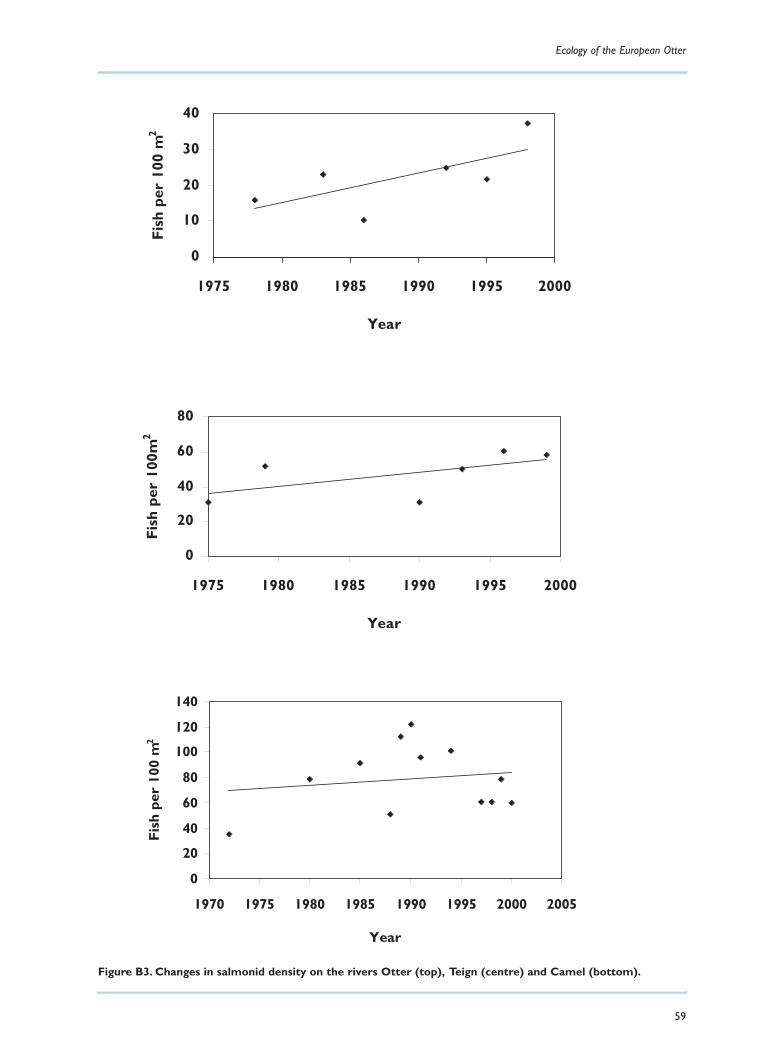
Ecology of the European Otter
59
0
10
20
30
40
1975 1980 1985 1990 1995 2000
Year
Fish
per
100
m2
Figure B3. Changes in salmonid density on the rivers Otter (top), Teign (centre) and Camel (bottom).
0
20
40
60
80
1975 1980 1985 1990 1995 2000
Year
Fish
per
100
m2
0
20
40
60
80
100
120
140
1970 1975 1980 1985 1990 1995 2000 2005
Year
Fish
per
100
m2
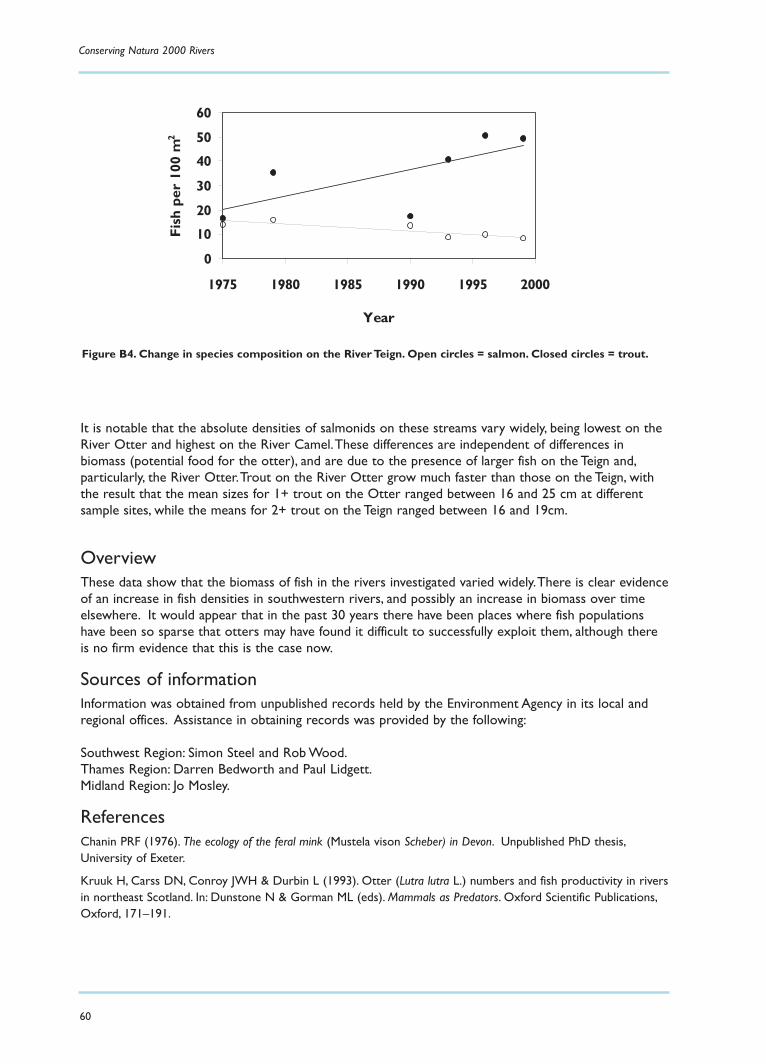
Conserving Natura 2000 Rivers
60
It is notable that the absolute densities of salmonids on these streams vary widely, being lowest on theRiver Otter and highest on the River Camel.These differences are independent of differences inbiomass (potential food for the otter), and are due to the presence of larger fish on the Teign and,particularly, the River Otter.Trout on the River Otter grow much faster than those on the Teign, withthe result that the mean sizes for 1+ trout on the Otter ranged between 16 and 25 cm at differentsample sites, while the means for 2+ trout on the Teign ranged between 16 and 19cm.
OverviewThese data show that the biomass of fish in the rivers investigated varied widely.There is clear evidenceof an increase in fish densities in southwestern rivers, and possibly an increase in biomass over timeelsewhere. It would appear that in the past 30 years there have been places where fish populationshave been so sparse that otters may have found it difficult to successfully exploit them, although thereis no firm evidence that this is the case now.
Sources of informationInformation was obtained from unpublished records held by the Environment Agency in its local andregional offices. Assistance in obtaining records was provided by the following:
Southwest Region: Simon Steel and Rob Wood.Thames Region: Darren Bedworth and Paul Lidgett.Midland Region: Jo Mosley.
ReferencesChanin PRF (1976). The ecology of the feral mink (Mustela vison Scheber) in Devon. Unpublished PhD thesis,University of Exeter.
Kruuk H, Carss DN, Conroy JWH & Durbin L (1993). Otter (Lutra lutra L.) numbers and fish productivity in riversin northeast Scotland. In: Dunstone N & Gorman ML (eds). Mammals as Predators. Oxford Scientific Publications,Oxford, 171–191.
0
10
20
30
40
50
60
1975 1980 1985 1990 1995 2000
Year
Fish
per
100
m2
Figure B4. Change in species composition on the River Teign. Open circles = salmon. Closed circles = trout.
Ecology of the European Otter
61
Appendix C: Changes in water quality in rivers
BackgroundInformation on water quality in the rivers Camel,Teign, Otter, Kennet,Windrush, Avon and Temewas sought from Environment Agency offices in the Southwest,Thames and Midland regions.
The amount of information available on this topic is immense, and it soon became clear that only themost superficial analysis would be possible.The most complete information came from the MidlandRegion and constituted 114,000 analyses from the River Avon, covering 209 sites and 2126 samplingdates between 1974 and 2001. A similar listing from the River Teme was about a quarter of the size.These data included analyses of the effects of pesticides on otters, but not of PCBs.
For the River Windrush, annual summary sheets were obtained for a number of sampling stations thatreported mean, minima and maxima for a range of organic and inorganic compounds, together withother water quality data (turbidity, dissolved oxygen, etc.).These included a wide range oforganochlorine pesticides and PCBs. No data were obtained for the Kennet.
Summary data were obtained from the Southwest Region for 1974–2001 for various pesticides andPCBs at selected sampling stations on the three rivers. These included mean, minima and maxima.
ValuesThe summarised data for the three southwestern rivers show low levels of PCBs (when measured) andorganochlorine pesticides throughout the period. Maximum yearly values of PCBs and pesticides are allbelow 0.01mg l-1, except for lindane (HCH), for which all values fall within the range 0.01 to 0.15 mgper litre. Similar maximum values are found for the Windrush, and although there appear to be declinesin concentrations over the periods for which data are available, many measurements are at the lowerlimit of detection, and this has decreased with time, rendering analysis impossible.
The most comprehensive set of data came from the Avon and the Teme. Here, too, there was a declinein concentrations with time, also confounded by changes in sensitivity of the analyses. It is also clearthat on the Avon there is at least one ‘hot spot’ – a heavily polluted site where samples are taken froma borehole. At this site, a maximum value for lindane of 3.7 mg per litre was recorded in 1986, and avalue of over 1 mg per litre was obtained for DDT in the same year. In order to illustrate changes thathave taken place, and particularly to demonstrate that high levels of toxic chemicals were present inboth rivers over an extended period, figures E1 and E2 include only samples where concentrationsexceeded 1.0 mg per litre. Data from boreholes are also excluded, and toxic compounds are groupedto clarify the picture.
Note that the broad patterns of high levels are similar in the two catchments, and although it mayappear that pollution on the Avon was more severe, approximately four times as many records werereceived for this river.
A clear trend of declining values is not unexpected, but it is perhaps significant that values in excess of100 mg per l of several pollutants were recorded in these rivers more than 20 years after the start ofthe decline of the otter.
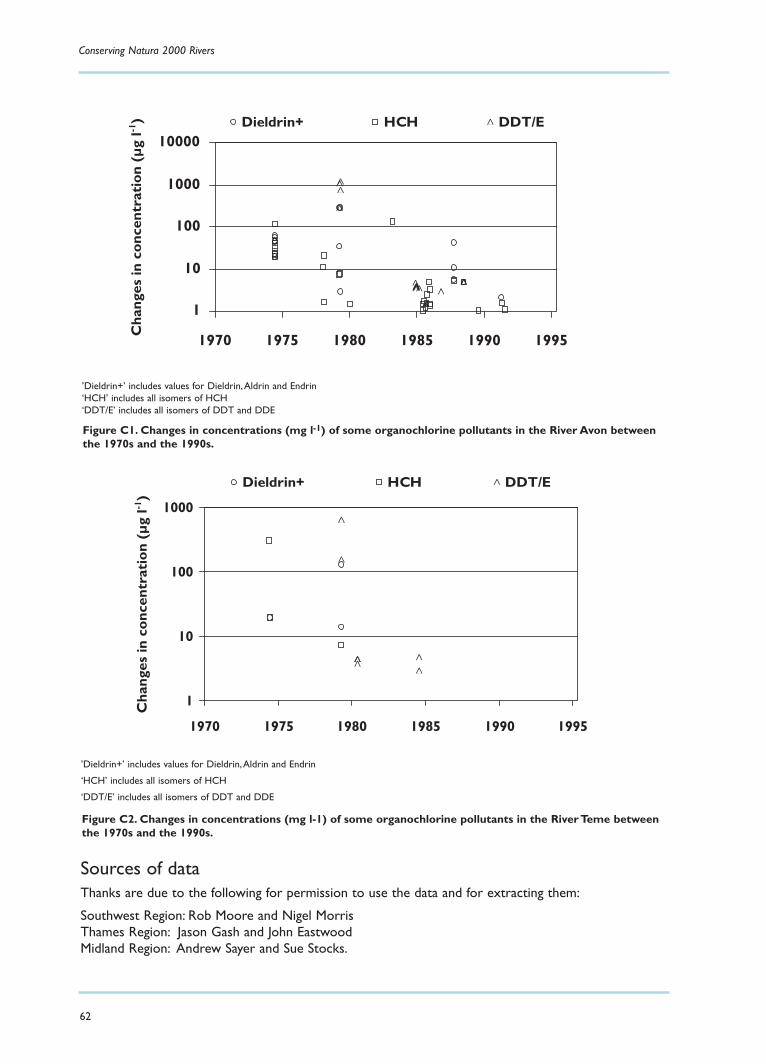
Conserving Natura 2000 Rivers
62
Sources of dataThanks are due to the following for permission to use the data and for extracting them:
Southwest Region: Rob Moore and Nigel MorrisThames Region: Jason Gash and John EastwoodMidland Region: Andrew Sayer and Sue Stocks.
1
10
100
1000
10000
1970 1975 1980 1985 1990 1995Cha
nges
in c
once
ntra
tion
(µg
l-1) Dieldrin+ HCH DDT/E
Figure C1. Changes in concentrations (mg l-1) of some organochlorine pollutants in the River Avon betweenthe 1970s and the 1990s.
’Dieldrin+’ includes values for Dieldrin,Aldrin and Endrin‘HCH’ includes all isomers of HCH‘DDT/E’ includes all isomers of DDT and DDE
1
10
100
1000
1970 1975 1980 1985 1990 1995
Cha
nges
in c
once
ntra
tion
(µg
l-1)
Dieldrin+ HCH DDT/E
Figure C2. Changes in concentrations (mg l-1) of some organochlorine pollutants in the River Teme betweenthe 1970s and the 1990s.
’Dieldrin+’ includes values for Dieldrin,Aldrin and Endrin
‘HCH’ includes all isomers of HCH
‘DDT/E’ includes all isomers of DDT and DDE
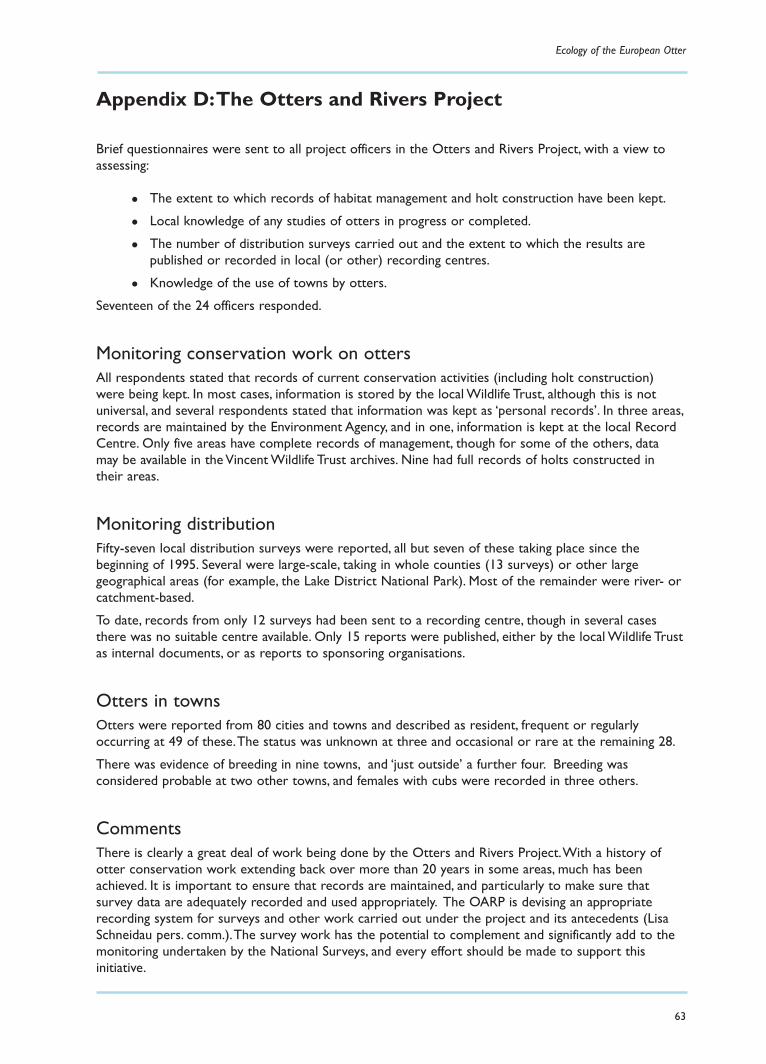
Ecology of the European Otter
63
Appendix D:The Otters and Rivers Project
Brief questionnaires were sent to all project officers in the Otters and Rivers Project, with a view toassessing:
The extent to which records of habitat management and holt construction have been kept.
Local knowledge of any studies of otters in progress or completed.
The number of distribution surveys carried out and the extent to which the results are published or recorded in local (or other) recording centres.
Knowledge of the use of towns by otters.
Seventeen of the 24 officers responded.
Monitoring conservation work on ottersAll respondents stated that records of current conservation activities (including holt construction)were being kept. In most cases, information is stored by the local Wildlife Trust, although this is notuniversal, and several respondents stated that information was kept as ‘personal records’. In three areas,records are maintained by the Environment Agency, and in one, information is kept at the local RecordCentre. Only five areas have complete records of management, though for some of the others, datamay be available in the Vincent Wildlife Trust archives. Nine had full records of holts constructed intheir areas.
Monitoring distributionFifty-seven local distribution surveys were reported, all but seven of these taking place since thebeginning of 1995. Several were large-scale, taking in whole counties (13 surveys) or other largegeographical areas (for example, the Lake District National Park). Most of the remainder were river- orcatchment-based.
To date, records from only 12 surveys had been sent to a recording centre, though in several casesthere was no suitable centre available. Only 15 reports were published, either by the local Wildlife Trustas internal documents, or as reports to sponsoring organisations.
Otters in towns Otters were reported from 80 cities and towns and described as resident, frequent or regularlyoccurring at 49 of these.The status was unknown at three and occasional or rare at the remaining 28.
There was evidence of breeding in nine towns, and ‘just outside’ a further four. Breeding wasconsidered probable at two other towns, and females with cubs were recorded in three others.
CommentsThere is clearly a great deal of work being done by the Otters and Rivers Project.With a history ofotter conservation work extending back over more than 20 years in some areas, much has beenachieved. It is important to ensure that records are maintained, and particularly to make sure thatsurvey data are adequately recorded and used appropriately. The OARP is devising an appropriaterecording system for surveys and other work carried out under the project and its antecedents (LisaSchneidau pers. comm.).The survey work has the potential to complement and significantly add to themonitoring undertaken by the National Surveys, and every effort should be made to support thisinitiative.
Conserving Natura 2000 Rivers
64
It would be beneficial to ensure that distribution records are integrated into the National BiodiversityNetwork.
Areas from which responses were received:
Devon Yorkshire Northumberland Cheshire Cornwall Derbyshire Dorset Norfolk and North SuffolkNottinghamshire South Suffolk, EssexSomerset Staffordshire Warwickshire Worcestershire Sussex and Kent

Conserving Natura 2000 RiversEcology Series
1 Ecology of the White-clawed Crayfish, Austropotamobius pallipes2 Ecology of the Freshwater Pearl Mussel, Margaritifera margaritifera3 Ecology of the Allis and Twaite Shad, Alosa alosa and A. fallax4 Ecology of the Bullhead, Cottus gobio5 Ecology of the River, Brook and Sea Lamprey, Lampetra fluviatilis, L. planeri and Petromyzon marinus6 Ecology of Desmoulin’s Whorl Snail, Vertigo moulinsiana7 Ecology of the Atlantic Salmon, Salmo salar8 Ecology of the Southern Damselfly, Coenagrion mercuriale9 Ecology of the Floating Water-plantain, Luronium natans10 Ecology of the European Otter, Lutra lutra11 Ecology of Watercourses Characterised by Ranunculion fluitantis and Callitricho-Batrachion Vegetation
Monitoring Series
1 A Monitoring Protocol for the White-clawed Crayfish, Austropotamobius pallipes2 A Monitoring Protocol for the Freshwater Pearl Mussel, Margaritifera margaritifera3 A Monitoring Protocol for the Allis and Twaite Shad, Alosa alosa and A. fallax4 A Monitoring Protocol for the Bullhead, Cottus gobio5 A Monitoring Protocol for the River, Brook and Sea Lamprey, Lampetra fluviatilis, L. planeri and
Petromyzon marinus6 A Monitoring Protocol for Desmoulin’s Whorl Snail, Vertigo moulinsiana7 A Monitoring Protocol for the Atlantic Salmon, Salmo salar8 A Monitoring Protocol for the Southern Damselfly, Coenagrion mercuriale9 A Monitoring Protocol for the Floating Water-plantain, Luronium natans10 A Monitoring Protocol for the European Otter, Lutra lutra11 A Monitoring Protocol for Watercourses Characterised by Ranunculion fluitantis and
Callitricho-Batrachion Vegetation
These publications can be obtained from:
The Enquiry ServiceEnglish NatureNorthminster HousePeterboroughPE1 1UAEmail: [email protected]: +44 (0) 1733 455100Fax: +44 (0) 1733 455103
They can also be downloaded from the project website: www.riverlife.org.uk

Information on Conserving Natura 2000 Rivers and Life in UK Rivers can be found at
www.riverlife.org.uk
This document was produced with the support of the European Commission’s LIFE Natureprogramme and published by Life in UK Rivers – a joint venture involving English Nature,
the Countryside Council for Wales, the Environment Agency, the Scottish EnvironmentProtection Agency, Scottish Natural Heritage and the Scotland and Northern Ireland Forum
for Environmental Research.
The European otter is a top predator and important inmaintaining the equilibrium of a freshwater ecosystem. It
declined dramatically over most of the UK after the 1950swith the introduction of pesticides. However, it is graduallymaking a comeback, and can now be found over much of its
former range.
The otter is an important indicator of the environmentalquality of its habitat.This report describes the ecological
requirements of the otter in a bid to assist the developmentof monitoring programmes and conservation strategies that
are vital for its future.
Life in UK Rivers was established to develop methods for conserving thewildlife and habitats of rivers within the Natura 2000 network of protected
European sites.
Set up by the UK statutory conservation bodies and the EuropeanCommission’s LIFE Nature programme, the project has sought to identifythe ecological requirements of key plants and animals supported by river
Special Areas of Conservation.
In addition, monitoring techniques and conservation strategies have beendeveloped as practical tools for assessing and maintaining these
internationally important species and habitats.