ecology through time review historical overfishing and the
TRANSCRIPT
Article 41
ECOLOGY THROUGH TIME REVIEW
Historical Overfishing and the Recent Collapse of Coastal Ecosystems
Ecological extinction caused by overfishing precedes all other pervasive human disturbance to coastal ecosystems, in-cluding pollution, degradation of water quality, and anthropogenic climate change. Historical abundances of large con-sumer species were fantastically large in comparison with recent observations. Paleoecological, archaeological, andhistorical data show that time lags of decades to centuries occurred between the onset of overfishing and consequentchanges in ecological communities, because unfished species of similar trophic level assumed the ecological roles ofoverfished species until they too were overfished or died of epidemic diseases related to overcrowding. Retrospectivedata not only help to clarify underlying causes and rates of ecological change, but they also demonstrate achievable goalsfor restoration and management of coastal ecosystems that could not even be contemplated based on the limited perspec-tive of recent observations alone.
Jeremy B. C. Jackson,1, 2* Michael X. Kirby,3 Wolfgang H. Berger,1 Karen A. Bjorndal,4 Louis W. Botsford,5 Bruce J. Bourque,6 Roger H. Bradbury,7 Richard Cooke,2 Jon Erlandson,8 James A. Estes,9 Terence P. Hughes,10
Susan Kidwell,11 Carina B. Lange,1 Hunter S. Lenihan,12 John M. Pandolfi,13 Charles H. Peterson,12 Robert S. Steneck,14 Mia J. Tegner,1†Robert R. Warner15
Few modern ecological studies take into account the former nat-ural abundances of large marine vertebrates. There are dozensof places in the Caribbean named after large sea turtles whoseadult populations now number in the tens of thousands ratherthan the tens of millions of a few centuries ago (1, 2). Whales,manatees, dugongs, sea cows, monk seals, crocodiles, codfish,jewfish, swordfish, sharks, and rays are other large marine ver-tebrates that are now functionally or entirely extinct in mostcoastal ecosystems (3–10). Place names for oysters, pearls, andconches conjure up other ecological ghosts of marine inverte-brates that were once so abundant as to pose hazards to naviga-tion (11), but are witnessed now only by massive garbage heapsof empty shells.
Such ghosts represent a far more profound problem for eco-logical understanding and management than currently realized.Evidence from retrospective records strongly suggests thatmajor structural and functional changes due to overfishing (12)occurred worldwide in coastal marine ecosystems over manycenturies. Severe overfishing drives species to ecological ex-tinction because overfished populations no longer interact sig-nificantly with other species in the community (5). Overfishingand ecological extinction predate and precondition modern eco-logical investigations and the collapse of marine ecosystems inrecent times, raising the possibility that many more marine ec-osystems may be vulnerable to collapse in the near future.
Importance of Historical Data
Most ecological research is based on local field studieslasting only a few years and conducted sometime after the1950s without longer term historical perspective (1, 8, 13).Such observations fail to encompass the life-spans of manyecologically important species (13, 14) and critically impor-tant environmental disturbances such as extreme cyclones orENSO (El Niño-Southern Oscillation) events (8), as well aslonger term cycles or shifts in oceanographic regimes andproductivity (15-17). To help address this problem, we de-scribe ecosystem structure predating modern ecologicalstudies using well-dated time series based on biological (18,19), biogeochemical (20, 21), physical (22), and historical(23) proxies that are informative over a variety of spatialscales and biogeographic realms (24). Although proxies varyin precision and clarity of the signals they measure, the useof multiple proxies that give the same ecological signalgreatly increases confidence in results. Precision in agedating varies from centuries to a single year, season, or eventin the exceptional case of varved sediments, ice cores, andwritten historical records (25). Precision decreases with theamount of biological or physical disturbance to the sedimentanalyzed (26).
1

ANNUAL EDITIONS
Fig. 1. Simplified coastal food webs showing changes in some of the important top-down interactions due to over-fishing; before (left side) and after (right side) fishing. (A and B) Kelp forests for Alaska and southern California(left box), and Gulf of Maine (right box). (C an D) Tropical coral reefs and seagrass meadows. (E and F) Temperateestuaries. The representation of food webs after fishing is necessarily more arbitrary than those before fishing be-cause of rapidly changing recent events. For example, sea urchins are once again rare in the Gulf of Maine, as theywere before the overfishing of cod, due to the recent fishing of sea urchins that has also permitted the recovery ofkelp. Bold font represents abundant; normal font represents rare; "crossed-out" represents extinct. Thick arrows rep-resent strong interactions; thin arrows represent weak interactions.
2

Article 41. Historical Overfishing and the Recent Collapse of Coastal Ecosystems
Table 1. Retrospective records from coastal ecosystems that offer baselines that contrast with recent observations. Data source: P, paleoecologial; A, archaeological; H, historical; F, fisheries; E, ecological. Inferred causes: 1, fishing; 2, mechanical habitat destruction by fishing; 3, inputs. Abbreviations: BSi, biologically bound silica; DOP, degree of pyritization of iron; dec., decrease; inc., increase. References after 115 are located on Science Online (www.sciencemag.org/cgi/content/full/293/5530/629/DC1).
Parameter of interest
LocationData
sourceProxy
Time of baseline (yr B.P.)
Baseline observation or
estimate
Recent observation or
estimateTrend
Inferred cause
Ref.
Kelp forests
Sea Otter Pacific Ocean
H, E Area estimates 260 >100,000 individuals
30,000 indi-viduals
>3.3-fold dec.
1 116
Stellar's sea cow
Alaska H Herd size 259 <5,000 sea cows 0 Extinction 1 117
Atlantic cod Gulf of Maine
A Cod vertebrae 3550 Mean body length of 1.0 m
Mean body length of 0.3 m
3-fold dec. 1 113
White aba-lone
California E Number per area 30 >2,000 per ha 1.0 0.4 per ha >2,000-fold dec.
1 118
Coral reefs
Coral Caribbean Sea
P, E % sites with A. pal-mata dominant
125,000 80% of Pleis-tocene sites
15% of post-1982 sites
5.3-fold dec. 1 114
Coral Caribbean Sea
P, E % sites with A. cer-vicornis dominant
125,000 63% of Pleis-tocene sites
0% of post-1982 sites
100% loss 1 114
Coral Bahamas P, E Standardized abundance of A. cervicornis
125,000 12 1 12-fold dec. 1 119
Coral Belize P Relative abun-dance
3,130 A. cervicornis dominant
A. cervicornis absent
100% loss 1 45
Coral Netherlands Antilles
E Coral cover at 10 m
27 54% coral cover 31% coral cover
1.7-fold dec. 1 120
Coral Jamaica E Coral cover at 10 m
23 73% coral cover 4% coral cover
18-fold dec. 1 42
Monk seal Caribbean Sea
H Historical reports >300 Abundant 0 Extinction 1 4, 68
Coral Moreton Bay
P, E Acropora domi-nance in fossil reefs
8,000 Dominated reefs throughout Bay
Only one small Acropora reef left
Decrease 3 121
Tropical and subtropical seagrass beds
Green turtle Caribbean Sea
E Biomass estimates >300 >16.1 X 10⁶ 50-kg turtles
>1.1 X 10⁶ 50-kg turtles
15-fold dec. 1 2, 122
Green turtle Caribbean Sea
H Hunting, biomass estimates
>300 >3.3 X 10⁷ adult turtles
>1.1 106 50-kg turtles
30-fold dec. 1 1, 122
Seagrass beds Tampa Bay H Area 121 30,970 ha 10,759 ha 3-fold dec. 1, 2, 3 123, 124
Dugong Eastern Australia
H Herd size >100 >1.0 106 esti-mated dugongs
14,000 esti-mated dug-ongs
>74-fold dec.
1 125, 126
Dugong Moreton Bay
H Herd size 107 >104,000 esti-mated dugongs
500 estimated dugongs
>208-fold dec.
1 125, 127
Oysters and eutrophication in estuaries
Inputs Chesapeake Bay
P Sedimentation rate 1,900 0.04 cm year-1 0.2 cm year-1 5-fold inc. 3 77
3

ANNUAL EDITIONS
4
Parameter of interest
LocationData
sourceProxy
Time of baseline (yr B.P.)
Baseline observation or
estimate
Recent observation or estimate
TrendInferred
causeRef.
Eutrophication Chesapeake Bay
P Total organic carbon
1,900 0.26 mg cm-2
year-12.3 mg cm-2
year-19-fold inc. 2, 3 77
Eutrophication Chesapeake Bay
P Centric/pennate diatom ratio
1,450 1:1 ratio 8:1 ratio 8-fold inc. 2, 3 77
Eutrophication Chesapeake Bay
P Dinoflagellate cysts
(Spiniferites spp.)
>300 50% relative abundance
80% relative abundance
1.6-fold inc. 2, 3 128
Seagrass beds Fleets Bay, CB
H Area 63 273 ha 16 ha 17-fold dec. 1, 2, 3 78
Oyster reefs Chesapeake Bay
F Oyster landings 116 6.2 X 10⁵ metric tons year-1*
0.12 X 105 metric tons
year-152-fold dec.
2 80
Oyster reefs Tangier Sound, CB
F Area 122 44.6 km2 0 100% loss 2 129
Anoxia Chesapeake Bay
P Degree of pyritization
1,900 0.32 DOP 0.51 DOP 2-fold inc. 2, 3 77
Seagrass beds Botany Bay H Area of Posidonia beds
58 445 ha 188 ha 2.4-fold dec. 1, 2, 3 130
Eutrophication Baltic Sea P Planktic diatom relative abun-
dance
250 25% of total dia-tom abundance
80% of total diatom abun-
dance
3-fold inc. 31 31
Eutrophication Baltic Sea P Total organic car-bon accumulation
rate
138 3.2 gC m-2 year1 70 g C m-2 year-1
22-fold inc. 3 132
Anoxia Baltic Sea P Laminatedsediments
100 5% of coreslaminated
90% of cores laminated
18-fold inc. 3 85
Offshore benthic communities
Oyster reefs Foveaux Strait, NZ
F Oyster landings 34 127 X 106 oysters/year*
15 X 106 oys-ters year-1
8-fold dec. 2 93
Oyster reefs Foveaux Strait, NZ
F Reef by-catch per station
38 1 in 4 stations had reef by-
catch
1 in 7 stations had reef by-
catch
2-fold dec. 2 93
Eutrophication Gulf of Mexico
P Biologically bound silica
295 0.29% BSi 1.00% BSi 3.4-fold inc. 3 106
Eutrophication Gulf of Mexico
P Total organic car-bon accumulation
rate
100 2.4 mg C cm-2
year-1
7.8 mg C cm-2 year-1
3.3-fold inc. 3 133
Hypoxia Gulf of Mexico
P Benthicforaminifera
295 71 Ammonia-Elphidium Index
85 Ammonia-Elphidium
Index
1.2-fold inc. 31 134
Eutrophication Adriatic Sea P Eutrophic benthic foraminifera Non-
ionella turgida
170 6% relativeabundance
38% relative abundance
6-fold inc. 3 135
Eutrophication Adriatic Sea P Coccolitho-phorids
286 100 cells/g of sediment
1.6 X 10⁶ cells/g of sediment
15,700-fold inc.
3 136
* Baseline taken from peak in landings.

Article 41. Historical Overfishing and the Recent Collapse of Coastal Ecosystems
We exploited data from many disciplines that span the periodover which anthropogenic changes may have occurred. Becauseour hypothesis is that humans have been disturbing marine ec-osystems since they first learned how to fish, our time periodsneed to begin well before the human occupation or Europeancolonization of a coastal region. Broadly, our data fall into fourcategories and time periods:
1) Paleoecological records from marine sediments fromabout 125,000 years ago to the present, coinciding with the riseof modern Homo sapiens.
2) Archaeological records from human coastal settlementsoccupied after about 10,000 years before the present (yr B.P.)when worldwide sea level approached present levels. Thesedocument human exploitation of coastal resources for food andmaterials by past populations that range from small-scale ab-original societies to towns, cities, and empires.
3) Historical records from documents, journals, and chartsfrom the 15th century to the present that document the periodfrom the first European trade-based colonial expansion and ex-ploitation in the Americas and the South Pacific (23).
4) Ecological records from the scientific literature over thepast century to the present covering the period of globalized ex-ploitation of marine resources. These also help to calibrate theolder records.
Time Periods, Geography, and AnalysisWe recognize three different but overlapping periods of humanimpact on marine ecosystems: aboriginal, colonial, and global.Aboriginal use refers to subsistence exploitation of near-shore,coastal ecosystems by human cultures with relatively simplewatercraft and extractive technologies that varied widely inmagnitude and geographic extent. Colonial use comprises sys-tematic exploitation and depletion of coastal and shelf seas byforeign mercantile powers incorporating distant resources intoa developing market economy. Global use involves more in-tense and geographically pervasive exploitation of coastal,shelf, and oceanic fisheries integrated into global patterns of re-source consumption, with more frequent exhaustion and substi-tution of fisheries. In Africa, Europe, and Asia, these culturalstages are strongly confounded in time and space, so that theirdifferential significance is difficult to establish. However, in theAmericas, New Zealand, and Australia the different stages arewell separated in time, and the aboriginal and colonial periodsbegan at different times in the different regions. Thus, we candistinguish between cultural stages, as well as between humanimpacts and natural changes due to changing climate.
The addition of a deep historical dimension to analyze andinterpret ecological problems requires that we sacrifice some ofthe apparent precision and analytical elegance prized by ecolo-gists (1, 13, 14). Paleoecological, archaeological, and historicaldata were collected for many purposes, vary widely in methodsof collection and quality, and are less amenable to many typesof statistical analysis than well-controlled experiments. Butnone of these problems outweighs the benefits of a historical ap-proach. Clearly, we cannot generate realistic null hypothesesabout the composition and dynamics of ecosystems from our
understanding of the present alone, since all ecosystems havealmost certainly changed due to both human and natural envi-ronmental factors (8, 16, 27, 28). Here, we briefly review long-term human impacts in several key marine ecosystems. Thesereconstructions provide insight into the nature and extent of de-graded ecosystems that point to new strategies for mitigationand restoration that are unlikely to emerge from modern moni-toring programs.
Kelp ForestsKelp forests characterize shallow, rocky habitats from warmtemperate to subarctic regions worldwide and provide complexenvironments for many commercially important fishes and in-vertebrates (29). Northern Hemisphere kelp forests have expe-rienced widespread reductions in the number of trophic levelsand deforestation due to population explosions of herbivoresfollowing the removal of apex predators by fishing (Fig. 1, Aand B). Phase shifts between forested and deforested states (thelatter known as “sea urchin barrens”) result from intensegrazing due to increased abundance and altered foraging pat-terns of sea urchins made possible in turn by human removal oftheir predators and competitors (7, 8, 30-32).
The kelp forest ecosystem of the Northern Pacific aroseduring the last 20 million years with the evolution of kelps,strongylocentrotid sea urchins, sea otters, and the extinctSteller’s sea cow (6). Sea cows were widely distributed acrossthe northern Pacific Rim through the Late Pleistocene. Theymay have been eliminated from most of their range by aborig-inal hunting at the end of the Pleistocene and in the early Ho-locene, because they survived thousands of years longer in thewestern Aleutian Islands that were not peopled until about 4000yr B.P. (6). By the time of European contact in 1741, sea cowspersisted only in the Commander Islands, the only islands of theAleutians unoccupied by aboriginal people. European furtraders killed the last sea cow 27 years later in 1768. We haveno idea to what extent abundant sea cows grazed kelp forests,although their apparent inability to dive deeply probably limitedtheir grazing to the surface canopy of kelps and to seaweedslining the shore (6).
Northern Pacific kelp forests presumably flourished beforehuman settlement because predation by sea otters on sea urchinsprevented the urchins from overgrazing kelp (30). AboriginalAleuts greatly diminished sea otters beginning around 2500 yrB.P., with a concomitant increase in the size of sea urchins (31).Fur traders subsequently hunted otters to the brink of extinctionin the 1800s with the attendant collapse of kelp forests grazedaway by sea urchins released from sea otter predation. Legalprotection of sea otters in the 20th century partially reversed thisscenario. However, kelp forests are again being depleted inareas of Alaska because of increased predation on sea otters bykiller whales (33). The whales shifted their diet to sea ottersfrom seals and sea lions, which are in drastic decline.
A similar sequence of events occurred in kelp forests of theGulf of Maine (7, 34). Sea otters were never present, but At-lantic cod and other large ground fish are voracious predators ofsea urchins. These fishes kept sea urchin populations small
5
ANNUAL EDITIONS
enough to allow persistence of kelp forests despite intensive ab-original and early European hook-and-line fishing for at least5000 years. New mechanized fishing technology in the 1920sset off a rapid decline in numbers and body size of coastal codin the Gulf of Maine (7) (Fig. 2A and Table 1) that has extendedoffshore to Georges Bank (35). Formerly dominant predatoryfish are now ecologically extinct and have been partially re-placed by smaller and commercially less important species.Lobsters, crabs, and sea urchins rose in abundance accordingly(7). Kelp forests disappeared with the rise in sea urchins due toremoval of predatory fish, and then reappeared when sea ur-chins were in turn reduced to low abundance by fishing.
The more diverse food web of southern California kelp for-ests historically included spiny lobsters and large sheephead la-brid fish in addition to sea otters as predators of sea urchins, aswell as numerous species of abalone that compete with sea ur-chins for kelps (Fig. 1, A and B) (36). Aboriginal exploitationbegan about 10,000 yr B.P. and may have had local effects onkelp communities (37). The fur trade effectively eliminated seaotters by the early 1800s (38), but kelp forests did not begin todisappear on a large scale until the intense exploitation and eco-logical extinction of sheephead, spiny lobsters, and abalone
starting in the 1950s (8, 36) (Table 1 and Fig. 1, A and B). Sub-sequent fishing of the largest sea urchin species in the 1970s and1980s resulted in the return of well-developed kelp forests inmany areas that, as in the Gulf of Maine, effectively lack trophiclevels higher than that of primary producers (36, 39).
Coral ReefsCoral reefs are the most structurally complex and taxonomi-cally diverse marine ecosystems, providing habitat for tens ofthousands of associated fishes and invertebrates (40). Aborig-inal fishing in coral reef environments began at least 35,000 to40,000 years ago in the western Pacific (41) but appears to havehad limited ecological impact. Recently, coral reefs have expe-rienced dramatic phase shifts in dominant species due to inten-sified human disturbance beginning centuries ago (1) (Fig. 1, Cand D). The effects are most pronounced in the Caribbean (42)but are also apparent on the Great Barrier Reef in Australia de-spite extensive protection over the past three decades (43).
Large species of branching Acropora corals dominatedshallow reefs in the tropical western Atlantic for at least half amillion years (44-46) until the 1980s when they declined dra-matically (42, 47) (Fig. 2B and Table 1). Patterns of communitymembership and dominance of coral species were also highlypredictable (44), so that there is a clear baseline of pristine coralcommunity composition before human impact.
Western Atlantic reef corals suffered sudden, catastrophicmortality in the 1980s due to overgrowth by macroalgae that ex-ploded in abundance after mass mortality of the superabundantsea urchin Diadema antillarum that was the last remaininggrazer of macroalgae (42, 47). Early fisheries reports suggestthat large herbivorous fishes were already rare before the 20th
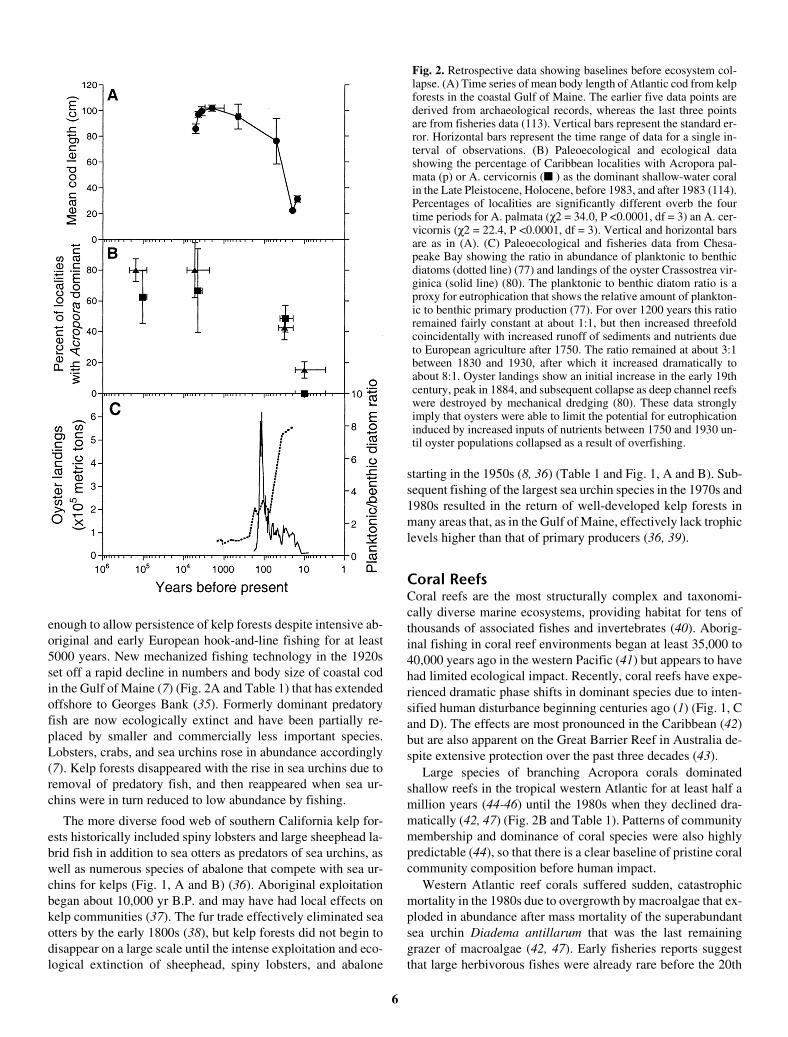
Fig. 2. Retrospective data showing baselines before ecosystem col-lapse. (A) Time series of mean body length of Atlantic cod from kelpforests in the coastal Gulf of Maine. The earlier five data points arederived from archaeological records, whereas the last three pointsare from fisheries data (113). Vertical bars represent the standard er-ror. Horizontal bars represent the time range of data for a single in-terval of observations. (B) Paleoecological and ecological datashowing the percentage of Caribbean localities with Acropora pal-mata (p) or A. cervicornis (� ) as the dominant shallow-water coralin the Late Pleistocene, Holocene, before 1983, and after 1983 (114).Percentages of localities are significantly different overb the fourtime periods for A. palmata (χ2 = 34.0, P <0.0001, df = 3) an A. cer-vicornis (χ2 = 22.4, P <0.0001, df = 3). Vertical and horizontal barsare as in (A). (C) Paleoecological and fisheries data from Chesa-peake Bay showing the ratio in abundance of planktonic to benthicdiatoms (dotted line) (77) and landings of the oyster Crassostrea vir-ginica (solid line) (80). The planktonic to benthic diatom ratio is aproxy for eutrophication that shows the relative amount of plankton-ic to benthic primary production (77). For over 1200 years this ratioremained fairly constant at about 1:1, but then increased threefoldcoincidentally with increased runoff of sediments and nutrients dueto European agriculture after 1750. The ratio remained at about 3:1between 1830 and 1930, after which it increased dramatically toabout 8:1. Oyster landings show an initial increase in the early 19thcentury, peak in 1884, and subsequent collapse as deep channel reefswere destroyed by mechanical dredging (80). These data stronglyimply that oysters were able to limit the potential for eutrophicationinduced by increased inputs of nutrients between 1750 and 1930 un-til oyster populations collapsed as a result of overfishing.
6

Article 41. Historical Overfishing and the Recent Collapse of Coastal Ecosystems
century (48). However, macroalgae were held in check until thelast major herbivore, Diadema, was lost from the systemthrough disease (42, 47).
Corals on the Great Barrier Reef have experienced recurrentmass mortality since 1960 due to spectacular outbreaks of thecrown-of-thorns starfish Acanthaster planci that feeds on coral(49). The causes of outbreaks are controversial, but they are al-most certainly new phenomena. There are no early records ofAcanthaster in undisturbed fossil deposits, in aboriginal folk-lore, or in accounts of European explorers and fishers. Now, inrecent decades, the frequency and intensity of outbreaks haveexceeded the capability of longer lived species to recover asoutbreaks have become more chronic than episodic (50).
One possible explanation for Acanthaster outbreaks is thatoverfishing of species that prey upon larval or juvenile stages ofcrown-of-thorns starfish is responsible for massive recruitmentof the starfish (51). The highly cryptic, predator-avoiding be-havior of juvenile starfish, their formidable antipredator de-fenses as subadults and adults, and the reduction of somegeneralized predatory fishes on the Great Barrier Reef all pointto such a “top-down” explanation. Commercial and recreationalfishing, as well as indirect effects of intensive trawling forprawns, are likely explanations for decreased abundance ofpredators of crown-of-thorns starfish (52). Massive recruitmentof starfish may also be due to “bottom-up” increases in produc-tivity due to increased runoff of nutrients from the land (53). Ineither case, the explanation is almost certainly historical and an-thropogenic, and cannot be resolved by recent observationsalone.
Expeditions occurred annually to northern Australia from theMalay Archipelago throughout the 18th and 19th centuries toharvest an estimated 6 million sea cucumbers each season (54).After European colonization, industrial-scale fishing developedalong the Great Barrier Reef and subtropical east Australiancoast in the early to mid-19th century (55). Whales, dugongs,turtles, pearl oysters, and Trochus shell were each heavily ex-ploited only to rapidly collapse, and all have failed to regainmore than a small fraction of their former abundance (55-57).Fishing of pelagic and reef fishes, sharks, and prawns has con-tinued to the present, although catch per unit effort has declinedgreatly (58).
Tropical and Subtropical Seagrass BedsSeagrass beds cover vast areas of tropical and subtropical bays,lagoons, and continental shelves (59). Seagrasses provideforage and habitat for formerly enormous numbers of large si-renians (dugong and manatee) and sea turtles, as well as diverseassemblages of fishes, sharks, rays, and invertebrates, includingmany commercially important species (59-62) (Fig. 1, C andD). Like coral reefs, seagrass beds seemed to be highly resilientto human disturbance until recent decades when mass mortalityof seagrasses became common and widespread (63-65). Exam-ples include the die-off of turtlegrass in Florida Bay and theGulf of Mexico in the 1980s (65) and the near disappearance ofsubtidal seagrasses in the offshore half of Moreton Bay nearBrisbane, Australia, over the past 20 to 30 years (63, 64). Prox-
imate causes of these losses include recent increases in sedi-mentation, turbidity, or disease (63-65). However, extirpationof large herbivorous vertebrates beginning centuries ago had al-ready profoundly altered the ecology of seagrass beds in waysthat increased their vulnerability to recent events.
Vast populations of very large green turtles were eliminatedfrom the Americas before the 19th century (1, 2) (Table 1). For-merly great populations of green turtles in Moreton Bay, Aus-tralia, also were greatly reduced by the early 20th century (66).Moreover, there are no estimates of abundances of turtles inAustralia at the dawn of European exploitation, so that reportedreductions must be only a small fraction of the total numberslost. All turtle species continue to decline at unsustainable ratesalong the Great Barrier Reef today (67).
Abundant green turtles closely crop turtlegrass and greatlyreduce the flux of organic matter and nutrients to sediments (59-62, 68). In the near absence of green turtles today, turtlegrassbeds grow longer blades that baffle currents, shade the bottom,start to decompose in situ, and provide suitable substrate forcolonization by the slime molds that cause turtlegrass wastingdisease (65). Deposition within the beds of vastly more plantdetritus also fuels microbial populations, increases the oxygendemand of sediments, and promotes hypoxia (65). Thus, all thefactors that have been linked with recent die-off of turtlegrassbeds in Florida Bay (65), except for changes in temperature andsalinity, can be attributed to the ecological extinction of greenturtles (27).
European colonists did not exploit tropical American mana-tees as systematically as they exploited green turtles, so the datarelated to fisheries are poor. We know, however, that manateeswere extensively fished by aboriginal people and by early colo-nists (68). In Australia, aboriginal people also harvested dug-ongs extensively long before European colonization (3), yet thenumbers reported by early colonists were vast. Three- or four-mile-long herds comprising tens of thousands of large individ-uals were observed in Wide Bay in about 1870 (69) and inMoreton Bay as recently as 1893 (70). Widespread colonial ex-ploitation of dugongs for their flesh and oil along the southernQueensland coast resulted in the crash of the dugong fishery bythe beginning of the 20th century (3) (Table 1). Ironically, sci-entists recently reported the “discovery of a large population” ofdugongs in Moreton Bay—a mere 300 individuals (71). Furthernorth, numbers of dugongs in the vast southern half of the GreatBarrier Reef had dwindled to fewer than 4000 when they werefirst accurately counted in 1986–87, with a further 50 to 80%decline in recent years (72). These increasingly fragmentedpopulations represent the last remnants of the vast herds of theearly 19th century and before.
The ecological implications of these reductions are at least asimpressive as those for green turtles. Moderate sized herds ofdugongs remove up to 96% of above-ground biomass and 71%of below-ground biomass of seagrasses (73). Their grazing ripsup large areas of seagrass beds, providing space for colonizationby competitively inferior species of seagrasses. Dugong grazingalso produces massive amounts of floating debris and dung thatare exported to adjacent ecosystems. The decline in seagrassesin Moreton Bay is certainly due in large part to the dramatic de-
7

ANNUAL EDITIONS
cline in water quality due to eutrophication and runoff of sedi-ment (63, 64). Nevertheless, as noted for green turtles andturtlegrass in Florida Bay, the cessation of systematic plowingof the bay floor by once abundant dugongs must also have beena major factor.
Oysters and Eutrophication in EstuariesTemperate estuaries worldwide are undergoing profoundchanges in oceanography and ecology due to human exploita-tion and pollution, rendering them the most degraded of marineecosystems (74-76) (Fig. 1, E and F). The litany of changes in-cludes increased sedimentation and turbidity (77); enhancedepisodes of hypoxia or anoxia (74, 75, 77); loss of seagrasses(78) and dominant suspension feeders (79), with a general lossof oyster reef habitat (80); shifts from ecosystems once domi-nated by benthic primary production to those dominated byplanktonic primary production (77); eutrophication (74-76)and enhanced microbial production (81); and higher frequencyand duration of nuisance algal and toxic dinoflagellate blooms(82, 83), outbreaks of jellyfish (79), and fish kills (83). Mostexplanations for these phenomena emphasize “bottom-up” in-creases in nutrients like nitrogen and phosphorus as causes ofphytoplankton blooms and eutrophication (74-76), an interpre-tation consistent with the role of estuaries as the focal point andsewer for many land-based, human activities. Nevertheless,long-term records demonstrate that reduced “top-down” con-trol resulting from losses in benthic suspension feeders pre-dated eutrophication.
The oldest and longest records come from cores in sedimentsfrom Chesapeake Bay (77) and Pamlico Sound (84) in theeastern United States and from the Baltic Sea (85) that extendback as far as 2500 yr B.P. (Fig. 2C and Table 1). A general se-quence of ecological change is apparent in all three cases, butthe timing of specific ecological transitions differs among estu-aries in keeping with their unique histories of land use, exploi-tation, and human population growth—a difference that rulesout a simple climatic explanation. Increased sedimentation andburial of organic carbon began in the mid-18th century in Ches-apeake Bay, coincident with widespread land clearance for ag-riculture by European colonists (77). The main ecologicalresponse was a gradual shift in the taxa responsible for primaryproduction that began in the late 18th century. Seagrasses andbenthic diatoms on the bay floor declined, while planktonic di-atoms and other phytoplankton in the water column correspond-ingly increased. However, anoxia and hypoxia were notwidespread until the 1930s when phytoplankton populationsand the flux of organic matter to the bay floor increased dramat-ically with concomitant loss of benthic fauna (75, 77) (Fig. 2Cand Table 1). Similar changes began in the 1950s in the BalticSea, with widespread expansion of the extent of anoxic lami-nated sediments (74, 85), and in the 1950s to 1970s in PamlicoSound (84).
Vast oyster reefs were once prominent structures in Chesa-peake Bay (11), where they may have filtered the equivalent ofthe entire water column every 3 days (79). Despite intensiveharvesting by aboriginal and early colonial populations span-
ning several millennia, it was not until the introduction ofmechanical harvesting with dredges in the 1870s that deepchannel reefs were seriously affected (79, 80). Oyster catchwas rapidly reduced to a few percent of peak values by theearly 20th century (79, 80) (Fig. 2C and Table 1). Onlythen, after the oyster fishery had collapsed, did hypoxia,anoxia, and other symptoms of eutrophication begin tooccur in the 1930s (75, 77), and outbreaks of oyster para-sites became prevalent only in the 1950s (80). Thus, fishingexplains the bulk of the decline, whereas decline in waterquality and disease were secondary factors (80). However,now that oyster reefs are destroyed, the effects of eutroph-ication, disease, hypoxia, and continued dredging interactto prevent the recovery of oysters and associated communi-ties (86). Field experiments in Pamlico Sound demonstratethat oysters grow well, survive to maturity, and resist oysterdisease when elevated above the zone of summer hy-poxia—even in the presence of modern levels of eutrophi-cation and pollution (87).
Overfishing of oysters to the point of ecological extinctionis just one example in a general pattern of removal of speciescapable of top-down control of community structure in estu-aries. Dense populations of oysters and other suspension-feeding bivalves graze plankton so efficiently that they limitblooms of phytoplankton and prevent symptoms of eutrophica-tion (88, 89), just as occurs with grazing by zooplankton infreshwater ecosystems (90). The ecological consequences ofuncounted other losses are unknown. Gray whales (now extinctin the Atlantic), dolphins, manatees, river otters, sea turtles, al-ligators, giant sturgeon, sheepshead, sharks, and rays were allonce abundant inhabitants of Chesapeake Bay but are now vir-tually eliminated.
Offshore Benthic CommunitiesContinental shelves cover more of the ocean floor than all pre-viously discussed environments combined. Commercially im-portant cod, halibut, haddock, turbot, flounder, plaice, rays, anda host of other ground fishes, scallops, cockles, and oysters havebeen fished intensively for centuries from continental shelves ofEurope and North America, and more recently throughout theworld (5, 7, 10, 91). Hook-and-line fishing was replaced by in-tensive use of the beam trawl during the 18th century, and in-dustrialized fishing was further intensified with the advent oflarge steam- and diesel-powered vessels and the otter trawl atthe end of the 19th century. Reports of severely depleted fishstocks and shifting of fishing grounds farther and farther fromhome ports into the North Sea and the outer Grand Banks werecommonplace by the beginning of the 19th century. Scientificinvestigation consistently lagged behind economic realities ofdepleted stocks and inexorable exploitation of more-distantfishing grounds. As late as 1883, Thomas Huxley claimed thatfish stocks were inexhaustible (92), a view discredited by thebeginning of the 20th century (5). Today, several formerlyabundant, large fish as well as formerly dense assemblages ofsuspension feeders are ecologically extinct over vast areas (7-10, 93).
8
Article 41. Historical Overfishing and the Recent Collapse of Coastal Ecosystems
The Primacy of Overfishing in Human Disturbance to Marine EcosystemsOverfishing of large vertebrates and shellfish was the firstmajor human disturbance to all coastal ecosystems examined(Table 1). Ecological changes due to overfishing are strikinglysimilar across ecosystems despite the obvious differences in de-tail (Fig. 1, A to F). Everywhere, the magnitude of losses wasenormous in terms of biomass and abundance of large animalsthat are now effectively absent from most coastal ecosystemsworldwide. These changes predated ecological investigationsand cannot be understood except by historical analysis. Theirtiming in the Americas and Pacific closely tracks European col-onization and exploitation in most cases. However, aboriginaloverfishing also had effects, as exemplified by the decline ofsea otters (and possibly sea cows) in the northeast Pacific thou-sands of years ago.
There are three important corollaries to the primacy ofoverfishing. The first is that pollution, eutrophication, phys-ical destruction of habitats, outbreaks of disease, invasionsof introduced species, and human-induced climate changeall come much later than overfishing in the standard se-quence of historical events (Fig. 3). The pattern holds re-gardless of the initial timing of colonial overfishing thatbegan in the Americas in the 16th and 17th centuries and inAustralia and New Zealand in the 19th century. The full se-quence of events is most characteristic of temperate estu-aries like Chesapeake Bay. Not all the human disturbancesillustrated in Fig. 3 have affected all ecosystems yet. Butwherever these events have occurred, the standard chrono-logical sequence of human disturbance and modification ofecosystems is recognizable.
The second important corollary is that overfishing mayoften be a necessary precondition for eutrophication, out-breaks of disease, or species introductions to occur (27). Forexample, eutrophication and hypoxia did not occur in Ches-apeake Bay until the 1930s, nearly two centuries afterclearing of land for agriculture greatly increased runoff ofsediments and nutrients into the estuary (77). Suspensionfeeding by still enormous populations of oysters was suffi-cient to remove most of the increased production of phy-toplankton and enhanced turbidity until mechanicalharvesting progressively decimated oyster beds from the1870s to the 1920s (77, 80) (Fig. 2C).
The consequences of overfishing for outbreaks of disease inthe next lower trophic level fall into two categories. The moststraightforward is that populations in the lower level become sodense that they are much more susceptible to disease as a resultof greatly increased rates of transmission (94). This was pre-sumably the case for the sea urchin Diadema on Caribbean reefsand the seagrass Thalassia in Florida Bay. In contrast, amongoysters disease did not become important in Chesapeake Bayuntil oysters had been reduced to a few percent of their originalabundance (80), a pattern repeated in Pamlico Sound (86, 87)and Foveaux Strait, New Zealand (93). Two factors may be re-sponsible. First, oysters may have become less fit owing tostresses like hypoxia or sedimentation, making them less resis-tant to disease (87). Alternatively, suspension feeding by densepopulations of oysters and associated species on oyster reefsmay have indirectly limited populations of pathogens by fa-voring other plankton—an explanation that may extend toblooms of toxic plankton and most other outbreaks of microbialpopulations (88).
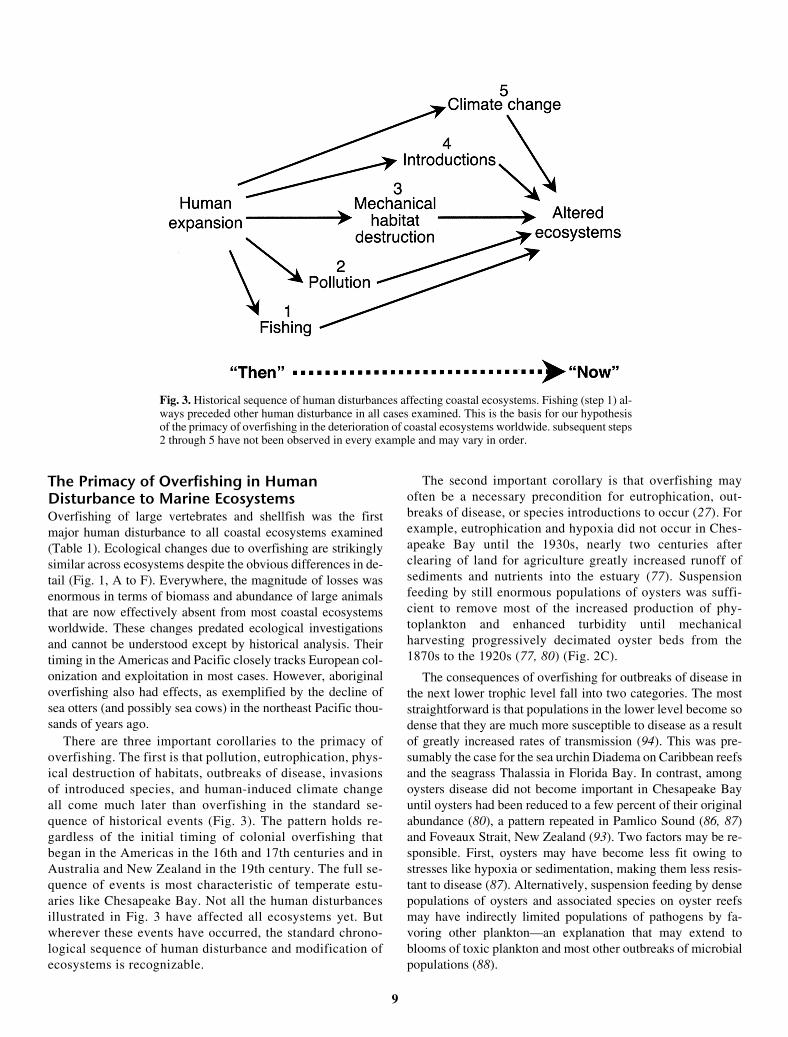
Fig. 3. Historical sequence of human disturbances affecting coastal ecosystems. Fishing (step 1) al-ways preceded other human disturbance in all cases examined. This is the basis for our hypothesisof the primacy of overfishing in the deterioration of coastal ecosystems worldwide. subsequent steps2 through 5 have not been observed in every example and may vary in order.
9
ANNUAL EDITIONS
The third important corollary is that changes in climate areunlikely to be the primary reason for microbial outbreaks anddisease. The rise of microbes has occurred at different times andunder different climatic conditions in different places, as exem-plified by the time lag between events in Chesapeake Bay andPamlico Sound (77, 79, 80, 84). Anthropogenic climate changemay now be an important confounding factor, but it was not theoriginal cause. Rapid expansion of introduced species in recentdecades (95) may have a similar explanation, in addition to in-crease in frequency and modes of transport. Massive removal ofsuspension feeders, grazers, and predators must inevitably leavemarine ecosystems more vulnerable to invasion (96, 97).
Synergistic Effects of Human DisturbanceEcological extinction of entire trophic levels makes ecosystemsmore vulnerable to other natural and human disturbances suchas nutrient loading and eutrophication, hypoxia, disease,storms, and climate change. Expansion and intensification ofdifferent forms of human disturbance and their ecological ef-fects on coastal ecosystems have increased and accelerated withhuman population growth, unchecked exploitation of biologicalresources, technological advance, and the increased geographicscale of exploitation through globalization of markets. More-over, the effects are synergistic, so that the whole response ismuch greater than the sum of individual disturbances (98). Thisis perhaps most apparent in the rise of eutrophication, hypoxia,and the outbreak of toxic blooms and disease following the de-struction of oyster reefs by mechanical harvesting of oysters(79, 80, 86). Other possible examples are outbreaks of seagrasswasting disease due to the removal of grazers of seagrasses likethe green turtle (27).
A striking feature of such synergistic effects is the sudden-ness of the transition in abundance of different kinds of organ-isms and community composition due to threshold effects (99).Ecological diversity and redundancy within trophic levels isprobably the most important reason for the delay or time lag be-tween the onset of fishing and the subsequent threshold re-sponse (42, 100). The importance of biodiversity in the form ofecological redundancy is clearly apparent for the delay in thecollapse of kelp forests in southern California compared withAlaska after the extirpation of sea otters. Sheephead fish, spinylobsters, and abalone in the more diverse Californian kelp for-ests kept sea urchin populations in check until these predatorsand competitors of sea urchins had also been effectively elimi-nated (8, 36). Similarly, the sea urchin Diadema kept mac-roalgae in check long after the extreme overfishing ofherbivorous fishes on Caribbean coral reefs (42).
A second potentially important mechanism for the sudden-ness of ecosystem collapse is the elimination of previously un-fished refuges that were protected historically because ofdistance or expense of access. For example, reef fishes allaround Jamaica in the 1960s rarely reached reproductive matu-rity so that the abundant recruits of fishes on Jamaican reefs atthat time must have come from undiscovered populations in Ja-maica or elsewhere (101). But as more and more reefs havebeen overfished, the potential sources of such recruits must
have effectively disappeared over wider areas (102). A similarscenario has been proposed for the American lobster with re-gard to loss of larvae from deep-water offshore stocks (103).
Microbialization of the Global Coastal OceanMost recent changes to coastal marine ecosystems subsequentto overfishing involve population explosions of microbes re-sponsible for increasing eutrophication (74-76, 81), diseases ofmarine species (104), toxic blooms (82, 83), and even diseasessuch as cholera that affect human health (104, 105). ChesapeakeBay (81) and the Baltic Sea (74) are now bacterially dominatedecosystems with a trophic structure totally different from that ofa century ago. Microbial domination also has expanded to theopen ocean off the mouth of the Mississippi River (106) and tothe Adriatic Sea (107).
Nowhere is the lack of historical perspective more damagingto scientific understanding than for microbial outbreaks. Plansfor remediation of eutrophication of estuaries are still based onthe belief that eutrophication is caused only by increased nutri-ents without regard to overfishing of suspension feeders. Evenmore remarkable is the attribution of the rise in marine diseasesto climate change and pollution (104) without regard to the per-vasive removal of higher trophic levels and the asynchronousoutbreaks of disease in different ecosystems that belie a simpleclimatic explanation.
Historical Perspectives for Ecosystem RestorationThe characteristic sequence of human disturbance to marine ec-osystems (Fig. 3) provides a framework for remediation andrestoration that is invisible without a historical perspective.More specific paleoecological, archaeological, and historicaldata should be obtained to refine the histories of specific eco-systems and as a tool for management, but the overall patternsare clear. The historical magnitudes of losses of large animalsand oysters were so great as to seem unbelievable based onmodern observations alone (Table 1). Even seemingly gloomyestimates of the global percentage of fish stocks that are over-fished (108) are almost certainly far too low. The shifting base-line syndrome is thus even more insidious and ecologicallywidespread than is commonly realized.
On the other hand, recognition of these losses shows whatcoastal ecosystems could be like, and the extraordinary magni-tude of economic resources that are retrievable if we are willingto act on the basis of historical knowledge. The central point forsuccessful restoration is that loss of economically importantfisheries, degradation of habitat attractive to landowners andtourists, and emergence of noxious, toxic, and life-threateningmicrobial diseases are all part of the same standard sequence ofecosystem deterioration that has deep historical roots (27). Re-sponding only to current events on a case-by-case basis cannotsolve these problems. Instead, they need to be addressed by aseries of bold experiments to test the success of integrated man-agement for multiple goals on the scale of entire ecosystems.With few exceptions, such as the Caribbean monk seal and
10

Article 41. Historical Overfishing and the Recent Collapse of Coastal Ecosystems
Steller’s sea cow, most species that are ecologically extinctprobably survive in sufficient numbers for successful restora-tion. This optimism is in stark contrast with the state of manyterrestrial ecosystems where many or most large animals are al-ready extinct (28). Moreover, we now have the theoretical tools(109) to roughly estimate per capita interaction strengths of sur-viving individuals of now rare animals like sea turtles, sire-nians, sharks, and large groupers. We can then use these data tobuild tentative models of the consequences of the renewedabundance of these species in their native environments that canin turn be used to design large-scale, adaptive experiments forecosystem restoration, exploitation, and management (96, 108,110).
One obviously timely and overdue experiment is to attemptthe amelioration of eutrophication, hypoxia, and toxic bloomsin Chesapeake Bay by massive restoration of oyster reefs (79).Experiments in Pamlico Sound show that this is possible (86,87, 96), and modeling of food webs suggests that even partialrestoration of oysters would reduce eutrophication substantially(110). Aquaculture of suspension-feeding bivalves like oystersmight be promoted to reverse the effects of eutrophication andto restore water quality in degraded estuaries. Other importantexamples include the restoration of coral reefs and seagrassbeds by protection of fishes, sharks, turtles, and sirenians invery large reserves on the scale of all of Florida Bay and theFlorida Keys—an approach recently advocated for terrestrialecosystems (111). Once again, small-scale grazing experimentswith reef fishes (112) show that fishes could reverse the over-growth of corals by macroalgae on a massive scale. The poten-tial for reducing diseases of corals and turtlegrass by restoringnatural levels of grazing is unproven but consistent with histor-ical evidence (27).
In summary, historical documentation of the long-term ef-fects of fishing provides a heretofore-missing perspective forsuccessful management and restoration of coastal marine eco-systems. Previous attempts have failed because they have fo-cused only on the most recent symptoms of the problem ratherthan on their deep historical causes. Contrary to romantic no-tions of the oceans as the “last frontier” and of the supposedlysuperior ecological wisdom of non-Western and precolonial so-cieties, our analysis demonstrates that overfishing fundamen-tally altered coastal marine ecosystems during each of thecultural periods we examined. Changes in ecosystem structureand function occurred as early as the late aboriginal and earlycolonial stages, although these pale in comparison with subse-quent events. Human impacts are also accelerating in their mag-nitude, rates of change, and in the diversity of processesresponsible for changes over time. Early changes increased thesensitivity of coastal marine ecosystems to subsequent distur-bance and thus preconditioned the collapse we are witnessing.
References and Notes1. J. B. C. Jackson, Coral Reefs 16, S23 (1997).2. K. A. Bjorndal, A. B. Bolten, M. Y. Chaloupka, Ecol. Appl.
10, 269 (2000).3. G. C. L. Bertram and C. K. Ricardo Bertram, Biol. J. Linn.
Soc. 5, 297 (1973).
4. K. W. Kenyon, J. Mammal. 58, 97 (1977).5. D. H. Cushing, The Provident Sea (Cambridge Univ. Press,
Cambridge, UK, 1988).6. J. A. Estes, D. O. Duggins, G. B. Rathbun, Conserv. Biol. 3,
252 (1989).7. R. S. Steneck, in Proceedings of the Gulf of Maine Ecosys-
tem Dynamics Scientific Symposium and Workshop (RAR-GOM Report 91-1, Regional Association for Research inthe Gulf of Maine, Hanover, NH, 1997), pp. 151–165.
8. P. K. Dayton, M. J. Tegner, P. B. Edwards, K. L. Riser, Ecol.Appl. 8, 309 (1998).
9. J. M. Casey and R. A. Myers, Science 228, 690 (1998).10. J. A. Hutchings, Nature 406, 882 (2000).11. E. Ingersoll, in The History and Present Condition of the
Fishery Industries, G. B. Goode, Ed. (U.S. Department ofthe Interior, Tenth Census of the United States, Washington,DC, 1881), pp. 1–252.
12. “Fishing” is the original and most general term in the En-glish language for hunting and gathering all kinds of organ-isms in the oceans, including plants, invertebrates, andvertebrates ranging from sharks to true fishes to whales.“Overfishing” is the reduction of a species well below thesustainable yield or to such low abundance that it may notrecover even if fishing ceases.
13. J. H. Brown, Macroecology (Univ. of Chicago Press, Chi-cago, IL, 1995).
14. J. B. C. Jackson, BioScience 41, 475 (1991).15. R. C. Francis and S. R. Hare, Fish. Oceanogr. 3, 279
(1994).16. A. D. MacCall, Calif. Coop. Fish. Invest. 37, 100 (1996).17. C. B. Lange, S. K. Burke, W. H. Berger Clim. Change 16,
319 (1990).18. J. B. C. Jackson, in Biotic Interactions in Recent and Fossil
Benthic Communities, M. J. S. Tevesz, P. L. McCall, Eds.(Plenum, New York, 1983), pp. 39–120.
19. S. J. M. Davis, The Archaeology of Animals (Yale Univ.Press, New Haven, CT, 1987).
20. G. Wefer, W. H. Berger, J. Bijima, G. Fischer, in Use ofProxies in Paleoceanography: Examples from the South At-lantic, G. Fischer, G. Wefer, Eds. (Springer-Verlag, Berlin,1999), pp. 1–68.
21. D. S. Jones, Paleontol. Soc. Pap. 4, 37 (1998).22. C. W. Finkl Jr., J. Coast. Res. Spec. Iss. 17, 402 (1995).23. A. W. Crosby, Ecological Imperialism: The Biological Ex-
pansion of Europe 900–900 (Cambridge Univ. Press, Cam-bridge, UK, 1986).
24. Biological proxies include fossils or archaeological re-mains that may indicate presence, abundance, age, growthrate, health, or body size, among other factors, of selectedtaxa. Biogeochemical proxies include concentrations of in-organic or organic constituents and isotopic ratios in sedi-ments or skeletons that track former abundances ofunpreserved organisms and variations in parameters such astemperature, salinity, oxygen, nutrient chemistry, and pro-ductivity. Physical proxies include sedimentary structuresand composition that reflect water movements, runoff fromthe land, and rate of sedimentation. Historical proxies in-
11

ANNUAL EDITIONS
clude demographic, customs, and commercial records, aswell as explorers’ and naturalists’ descriptions of sights andevents and nautical charts marking reefs, coastal wetlands,and other landmarks.
25. R. S. Bradley, Paleoclimatology: Reconstructing Climatesof the Quaternary (Academic Press, San Diego, ed. 2,1999).
26. S. M. Kidwell and K. W. Flessa, Annu. Rev. Ecol. Syst. 26,269 (1995).
27. J. B. C. Jackson, Proc. Natl. Acad. Sci. U.S.A. 98, 5411(2001).
28. D. H. Janzen and P. S. Martin, Science 215, 19 (1982).29. P. K. Dayton, Annu. Rev. Ecol. Syst. 16, 215 (1985).30. J. A. Estes and J. F. Palmisano, Science 185, 1058 (1974).31. C. A. Simenstad, J. A. Estes, K. W. Kenyon, Science 200,
403 (1978).32. E. Sala, C. F. Boudouresque, M. Harmelin-Vivien, Oikos
82, 425 (1998).33. J. A. Estes, M. T. Tinker, T. M. Williams, D. F. Doak, Sci-
ence 282, 473 (1998).34. B. J. Bourque, Diversity and Complexity in Prehistoric
Maritime Societies: A Gulf of Maine Perspective (Plenum,New York, 1995).
35. K. Sherman, Ecol. Appl. 1, 349 (1991).36. M. J. Tegner and P. K. Dayton, ICES (Int. Counc. Expl.
Sea) J. Mar. Sci. 57, 579 (2000).37. J. M. Erlandson, et al., Radiocarbon 38, 355 (1996).38. A. Ogden, The California Sea Otter Trade (Univ. of Cali-
fornia Press, Berkeley, 1941).39. M. J. Tegner and P. K. Dayton, Mar. Ecol. Prog. Ser. 77,
49 (1991).40. N. Knowlton, Proc. Natl. Acad. Sci. U. S. A. 98, 5419
(2001).41. J. Allen, C. Gosden, J. P. White, Antiquity 63, 548 (1989).42. T. P. Hughes, Science 265, 1547 (1994).43. R. A. Kenchington, Managing Marine Environments (Tay-
lor and Francis, New York, 1990).44. J. M. Pandolfi and J. B. C. Jackson, Ecol. Monogr. 71, 49
(2001).45. R. B. Aronson, W. F. Precht, I. G. MacIntyre, Coral Reefs
17, 223 (1998).46. J. Geister, Proc. 3rd Int. Coral Reef Symp. 1, 23 (1977).47. H. A. Lessios, Annu. Rev. Ecol. Syst. 19, 371 (1988).48. J. E. Duerden, West Indian Bull. 1901, 121 (1901).49. J. Sapp, What Is Natural? Coral Reef Crisis (Oxford Univ.
Press, New York, 1999).50. R. M. Seymour and R. H. Bradbury, Mar. Ecol. Prog. Ser.
176, 1 (1999).51. R. Ormond et al., in Acanthaster and the Coral Reef: A The-
oretical Perspective, R. H. Bradbury, Ed. (Springer-Verlag,Berlin, 1990), pp. 189–207.
52. A. Steven, An Analysis of Fishing Activities on PossiblePredators of the Crown of Thorns Starfish (Acanthasterplanci) of the Great Barrier Reef (Prepared for the GreatBarrier Reef Marine Park Authority, Townsville, Australia,1988).
53. C. Birkeland, Mar. Biol. 69, 175 (1982).
54. C. C. MacKnight, The Voyage to Marege: MacassanTrepangers in Northern Australia (Melbourne Univ. Press,Melbourne, Australia, 1976).
55. D. T. Neil, in Moreton Bay and Catchment, I. R. Tibbetts,N. J. Hall, W. C. Dennison, Eds. (Univ. of Queensland,Brisbane, Australia, 1998), pp. 3–54.
56. D. Jones, The Whalers of Tangalooma (Nautical Associa-tion of Australia, Melbourne, 1980).
57. R. Ganter, The Pearl-Shellers of Torres Strait: ResourceUse, Development and Decline, 1860s–1960s (MelbourneUniv. Press, Melbourne, Australia, 1994).
58. R. H. Quinn, Fisheries Resources of the Moreton Bay Re-gion (Queensland Fish Management Authority, Brisbane,Australia, 1993).
59. J. C. Ogden, in Handbook of Seagrass Biology: An Ecosys-tem Perspective, R. C. Phillips, C. P. McRoy, Eds. (GarlandSTPM, New York, 1980), pp. 173–198.
60. G. W. Thayer, D. W. Engel, K. A. Bjorndal, J. Exp. Mar.Biol. Ecol. 62, 173 (1982).
61. J. C. Ogden, L. Robinson, H. Whitlock, H. Daganhart, R.Cebula, J. Exp. Mar. Biol. Ecol. 66, 199 (1983).
62. G. W. Thayer, K. A. Bjorndahl, J. C. Ogden, S. L. Will-iams, J. C. Zieman, Estuaries 7, 351 (1984).
63. H. Kirkman, Aquat. Bot. 5, 63 (1978).64. E. G. Abal and W. C. Dennison, Mar. Freshw. Res. 47, 763
(1996).65. J. C. Zieman, J. W. Fourqurean, T. A. Frankovich, Estuar-
ies 22, 460 (1999).66. C. J. Limpus, P. J. Couper, M. A. Read, Mem. Queensland
Mus. 35, 139 (1994).67. C. J. Limpus, in State of the Great Barrier Reef World Her-
itage Area Workshop, D. Wachenfeld, J. Oliver, K. Davis,Eds. (Great Barrier Reef Marine Park Authority, Towns-ville, Australia, 1995), pp. 258–265.
68. W. Dampier, A New Voyage around the World (Dover,New York, 1968).
69. E. Thorne, The Queen of the Colonies (Sampson Low, Mar-son, Searle, and Rivington, London, 1876).
70. G. M. Allen, Am. Comm. Int. Wildl. Protect. Spec. Pub. 11,1 (1942).
71. G. E. Heinsohn, R. J. Lear, M. M. Bryden, H. Marsh, B. R.Gardner, Environ. Conserv. 5, 91 (1978).
72. H. Marsh, P. Corkeron, I. Lawler, J. Lanyon, A. Preen,Great Barrier Reef Marine Park Authority Rep. 41, 1(1996).
73. A. Preen, Mar. Ecol. Prog. Ser. 124, 201 (1995).74. R. Elmgren, Ambio 18, 326 (1989).75. C. B. Officer, et al., Science 223, 22 (1984).76. S. W. Nixon, Ophelia 41, 199 (1995).77. S. R. Cooper and G. S. Brush, Estuaries 16, 617 (1993).78. R. J. Orth and K. A. Moore, Science 222, 51 (1983).79. R. I. E. Newell, in Understanding the Estuary: Advances in
Chesapeake Bay Research, M. P. Lynch, E. C. Krome, Eds.(Chesapeake Bay Research Consortium, Baltimore, MD,1988), pp. 536–546.
80. B. J. Rothschild, J. S. Ault, P. Goulletquer, M. Héral, Mar.Ecol. Prog. Ser. 111, 29 (1994).
12

Article 41. Historical Overfishing and the Recent Collapse of Coastal Ecosystems
81. R. B. Jonas, Am. Zool. 37, 612 (1997).82. T. J. Smayda, in Toxic Marine Phytoplankton, E. Graneli et
al., Eds. (Elsevier Science, New York, 1990), pp. 29–40.83. J. M. Burkholder, et al., Nature 358, 407 (1992).84. S. R. Cooper, The History of Water Quality in North Caro-
lina Estuarine Waters as Documented in the StratigraphicRecord (Univ. of North Carolina Water Resources ResearchInstitute, Raleigh, NC, 2000).
85. J. Persson and P. Jonsson, Mar. Pollut. Bull. 40, 122(2000).
86. H. S. Lenihan and C. H. Peterson, Ecol. Appl. 8, 128(1998).
87. H. S. Lenihan, F. Micheli, S. W. Shelton, C. H. Peterson,Limnol. Oceanogr. 44, 910 (1999).
88. C. B. Officer, T. J. Smayda, R. Mann, Mar. Ecol. Prog. Ser.9, 203 (1982).
89. J. E. Cloern, Mar. Ecol. Prog. Ser. 9, 191 (1982).90. S. R. Carpenter, et al., Ecol. Monogr. 71, 163 (2001).91. D. Pauly, V. Christensen, J. Dalsgaard, R. Froese, F. Torres
Jr., Science 279, 860 (1998).92. T. H. Huxley, Fish. Exhib. Lit. 4, 1 (1884).93. H. J. Cranfield, K. P. Michael, I. J. Doonan, Aquatic Con-
serv. Mar. Freshw. Ecosyst. 9, 461 (1999).94. W. M. Hochachka and A. A. Dhondt, Proc. Natl. Acad. Sci.
U. S. A. 97, 5303 (2000).95. J. T. Carlton and J. B. Geller, Science 261, 78 (1993).96. H. S. Lenihan, Ecol. Monogr. 69, 251 (1999).97. J. J. Stachowicz, R. B. Whitlatch, R. W. Osman, Science
286, 1577 (1999).98. N. Myers, Science 269, 358 (1995).99. N. Knowlton, Am. Zool. 32, 674 (1992).100. S. Naeem, Conserv. Biol. 12, 39 (1998).101. J. Munro, ICLARM (Int. Cent. Living Aquat. Resour.
Manag.) Stud. Rev. 7, 1 (1983).102. J. L. Munro, in Fish and Fisheries Series; Reef Fisheries,
N. V. C. Polunin, C. M. Roberts, Eds. (Chapman & Hall,New York, 1996), pp. 1–14.
103. M. J. Fogarty, Can. Spec. Publ. Fish. Aquat. Sci. 125, 273(1998).
104. C. D. Harvell, et al., Science 285, 1505 (1999).105. R. R. Colwell, Science 274, 2025 (1996).106. R. E. Turner and N. N. Rabalais, Nature 368, 619 (1994).107. D. Justic, in Modern and Ancient Continental Shelf Anox-
ia, R. V. Tyson, T. H. Pearson, Eds. (Geological Society,London, 1991), pp. 95–105.
108. L. W. Botsford, J. C. Castilla, C. H. Peterson, Science 277,509 (1997).
109. R. T. Paine, Nature 355, 73 (1992).110. R. E. Ulanowicz and J. H. Tuttle, Estuaries 15, 298
(1992).111. M. E. Soulé, J. Terborgh, Eds., Continental Conservation
(Island, Washington, DC, 1999).112. S. M. Lewis, Ecol. Monogr. 56, 183 (1986).113. Cod body length for samples older than 50 years was de-
rived from cod vertebrae collected at the Turner Farm shellmidden, North Haven, Maine. Five occupations are recog-nized: Occupations 1 (5300 to 4900 yr B.P.), 2 (4500 to
4200 yr B.P.), 3 (3700 to 3500 yr B.P.), and 4 (= CeramicPeriod, 3000 to 1000 yr B.P.), and Plow Zone (mixed fromearlier occupations but mostly postdating 1000 yr B.P.). Re-gression of body length on vertebra diameter of living codallowed estimation of body lengths from vertebrae of an-cient cod [y = 61.0 + 204.6log(x)]. This model assumes thatwe are using the largest vertebra for each fish, and willtherefore tend to underestimate actual body size in caseswhere smaller vertebrae are used. Data from the past 50years are actual body lengths reported from coastal zones[H. B. Bigelow and W. C. Schroeder, Fish. Bull. Fish Wildl.Serv. 53, 1 (1953) ; J. S. Hacunda, Fish. Bull. 79, 775(1981); F. P. Ojeda, thesis (Univ. of Maine, 1987)].
114. Percent Caribbean localities with A. palmata or A. cervi-cornis as the dominant or codominant corals were derivedfrom 50 studies from Antigua, Bahamas, Barbados, Belize,Bonaire, Cayman Islands, Colombia, Dominican Republic,Florida, Haiti, Jamaica, Mexico, Netherlands Antilles, Pan-ama, Puerto Rico, and U.S. Virgin Islands. Studies con-tained either paleoecological data from outcrops of fossilreefs or from sediment cores, or ecological data. For A. pal-mata, only localities described as reef crest or between 0-and 10-m water depth were included (131 localities). For A.cervicornis, only localities described as forereef, reef slope,or between 10- and 20-m water depth were included (72 lo-calities). Leeward and windward environments were notdistinguished. The percentage of localities that contained A.palmata or A. cervicornis as the most abundant coral wasestimated for four time intervals: Late Pleistocene (beforehumans arrived in the Americas), Holocene (when only ab-original populations were present), pre-1983 (before themass mortality of Diadema antillarum), and post-1983 (af-ter the Diadema mortality).
115. We dedicate this paper to the memory of Mia Tegner whodied while diving after this paper was submitted. This workwas conducted as part of the Long-Term EcologicalRecords of Marine Environments, Populations and Commu-nities Working Group supported by the National Center forEcological Analysis and Synthesis (funded by NSF grantDEB-0072909, the University of California, and the Uni-versity of California, Santa Barbara).
1Scripps Institution of Oceanography, University of California, SanDiego, La Jolla, CA 92093-0244, USA. 2Center for Tropical Paleo-ecology and Archeology, Smithsonian Tropical Research Institute,Box 2072, Balboa, Republic of Panama. 3National Center for Ecolog-ical Analysis and Synthesis, 735 State Street, Suite 300, Santa Barbara,CA 93101, USA. 4Archie Carr Center for Sea Turtle Research and De-partment of Zoology, University of Florida, Gainesville, FL 32611,USA. 5Department of Wildlife, Fish, and Conservation Biology, Uni-versity of California, Davis, CA 95616, USA. 6Department of Anthro-pology, 155 Pettengill Hall, Bates College, Lewiston, ME 04240,USA. 7Centre for Resource and Environmental Studies, Australian Na-tional University, Canberra, ACT 0200, Australia. 8Department of An-thropology, University of Oregon, Eugene, OR 97403, USA. 9U.S.Geological Survey, A-316 Earth and Marine Sciences Building, Uni-versity of California, Santa Cruz, CA 95064, USA. 10Center for Coral
13
ANNUAL EDITIONS
Reef Biodiversity, Department of Marine Biology, James Cook Uni-versity, Townsville, QLD 4811, Australia. 11Department of Geophys-ical Sciences, University of Chicago, 5734 South Ellis Avenue,Chicago, IL 60637, USA. 12Institute of Marine Sciences, University ofNorth Carolina at Chapel Hill, 3431 Arendell Street, Morehead City,NC 28557, USA. 13Department of Paleobiology, National Museum ofNatural History, Smithsonian Institution, Washington, DC 20560-0121, USA. 14School of Marine Sciences, University of Maine, Dar-ling Marine Center, Orono, ME 04573, USA. 15Department of Ecolo-
gy, Evolution, and Marine Biology, University of California, SantaBarbara, CA 93106, USA.
*To whom correspondence should be addressed. E-mail: [email protected]
†Deceased.
From Science, July 27, 2001, pp. 629-637. © 2001 by the American Association for the Advancement of Science, http;//www.sciencemag.org.Reprinted by permission.
14