econ 1150 final exam review sheet lecture updated december 11
TRANSCRIPT

ECON 1150 Final exam review sheet Lecture updated December 11th 2013 Fall 2013 The final exam is December 12th 1:30pm in 304 Dealy Hall. The test will have four sections (see the
review sheet for more details) section I multiple choice will come largely from Quizzes 3-5 and practice quiz 6. Here are answers to Quiz 3 Quiz 4 Quiz 5 and practice quiz 6. Section II will be very short answer, almost fill in the blank, taken largely from EC short answer questions on Quizzes 3-5. Section III will be short essays some also from EC quiz questions and section IV Longer essays (see the review sheet below for topics). One long essay can be your own pro and cons key issue. For this last essay you may bring Figures, pictures and references (but no text) with you to the exam, see special topic instructions and the notes on debt and growth.
Part I: 2 pages more or less taken from the three quizzes and the Quiz 6 Blackboard practice quiz (see answers here) Key terms not in Mankiw or rarely mentioned and what you do not have to know: Taylor rule, Misery index, crowding-in, quantitative easing, secular stagnation, internal devaluation (ep/p* is RER, if e cannot fall, perhaps p—domestic prices and wages (this is happening in Greece now…deflation, prices are falling). Wages and prices rose faster than in Germany during the 2000-2008 boom, now they must fall to reduce raise NX in the GIPSI countries, see Krugman, 2013 Chapters 2 and 10. Things you do not need to know: IS-LM or IS-MP from the NY Times blog, except, MP stands for monetary policy (the Taylor rule the CB uses to determine interest rates). IS stands for investment savings balance, this is just a mapping of Mankiw’s loanable funds equilibrium points (interest rate on vertical axis) where output (real GDP) determines I and S, actual just S = s*Y or the S = MPS*Y or S = (1-MPC)* Y (this is where the multiplier formula, 1/MPS comes from, output changes to generate enough savings to make S=I. The LM curve is the same thing, it is a locus of all the points on the money demand diagram laid out in Chapter 21 Figure 1 (where the supply of money determines the interest rate, or what is the same thing, the CB uses monetary policy to set the interest rate, usually this is just the Federal Funds Rate, but right now it is other longer term rates (as well as the famous 2% inflation target…). Diagrams you may need to know: the loanable funds diagram, the three panel diagram with the supply
of dollars and NX in the lower right, the money demand diagram from Chapter 21 (Figure 1, etc.) the Phillips curve (PC) diagram from Chapter 22 (roughly) and the LRAS-SRAS-AD diagram from Chapter 20, the Phillips curve just maps the AD-SRAS diagram into inflation (changes in P) and unemployment (corresponding to LRAS) where the natural rate of unemployment and LRAS generally coincide (why is this? Hint: think about equilibrium in the labor market, though this is a bit of an over-simplification as wages have not been a significant source of inflationary pressure recently… oh, oh secular stagnation? We hope not.).
Diagrams you do not need to know for this exam: all the “Wonkish and unimportant” stuff from
Krugman’s blog, as summarized here, mainly the IS-LM and the IS-MP diagrams. II. Final short answer questions (variations on the quiz EC questions see the end of the last 3
quizzes, as pasted below).

III. Final required short essays (these may be sections of long essay questions). Likely required topics include.
1. The debt vs. Austerity threat to growth debate (deficit reduction) 2. Inflation, deflation and long term growth, secular stagnation, will more bubbles inflation help in the
longer term? The value of higher inflation, the risks (2% vs. 4%) see Table 1A. 3. Wages and unemployment, higher minimum wages and LRAS (text or practice questions on this),
minimum wages Section IV. Longer essays (answer 2 or 3 depending on time left, one of these may be a continuation of
one of the short essays mentioned above. You can replace at least one long essay with your special topic question. This does not preclude for doing the extra credit typed version mention above. For the “in class” version, you can optionally bring a few figures, Tables and/or references to refer to in your essay. You must turn these in before the exam starts, I will return them to you when you finish all other parts of the exam. Tables/Figures/pictures must be numbered and references should be in APA author, date format. Do not hand in Figures or references you will not have time to reference. in the written essay. Again, you must turn in supplementary materials before the exam. No lists, bullet points, outlines allowed. All other sections of Final questions must be turned in before pick up your supplementary materials. Fold your supplementary materials and turn it in with final exam booklet.
Longer essays on the final exam will all likely have the pro and con format (except for the short answer essay parts): here are some examples that should sound familiar:
(1) the case for and against higher inflation (above the current 1%) as discussed in class and in several recent NY Times articles by Binyamin Appelbaum (see yesterday and October 26th for example, (and in class, recall the inflation as theft video).
(2) The case for and against flexible wages (labor markets) as discussed in class (recall the efficiency and minimum wage discussion). Ironically Eduardo Porter says Europe is opting for an “Americanized” labor markets according just as President Obama and labor groups are pressing for higher minimum or “living” wages (but see Obama CEA head Christine Romer’s view on this issue—if you have trouble reading NY Times articles, let me know, here are the labor market articles in a pdf for example).
(3) The case for and against a higher public debt (continued government budget deficits) in countries that print and borrow in their own currencies (as opposed to those that do not, such as Greece or Spain). Notes on debt and growth topic. Here you can use the “capital flight” diagrams, with quantitative easing (quietly!!). Perhaps also skim briefly the Good the Bad and the Ugly… Chapter 4 in last year’s IMF report Larry Summers argue crises are caused by too much debt, and solved by more debt….
Special topics are now open to everyone as long essays (let me know if I forgot yours). 4. Walmart wages and prices (both lower… ) this is an extension of question 2 above, where wage
flexibility (higher minimum wages) has secular and cyclical implications. Continue and build on the American (Walmart?) wage flexibility example. When you go to France or Italy or Germany you may notice that in supermarkets there is not one gathering up shopping carts (at least where I shop).. Instead everyone put a Euro coin in a machine like those at many airports. This frees up a shopping cart for you to use, which you have to return to get your Euro back. This deposit system replaces one or more low paid workers who gather the shopping carts from close your car. High wages and formal employment restrictions have made it to expensive to hire someone to gather shopping carts, not a great job, but it is a job for someone (in the U.S.). This is the fear of many economists, higher

wages may not raise prices but they will lead to “automation” and more self-serve lines, ATMs, gas pumps etc. See the picture of the Paris Metro below. Is this a good thing? In the long run yes, but as long as there are unemployed or less skilled or even disabled workers happy to have these jobs, perhaps part time or as starter jobs, raising wages and making labor markets less flexible may make those least able to adjust and compensate pay a price (aka unemployment).
5. LOLRs coping with liquidity crisis, legally or not: “Whatever it takes” Mario Draghi vs. vs Geitner, Paulson Bernanke (use Blinder index to read about these leaders). Did moral hazard concerns or legal restrictions justify letting Lehman go? Saving New York vs. the Euro (Super Mario vs Geitner, Paulson Bernanke, see pages for these policy makers in the Blinder, 2013). Recall how JP Morgan, Bank of America were saved. EC: How much has the U.S. government “lost” on TARP, why did it make sense for the government to buy shares in GM, AIG, GE, Chrysler, etc. during the panic (“fire sale”). Would it have been better to “nationalize” these firms (this happens frequently in other countries, and PK among others advocated this approach, especially for banks)
6. Deleveraging national debt: growth and long term debt, (see notes) Colbert/Herndon vs. Reinhart & Rogoff) this is an extension of #3 above.
7. Looking forward: secular stagnation in OECD countries? Continued monetary stimulus long commodities boom in developing countries, encouraging: a new world Middle class emerges even as the U.S. ostensibly declines (see the Brazil Havan video and notes for the inequality special topic and Krugman/Summers on the savings glut, a less than zero interest rate equilibrium in the loanable funds diagram)
8. Rising inequality and immigration: we discussed this in class, and one the quiz with LRAS. Several points are relative here: (1) CPI mis-measurement (2) what happens to median HH income with you have immigration of poorer workers? (3) Are both wages for Hispanic and non-Hispanic men falling (4) what about after-tax wages, health insurance paid for by employers is before tax, it paid out of taxable income if families but it on their own, so many unions and firms have used company paid health insurance, commuter plans etc. to raise wages. After tax wages adjust for these benefits, and have been rising and are less unequal than pre-tax income. Also the surging incomes of the top 1% are pre-tax incomes. To the extent that the income tax system is progressive (recall the Warren Buffet rule) inequality post tax is lower and rising less rapidly than pre-tax incomes. These instructions are probably out of date. As discussed in class, you will have an opportunity to replace one
of the above essays with your key issue essay, if you want to. There will also be an option to turn in a typed turnitin.com version of you case study after the final exam, for extra credit (these are not substitutes: you can do both or neither). The idea is a not provide a definitive exploration of any of these issues; rather it is to apply what you have learned in this course. Some topics draw on pre-midterm chapters: Walmart for example relates to the efficiency and minimum wage discussions in Chapter 15. Make it clear you have read the relevant sections of the texts (Mankiw, Krugman and Blinder) and are applying knowledge from the lecture and/or the text. Of course using BLS data or referring to the shorter assigned readings or videos (Colbert) is fine too. For example, for the Walmart question you might mention the number of unemployed youth 16-24 (14%) or w/o a HS degree (now 11%) higher than the 7% overall announced Friday. The key is to make use of material you learned in this course, using the pro and con format of Chapter 23 or of the NAFTA debate (lists on the final exam, paragraphs on the post exam version, references and perhaps visuals on both, prepared before the final exam). The most definitive summary of existing knowledge on these issues could produce a very low score (zero) unless it makes use of material from this course (you will find this in most classes). I have already provided some lists for the China and the Walmart question, let me know if you are interested in the wage inequality or prudential regulation (see Blinder on this one). Short answer (or perhaps short essay questions) copied from Quizzes 3-5
Quiz 5 Short Answer Questions
1. Don’t go in the water: A) A recent economist cover shows a hot air balloon sinking into an ocean full of sharks. what does the sinking balloon refer to? (one word) B) Name at least three sharks, C) Three bubbles and no inflation, according to Larry Summers, this means secular stagnation caused by what? Are we all doomed to be Japans? (What is Japan doing right now, perhaps the U.S. should do this too). The main cause of secular stagnation in Japan is a low ________ rate, how can we fix this problem (hint: Children of Men).
2. Needed: the courage to party: Krugman, 2012 argues the 2008 U.S. recession was analogous the loss of confidence experienced by Capital Hill babysitters Club. A) Explain, what did the baby sitting do to end its crisis? B) Why was the U.S. crisis more complicated than the baby sitting crisis, what additional measures does the Krugman recommend for the U.S. (and Greece?). C) Initially this would increase debt levels, at first this is not a problem, but what about the long run. D) What is a potential solution for both problems in the long run? (hint: see #1 and hot air). This is where Greece differs from the U.S. (or does it?) Explain. Distinguish between the ECB and Greece. Recent signs of hope in Frankfurt and Germany (hint: two Ms). E) What is a “Minsky moment”, what day time was our Minsky moment….?
3. Automatic stabilizers for States… Should we in the North East have helped the super housing boom Sun
Belt states? Why does this happen automatically in the U.S. but not in Europe? In Europe, crime and punishment (morality) plays a role in mitigating recessions, did it play a role in the U.S. as well? (hint Lehman Brothers) Should it have played a role? Distinguish between morality and legality, and compare Mario Draghi to our financial Trioka during the 2008 crisis (this is a reference to Blinder, 2013).
Quiz 3 EC Short Answer Questions:
1. Is inflation theft, legally or morally? (a) Who loses when inflation is unexpectedly high, the rich or the poor? (b) What can middle class households do to protect themselves against inflation? (c) How is Ben Bernanke’s Fed Reserve making it easier to do this right now? (hint: what the two FMs sell) Is this policy working? Is Ben happy? D) Do our policy makers seem to think we can trade inflation for unemployment? Do you agree with them? Explain.
2. According to Bagehot, 1858 to fulfill their LOLR role during crises, Central Banks should lend freely at penalty rates… (a) Why? Which CB followed this maxim at first in 2008-2009, the Fed or the ECB? Which CB changed course especially a new head took over in the year of the Dragon? (c) Did the ECB or the Federal Reserve now lend to banks at “penalty rates.” If not why not? Is this going to create moral hazard problems going forward? The ECB is making 3 year Euro loans at 1% interest to banks that do what? Could this be a penalty rate in disguise?
3. Current and former UCB Professors Christine Romer and Janet Yellen Professors are a little disappointed with Ben Bernanke because despite his nickname “Helicopter Ben” he has not been as aggressive as he might have been with monetary policy. (a) List the pros and cons of a 2% vs, 4% inflation target (perhaps 3% is a good compromise). (b) What is U.S. inflation now? Are we on target, or drifting away from Bernanke’s unofficial inflation target? (c) what can be done to raise the U.S. inflation rate? What are the risks of higher inflation?
Part II. EC Short Answer Questions (answer one below if you have time, carefully labeling answers 1a, 1b etc.)
4. Uncle Ben says with “great power comes great responsibility” (a) relate this maxim to McKinsey’s argument about hidden the cost of the U.S. “exorbitant privilege” (particularly during the Global Financial Crises-GFCs). (b) Do you think the U.S. would be better off renouncing or sharing the burden of printing the world’s reserve currency? Are we doing this already? (c) How would this affect us here in New York City? What are the benefits for NYC as a large financial center home of the world’s reserve currency? (hint: PIMCO and the NY Federal Reserve Bank).

China USA or ROW)r
interest rrate
CA = 100 CA = - 100
r0
r1
CA surplus I,S CA Deficit S1 < I1 I,S I1 < S1
S-18-1 China savings boom with an open capital account
S'(r)S0(r
I(r)
S(r)
I(r)
5. Krugman argues against the “Hellenization” of the Euro crises (and the GFC) arguing that economics is
not a morality play in which “bad” countries (cities?) need to be punished (Greece or NYC). (a) How does he make the case for shared responsibility for the Euro crisis? (this is actually part of the 1948 Bretton Woods agreement). (b) Briefly sketch Krugman’s two part plan to end the Euro Crisis. Are ECB head Super Mario “the Dragon” Draghi and German Chancellor Angela Merkel acting on this plan right now? Yes and no. Explain.
6. (a) What is Abe Economics? (Prime Minister Shinzō Abe)? (b) Is it working? How do we know? (c) the Abe Central bank is trying to engineer higher inflation. Why? Is inflation theft? (legally or morally, recall Lydia’s argument).
7. Is China our friend? In response to the financial crisis, China launches a massive stimulus program including high speed trains, new offices, apartments, an explosion of public spending. Did this help the U.S. recovery? Use the Figure 18diagram below to sketch the impact of this investment boom on the U.S. economy? Does this help explain why China’s currency is getting stronger and our mutual CA imbalances have shrunk? What is wrong with the picture you drew using S-18-1?

Pro and Con Lists: Debt and Growth (tradeoff: inflation and employment, SRAS vs. LRAS)
Pro: Fiscal spending stimulus was/is too low
1. Slow growth and low inflation remains a problem (Secular Stagnation) 2. Unemployment remains high (in OECD) meaning crowding out 3. Inflation is falling, risk is deflation, 4. Private demand remains weak 5. In countries that have floating exchange rates (albeit managed) and that print the currency they
borrow in (UK, Japan, U.S.) is Greek style crisis is unlikely, and may even be expansionary… 6. Even in Europe, a faster inflation for surplus countries is answer, not just debt relief
Con:
1. Debt is already high, high debt will slow future growth 2. A better long term deficit outlook builds investor confidence 3. Growth in countries that do not print their own currencies 4. Crowding out and/or unproductive public expenditures/investment is risk “bridge to
nowhere”
Pro and Con Lists: Walmart in New York (key tradeoff: wages vs. employment, and lower cost of living (lower inflation); Efficiency wages
Con: against Walmart,
1. Walmart competes with local mom and pop stores. 2. Walmart worsens trade balance, imports from China, 3. Walmart employees use Medicaid, EITC and food stamps 4. High turnover, short term employment 5. Walmart pays low wages, not a living wage
Pro: for Walmart
1. Walmart lowers prices 5-25% (15%) average for low income consumers (families with children) 2. Walmart jobs supplemented with Medicaid, EITC and food stamps (TANF requires work after 5
years for families with children. 3. Walmart is always hiring, lots of entry level jobs, high turnover. COSTCO low turnover. 4. Banning Walmart hurts low income consumers and entry level workers 5. Workers would rather work at Walmart than have no job at all (Barbara Ehrenreich) 6. Raising wages leads to more automation (a Euro for your shopping cart, RF EZ-Pass checkout)
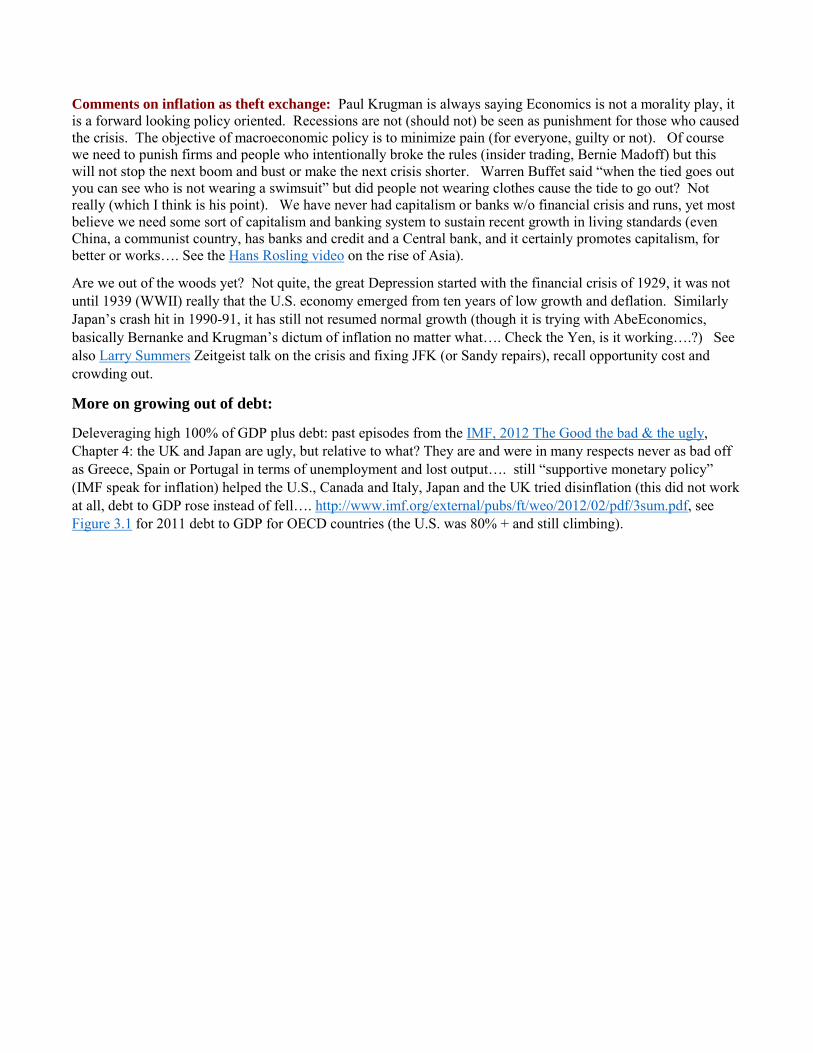
Comments on inflation as theft exchange: Paul Krugman is always saying Economics is not a morality play, it is a forward looking policy oriented. Recessions are not (should not) be seen as punishment for those who caused the crisis. The objective of macroeconomic policy is to minimize pain (for everyone, guilty or not). Of course we need to punish firms and people who intentionally broke the rules (insider trading, Bernie Madoff) but this will not stop the next boom and bust or make the next crisis shorter. Warren Buffet said “when the tied goes out you can see who is not wearing a swimsuit” but did people not wearing clothes cause the tide to go out? Not really (which I think is his point). We have never had capitalism or banks w/o financial crisis and runs, yet most believe we need some sort of capitalism and banking system to sustain recent growth in living standards (even China, a communist country, has banks and credit and a Central bank, and it certainly promotes capitalism, for better or works…. See the Hans Rosling video on the rise of Asia).
Are we out of the woods yet? Not quite, the great Depression started with the financial crisis of 1929, it was not until 1939 (WWII) really that the U.S. economy emerged from ten years of low growth and deflation. Similarly Japan’s crash hit in 1990-91, it has still not resumed normal growth (though it is trying with AbeEconomics, basically Bernanke and Krugman’s dictum of inflation no matter what…. Check the Yen, is it working….?) See also Larry Summers Zeitgeist talk on the crisis and fixing JFK (or Sandy repairs), recall opportunity cost and crowding out.
More on growing out of debt:
Deleveraging high 100% of GDP plus debt: past episodes from the IMF, 2012 The Good the bad & the ugly, Chapter 4: the UK and Japan are ugly, but relative to what? They are and were in many respects never as bad off as Greece, Spain or Portugal in terms of unemployment and lost output…. still “supportive monetary policy” (IMF speak for inflation) helped the U.S., Canada and Italy, Japan and the UK tried disinflation (this did not work at all, debt to GDP rose instead of fell…. http://www.imf.org/external/pubs/ft/weo/2012/02/pdf/3sum.pdf, see Figure 3.1 for 2011 debt to GDP for OECD countries (the U.S. was 80% + and still climbing).

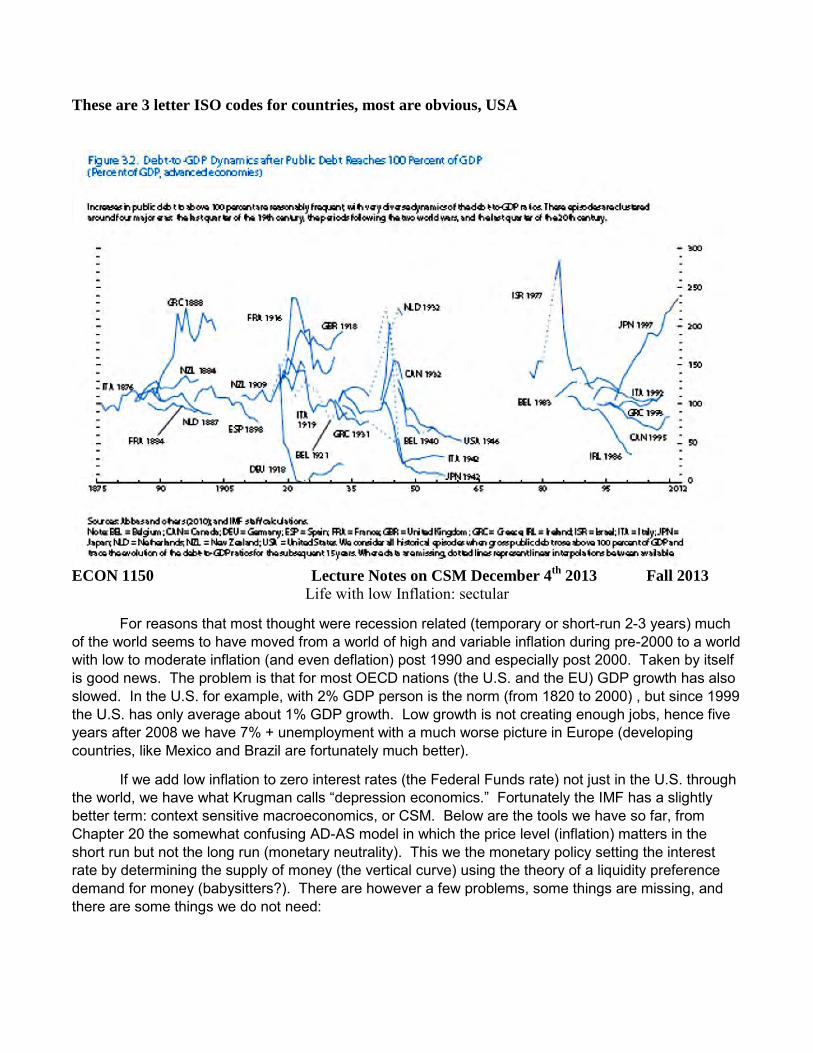
These are 3 letter ISO codes for countries, most are obvious, USA
ECON 1150 Lecture Notes on CSM December 4th 2013 Fall 2013
Life with low Inflation: sectular
For reasons that most thought were recession related (temporary or short-run 2-3 years) much of the world seems to have moved from a world of high and variable inflation during pre-2000 to a world with low to moderate inflation (and even deflation) post 1990 and especially post 2000. Taken by itself is good news. The problem is that for most OECD nations (the U.S. and the EU) GDP growth has also slowed. In the U.S. for example, with 2% GDP person is the norm (from 1820 to 2000) , but since 1999 the U.S. has only average about 1% GDP growth. Low growth is not creating enough jobs, hence five years after 2008 we have 7% + unemployment with a much worse picture in Europe (developing countries, like Mexico and Brazil are fortunately much better).
If we add low inflation to zero interest rates (the Federal Funds rate) not just in the U.S. through the world, we have what Krugman calls “depression economics.” Fortunately the IMF has a slightly better term: context sensitive macroeconomics, or CSM. Below are the tools we have so far, from Chapter 20 the somewhat confusing AD-AS model in which the price level (inflation) matters in the short run but not the long run (monetary neutrality). This we the monetary policy setting the interest rate by determining the supply of money (the vertical curve) using the theory of a liquidity preference demand for money (babysitters?). There are however a few problems, some things are missing, and there are some things we do not need:

1. We have two models of the interest rate, the loanable funds diagram from Chapter 19 and now the money supply set by the Federal reserve, which is it? The loanable funds model depends on the savings and investment (+NCO of course), while the Figure 1 depends on the supply and demand for money.
2. We need a link between GDP and the interest rate, we sort of have it in Figure 1 below (from the LDQ for Chapter 20) but GDP is vertical in the long run, this is full employment, but it has been five years. How long is the short run?
3. The Federal Funds (FF) rate has been zero for almost five years. This is technically a liquidity trap, it forces the Federal reserve to engage in unconventional monetary policy. Where is this in our models, is it important that the policy rate has hit zero?
4. Where is quantitative easing in these pictures, we snuck it in to the loanable funds market when China decided to sell all their Treasury securities (about $1.3 trillion) but that was very informal (and it is nowhere in our text book).
5. No Central Bank in the OECD (or almost anywhere else) has a money supply target. They all went to a Taylor rule (an interest rate target) and then to an inflation target (2% everywhere, for better or worse, except in Japan where they want inflation, period.). CBs had to switch to an nf
Those of you who go on to Intermediate Macroeconomics (God forbid) will solve some of these problems using the IS-LM model, or currently the IS-MP model (which incorporates the Taylor rule mention earlier).

FIGURE 1
How can we get savings and investment equal at a given interest rate? Answer change Y (GDP) to bring S & I into balance at a given interest rate, this is the IS curve.
I = I( i – π ) where r = i - π (the real interest rate determines investment).
Then S = MPS*Y or I = sY where lower case s is the MPS (the marginal propensity to save) and Y is real GDP.
A
B C


MPS= MPC = ∆G= 20% 80%
$100 Receives Spends Savesnicole 100 80 20Lukas 80 64 16Phillip 64 51.2 12.8Dermot 51 41 10Brendan 41 33 8.2Salvatore 33 26 6.6Gustav 26 21 5.2David 21 17 4.2Dunavan 17 13 3.4Lucy 13 11 2.7Matt 11 8.6 2.1Megan 8.6 6.9 1.7Kiana 6.9 5.5 1.4Will 5.5 4.4 1.1Sarah 4.4 3.5 0.9Brendan 3.5 2.8 0.7Anthony 2.8 2.3 0.6Lianna 2.3 1.8 0.5Elisha 1.8 1.4 0.4Lucas 1.4 1.2 0.3John 1.2 0.9 0.2Alexandra 0.9 0.7 0.2Total C & S 497 99Fiscal Multipier 5.0 (497/100) rounded off
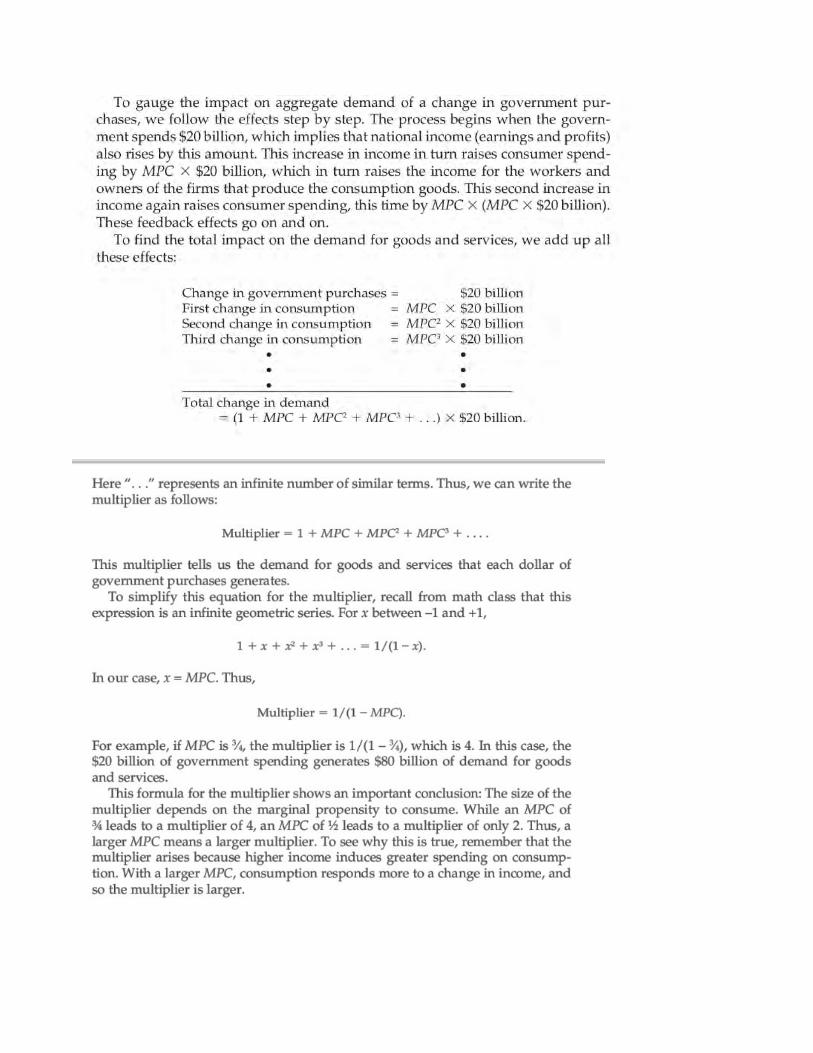
Why the Multiplier matters (see also lecture notes)
http://class.povertylectures.com/MankiwChapter20-21Powerpoint.pdf
Use a general formula for the multiplier ∆Y = x*∆G
Where x the fiscal multiplier with ∆G financed entirely by new government debt that is ∆D = ∆G

Now will fiscal stimulus will increase or decrease debt to GDP (D/Y) ratio?
It depends on whether the fiscal multiplier is greater or less than 1…
Poor Greece and Ireland….
Crowding out dominates: multiplier less than one.
Crowding in dominates: multiplier greater than one.
Sources of Crowding out or Crowding in:
1. Interest rates rise □
2. Inflation causes RER to appreciate □
3. Loss of Confidence causes RER to depreciate? □

See Text box page 480

Professor Yellen is happy and so are we! Happy Thanksgiving!
Panel Backs Yellen for Fed Chief to Set Up Full Senate Vote
J. Scott Applewhite/Associated Press
Janet L. Yellen, who on Thursday moved a step closer to becoming Fed chairwoman, smiled as she finished testifying before
the Senate Banking Committee last week.
By JONATHAN WEISMAN Published: November 21, 2013
•
WASHINGTON — Janet L. Yellen took a giant step on Thursday toward becoming the first woman to
lead the Federal Reserve Board when the Senate Banking Committee sent her nomination to the full
Senate with a 14-8 vote. Timeline
Yellen’s Path to the Pinnacle
The committee’s vote showed how the Federal Reserve’s policies to keep
money flowing to the ailing economy have made the Fed a part of the
ongoing partisan wars in Washington. It broke largely along party lines,
with three Republican senators — Bob Corker of Tennessee, Mark Kirk of Illinois and Tom Coburn of
Oklahoma — voting in favor of her nomination. One Democrat, Senator Joe Manchin III of West

Virginia, voted against her. Senator Heidi Heitkamp, a conservative Democrat from North Dakota who
supported Ms. Yellen’s nomination, said there is a “legitimate debate about the easy money policy of the
Fed,” and that the “no” votes reflected protests against “quantitative easing,” the Fed’s policy of buying
Treasury bonds to pump the economy with cash. But, Ms. Heitkamp added outside the committee’s
meeting room, “Everyone in there expects her to be confirmed.” Senator Mike Crapo of Idaho, the
ranking Republican on the committee, explained his vote against the nomination, saying
“unconventional and untested policies continue unabated” and “the long-term costs are unclear and
worrisome.” The Republican votes against Ms. Yellen indicated the full Senate would not give her
anything close to a unanimous vote of confidence, but supporters and opponents said she would easily
have enough for confirmation, which will most likely come in December.
What is the Phillips Curve? Trade off in S-R inflation and unemployment, but the short-run, has lasted five years?
See Larry Summers talk at IMF ARC conference in honor of Stanley Fischer, Paul Krugman’s translation of Summers IMF comments.

Table 22-15 Misery IndexDates Federal Reserve Misery Misery MiseryServed Chairman π U Index π U Index π U Index
Arthur Burns 3.9 3.8 7.7 6.5 6.3 12.8 2.6 2.5 5.1William Miller 7.9 6.8 14.7 11.2 5.9 17.1 3.3 -0.9 2.4Paul Volcker 8.5 7.1 15.6 5.8 7.8 13.6 -2.7 0.7 -2.0alan Greenspan 3.2 7.8 11 3.1 5.5 8.6 -0.1 -2.3 -2.4Ben Bernanke 2.6 5.4 8.0 2.3 7.1 9.4 -0.3 1.7 1.4Jane Yellen?Chairwoman? http://www.nytimes.com/interactive/2013/09/12/business/inflation-and-unemployment-under-fed-chairmen.html
Source: The Economy under recent Fed Leaders, October 8th 2013, New York Times.
5 years before term During their Term Change in Misery Index
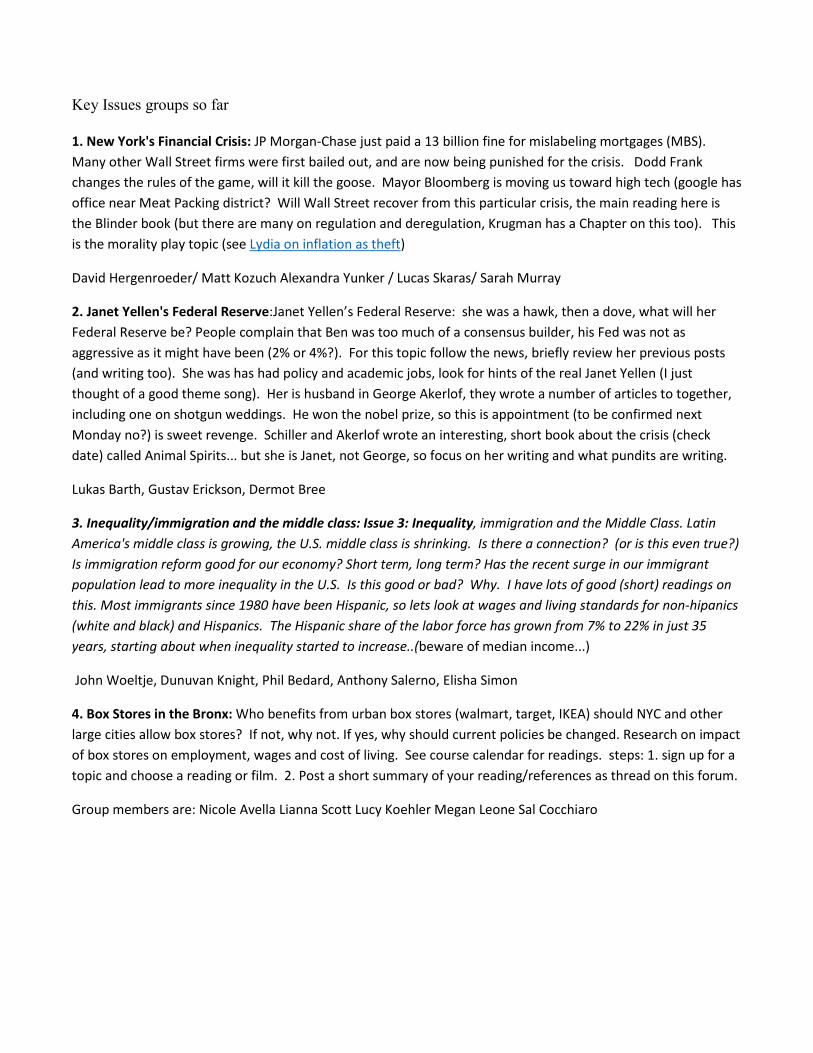
Key Issues groups so far 1. New York's Financial Crisis: JP Morgan-Chase just paid a 13 billion fine for mislabeling mortgages (MBS). Many other Wall Street firms were first bailed out, and are now being punished for the crisis. Dodd Frank changes the rules of the game, will it kill the goose. Mayor Bloomberg is moving us toward high tech (google has office near Meat Packing district? Will Wall Street recover from this particular crisis, the main reading here is the Blinder book (but there are many on regulation and deregulation, Krugman has a Chapter on this too). This is the morality play topic (see Lydia on inflation as theft)
David Hergenroeder/ Matt Kozuch Alexandra Yunker / Lucas Skaras/ Sarah Murray
2. Janet Yellen's Federal Reserve:Janet Yellen’s Federal Reserve: she was a hawk, then a dove, what will her Federal Reserve be? People complain that Ben was too much of a consensus builder, his Fed was not as aggressive as it might have been (2% or 4%?). For this topic follow the news, briefly review her previous posts (and writing too). She was has had policy and academic jobs, look for hints of the real Janet Yellen (I just thought of a good theme song). Her is husband in George Akerlof, they wrote a number of articles to together, including one on shotgun weddings. He won the nobel prize, so this is appointment (to be confirmed next Monday no?) is sweet revenge. Schiller and Akerlof wrote an interesting, short book about the crisis (check date) called Animal Spirits... but she is Janet, not George, so focus on her writing and what pundits are writing.
Lukas Barth, Gustav Erickson, Dermot Bree
3. Inequality/immigration and the middle class: Issue 3: Inequality, immigration and the Middle Class. Latin America's middle class is growing, the U.S. middle class is shrinking. Is there a connection? (or is this even true?) Is immigration reform good for our economy? Short term, long term? Has the recent surge in our immigrant population lead to more inequality in the U.S. Is this good or bad? Why. I have lots of good (short) readings on this. Most immigrants since 1980 have been Hispanic, so lets look at wages and living standards for non-hipanics (white and black) and Hispanics. The Hispanic share of the labor force has grown from 7% to 22% in just 35 years, starting about when inequality started to increase..(beware of median income...)
John Woeltje, Dunuvan Knight, Phil Bedard, Anthony Salerno, Elisha Simon
4. Box Stores in the Bronx: Who benefits from urban box stores (walmart, target, IKEA) should NYC and other large cities allow box stores? If not, why not. If yes, why should current policies be changed. Research on impact of box stores on employment, wages and cost of living. See course calendar for readings. steps: 1. sign up for a topic and choose a reading or film. 2. Post a short summary of your reading/references as thread on this forum.
Group members are: Nicole Avella Lianna Scott Lucy Koehler Megan Leone Sal Cocchiaro
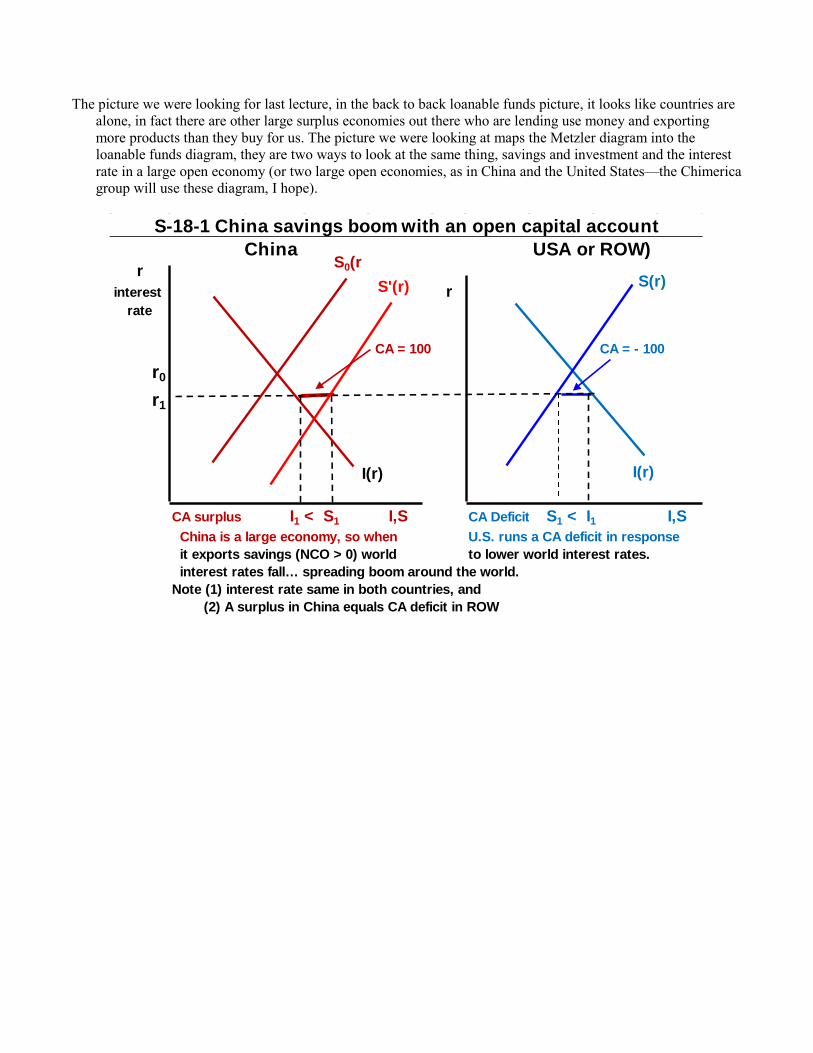
The picture we were looking for last lecture, in the back to back loanable funds picture, it looks like countries are alone, in fact there are other large surplus economies out there who are lending use money and exporting more products than they buy for us. The picture we were looking at maps the Metzler diagram into the loanable funds diagram, they are two ways to look at the same thing, savings and investment and the interest rate in a large open economy (or two large open economies, as in China and the United States—the Chimerica group will use these diagram, I hope).
China USA or ROW)r
interest rrate
CA = 100 CA = - 100
r0
r1
CA surplus I,S CA Deficit S1 < I1 I,S China is a large economy, so when U.S. runs a CA deficit in response it exports savings (NCO > 0) world to lower world interest rates. interest rates fall… spreading boom around the world. Note (1) interest rate same in both countries, and (2) A surplus in China equals CA deficit in ROW
I1 < S1
S-18-1 China savings boom with an open capital account
S'(r)S0(r
I(r)
S(r)
I(r)

Figure S-18-5 The loanable funds and Metzler Diagrams compared CA deficit in the Metzler diagram Loanable funds diagram adds
U.S. NCO to domestic I to get total demand interest r
rater
r*
S < I I,S S = I + NCO I +NCOThe Metzler diagram shows the CA as the gap between S and I, which it is. Mankiw's loanable funds diagram adds the
Mankiw's loanable funds diagram is the two blue lines. The red dotted line is the I curve from the Metzler diagram, importing capitalfrom China and Germany allows the U.S. to invest more and save less…. The confusion comes from the fact that a trade deficit (NX < 0) implies a capitalinflow to the United States, if the U.S. was a net exporter of capital, NCO > 0 this diagram would be much more intuitive.
S'(r)S(r)
I(r)
S
I + NCONCO = -100
NCO= -100
D
I
D
I'