econ 300 econometrics problem set 1 solutions 300 econometrics problem set 1 solutions dennis c....
TRANSCRIPT

ECON 300
Econometrics
Problem Set 1
Solutions
Dennis C. Plott∗
Fall 2014
∗Email: [email protected]
1

Name: Dennis C. Plott
General Instructions
1. Due: Monday 15th September 2014 by 3:00 p.m.
2. Read and follow all instructions/directions carefully; an inability to do as such will result in points beingdeducted.
3. Only problem sets submitted in person will be accepted.
4. Do not copy.
• Be very careful when using sources outside of the recommended materials.
• Use your own words; this will better prepare you for the exams.
• Although not trivial, the problem sets are a relatively small portion of your final grade and areintended to help prepare you for the exams. If you are struggling with particular questions and/ortopics, then you are made aware of what you need to study.
5. All problems sets submitted must be stapled, typed, and well formatted. Note: non-Stata graphs, ifrequired, may be drawn, but must be done so neatly. Do not use white out or similar products.
6. Show all of your work. Support your answers as thoroughly as possible; i.e., graphically, conceptually,and mathematically. Note: this may not be feasible for all questions asked. State and define any conceptutilized and list and name any equation used. If required, label all graphs fully and completely; i.e., axes,intersections, curves, etc.
Original Score (%)
Adjustment (%)
Actual Score (%)
2

1. The ALS Ice Bucket Challenge involves dumping a bucket of ice water over your head and nominatingother people to follow suit in order to raise awareness and increase donations for amyotrophic lateralsclerosis (ALS)1; also known as Lou Gehrig’s disease.
(a) [8 points] According to the ALS Association (www.alsa.org), donations to the national office surgedduring a ten-day span of the Ice Bucket Challenge to approximately $160,000, from $14,480 duringthe same period a year ago as of 11 August 2014. What is the percent change in donations? What isthe Stata code for this calculation?
%∆ Donations =Donations2014 −Donations2013
Donations2013× 100%
=$160, 000− $14, 480
$14, 480× 100%
= 1004.97%
1 d i s p l ay ((160000−14480) /14480) ∗100
1004.9724
(b) [8 points] Charity Navigator (www.charitynavigator.org) is an independent non-profit organi-zation monitoring, evaluating, and providing information about various charities ensuring thosewho donate are well informed. One measure is “Program Expenses” which is the percent of thecharity’s budget spent on the programs and services it delivers. The Program Expenses for the ALSAssociation is 72.4% whereas the People for the Ethical Treatment of Animals (PETA) have a 83.8%.What is the difference between these two charities in terms of percentage points?
∆ = 83.8%− 72.4%
= 11.4 percentage points
(c) [4 points] As successful as the ALS Ice Bucket Challenge has been, are there any potential secondaryeffects? [Note: disregard those who were less than successful in their attempts; see Ice BucketChallenge Fails for examples.]
The key potential problem is funding cannibalism. Donations do not appear out of a vacuum. Becausepeople, on average, are limited in how much they are willing to donate to good causes, if someonedonates $100 to the ALS Association, he or she will likely donate less to other charities.
1ALS is a neurodegenerative disorder characterized by muscle spasticity, rapidly progressive weakness due to muscle wasting.This results in difficulty speaking, swallowing, breathing, and eventually death.
3

2. The following table contains a subsample of eight observations of the data from question three below.The main purpose of the this question is to appreciate what Stata does automatically. For all questionsasked calculate “by hand”. As a demonstration and to avoid completely annoying you, some answers andequations are provided in blue.
Wage Age Male Wagei −Wage (Wagei −Wage)2 agei − age (agei − age)2
1 10.94 20 0 10.94− 11.78 = −0.84 (−0.84)2 = 0.70 −1.63 2.642 11.61 20 1 11.61− 11.78 = −0.17 (−0.17)2 = 0.03 −1.63 2.643 12.75 23 0 12.75− 11.78 = 0.97 (0.97)2 = 0.94 1.38 1.894 12.76 24 0 12.76− 11.78 = 0.98 (0.98)2 = 0.96 2.38 5.645 10.68 21 1 10.68− 11.78 = −1.10 (−1.10)2 = 1.20 −0.63 0.396 12.85 22 1 12.85− 11.78 = 1.07 (1.07)2 = 1.15 0.38 0.147 12.07 23 0 12.07− 11.78 = 0.29 (0.29)2 = 0.08 1.38 1.898 10.57 20 1 10.57− 11.78 = −1.21 (−1.21)2 = 1.46 −1.63 2.64
Sum 94.23 173 6.54 17.88
(a) [10 points] Calculate the mean, median, minimum, and maximum values for wage and age.
wage =1
N
N∑i=1
wagei
=1
8(10.57 + 10.68 + 10.94 + 11.61 + 12.07 + 12.75 + 12.76 + 12.85)
=1
8(94.23)
= 11.78
median wage =wage4 + wage5
2
=11.61 + 12.07
2= 11.84
min(wage) = 10.57
max(wage) = 12.85
age =1
N
N∑i=1
agei
=1
8(20 + 20 + 20 + 21 + 22 + 23 + 23 + 24)
=1
8(173)
= 21.63
median age =age4 + age5
2
=21 + 22
2= 21.5
min(age) = 20
max(age) = 24
4

(b) [10 points] Calculate variance, standard deviation, covariance, and correlation for wage and age.
V ar(wage) =1
N − 1
N∑i=1
(wagei − wage)2
=1
7(6.54)
= 0.9341
SD(wage) =√V ar(wage)
=√
0.9341
= 0.9665
V ar(age) =1
N − 1
N∑i=1
(agei − age)2
=1
7(17.88)
= 2.55
SD(age) =√V ar(age)
=√
2.55
= 1.60
Cov(wage, age) =1
N − 1
N∑i=1
(wagei − wage)(agei − age)
= 1.25
Corr(wage, age) =Cov(wage, age)√
V ar(wage)√
V ar(age)
=Cov(wage, age)
SD(wage)SD(age)
=1.25
(0.97)(1.60)
= 0.81
Mean Median Min. Max. Variance St. Dev. Cov. Corr.
Wage 11.78 11.84 10.57 12.85 0.9341 0.9665 – –Age 21.63 21.50 20 24 2.55 1.60 – –
Wage/Age – – – – – – 1.25 0.81
5

3. The Chicago Tribune2 recently reported a plan to increase the minimum wage for Illinois and Chicago.3
The proposal is “to raise the city’s minimum wage rate from $8.25 to $13 an hour by 2018.” The dataset minwage.dta contains a sample of 1575 non-tip workers from the Chicago land area who have, atmost, a high school diploma. Answer the following questions by using the appropriate Stata command(s).In addition to the solution, provide the Stata code using the listing environment. Where appropriate,round all answers to two decimal places.
Variable Description
Wage Hourly wage; a continuous variable assumed to be Normally distributedAge Age, in years; a discrete variableMale An indicator variable; =1 if male and =0 if female
(a) [10 points] What is the mean, median, minimum, maximum, variance, standard deviation, covariance,and correlation for or between wage and age? Does the minimum value make sense for wage? Howabout for age? Does the correlation coefficient make sense between wage and age?
1 c l e a r a l l2 pwd3 use ”minwage . dta ” , c l e a r4
5 summarize wage , d e t a i l6 su age , d7 c o r r e l a t e wage age , covar iance8 co r r wage age
Mean Median Min. Max. Variance St. Dev. Cov. Corr.
Wage 11.92 11.92 8.25 15.52 1.05 1.03 – –Age 21.42 21.00 16.00 26.00 2.11 1.45 – –
Wage/Age – – – – – – 1.04 0.70
The current minimum wage for non-tip Illinois workers is $8.25 per hour, matching the minimumvalue. Likewise, Illinois labor laws put restrictions on when someone can start working. Therefore,both numbers makes sense. A priori, it would be expected that older workers have more experienceand as a result earn a higher wage. A correlation coefficient of approximately 0.70 is qualitativelyconsistent, at the very least, with economic theory in that we would not expect the correlationcoefficient to be zero or negative.
(b) [10 points] Create a histogram, overlaying a Normal distribution, for both wage and age showingtheir respective distributions. wage is assumed to be Normally distributed, but does the sample datasupport this assumption?
1 histogram wage , normal2 h i s t age , normal d i s c r e t e
2Chicago Tribune ”Biden, Emanuel, Quinn Call for Minimum Wage Hike” 25 August 2014 by Bill Ruthhart3A federal minimum wage was first set in 1938 in the United States. Many cities and states have departed from the federal
minimum wage. Currently, San Francisco has the highest minimum wage at $10.55. The highest state is Washington’s minimumwage at $9.32, and Oregon’s is second at $9.10.
6

Assuming wage is Normally distributed seems quite reasonable as its characteristics line up well withthe overlaid Normal distribution.
(c) [10 points] What is the average wage for men? How about for women? Comment on anythingunexpected.
1 su wage i f male==12 su wage i f male==0
The average wage for men is $11.90 per hour and the average wage for women is $11.94 per hour.This is slightly unusual in that, on average, men typically earn more than woman. However, thedifference is relatively small and may be a result of the particular sample chosen.
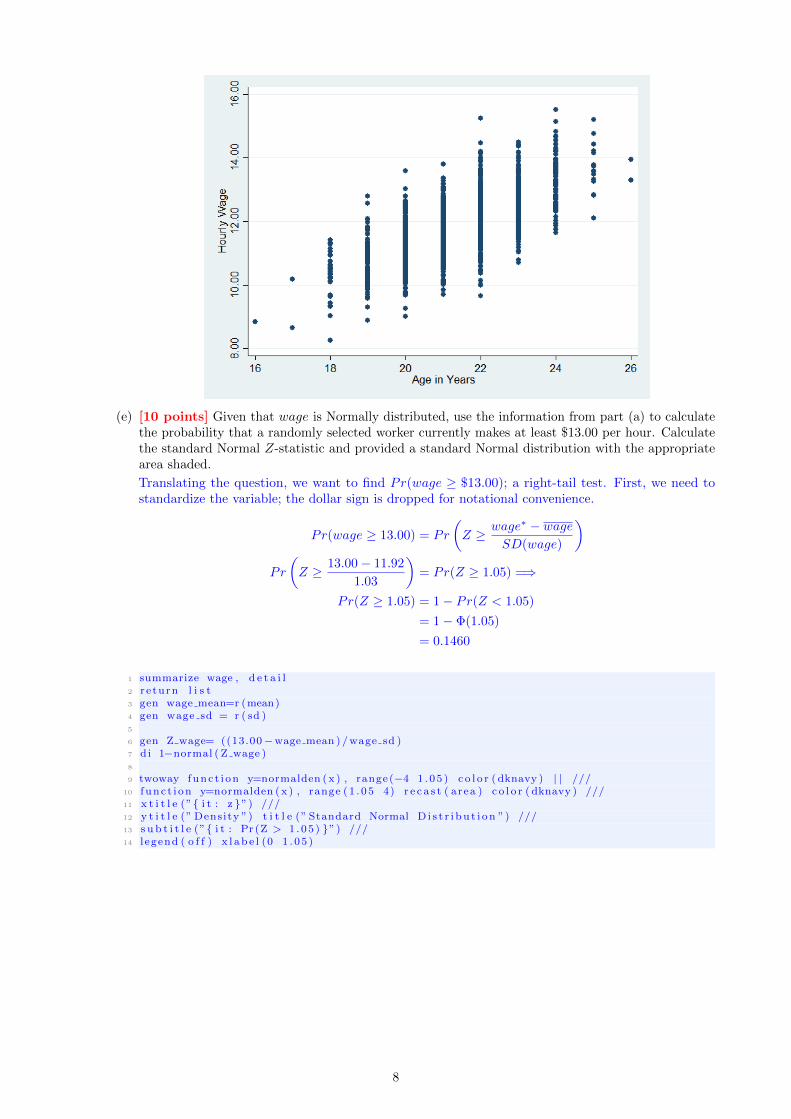
(d) [10 points] Create a two-way graph to examine the relationship between wage and age. Ensure thatage is on the horizontal axis. What type of pattern do you expect to see?
A positive relationship is expected since, on average, older workers have more experience therebyearning a higher wage.
1 s c a t t e r wage age
7
(e) [10 points] Given that wage is Normally distributed, use the information from part (a) to calculatethe probability that a randomly selected worker currently makes at least $13.00 per hour. Calculatethe standard Normal Z-statistic and provided a standard Normal distribution with the appropriatearea shaded.
Translating the question, we want to find Pr(wage ≥ $13.00); a right-tail test. First, we need tostandardize the variable; the dollar sign is dropped for notational convenience.
Pr(wage ≥ 13.00) = Pr
(Z ≥ wage∗ − wage
SD(wage)
)Pr
(Z ≥ 13.00− 11.92
1.03
)= Pr(Z ≥ 1.05) =⇒
Pr(Z ≥ 1.05) = 1− Pr(Z < 1.05)
= 1− Φ(1.05)
= 0.1460
1 summarize wage , d e t a i l2 r e turn l i s t3 gen wage mean=r (mean)4 gen wage sd = r ( sd )5
6 gen Z wage= ((13.00−wage mean ) / wage sd )7 di 1−normal ( Z wage )8
9 twoway func t i on y=normalden ( x ) , range(−4 1 . 05 ) c o l o r ( dknavy ) | | ///10 f unc t i on y=normalden ( x ) , range ( 1 . 05 4) r e c a s t ( area ) c o l o r ( dknavy ) ///11 x t i t l e (”{ i t : z }”) ///12 y t i t l e (” Density ”) t i t l e (” Standard Normal D i s t r i b u t i o n ”) ///13 s u b t i t l e (”{ i t : Pr (Z > 1 . 0 5 ) }”) ///14 l egend ( o f f ) x l a b e l (0 1 . 05 )
8

(f) [10 points] What is the probability that a randomly selected worker works exactly 37 hours perweek? Hint: you have enough information to answer this question.
0. The probability of any exact number occurring when the random variable is continuous is zero.Time is a continuous variable; i.e., it can take on any value greater than or equal to zero for hoursworked. For example, the randomly selected worker could work 37 hours and one minute fifteenseconds or . . . Remember probability can also be thought of as a area measure. Here the value wouldhave zero width; i.e., regardless of height, the area will be zero.
9
10