econ. 338c: overview of grain marketing dr. robert wisner, university professor iowa state...
TRANSCRIPT

Econ. 338C: Overview of Econ. 338C: Overview of Grain MarketingGrain Marketing
Econ. 338C: Overview of Econ. 338C: Overview of Grain MarketingGrain Marketing
Dr. Robert Wisner, Dr. Robert Wisner, University ProfessorUniversity ProfessorIowa State UniversityIowa State University
Dr. Robert Wisner, Dr. Robert Wisner, University ProfessorUniversity ProfessorIowa State UniversityIowa State University
Spring 2007
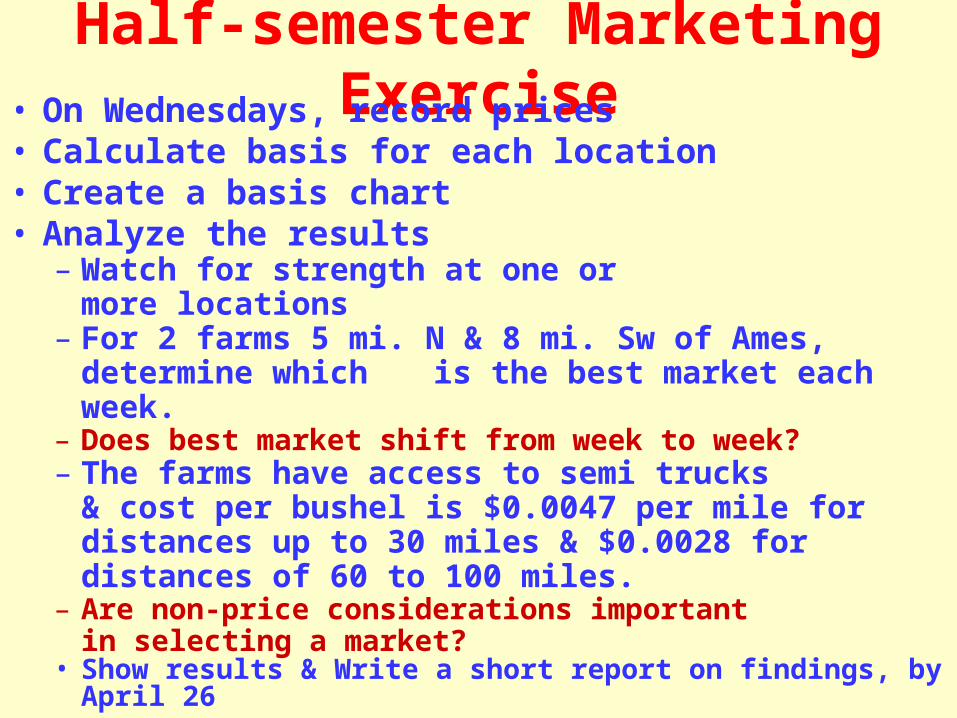
Half-semester Marketing Exercise• On Wednesdays, record prices • Calculate basis for each location• Create a basis chart• Analyze the results
– Watch for strength at one or more locations
– For 2 farms 5 mi. N & 8 mi. Sw of Ames, determine which is the best market each week.
– Does best market shift from week to week? – The farms have access to semi trucks
& cost per bushel is $0.0047 per mile for distances up to 30 miles & $0.0028 for distances of 60 to 100 miles.
– Are non-price considerations important in selecting a market?
• Show results & Write a short report on findings, by April 26


The Market’s Job: Transfering Raw Products to Consumer Products
Major Marketing Functions
• Providing time utility
• Providing form utility
• Providing space utility
• Financing
• Price/value discovery

Market Participants• Grain Producers
• Elevators
• Railroads, trucking & barge companies
• Banks & insurance cos.• Futures market traders & brokers
• Processors
• Feed Mills
• Ocean shipping firms

Key work areas for Grain Merchandisers
* Arbitrage = Maximizing return
over time & space
*Maximizing returns for available storage
*Utilizing transportation equipment efficiently * Choices heavily influenced by futures

Futures prices 3/7/07Implications?
CornMarch $4.132 May 4.24July 4.32Sept. 4.18Dec. 4.08May ‘08 4.18 July 4.23Dec. ’09 3.70
SoybeansMarch $7.34 May 7.48July 7.64Sept. 7.75Nov. 7.87May ‘08 7.97 July 8.03Nov. ’09 7.48

Futures prices 7/14/06
CornJuly $2.54 Sept. 2.61Dec. 2.77March’07 2.88May 2.97July 3.03
SoybeansJuly $6.02 Aug. 6.03Sept. 6.11Nov. 6.25Jan. ’07 6.37March ‘07 6.46
What were the markets telling farmers? Other needed information?
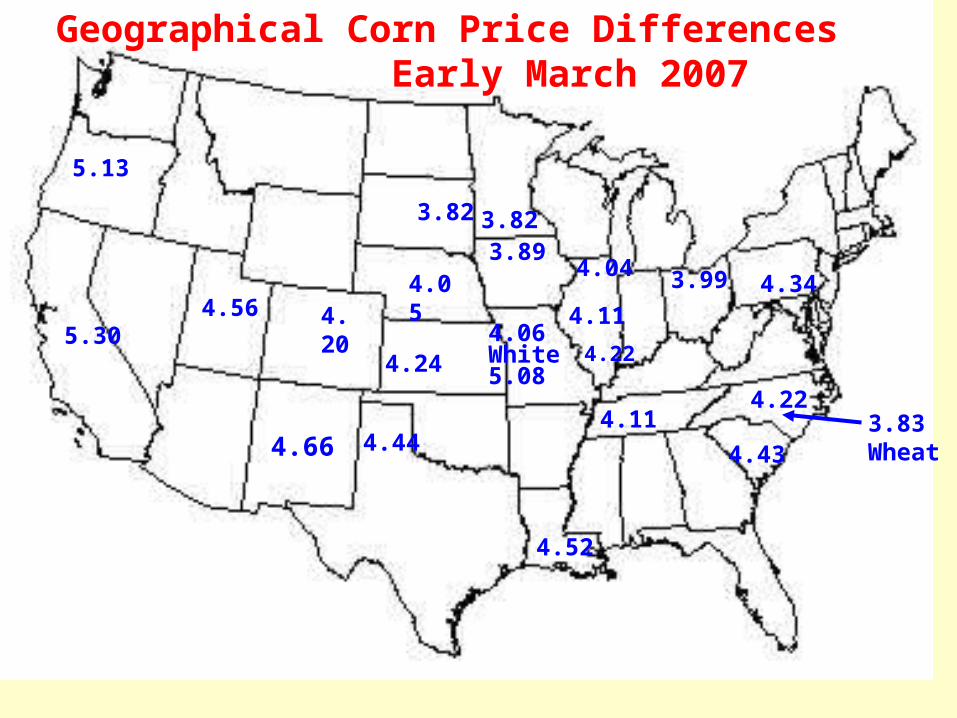
Geographical Corn Price Differences Early March 2007
4.06White 5.08
4.04 3.99
4.44
4.223.83 Wheat
3.82 3.82
4.56 4.204.05
5.30
5.13
4.343.89
4.11
4.52
4.24
4.11
4.22
4.66 4.43

0
20
40
60
80
100
120
140
160
Bu
./A
.
0
1
2
3
4
5
6
7
8
Bil
lio
n p
eo
ple
1950 1960 1970 1980 1990 2000
World Population & U.S. Corn Yield1950-1999
Population
Corn Yield


Overview of Grain Marketing , cont. • All Activities from production to final
user = Marketing• First receivers of grain-- elevators,
processors, feedlots– Pricing the grain to farmers– Offering contracts– Merchandising: finding greatest value for the
grain – Economics of transportation– Utilizing space efficiently– Segregating: specialty crops, non-GMO
Econ. 338 C: Spring 2003

Countries requiring GMO labeling
U.K.BelgiumFranceNetherlandsGermanyLuxembourgSwitzerlandDenmarkIrelandParaguaySloveniaSri LankaLatvia, Estonia, Slovakia Lithuania
Greece Portugal Spain Sweden Finland Austria Poland Australia New Zealand China Thailand Taiwan Malaysia
Italy S. Korea Japan Czech Rep. Hungary Saudi Arabia Japan Mexico Russia Ethiopia South Africa
Hungary PhilippinesBrazil

Econ. 338C: Overview of GrainU.S. & Global Marketing
From BNSF

Overview of Grain Marketing, cont. • First receivers of grain-- Continued
– Grading grain: Official & unofficial grades
– Grading standards: BCFM, Test Wt., Damage, soybeans include splits, foreign material
– Risk-management: hedging, using options
– Quality control and management ***
• Processors--soybeans– Managing & protecting processing margins:
– hedging the crush, reverse crush positions
– Merchandising products
– Sourcing the soybeans

Calculating Soybean Crush Margins 2/26/2004 2/27/03
Soybean oil price$/lb. 0.353 0.2132Oil yield, lbs./Bu. 11.06 11.2Oil value,$/Bu. 3.904 2.388
Soybean meal price, $/ton 275.00 184.00Meal yield, lbs./Bu. 45.86 43.78Meal value,$/Bu. 6.306 4.028
Total value from products 10.210 6.416Bean price, C. Illinois 9.42 5.88Gross Crush Margin 0.790 0.536

Calculating Soybean Crush Margins 3/01/20073/02/06
Soybean oil price$/lb. 0.2889 0.2450Oil yield, lbs./Bu. 11.26 11.59Oil value,$/Bu. 3.25 2.84
Soybean meal price, $/ton209.60 176.10Meal yield, lbs./Bu. 44.09 44.08Meal value,$/Bu. 4.62 3.88
Total value from products7.87 6. 72Bean price, C. Illinois 7.30 5.83Gross Crush Margin 0.58 0.90

Figure 1. Soybean Crush margins implied by futures 2004/05
0.00
0.20
0.40
0.60
0.80
1.00
1.20
Cashmargin
March May July Aug Sept Nov Jan
$ p
er
bu
sh
el
Feb 3, 04" Feb 25, 04"5-Mar-04

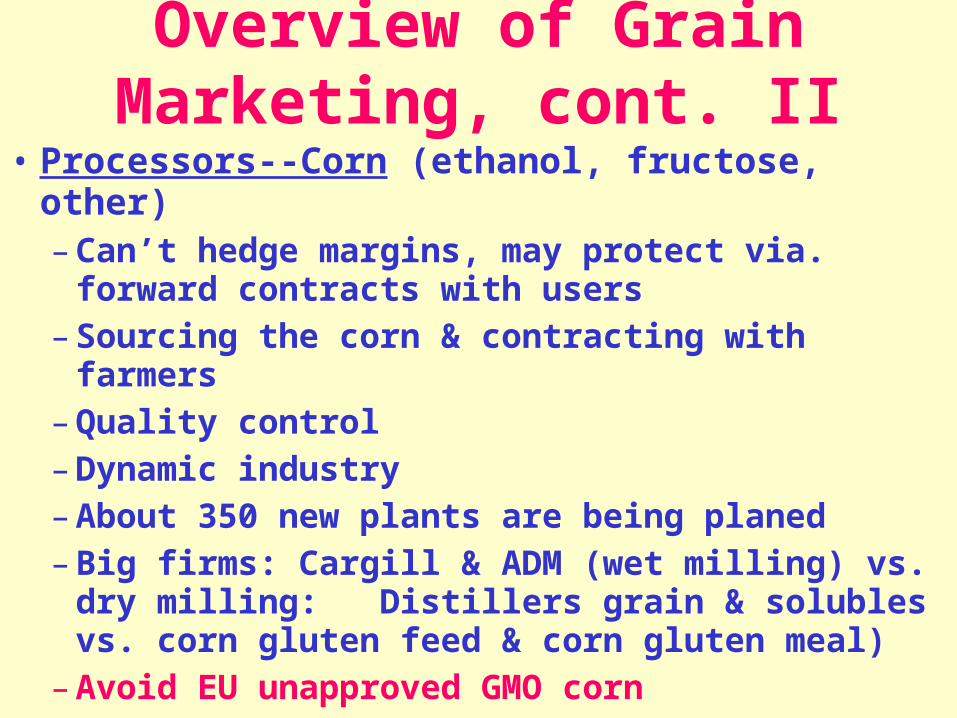
Overview of Grain Marketing, cont. II
• Processors--Corn (ethanol, fructose, other)– Can’t hedge margins, may protect via.
forward contracts with users– Sourcing the corn & contracting with farmers– Quality control– Dynamic industry– About 350 new plants are being planed– Big firms: Cargill & ADM (wet milling) vs. dry
milling: Distillers grain & solubles vs. corn gluten feed & corn gluten meal)
– Avoid EU unapproved GMO corn


Iowa Corn Processing Plants
Annual Capacity
Operating Plants 970 mil. bu.
Expanding Plants 282
New, Under Construction 198
Planned 1,364
Potential total rated capacity 2,814 mil. bu.
Equals 137% of 2006 Iowa Corn Crop
1/29/07


Iowa corn processing & ethanol plants, current & planned, 10/26/06
63
Sac
Linn
Lee
Ida
Tama
Clay Kosuth
Jasper
Lyon
Page
StoryrJones
Fayette
Adair
Bentonn
Wapello
Pocahontas
Osceola
Jefferson
Audubon
Washington
BuenaVista
BlackHawk
Appanoose
CerroGordo
VanBuren
Mucatine
Dickenson
DesMoines
Winnebago
Montgomery
Iowa Corn Processing & Ethanol Plant Locations, Actual & Planned. 9/26/06,
PoweshiekPolk
BooneGreeneCarrollCrawford
Plymouth
O’Brien
Woodbury
Monona
Harrison Shelby
Wright Franklin
Floyd Chickasaw
Webster Hardin
Louisa
Emmet
Palo Alto
Hancock
Worth Mitchell HowardWinneshiek Allamakee
BremerButler
HamiltonGrundy
Buchanan
Delaware
Dubuque
Jackson
Clintonn
Guthrie Dallas
Johnson
Marshall
Pottawattamie
Mills
Fremont
Madison
Warren Marion Mahaska
Keokuk
Adams Union Clarke Lucas Monroe
Taylor Ringgold
Cherokee
Calhoun
Decatur Wayne Davis
Henry
Scott
Humboldt
Clayton
Cedar
Sioux
Cass
Iowa*
**
*
*
*
*
* **
*
**
*
**
*
*
*
**
*
*
*
*
*
*
*
*
**
**
*
**
*
*
**
*
* * **
Sac
Linn
Lee
Ida
Tama
Clay Kosuth
Jasper
Lyon
Page
StoryrJones
Fayette
Adair
Bentonn
Wapello
Pocahontas
Osceola
Jefferson
Audubon
Washington
BuenaVista
BlackHawk
Appanoose
CerroGordo
VanBuren
Mucatine
Dickenson
DesMoines
Winnebago
Montgomery
,
PoweshiekPolk
BooneGreeneCarrollCrawford
Plymouth
O’Brien
Woodbury
Monona
Harrison Shelby
Wright Franklin
Floyd Chickasaw
Webster Hardin
Louisa
Emmet
Palo Alto
Hancock
Worth Mitchell HowardWinneshiek Allamakee
BremerButler
HamiltonGrundy
Buchanan
Delaware
Dubuque
Jackson
Clintonn
Guthrie Dallas
Johnson
Marshall
Pottawattamie
Mills
Fremont
Madison
Warren Marion Mahaska
Keokuk
Adams Union Clarke Lucas Monroe
Taylor Ringgold
Cherokee
Calhoun
Decatur Wayne Davis
Henry
Scott
Humboldt
Clayton
Cedar
Sioux
Cass
Iowa*
**
*
*
*
*
* **
*
**
*
**
*
*
*
**
*
*
*
*
*
*
*
*
**
**
*
**
*
*
**
*
* * **
*
Sac
Linn
Lee
Ida
Tama
Clay Kosuth
Jasper
Lyon
Page
StoryrJones
Fayette
Adair
Bentonn
Wapello
Pocahontas
Osceola
Jefferson
Audubon
Washington
BuenaVista
BlackHawk
Appanoose
CerroGordo
VanBuren
Mucatine
Dickenson
DesMoines
Winnebago
Montgomery
Iowa Corn Processing & Ethanol Plant Locations, Actual & Planned. 9/26/06,
PoweshiekPolk
BooneGreeneCarrollCrawford
Plymouth
O’Brien
Woodbury
Monona
Harrison Shelby
Wright Franklin
Floyd Chickasaw
Webster Hardin
Louisa
Emmet
Palo Alto
Hancock
Worth Mitchell HowardWinneshiek Allamakee
BremerButler
HamiltonGrundy
Buchanan
Delaware
Dubuque
Jackson
Clintonn
Guthrie Dallas
Johnson
Marshall
Pottawattamie
Mills
Fremont
Madison
Warren Marion Mahaska
Keokuk
Adams Union Clarke Lucas Monroe
Taylor Ringgold
Cherokee
Calhoun
Decatur Wayne Davis
Henry
Scott
Humboldt
Clayton
Cedar
Sioux
Cass
Iowa*
**
*
*
*
*
* **
*
**
*
**
*
*
*
**
*
*
*
*
*
*
*
*
**
**
*
**
*
*
**
*
* * **
Sac
Linn
Lee
Ida
Tama
Clay Kosuth
Jasper
Lyon
Page
StoryrJones
Fayette
Adair
Bentonn
Wapello
Pocahontas
Osceola
Jefferson
Audubon
Washington
BuenaVista
BlackHawk
Appanoose
CerroGordo
VanBuren
Mucatine
Dickenson
DesMoines
Winnebago
Montgomery
,
PoweshiekPolk
BooneGreeneCarrollCrawford
Plymouth
O’Brien
Woodbury
Monona
Harrison Shelby
Wright Franklin
Floyd Chickasaw
Webster Hardin
Louisa
Emmet
Palo Alto
Hancock
Worth Mitchell HowardWinneshiek Allamakee
BremerButler
HamiltonGrundy
Buchanan
Delaware
Dubuque
Jackson
Clintonn
Guthrie Dallas
Johnson
Marshall
Pottawattamie
Mills
Fremont
Madison
Warren Marion Mahaska
Keokuk
Adams Union Clarke Lucas Monroe
Taylor Ringgold
Cherokee
Calhoun
Decatur Wayne Davis
Henry
Scott
Humboldt
Clayton
Cedar
Sioux
Cass
Iowa*
**
*
*
*
*
* **
*
**
*
**
*
*
*
**
*
*
*
*
*
*
*
*
**
**
*
**
*
*
**
*
* * **
*
*
*
* **
*
*
*
*
66 Planned + current in Iowa
11 Just across the borders
*
*
**
Figure 1.
*
*
*
Iowa corn processing & ethanol plants, current & planned, 11/20/06
63
Capacity: 129% of 2006 cropCapacity: 137% of 2006 Crop
Iowa Corn Processing Plants, Current & Planned, 2/16/07
71 Potential Iowa Plants 11 Just across IA Borders
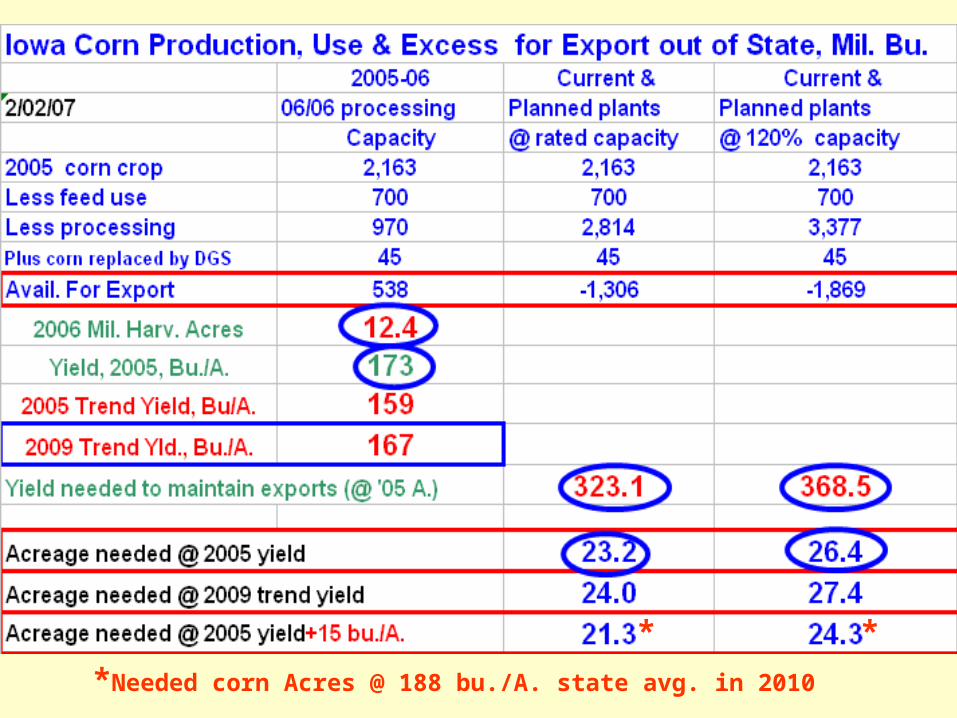
*Needed corn Acres @ 188 bu./A. state avg. in 2010
**

Needed Yld. @ current Acres

NCGA Yield Contest 1996-2006, Irrigated and Non-Irrigated Winners, Outliers Removed
0
50
100
150
200
250
300
350
400
1995 1997 1999 2001 2003 2005 2007
Yiel
d (b
u/ac
re)
Source: Dr. Roger Elmore, ISU Agronomy Dept.


Existing & Planned U.S. Corn Processing Plants
Blue = OperatingRed = constructionGreen = plannedPink = Expansion of Existing plants
Figure 2.
8/30/06

5.5 Bil. Bu for ethanol

Crop Reporting Distr.
Illinois Corn Yields Drought Tolerant?
2004 2005
• NW 184 140
• NE 174 129
• WEST 192 141
• E.SE. 175 139
• SW 158 133
• SE 158 130
% chg.
-24
-26
-27
-21
-16
-18


‘Example’ of Exchange Rate Impact
Iowa’s Soybean Costs
Source: Embrapa Agrop. Oeste / ISU-USDA - 42 -
2000 2001 2002 2003 2004 2005 2006US$/ ha - IA, U.SR$/ ha - IA, U.S.
R$/ ha - MT, BRExchange Rate(*)
209.12%
250.50%
100.00%
155.56%
144.80%
181.91%
172.43%
145.86%139.20%
100.00%
119.16%110.91%
109.14%
100.00%
0.00%
50.00%
100.00%
150.00%
200.00%
250.00%
300.00%
US$/ha - IA, U.S R$/ha - IA, U.S.
R$/ha - MT, BR Exchange Rate(*)
+70%

March Crude Oil Futures 2/16/07

Mar. N.Y. Gasoline Futures 2/16/07

Feb. Ethanol Futures 2/16/07
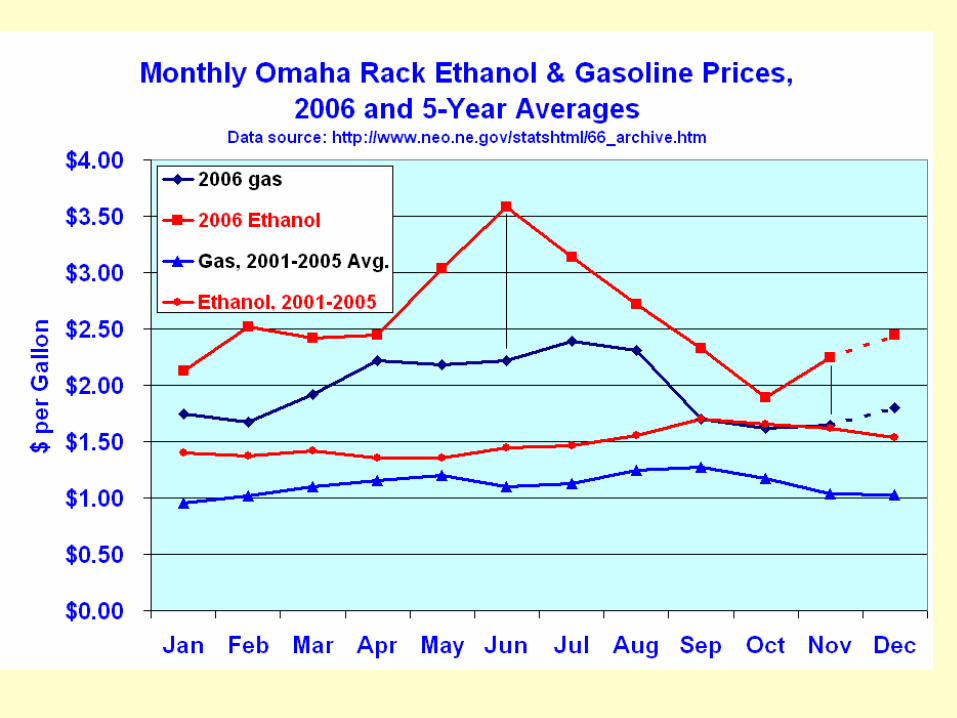

State Average Ethanol Rack Prices
http://www.axxispetro.com/ace.shtml
www.ethanol.org
Date: 2/02/07
Iowa: 1.95 Feb. 20: 2.16Illinois: 2.05
Kansas: 2.05
Michigan: 2.29
Minnesota: 1.89
Missouri: 2.24
North Dakota: 1.91
Nebraska: 2.01
South Dakota: 1.99
Wisconsin: 2.16
Averages provided by:

Ethanol Economics• $0.10 increase in ethanol price raises break-even Corn price $0.28/bu.• $1.00 rise in corn price increases cost/gal. $0.36• Ethanol prod’n cost $1.30/gal. (Minnesota- @$2 corn)
• Cost increases about $0.36/gal. for each $1 increase in corn
• 1/29/07 ethanol price: $1.91/gal.
• December 06 margins: $0.64/gal. (incl.$.51credit)
• 1/29/07: Drops to zero @ corn price of about $3.70 corn in IA ($4.10 with USDA costs) 2/20: $4.40-4.80
• Other variables: DDGS price, Natural Gas
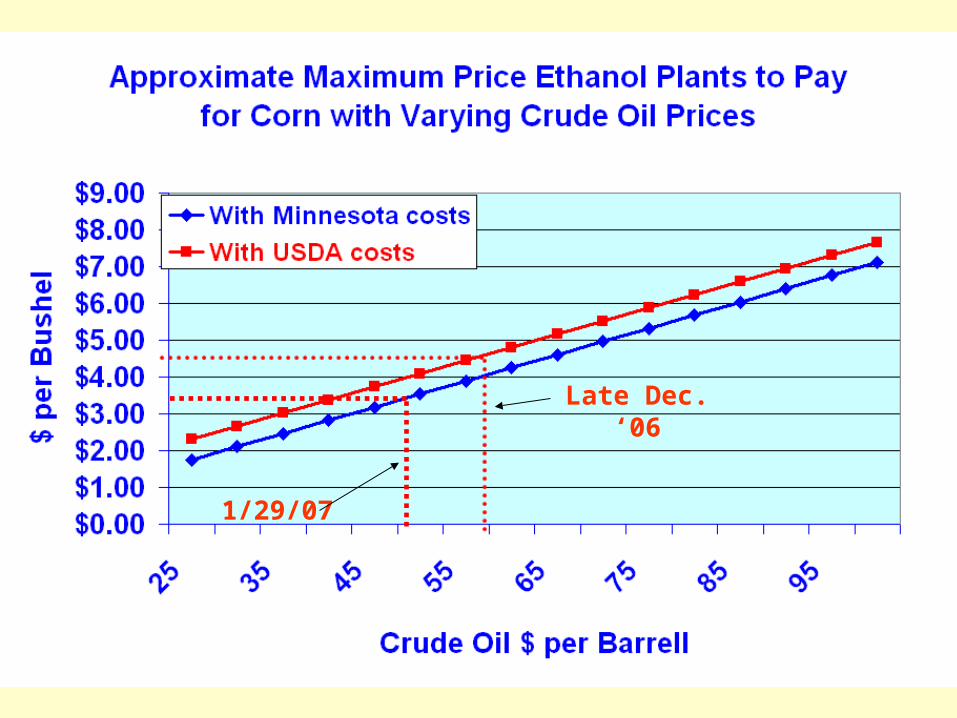
Late Dec. ‘06
1/29/07

Monthly Unleaded GasolineFutures Prices
Gulf Hurricanes

High Prices are best cure for high prices

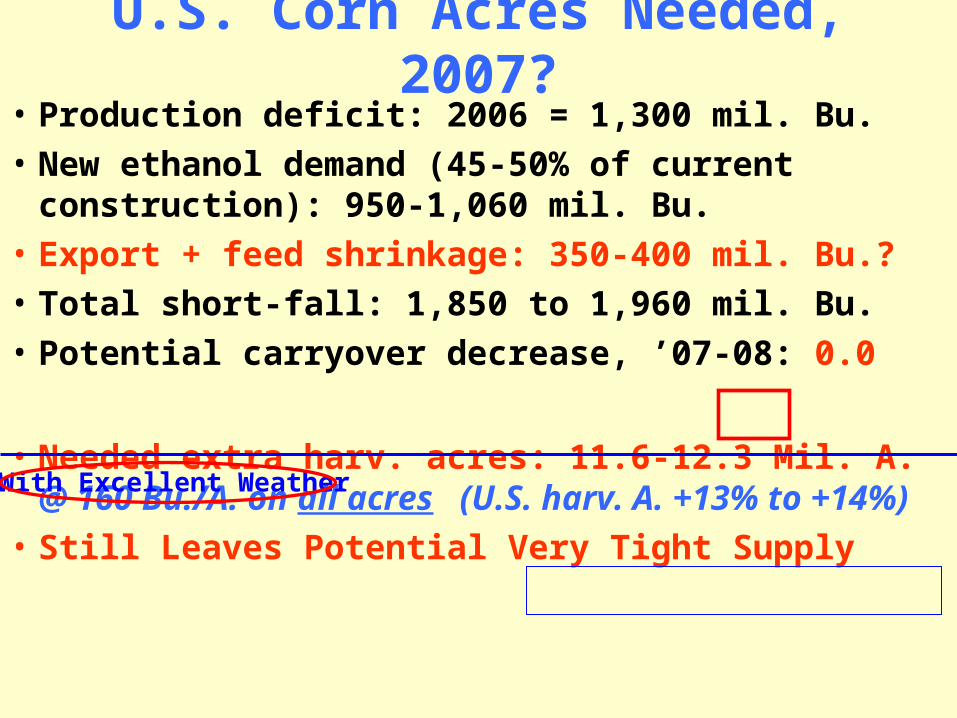
U.S. Corn Acres Needed, 2007?• Production deficit: 2006 = 1,300 mil. Bu.
• New ethanol demand (45-50% of current construction): 950-1,060 mil. Bu.
• Export + feed shrinkage: 350-400 mil. Bu.?
• Total short-fall: 1,850 to 1,960 mil. Bu.
• Potential carryover decrease, ’07-08: 0.0
• Needed extra harv. acres: 11.6-12.3 Mil. A. @ 160 Bu./A. on all acres (U.S. harv. A. +13% to +14%)
• Still Leaves Potential Very Tight Supply
With Excellent Weather

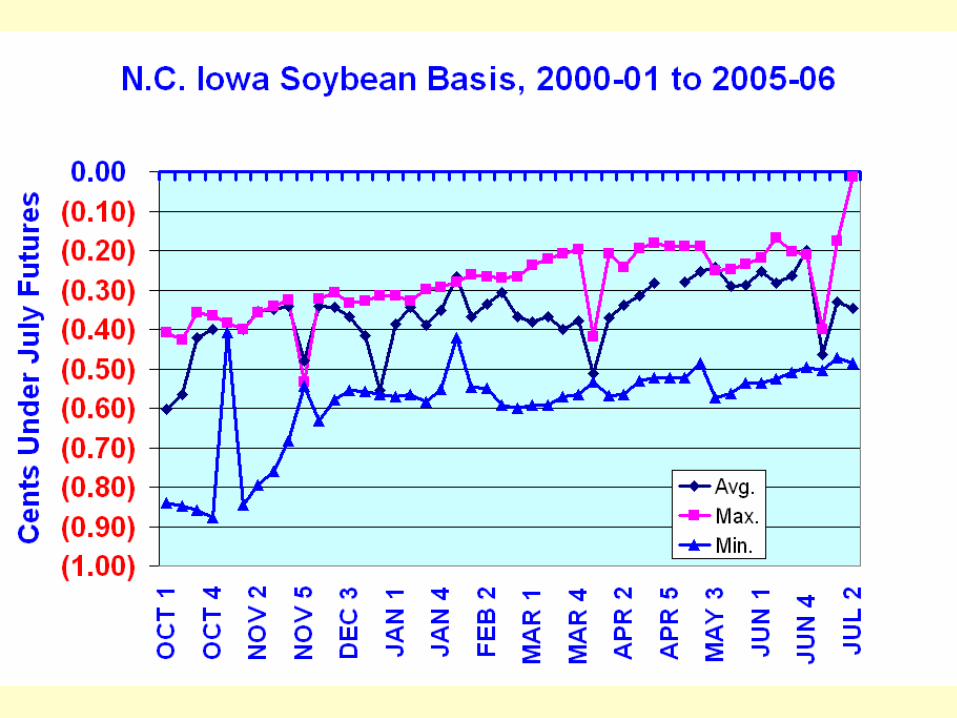
Basis for Corn, Iowa Counties
Corn Basis (cents/bu)
under near-by futures
Notes: Underlined data indicates that no data were available; averages for surrounding counties are reported.
-36.0 to -30.2
-30.2 to -28.7
-28.7 to -25.0
-25.0 to -21.6
-21.6 to -17.4 -17.4 to 0.0
Late January to late February, 2005

http://www.card.iastate.edu/ag_risk_tools/basis_maps/


Global forces to cause slowing of corn-based ethanol growth
from current 50-60% annual growth
• Corn price• Ethanol price• DDG price• Plant energy costs• Food & feed demand• Crude oil & gasoline prices• Govt. mandates & other policies

Corn Basis Under March FuturesNorthwest Iowa
Feb. 2007 -0.19Feb. 2005 -0.260Feb. 2004 -0.213Feb. 2003 -0.178 Feb. 2002 -0.276*Feb. 2001 -0.335Feb. 2000 -0.362Feb. 1999 -0.320 Avg. 1999-02 -0.323
North Central Iowa Feb. 2007 -0.20 Feb. 2005 -0.280 Feb. 2004 -0.253
Feb. 2002 -.0218Feb. 2001 -0.276Feb. 2000 -0.310Feb. 1999 -0.342Feb. 1999 -0.280Avg. 1999-02 -0.302

Mil. Bu. Change in 2002 Corn Production vs. 2001 11/12/02
+240
+255
-76 -90 -160-238-212
-101
-38
+30
-49
+45+34
+32
+6+17
+16
+17+1
-3
-24
-29
-16
-17
-16
-49-16
U.S. -504814 below 2001-02 utilization
-43
Basis Implications!
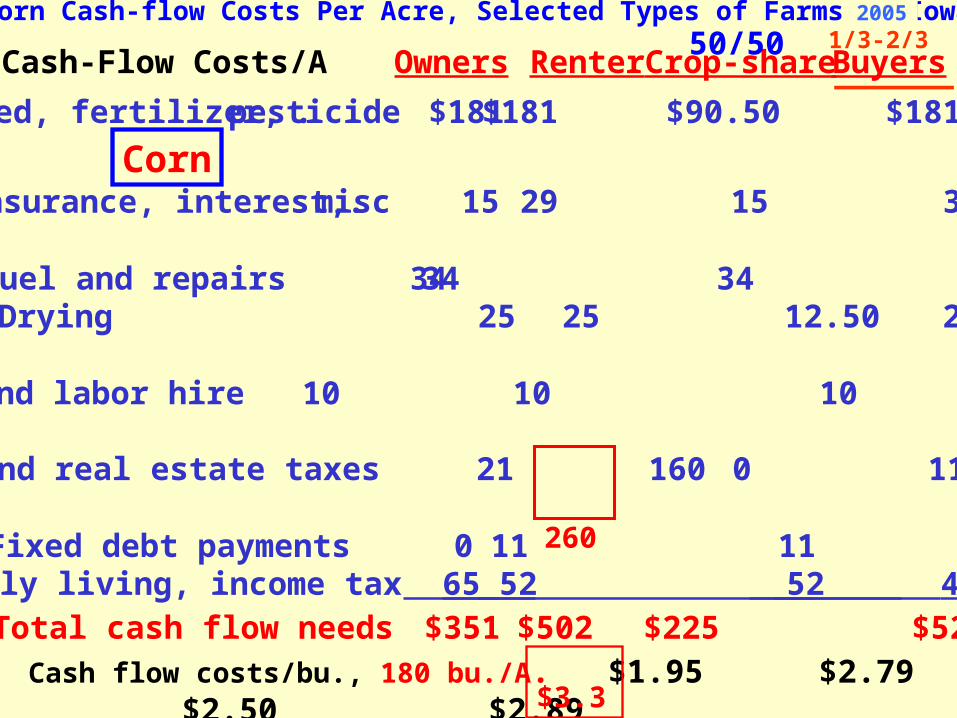
Cash-Flow Costs/A Owners Renter Crop-share Buyers
Seed, fertilizer, pesticide. $181 $181 $90.50 $181
Insurance, interest, misc. 15 29 15 36
Fuel and repairs 34 34 34 34Drying 25 25 12.50 25
Custom hire and labor hire 10 10 10 10
Rent and real estate taxes 21 160 0 115
Fixed debt payments 0 11 11 74Family living, income tax 65 52 52 45
Cash flow costs/bu., 180 bu./A. $1.95 $2.79 $2.50 $2.89Total cash flow needs
$351
$502
$225 $520
Table 1. Corn Cash-flow Costs Per Acre, Selected Types of Farms in Iowa, 20041/3-2/350/50
Corn
2005
260
$3.34

Implications of Emerging Energy Market• A lot more corn acres will be needed• Corn prices: increasingly volatile & weather-
sensitive• Basis opportunities will be greater• More storage, handling capacity needed • Winter & spring 2006-07: look for periods of
higher corn, SB prices, strong basis• Cautions about selling 2008 and later crops• Corn, biodiesel to pull bean prices up• Options may be useful in managing risks• Rent & Land Value Implications

Should you shift bean acres to corn?
• Market says yes
• How much yield drag?
• Impacts of shorter planting & harvest seasons?
• Ability to move, handle, & store more corn?
• Soil types?
• Availability of top corn seed varieties?

Go Slow in Pricing 2008 & Beyond,Especially in corn
• Prices are low relative to 2007 & new ethanol plant capacity
• Potentially explosive market with weather problems
• Uncertainty on some pricing tools in extreme mkt. volatility

Corn Prices, 2007 & Beyond2/22/07
• Dec. ’07 $4.27• Mar. ’08 4.34• Jul. ’08 4.37• Dec. ’08 3.98• Jul. ’09 4.03 • Dec. ’09 3.84• Jul. ‘10 3.88• Dec. ’10 3.72
Spreads: Narrow
Prices: low relative to likely ethanol demand & acreage needs

Concerns: 2008 & Beyond
• Potential explosive weather market• Some “New Generation” contracts
haven’t been tested in that type of market -- especially those with options sales
• With explosive market, does fine print expose farmer to margin calls?
• Could some companies exceed margin borrowing ability?

What Could Change These Prospects?
• Accelerated corn yield increases• Crude oil price collapse• Break-through in economical biomass
conversion• Ethanol import tax removed – longer term
impacts• $0.51 blending credit reduced• Declining livestock feeding

Useable Bin Size

Cleaning Conveyer Systems

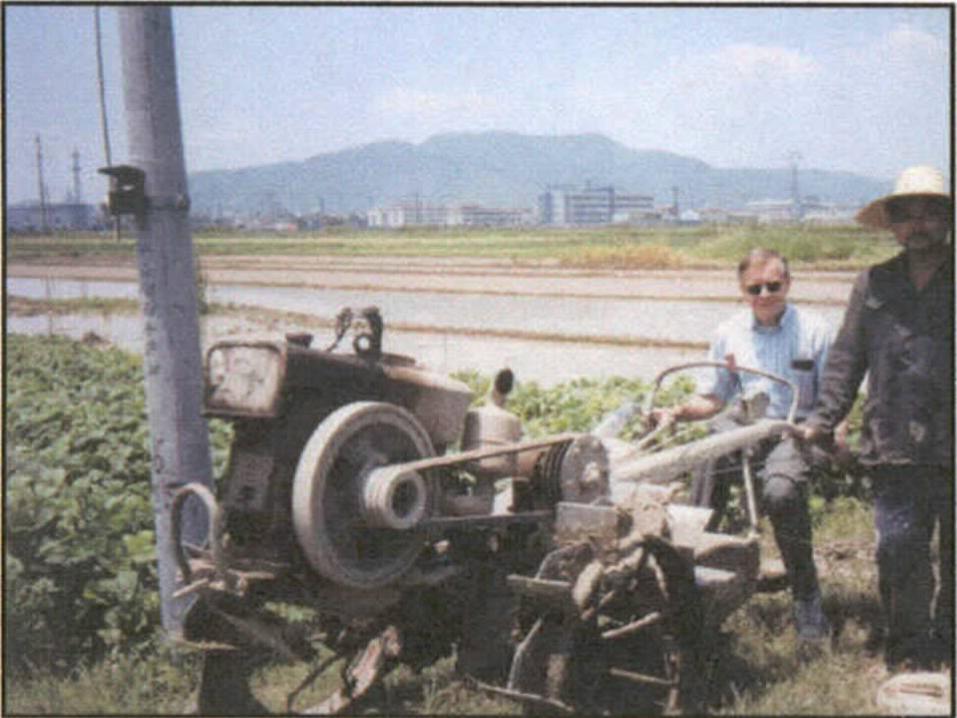
Overview of Grain Marketing• Importing port: Wilmington, N.C.• The world markets
– Major grain importing countries
– Import systems & infrastructure
– Major grain exporting countries
– Ocean freight (N.Y. Journal of Commerce)
– GMO trends & preferences
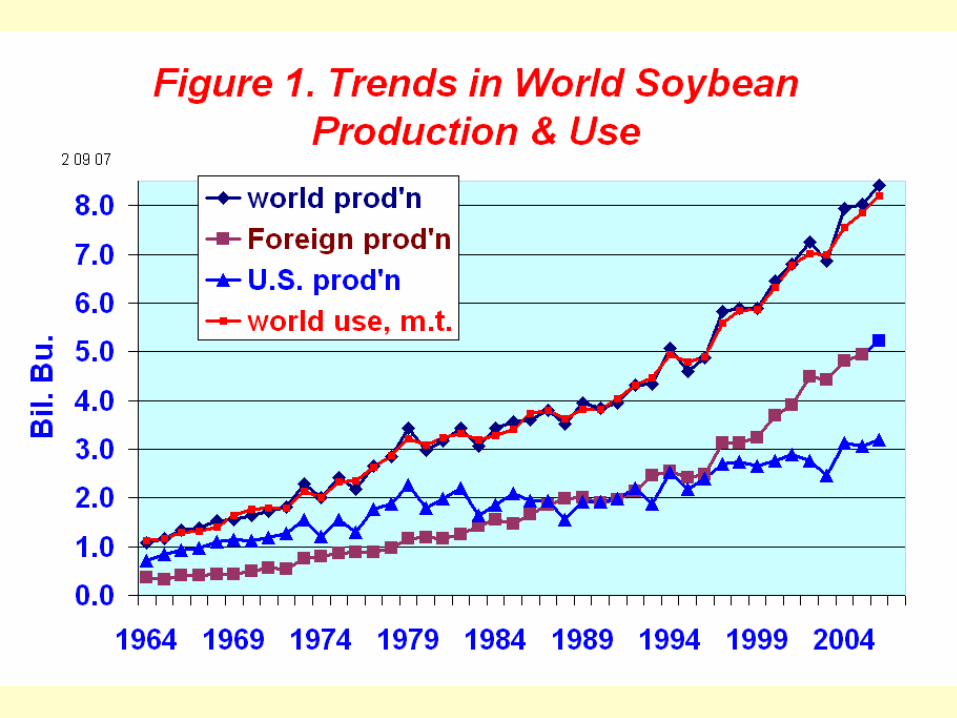
– Trends in foreign production & use
– Trade agreements: NAFTA, WTO, possible Latin American agreement
– Foreign inspection & grading

Have currencies recovered% Chg. Feb. 2003 vs. Jan. 1996
S S. Korea -51
S Hong Kong -0.9
S Japan -13.6
S Malaysia -49
S Indonesia -285
S India -33
S Argentina -218
S China +0.1
S Russia -576
S Philippines -106
S Taiwan -27
S Thailand -70
S Brazil -255
S Mexico -46
EU Euro -17


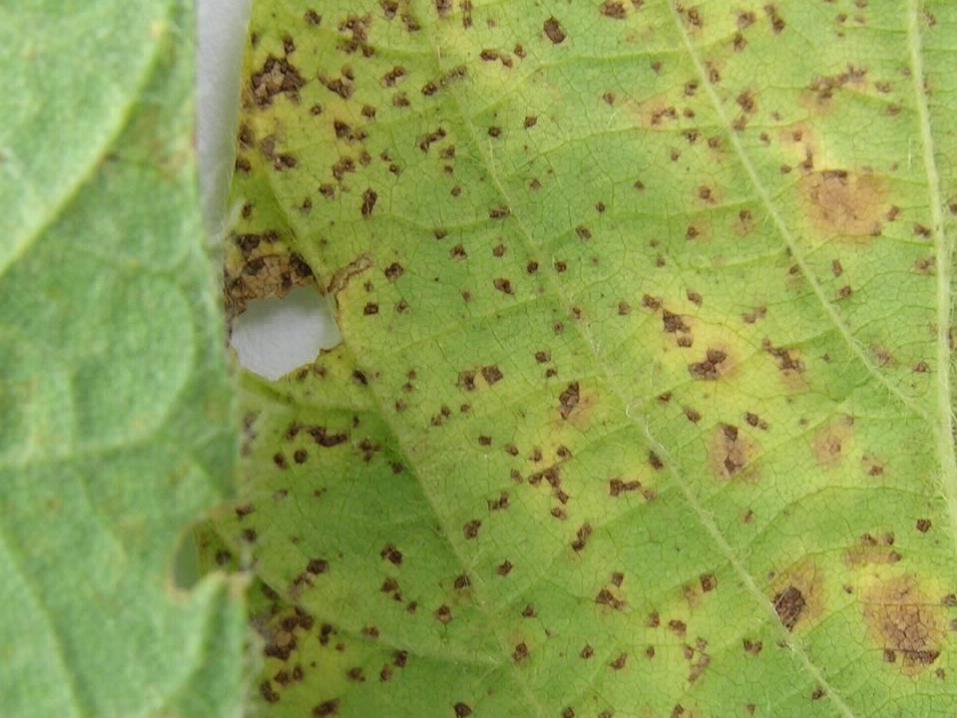


Only 2.7 mil. soy A. in highest-risk S.E. U.S.
Estimated Asian Rust Risk
% of years out of 30 that climatic conditions are expected to support Asian soy rust


Overview of Grain Marketing• World futures markets (Price Discovery)
– Chicago:corn, soft red wheat, soybeans, oats, rice
– Kansas City: hard red winter wheat
– Minneapolis: hard spring and hard white wheat, Corn & Soybean cash index markets
– Tokyo: GMO & non-GMO soybeans, corn
– Various other futures markets: Argentina, Brazil, China, Europe
– Foreign exchange futures

For March 23 Class
• Read Chapters 1 and 3 in Managing Risks and Profits, also look at Chap. 6.
• Dr. Steve Johnson, ISU Extension Management Specialist from Des Moines will teach the next two class sessions
• Focus will be on a student-participation workshop called “Winning the Game” in which you develop a grain marketing plan