econ 520 money and banking prof. j. h. mcculloch
TRANSCRIPT

Econ 520
Money and Banking
Prof. J. H. McCulloch
S12

Lecture 1
The 2008 Crisis in the American Economy
M&B Chapter 1

Origin of Crisis For years prior to 2007 –
Many mortgages “subprime”
little if any equity
excessive payments relative to income
often no documentation of value or income
NINJA mortgages:
No Income, No Job, No Assets
Encouraged by Fannie Mae and Freddie Mac
Govt sponsored mortgage intermediaries
Led to self-sustaining bubble in house prices

2007-2008
Borrowers realized they were overextended,
cut back on spending, borrowing
Housing bubble stalled, then started to pop
Delinquencies and foreclosures spread
Washington Mutual Savings & Loan failed
Countrywide Financial failed
Fannie and Freddie rescued by Fed in 2008
Investment banks Bear Stearns, Lehman Bros failed
Bank Holding Companies in trouble
GDP fell, Unemployment rose.
How serious compared to past recessions?
Pundits often say “worst since Great Depression of 1930s.”
Is this true? Or just alarmism?

Real GDP
Decline in real GDP in selected downturns
1929-1933 -26.7%
1937-1938 -3.3%
1944-1947 -9.4%
1957Q3-1958Q1 -3.7% *
1973Q2-1975Q1 -3.2% **
1980Q1-1980Q3 -2.2%
1981Q3-1982Q3 -2.9%
2007Q4-2009Q2 -4.1%
Current recession slightly worse than 1957-58
but 1944-47 twice as bad,
1929-33 six times worse.
3/11 revision shown. * -3.1%, 9/10 version. ** -3.8%, 9/10 version

Unemployment
Selected peaks in US Unemployment Rate
1932 22.9%
1938 12.5%
1949 5.9%
7/1958 7.5%
5/1975 9.0%
7/1980 7.8%
11-12/1982 10.8%
6/1992 7.8%
6/2003 6.3%
10/2009 10.1%
Current recession severe:
10.1% max 10/09, still 8.3% (2/12)
but 1982 worse @ 10.8%,
1932 twice as bad @ 22.9%.

Unemployment aggravated by
2007 increases in Federal, state minimum wages
40.7% Federal increase 2007-09
2008 extension of Unemployment Benefits
from permanent 26 weeks (since 1970)
to 99 weeks “extended benefits” through 5/12,
@ 73 weeks through 12/12.
Both increase unemployment for lowest skilled workers.
16-19 year olds 27.1% (peak 10/10)
< HS diploma over 25 yrs 15.7% (peak 11/10)
Larry Summers (1992 book) warned that monetary policy
should not be used to offset U caused by U benefits.

Bank Failures
Current rate of failures serious:
140 in 2009, 157 in 2010, 92 in 2011
but 1987-90 worse, over 100 failed per year 1985-92.
So far, 85-92 banking crisis much worse than current by this measure
1930-33, thousands of banks failed each year.
Current crisis doesn’t compare.

FDIC insurance fund
2008 below statutory target level of 1.25% of insured deposits
2009 in hole at -.39%, but recovered to +.13% by 2011
1998-90 similar, reached -.25%
back on target by 1995, due to
improved economy,
higher premiums,
tighter capital standards from 1991 legislation

Monetary Base Explosion Base more than doubled by end of 2008, now has tripled
Beginning in 2008, Fed advanced $1.8 trillion to bail out
Fannie Mae, Freddie Mac
AIG
Bear Stearns
Mortgage Backed securities
etc.

Ordinarily, this would double Money supply, Price Level
through Quantity Theory of Money
from Mishkin, Money and Banking
High money growth
usually accompanied by
comparably high inflation:

US not immune from inflation
Double digits 1973-75, 1978-81.

But since 2008 –
Fed paying banks interest on over $1.6 T idle excess reserves
Pumps profits into banks with no risk to them
Current Inflation
Only 2.9% per year (2/11 to 2/12)
Can Fed unwind base explosion without inflation?

Is deflation a valid concern?
Selected US Deflations
Period Deflation
6/1920-8/1922 20.6%
11/1929-3/1933 26.2%
10/1937-4/1939 5.5%
8/1948-1/1950 3.8%
7/2008-12/2008 3.5%
1929-33 deflation of 26.2% led to massive bankruptcies, foreclosures
Caused by post-WWI complications of Gold Standard.
2008 deflation of 3.5% caused by transitory gas price decline
from over $4/gallon in summer to under $2 by November.
Smaller than 1948-50, quickly reversed.
No reason for 1929-33 deflation to recur under fiat money standard.

National Debt
Has increased $5 Trillion since 2008
average taxpayer $55,000 deeper in debt than 2008,
owes $127,000 total.
(90 million taxpaying returns)
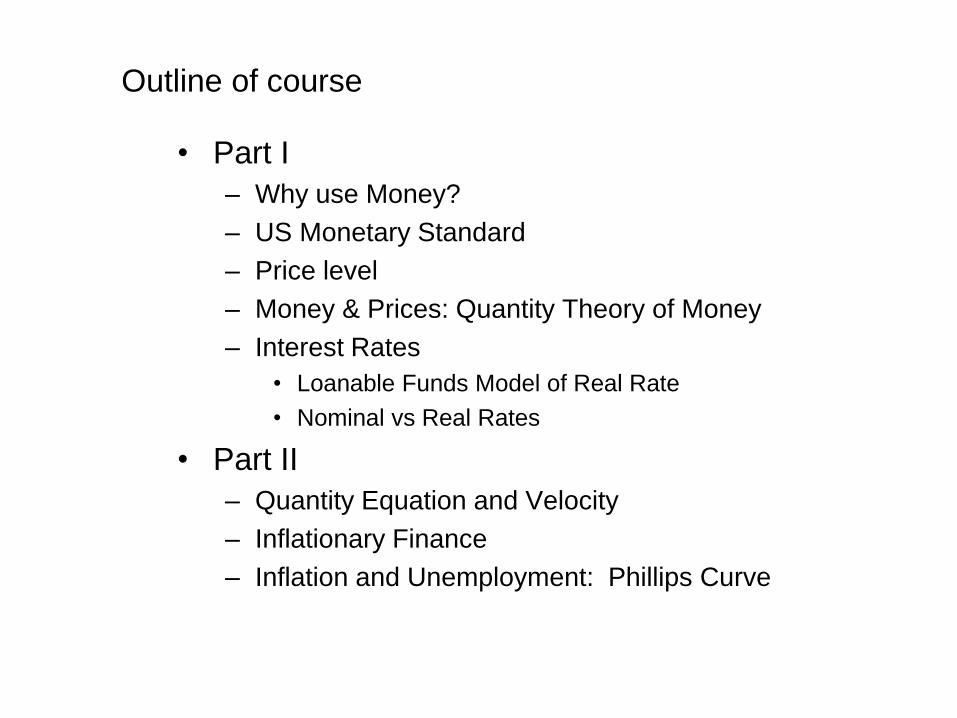
• Part I
– Why use Money?
– US Monetary Standard
– Price level
– Money & Prices: Quantity Theory of Money
– Interest Rates
• Loanable Funds Model of Real Rate
• Nominal vs Real Rates
• Part II
– Quantity Equation and Velocity
– Inflationary Finance
– Inflation and Unemployment: Phillips Curve
Outline of course

• Part III
– The Monetary Aggregates
– Commercial Banks & deposit creation
– Federal Reserve System
– Monetary Base Equation
– Money and Credit: the Taylor Rule
– War & Peace: US inflationary episodes
• Part IV
– Financial Intermediation
• mortgages, thrifts, Fan & Fred
– Bank and Thrift regulation
– More on 2008 crisis

• Part V
– Foreign Exchange Rates
– International Monetary System
• Recurring theme
– What made the Great Depression so Great?
– Are we in for another one?
– How does it relate to current crisis?

Thursday:
– Why Use Money?
• M&I Ch. 1
– The US Monetary Standard
• M&B Ch. 3
HW1
– Weekly HW due Friday 5:00 PM
in Kevin (Feng) Guo’s box outside
Arps 410