econ one research, inc. i - arlis.org · contents econ one research, inc. i . ... research, inc....
TRANSCRIPT
Econ One Research, Inc. i
Econ One Research, Inc.
Los Angeles Office
5th Floor 601 W. Fifth Street
Los Angeles, CA 90071
tel 213.624.9600 fax 213.624.6994
Sacramento Office
Suite 1170 1215 K Street
Sacramento, CA 95814
tel 916.449.2860 fax 916.449.2870
Houston Office
Suite 200 1004 Prairie
Houston, TX 77002
tel 713.228.2700 fax 713.228.3296
www.econone.com
Contents
Econ One Research, Inc. i
January 2002
Contents List of Figures ............................................................................................................................................. iii Purpose and Plan of this Report ......................................................................................................... iv-vi Chapter 1 – Gas Markets in North America ............................................................ I
• Historical Overview of Gas Deregulation and Market Development
• Gas Commodity Markets
• Gas Trading, Transportation and Logistics
• North American Gas Markets Over the Next Several Decades
Chapter 2 – NGL Markets in North America ........................................................ 13
• Processing Agreements
• Downstream Finished Product Prices Determine Upstream Raw-Mix Values
• North American NGL Markets Over the Next Several Decades
Chapter 3 – Valuation of ANS Gas and NGL ........................................................ 19
• North America Demand Growth
• What North American Markets Will ANS Gas and NGL Serve?
• The Potential Role of Alberta in Valuation of ANS Gas and NGL
• Can ANS Gas and NGL By-Pass Alberta?
• Netback Calculations for ANS Gas and NGL Chapter 4 – Economic Aspects of Royalty.............................................................. 29
• Principal/Agent Problems
• Contract Adaptability Problems
• Types of Gas Royalty Sharing Agreements
Econ One Research, Inc. i
January 2002
Chapter 5 – Alaska State Lease Provisions and Experience with Oil Royalty .... 35
• Historical Experience with ANS Oil Royalty
• Alaska’s Oil and Gas Lease Provision: DL-1 and New-Form Leases
• Disputes Concerning Proper Calculation of Royalty Values
• Implications of Oil Royalty Experience for Gas Royalty Determination
Chapter 6 – Conclusions .......................................................................................... 43
• Gas and NGL Markets in North America
• ANS Gas and NGL Value
• ANS Gas and NGL Royalty
Research and Bibliographic Resources....................................................................................................... 47
Econ One Research, Inc. ii
January 2002
List of Figures
1. North American Gas Reserves and Production ................................................................................. 3
2. U.S. Composite Natural Gas Prices 1985-2001.................................................................................. 4
3. Gas Consumption in North America 2000 ........................................................................................ 5
4. North American Natural Gas Pipeline Grid ....................................................................................... 7
5. Top Gas Marketers 2001 ......................................................................................................................... 8
6. Natural Gas Market Centers ................................................................................................................. 9
7. North American Natural Gas Storage ...............................................................................................10
8. Gas Processing Economics ....................................................................................................................13
9. NGL Infrastructure in North America ..............................................................................................14
10. NGL Product Price Relationships/Prices: Mont Belvieu and Conway ........................................15
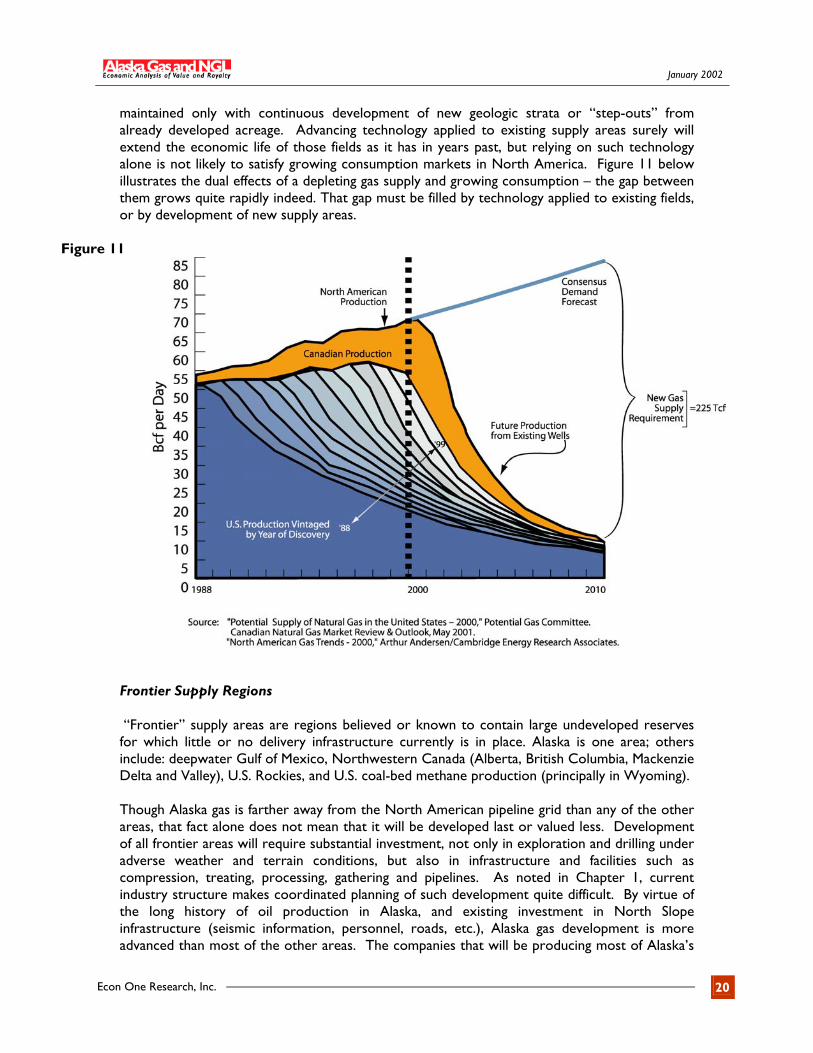
11. Technology and Frontier Gas are Needed to Meet Growing Gas Demand ............................20
12. Chicago Natural Gas Price Relative to Alberta and Henry Hub, Louisiana ..............................23
Econ One Research, Inc. iii

January 2002
Econ One Research, Inc. iv
January 2002
Purpose and Plan of this Report It has been known for years that large reserves of natural gas lie under the North Slope of Alaska, but that its location thousands of miles from large gas consuming markets would require relatively high sales prices in those markets to justify development and transportation investments. In the late 1970s gas prices were high and plans for transportation facilities to move ANS gas to Lower 48 markets were pushed almost to construction when price reversals put the project on hold, where it remained until 2000. Since then, a dramatic gas price spike lasting well into 2001 and ongoing concerns that production from Lower 48 reserves cannot serve expected consumption growth in the decades ahead, have returned ANS gas development and transportation facilities to center stage.
The Alaska Department of Natural Resources (DNR) is charged with developing and managing the State’s resources for the maximum benefit of all Alaskans. Oil and gas resources fall under the purview of the Department’s Division of Oil and Gas. Production from State lands contributes 80 percent of the State’s general fund revenues in taxes and royalties. Oil and gas royalties paid to the Department represent over half of the total revenues. Future oil and gas exploration and development will be essential to State government and the growth of the State’s economy as revenues from existing oil production decline. Alaska DNR commissioned this study of the State’s gas reserves to address a number of economic issues arising from anticipated production and sale of ANS gas and NGL. In overview, these issues include:
1. How are gas and NGL markets in North America structured today and how do they operate? What principal factors drive prices in those markets?
2. Over its expected production life, what role will ANS production play in North American gas and NGL markets?
3. What market factors are most important to determination of the value of ANS gas and NGL at the point of production?
4. What market and economic factors are most important to determination of gas and NGL royalty values under the State’s lease agreements with ANS gas producers?
Chapter Overview Chapter 1 is a description of natural gas markets in North America as they are structured and operate today. This Chapter also provides historical background as to the evolution of those markets and discusses how gas markets are likely to operate in the decades to come, over the life of ANS gas production. Chapter 2 presents a similar overview and description for NGL markets in North America. Chapter 3 discusses economic and market factors that are likely to determine the wellhead value of ANS gas and NGL production when it begins to flow. Chapter 4 provides a discussion of basic economic aspects of royalty relationships, including description and analysis of typical provisions for valuing natural gas in royalty agreements.
Econ One Research, Inc. iv
January 2002
Chapter 5 reviews the State’s lease provisions for oil and gas and how those have evolved and operated for oil production. Chapter 6 presents conclusions and recommendations as to ANS value and royalty issues facing the State and ANS producers. Report Summary
• Deregulation of U.S. gas markets over the past 20 years has made them highly flexible and responsive to short-run changes in demand or supply conditions, but less effective at long term planning for coordinated development of large new supply and infrastructure projects. As a result, gas prices are sometimes quite volatile. Transportation bottlenecks and surpluses can appear and persist at different points on the continental pipeline grid.
• In the decades to come, gas markets will continue patterns established over the last several years – short, sometimes dramatic price swings in response to temporary conditions, and growth of supply and infrastructure, sometimes in large increments that can alter existing price and flow patterns for months or years before being fully “digested” into the larger grid.
• NGL markets are less flexible and responsive than gas markets. There are but a handful of NGL finished product trading centers, where transaction prices are set and reported. Prices paid for raw-mix NGL at the point of production typically are set by deducting transportation and fractionation costs from these downstream market centers. Information as to market rates paid for these services is not well developed or circulated. There is no basis today for expecting significant changes in the structure or operation of NGL markets in years to come.
• ANS gas and NGL are likely to enter North American markets via Alberta, a gas and NGL center that to date has experienced wide price swings relative to other market areas. While introduction of ANS gas and NGL into Alberta markets may stabilize them, that result depends on the evolution of production growth within Alberta and pipeline projects downstream of Alberta.
• Delivery of ANS gas and NGL in the same pipeline will cost less than transporting them separately. Such a pipe, though long and large, will be economically similar to a field gathering system from the perspective of owners and users. There is not likely to be a flourishing secondary market for capacity, for example, on the ANS pipeline.
• Alaska’s oil royalty experience provides a useful template for gas and NGL royalty. Like ANS crude oil, gas and NGL will be moved to destination markets far downstream. The wellhead value of ANS gas will be dependent upon market prices in Alberta and/or other major “nodes” on the North American gas grid and transport costs to those markets.
Econ One Research, Inc. v
January 2002
• Royalty is an economic partnership with sharing of product or sharing of revenues. It is critical that partners share information.
• During its initial years of production, while ANS gas is being introduced into North American markets, ANS producers should share with the State information at their disposal concerning movement and sale of ANS gas and NGL. This will permit the State and producers jointly to understand how ANS gas is fitting into those markets.
• Following this period of intensive information sharing and analysis, the State and producers will be positioned to evaluate lower-cost alternative valuation methods that accurately mimic sales proceeds and movement costs, such as use of published prices in downstream market centers.
• The State should retain its option to take gas and NGL in kind. Doing so preserves its ability to discipline a royalty partner or to avoid neglect or malfeasance.
Note: Throughout this report we use the term "market" in its most general sense, sometimes referring to a geographic area, and sometimes to trading of a particular product, or most generally to commercial activity surrounding a group of related products or services. Economists sometimes use more precise definitions of "market" when analyzing competitive impacts of firm conduct, or price fixing allegations, for example. Because that was not a purpose of this Report, we use the term in its more casual dress.
Econ One Research, Inc. vi

January 2002
Econ One Research, Inc. 0
January 2002
Chapter 1
Gas Markets in North America Gas markets in North America, defined here as the United States and Canada, are today in the latter stages of an economic and regulatory transition that began more than 20 years ago. That transition, largely but not entirely completed, is from a highly integrated and regulated industry, to one composed of distinct but interlocking segments, some competitive, some oligopolistic, and a few remaining stubbornly subject to monopoly structure and (if left unregulated) exercise of market power. The transition has been slow because legislatures and regulatory bodies are deliberative, and because the physical and contractual infrastructure created under a commercial and regulatory regime that dated back to the early years of the 20th century involved long-term contractual and regulatory commitments that have taken time to revise, play out, or terminate involuntarily. Over the past decade, gas markets have shown that complete deregulation of gas sales prices and substantial deregulation of gas transportation rates, has been a success if judged by the market’s ability to provide reliable service. Markets have responded well to stresses brought about by periods of extreme cold with its attendant heavy gas consumption, and facility outages caused by hurricanes and explosions. No end-users that wanted supply have been without gas. Deregulation has produced not only a market environment in which prices direct supplies to highest valued uses, but major developments in storage, transportation and risk management techniques have given gas producers and consumers alike tools that they never had in regulated markets. Today gas is a favored fuel because of its clean-burning attributes, particularly among electricity generators, and growth in consumption is expected to continue in the years and decades to come. That situation is a far cry from the outages and curtailments that plagued U.S. markets as recently as the late 1970s. Then it was feared that North America was “running out” of gas supplies. Alaska gas at that time was primed for development but was not in the event called upon. It serves as useful background in understanding the structure and operation of today’s gas markets, and as a guide in thinking about current ANS gas and NGL development plans, to trace the major developments in regulation and commercial organization that gas markets have undergone over the past 25 years. Historical Overview of Gas Deregulation and Market Development Passage of the Natural Gas Policy Act (NGPA) in 1978 marked the birth of today’s gas industry. It mandated time-phased elimination of wellhead gas price controls, setting into motion a regulatory and industry dynamic toward more open, competitive, segmented gas markets that operate today. A fundamental premise of the NGPA was that lifting price ceilings – and ultimately removing them – would bring forth gas supplies that were sorely needed to satisfy growing consumption, and that competition among gas producers could be relied upon to “regulate” wellhead prices thereafter. In 1985 the Federal Energy Regulatory Commission (FERC) built on this theme, first with Order 436, requiring that U.S. interstate pipelines provide “open access” to their pipeline systems. Before then, pipelines were largely independent systems with relatively few interconnections,
Econ One Research, Inc. 1
January 2002
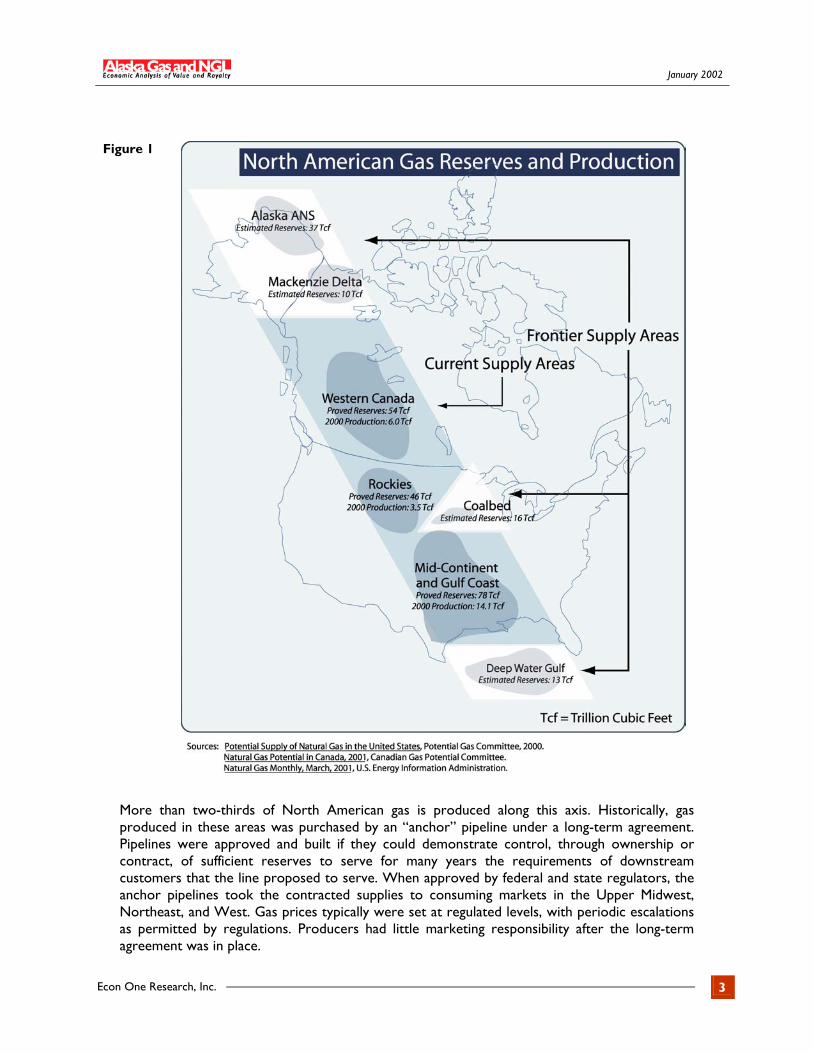
performing all transportation and merchant functions for sales customers – finding, purchasing, and maintaining a gas supply, transporting it, storing it to cover peak demands, and delivering it in accordance with sales contracts and regulations. With open access, others could buy, move and resell gas supplies using pipeline companies’ facilities and, with further regulatory changes, could do so across two or more systems. Though directed to rules affecting pipeline usage and rates, the purpose of Order 436 was to enhance competition in gas commodity markets. The idea was that such markets needed to be more robust both for gas producers and for end-users, with producers able to sell to any potential gas buyer and conversely for gas buyers to be able to reach any potential gas supplier – even those not directly connected to the delivering pipeline. It was reasoned that effective access to all pipelines within the national grid could achieve that objective. The aims of Order 436 initially proved illusive because pipeline companies retained contractual commitments to suppliers and regulatory obligations to “stand ready” to serve traditional utility customers should independent (non-pipeline) suppliers fail. That put a strain on pipelines and transport customers within the context of shared use of a pipeline facility. So, in 1992, FERC Order 636 relieved that pressure by removing pipeline companies from all merchant functions. Pipeline systems then could be used by all shippers on equal terms, clearing the way for growth of supply, sales, and service markets operating along a transportation grid whose use was neutral with respect to competition in those merchant markets. Order 636 achieved what 436 had attempted – it prompted growth of independent marketing companies and the related industry segments that support gas transactions along the pipeline grid. Gas buyers and sellers could transact with each other irrespective of where either was located. This regulatory separation, or unbundling, of gas merchant activities from gas transportation service, has brought into clearer focus a distinction in the gas industry between markets for exploration, production, and consumption of the gas commodity itself, and those for the related trading, transportation, financial, and logistical activities that occur between points of production and points of consumption. Transportation and related activities such as gathering, processing and storage have been the subject of regulatory attention in the past decade, and to a large extent the commercial, legal, and regulatory mechanisms and institutions that FERC and state regulators have put in place are stable and can be expected to remain so in years to come, with fine tuning and adjustment as experience and new factors dictate. That part of the industry appears to be settling down after 20 years of perpetual upheaval and change. The focus now is turning from trading and transportation issues toward the serious question of how to find and develop sufficient gas supplies to satisfy growing demand. ANS gas plays a central role in that new focus. Gas Commodity Markets Gas reserves in North America lie principally along an axis extending from Alaska and western Canada, through the U.S. Rockies, Texas, and into the Gulf of Mexico (see Figure 1).
Econ One Research, Inc. 2
January 2002
Figure 1
More than two-thirds of North American gas is produced along this axis. Historically, gas produced in these areas was purchased by an “anchor” pipeline under a long-term agreement. Pipelines were approved and built if they could demonstrate control, through ownership or contract, of sufficient reserves to serve for many years the requirements of downstream customers that the line proposed to serve. When approved by federal and state regulators, the anchor pipelines took the contracted supplies to consuming markets in the Upper Midwest, Northeast, and West. Gas prices typically were set at regulated levels, with periodic escalations as permitted by regulations. Producers had little marketing responsibility after the long-term agreement was in place.
Econ One Research, Inc. 3
January 2002
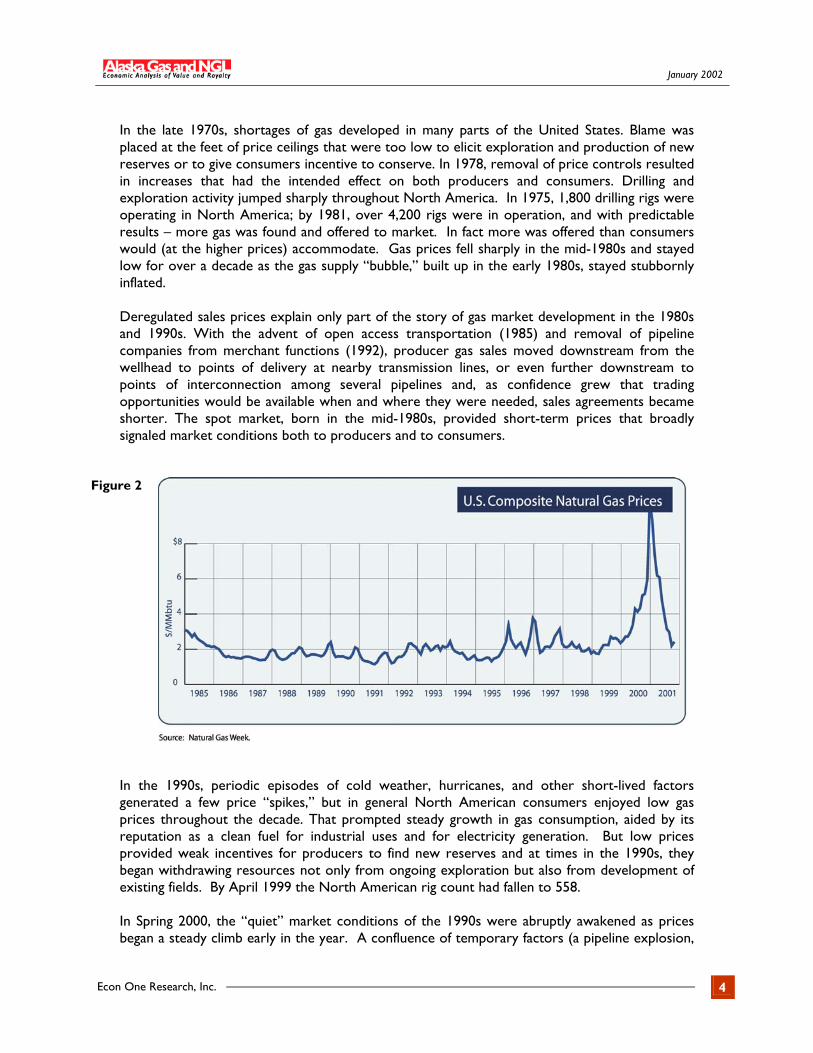
In the late 1970s, shortages of gas developed in many parts of the United States. Blame was placed at the feet of price ceilings that were too low to elicit exploration and production of new reserves or to give consumers incentive to conserve. In 1978, removal of price controls resulted in increases that had the intended effect on both producers and consumers. Drilling and exploration activity jumped sharply throughout North America. In 1975, 1,800 drilling rigs were operating in North America; by 1981, over 4,200 rigs were in operation, and with predictable results – more gas was found and offered to market. In fact more was offered than consumers would (at the higher prices) accommodate. Gas prices fell sharply in the mid-1980s and stayed low for over a decade as the gas supply “bubble,” built up in the early 1980s, stayed stubbornly inflated. Deregulated sales prices explain only part of the story of gas market development in the 1980s and 1990s. With the advent of open access transportation (1985) and removal of pipeline companies from merchant functions (1992), producer gas sales moved downstream from the wellhead to points of delivery at nearby transmission lines, or even further downstream to points of interconnection among several pipelines and, as confidence grew that trading opportunities would be available when and where they were needed, sales agreements became shorter. The spot market, born in the mid-1980s, provided short-term prices that broadly signaled market conditions both to producers and to consumers.
Figure 2
In the 1990s, periodic episodes of cold weather, hurricanes, and other short-lived factors generated a few price “spikes,” but in general North American consumers enjoyed low gas prices throughout the decade. That prompted steady growth in gas consumption, aided by its reputation as a clean fuel for industrial uses and for electricity generation. But low prices provided weak incentives for producers to find new reserves and at times in the 1990s, they began withdrawing resources not only from ongoing exploration but also from development of existing fields. By April 1999 the North American rig count had fallen to 558. In Spring 2000, the “quiet” market conditions of the 1990s were abruptly awakened as prices began a steady climb early in the year. A confluence of temporary factors (a pipeline explosion,
Econ One Research, Inc. 4
January 2002
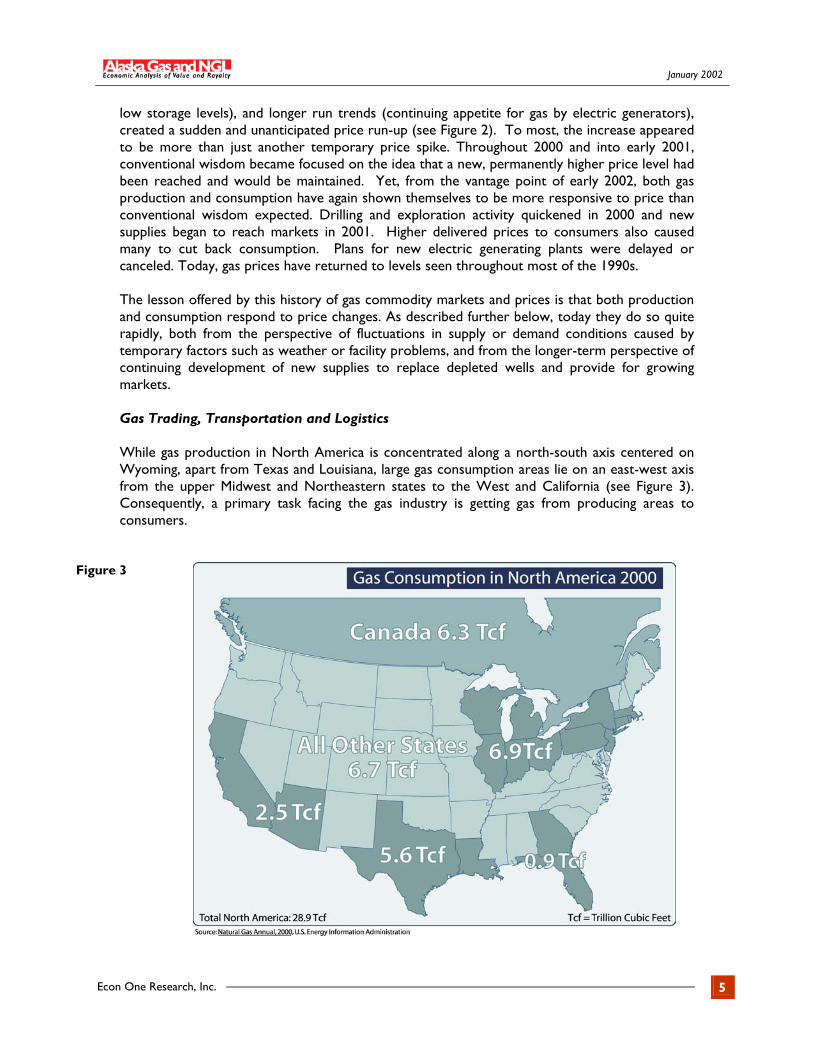
low storage levels), and longer run trends (continuing appetite for gas by electric generators), created a sudden and unanticipated price run-up (see Figure 2). To most, the increase appeared to be more than just another temporary price spike. Throughout 2000 and into early 2001, conventional wisdom became focused on the idea that a new, permanently higher price level had been reached and would be maintained. Yet, from the vantage point of early 2002, both gas production and consumption have again shown themselves to be more responsive to price than conventional wisdom expected. Drilling and exploration activity quickened in 2000 and new supplies began to reach markets in 2001. Higher delivered prices to consumers also caused many to cut back consumption. Plans for new electric generating plants were delayed or canceled. Today, gas prices have returned to levels seen throughout most of the 1990s. The lesson offered by this history of gas commodity markets and prices is that both production and consumption respond to price changes. As described further below, today they do so quite rapidly, both from the perspective of fluctuations in supply or demand conditions caused by temporary factors such as weather or facility problems, and from the longer-term perspective of continuing development of new supplies to replace depleted wells and provide for growing markets. Gas Trading, Transportation and Logistics While gas production in North America is concentrated along a north-south axis centered on Wyoming, apart from Texas and Louisiana, large gas consumption areas lie on an east-west axis from the upper Midwest and Northeastern states to the West and California (see Figure 3). Consequently, a primary task facing the gas industry is getting gas from producing areas to consumers.
Figure 3
Econ One Research, Inc. 5
January 2002
As noted above, pipeline companies used to perform that function, under the direction of federal and state regulators. They purchased gas at the wellhead, then gathered, treated, processed, compressed, stored, transported, and delivered it to customers. But pipeline companies today provide only transportation service; all other merchant activities are performed by independent companies, or by pipeline affiliates subject to a regulatory mandate of open and non-discriminatory service. The transition from integrated, bundled pipeline service to today’s segmented market has seen the emergence of distinct market segments that provide a host of services along the pipeline grid. These segments operate alongside and in conjunction with gas commodity markets, and include: 1) gathering and processing; 2) pipeline transportation; 3) marketing and trading; 4) market centers or “hubs;” 5) storage; and 6) gas-related financial instruments. Each plays an important role in how the industry operates today, and exerts influence on upstream prices realized by producers and on end-use prices paid by consumers. Gathering and Processing. Gathering systems are small-diameter pipeline networks of limited geographic scope that act as a bridge from wellheads to the continental pipeline grid. Typically, gathering firms not only move gas from wellhead to grid but also provide services such as compression, dehydration, and gas conditioning to remove impurities and water. Most prominently, though, they also extract natural gas liquids (NGLs) that can be present in the gas stream (see Chapter 2). Traditionally performed by pipeline companies as part of their regulated, bundled service, or by producers as part of the sale of gas production, gathering and processing now are provided also by independent companies under unregulated rates and terms. As greater specialization has taken hold in gathering and NGL processing, agreements have evolved from long-term contracts covering large tracts of developed and undeveloped lands, into shorter, more flexible, and often more geographically compact arrangements. In addition to new commercial forms, competition among gatherers has generated a number of new services, including low-pressure gathering, condensate measurement and marketing, water disposal, and remote flow measurement.
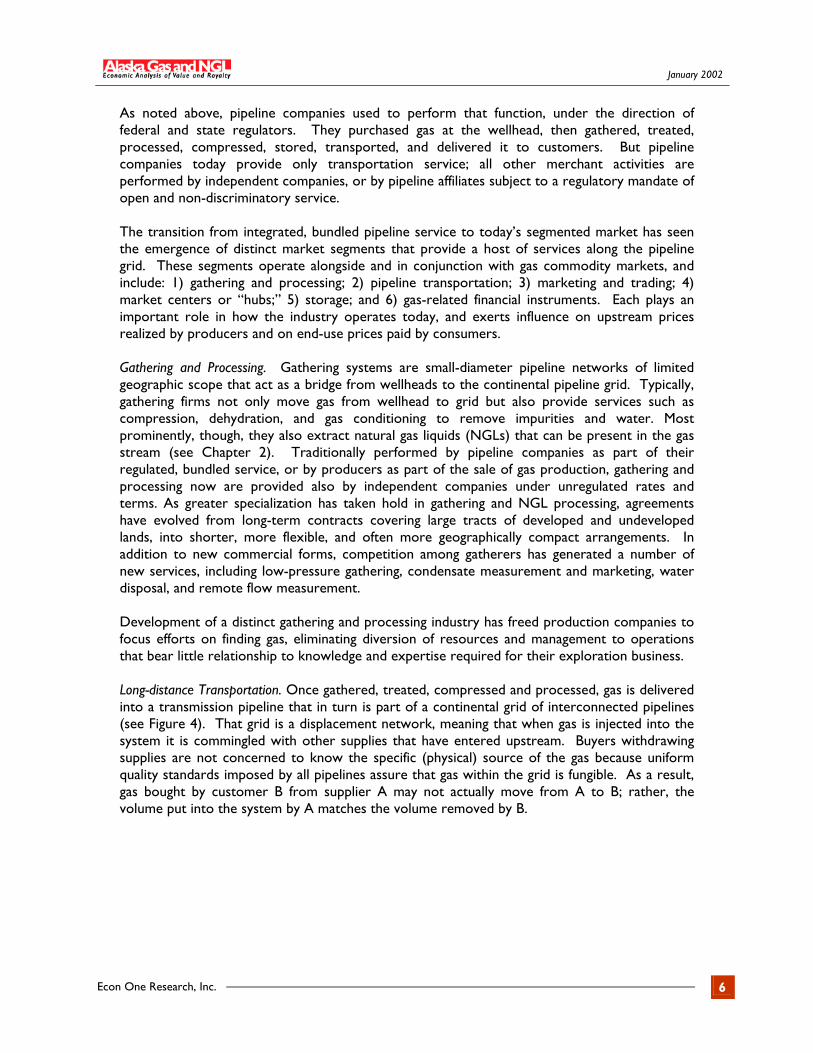
Development of a distinct gathering and processing industry has freed production companies to focus efforts on finding gas, eliminating diversion of resources and management to operations that bear little relationship to knowledge and expertise required for their exploration business. Long-distance Transportation. Once gathered, treated, compressed and processed, gas is delivered into a transmission pipeline that in turn is part of a continental grid of interconnected pipelines (see Figure 4). That grid is a displacement network, meaning that when gas is injected into the system it is commingled with other supplies that have entered upstream. Buyers withdrawing supplies are not concerned to know the specific (physical) source of the gas because uniform quality standards imposed by all pipelines assure that gas within the grid is fungible. As a result, gas bought by customer B from supplier A may not actually move from A to B; rather, the volume put into the system by A matches the volume removed by B.
Econ One Research, Inc. 6
January 2002
Figure 4
The fungibility of gas once it enters the pipeline grid creates opportunity for substantial transportation cost savings compared to a system where specific bundles of product are matched and traced from supplier to customer. FERC Orders 436 and 636 (and most recently, Order 637) were specifically designed to achieve that efficiency by standardizing operating protocols and facilitating contracting across interconnected systems. Gas marketers, producers, and end users can create customized pipeline systems within the existing physical (and separately owned) pipeline systems to “move” gas from hundreds of independent supply sources to a like number of customers. Fungible supplies also greatly facilitate creation and trading of financial instruments tied to gas. Much of FERC’s ongoing work with respect to natural gas relates to removing remaining impediments to efficient use of the pipeline grid. In crafting rules designed to do that, FERC is mindful of the dilemma it faces concerning short-run efficiency versus long-run efficiency. In its official pronouncements, and in speeches given by commissioners, it appears that FERC is striving to attain both; that is, it is trying to create a pipeline market where short-run price signals effectively ration available capacity and provide appropriate long-run incentives for investments in new systems and expansion of existing ones. Marketing and Trading. If there is one party that straddles all aspects of the gas industry, it is the gas marketing company. These firms obtain access through ownership and/or contract to
Econ One Research, Inc. 7
January 2002
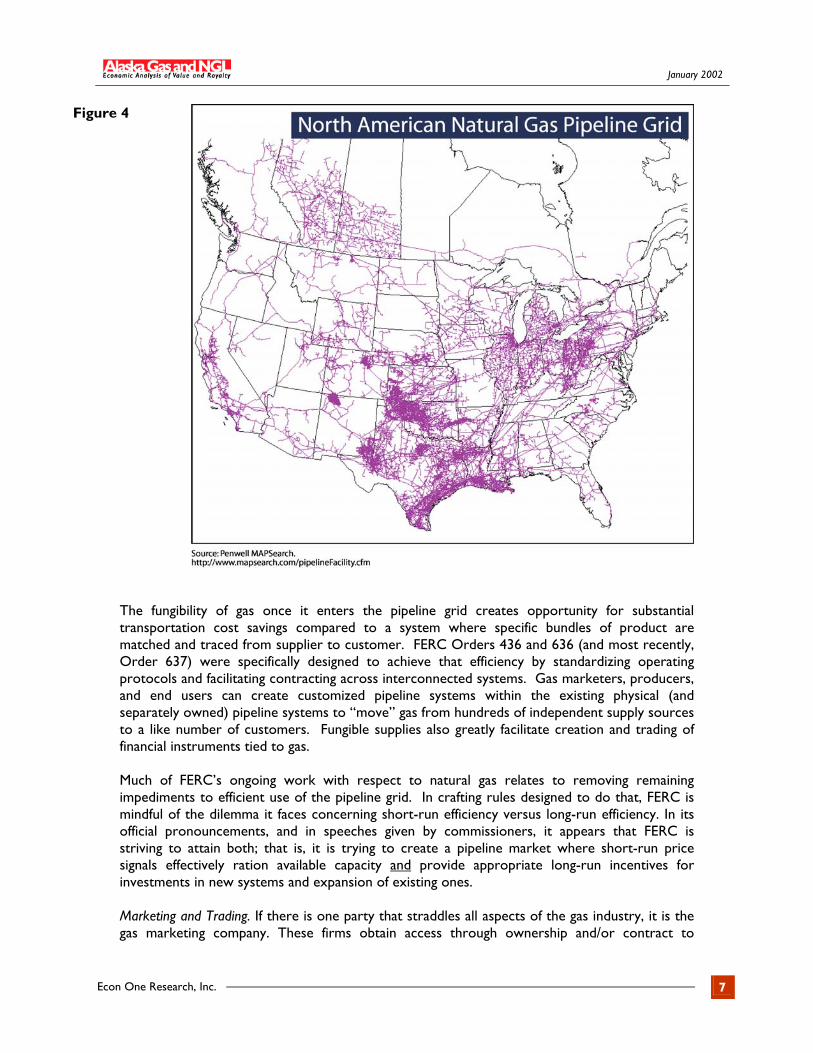
facilities needed to: a) assemble a portfolio of gas supplies; b) hold and repackage them as necessary; and c) make deliveries to a portfolio of gas customers. Competition among marketers (entry into the industry is relatively easy), coupled with opportunity to earn unregulated profits has created intense pressure on them to create innovative services and to minimize costs. That competition confers a tremendous economic benefit both to gas producers and to consumers. Marketing firms have come to the business from a variety of paths. Some were created out of pipeline companies, some from producers, and some from gas distribution companies. Marketers handle more than 80 percent of gas consumed in North America.
Figure 5 Gas marketers’ activities serve to link gas and other energy product markets, particularly electricity. These linkages have had a number of impacts on operation and development of the gas business:
Cross-commodity risk management
Short-term gas purchase agreements
(weekly, daily, even hourly) and associated short-term transportation capacity agreements.
Short-term storage agreements
Greater summer demand by electric load
that smoothes the gas industries’ traditional winter peak
Siting of new electric generating plants along pipeline routes or near gas market hubs.
The emergence of marketing firms also has spurred growth and innovation in activities related to marketing. For example, marketers’ need for information has created a robust industry of firms that collect, interpret, analyze, and distribute information of relevance and importance to gas buyers and sellers, including information about weather, prices of gas and other fuels, transactions, demand patterns, storage flows and levels, and much more. Government agencies, private firms and quasi-public organizations such as trade associations and industry groups also contribute to regulatory hearings, conferences, trade shows, and other public forums that spread information among market participants.
Some of these organizations are active in making contracting and exchange less costly by writing and endorsing standardized sales, storage, and transportation agreements. The Gas Industry Standards Board (GISB), for example, is a quasi-public organization composed of representatives from several segments of the industry. Though GISB is the focal point for this effort, private companies participate as well when, for example, they create and offer electronic trading services using standardized agreements. Some of these trading platforms simply provide low-
Econ One Research, Inc. 8
January 2002
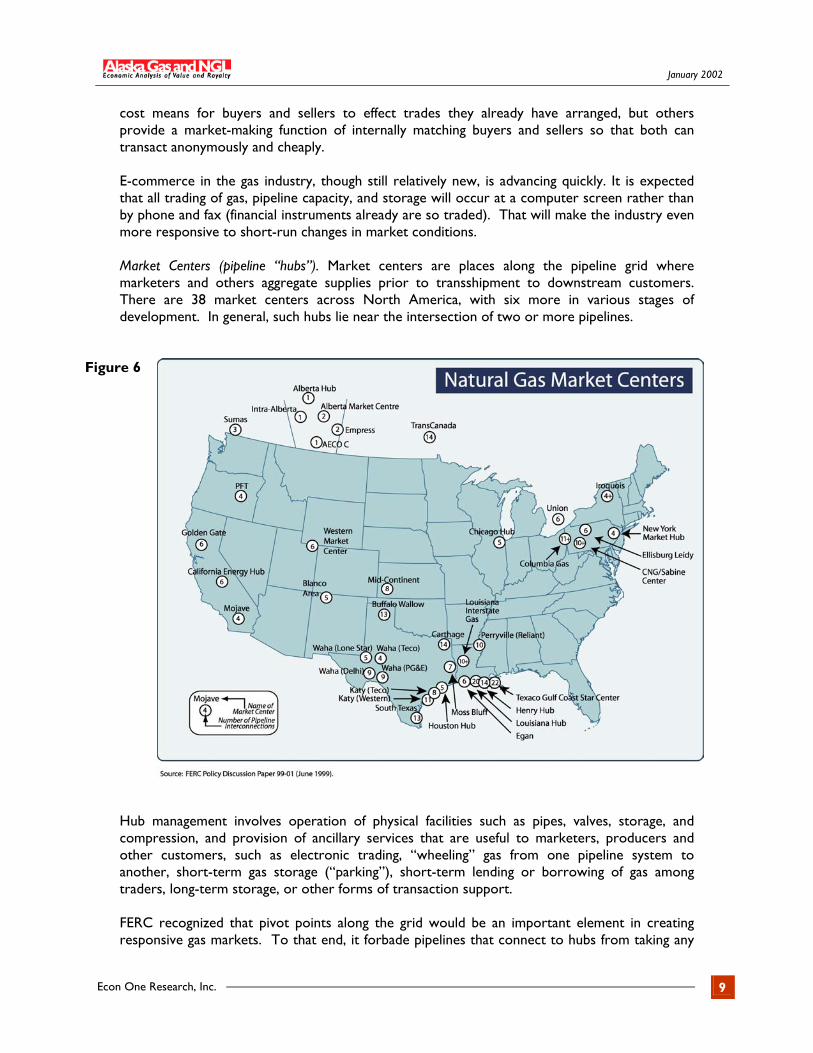
cost means for buyers and sellers to effect trades they already have arranged, but others provide a market-making function of internally matching buyers and sellers so that both can transact anonymously and cheaply. E-commerce in the gas industry, though still relatively new, is advancing quickly. It is expected that all trading of gas, pipeline capacity, and storage will occur at a computer screen rather than by phone and fax (financial instruments already are so traded). That will make the industry even more responsive to short-run changes in market conditions. Market Centers (pipeline “hubs”). Market centers are places along the pipeline grid where marketers and others aggregate supplies prior to transshipment to downstream customers. There are 38 market centers across North America, with six more in various stages of development. In general, such hubs lie near the intersection of two or more pipelines.
Figure 6
Hub management involves operation of physical facilities such as pipes, valves, storage, and compression, and provision of ancillary services that are useful to marketers, producers and other customers, such as electronic trading, “wheeling” gas from one pipeline system to another, short-term gas storage (“parking”), short-term lending or borrowing of gas among traders, long-term storage, or other forms of transaction support. FERC recognized that pivot points along the grid would be an important element in creating responsive gas markets. To that end, it forbade pipelines that connect to hubs from taking any
Econ One Research, Inc. 9
January 2002
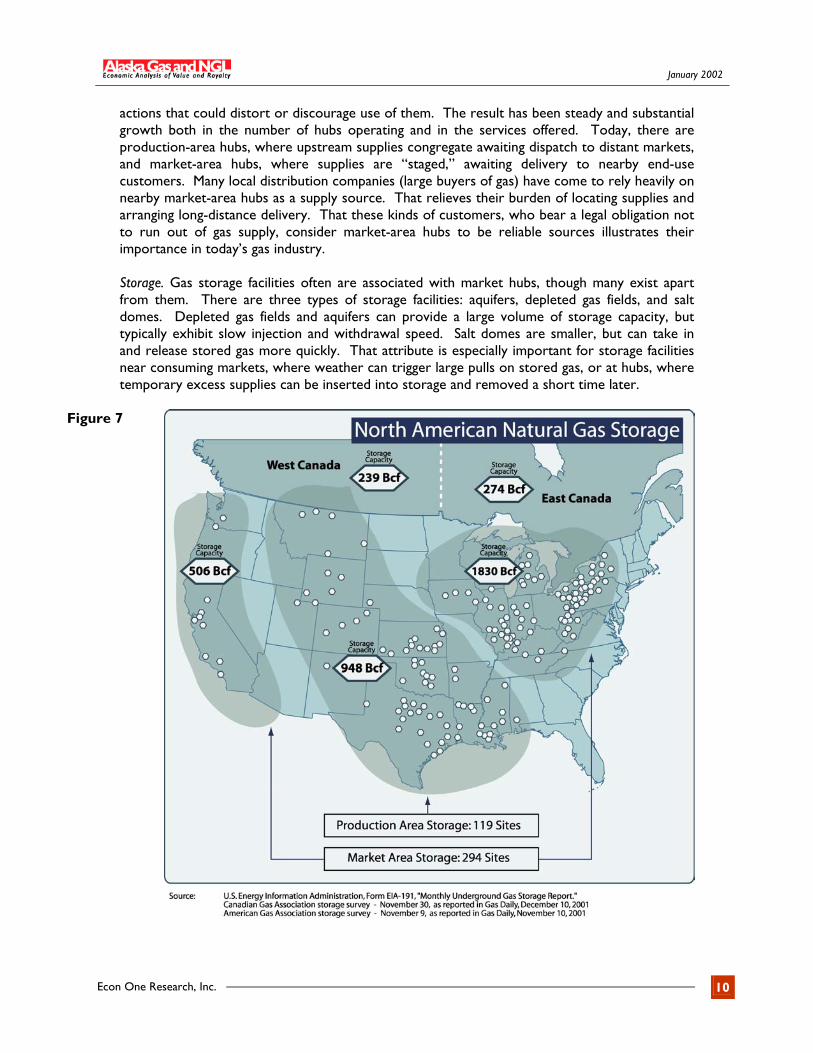
actions that could distort or discourage use of them. The result has been steady and substantial growth both in the number of hubs operating and in the services offered. Today, there are production-area hubs, where upstream supplies congregate awaiting dispatch to distant markets, and market-area hubs, where supplies are “staged,” awaiting delivery to nearby end-use customers. Many local distribution companies (large buyers of gas) have come to rely heavily on nearby market-area hubs as a supply source. That relieves their burden of locating supplies and arranging long-distance delivery. That these kinds of customers, who bear a legal obligation not to run out of gas supply, consider market-area hubs to be reliable sources illustrates their importance in today’s gas industry. Storage. Gas storage facilities often are associated with market hubs, though many exist apart from them. There are three types of storage facilities: aquifers, depleted gas fields, and salt domes. Depleted gas fields and aquifers can provide a large volume of storage capacity, but typically exhibit slow injection and withdrawal speed. Salt domes are smaller, but can take in and release stored gas more quickly. That attribute is especially important for storage facilities near consuming markets, where weather can trigger large pulls on stored gas, or at hubs, where temporary excess supplies can be inserted into storage and removed a short time later.
Figure 7
Econ One Research, Inc. 10
January 2002
The number and kind of services offered in connection with storage have grown and become more innovative. Storage once was a tool used only by local distribution companies to provide peak winter deliveries, but now it is used by producers, marketers, large end users, and local distribution companies, for a variety of reasons, including daily balancing, risk management, and trading. Financial Instruments. In addition to creating geographically diverse portfolios of supplies and customers, marketers and others also hold supply and delivery positions that span time. To aid management of price risk inherent in such inter-temporal obligations, these parties have turned to financial markets for risk-hedging and trading instruments. The natural gas futures contract created by NYMEX in 1990 became the fastest growing contract, in terms of volume traded, in that exchange’s history. Futures contracts, forward contracts, options, swaps, and other financial instruments related to gas, NGL, and allied products are traded on organized public exchanges, and via private exchanges such as Intercontinental Exchange (ICE) and those operated by large marketers such as Dynegy. A principal use of these financial instruments is risk management. Marketers, producers, and customers can, at low cost, “lock in” prices using them. The ability to do so aids financial planning, reduces capital cost, and permits more efficient use of physical assets. The new features of gas logistics that have grown up over the past 10 years – marketing companies, open access transport, hubs, storage, and financial instruments – all serve to make gas markets highly responsive to short-run changes in supply or demand conditions. Gas sales, transportation, and storage agreements today are shorter than those in the integrated, regulated industry because most buyers and sellers have confidence that trading partners will be available when and where they are needed. Transportation rates, storage rates, and even gathering and processing rates all can change relatively quickly. As a result, gas prices at a specific market location can be quite volatile, as can price differences between locations. While that serves to discipline markets and efficiently allocate existing supplies and facilities to their highest valued uses, it can weaken or distort long-term price signals for investments. The enhanced short-run efficiency of the gas industry is therefore a mixed advance to the integrated, regulated industry of years past. With today’s disaggregated industry, short-run prices are responsive, but long-range planning is harder. In the past, the process of regulatory approval for pipeline projects imposed an organizing mechanism that effectively coordinated simultaneous development of pipelines and supplies. That mechanism no longer operates, and today pipelines and supplies can be built and developed on different schedules, sometimes leaving one without the (properly-sized) support of the other. Examples abound. Development of U.S. Rockies gas over the past decade or more provides numerous instances of excess pipeline capacity (when a new project is completed), followed by excess gas supplies (as new fields are found or developed). The San Juan Basin and Gulf of Mexico are other examples. The economic effect of independent development of supply and infrastructure is that the continental grid works less efficiently than it otherwise might, with some sections suffering over-capacity (and low transport rates) while others are full (and enjoy high transport rates).
Econ One Research, Inc. 11
January 2002
North American Gas Markets over the Next Several Decades
Over the past two decades, the regulatory focus has been on facilitating development of gas commodity markets by, ironically, reforming pipeline rates and access rules. The success of that program has changed dramatically the way gas is bought and sold, and how pipelines and storage facilities are utilized. Now market institutions such as electronic trading, futures contracts, risk management techniques, hubs, storage, and others are firmly established and can be expected to remain in place. Economic forces now shaping the industry include a rate of demand growth that threatens to outpace development of new gas reserves; fine tuning of pipeline regulation by FERC; adoption of standardized trading instruments and electronic trading methods; and continuing expansions and extensions of the pipeline network and related facilities such as storage and hubs. Over the next several decades, the marketing and logistic aspects of the gas industry will continue to undergo refinement and adjustment, but the industry’s main focus will likely return to the serious problem of finding enough gas reserves to satisfy growing consumption, especially that associated with electricity generation, and integrating them into new and existing physical systems and market trading patterns. Management of that two-fold process of supply and infrastructure development is likely to remain fractured and accordingly, the industry will continue to find at any point in time that its transport grid has sections with excess capacity, and others that are severely constrained.
Consensus projections call for North American gas consumption to exceed 35 Tcf by 2020. Figure 1 above shows that in order to satisfy that demand over the next several decades, the existing gas production axis will need to be extended at both its northern and southern ends. ANS gas will be a key component. How ANS gas will fit into the Northern American market, and how it is likely to be valued there are discussed in Chapter 3.
Econ One Research, Inc. 12
January 2002
Chapter 2
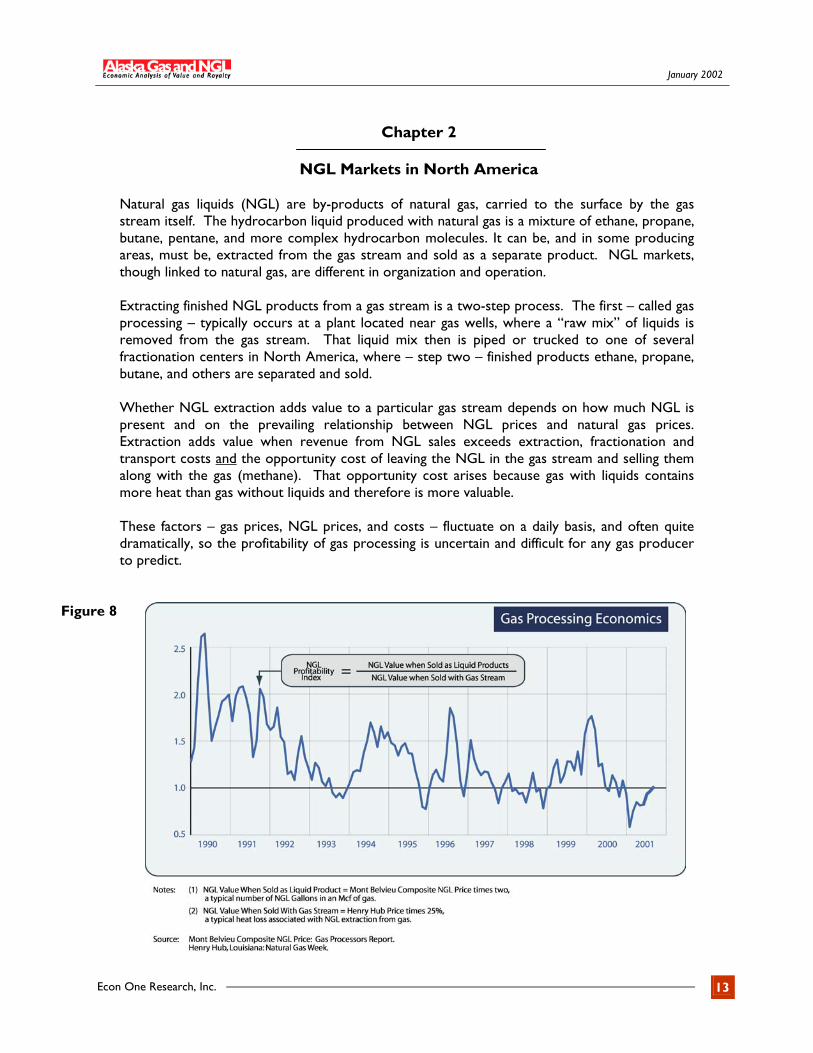
NGL Markets in North America Natural gas liquids (NGL) are by-products of natural gas, carried to the surface by the gas stream itself. The hydrocarbon liquid produced with natural gas is a mixture of ethane, propane, butane, pentane, and more complex hydrocarbon molecules. It can be, and in some producing areas, must be, extracted from the gas stream and sold as a separate product. NGL markets, though linked to natural gas, are different in organization and operation. Extracting finished NGL products from a gas stream is a two-step process. The first – called gas processing – typically occurs at a plant located near gas wells, where a “raw mix” of liquids is removed from the gas stream. That liquid mix then is piped or trucked to one of several fractionation centers in North America, where – step two – finished products ethane, propane, butane, and others are separated and sold. Whether NGL extraction adds value to a particular gas stream depends on how much NGL is present and on the prevailing relationship between NGL prices and natural gas prices. Extraction adds value when revenue from NGL sales exceeds extraction, fractionation and transport costs and the opportunity cost of leaving the NGL in the gas stream and selling them along with the gas (methane). That opportunity cost arises because gas with liquids contains more heat than gas without liquids and therefore is more valuable. These factors – gas prices, NGL prices, and costs – fluctuate on a daily basis, and often quite dramatically, so the profitability of gas processing is uncertain and difficult for any gas producer to predict.
Figure 8
Econ One Research, Inc. 13
January 2002
Figure 8 shows a measure of the profitability of NGL extraction. The index shown is simply the ratio of the dollar value of gas when its NGL is extracted and sold separately, compared to the dollar value of that same gas if sold without removing NGL. When the ratio is greater than 1.0, NGL processing can be favorable to a gas producer (depending on plant costs); when the ratio is less than 1.0, NGL processing is not profitable. On average, the upgrade associated with NGL extraction (using the assumptions of Figure 8) is eight percent. That is, the value of NGLs extracted over the period shown was eight percent higher than the value of gas lost in the extraction process. That implies an added value from processing of 12 cents per mcf (thousand cubic feet) before payments to processing plant owners. As the Figure indicates, while gas processing is most often profitable, it is sometimes unprofitable and the economics are volatile. Against the background of this uncertainty, the NGL industry also must cope with the problem that many of the facilities needed for processing – extraction plants, storage, pipelines, and fractionation facilities – entail large, sunk investments. Accordingly, it is not feasible to move resources quickly into or out of gas processing in response to short-term fluctuations in prices or profits. These two facts – fluctuating and uncertain profitability, and sunk capital – drive much of the operation, contracting, pricing and economic organization of NGL markets.
Figure 9
Econ One Research, Inc. 14
January 2002
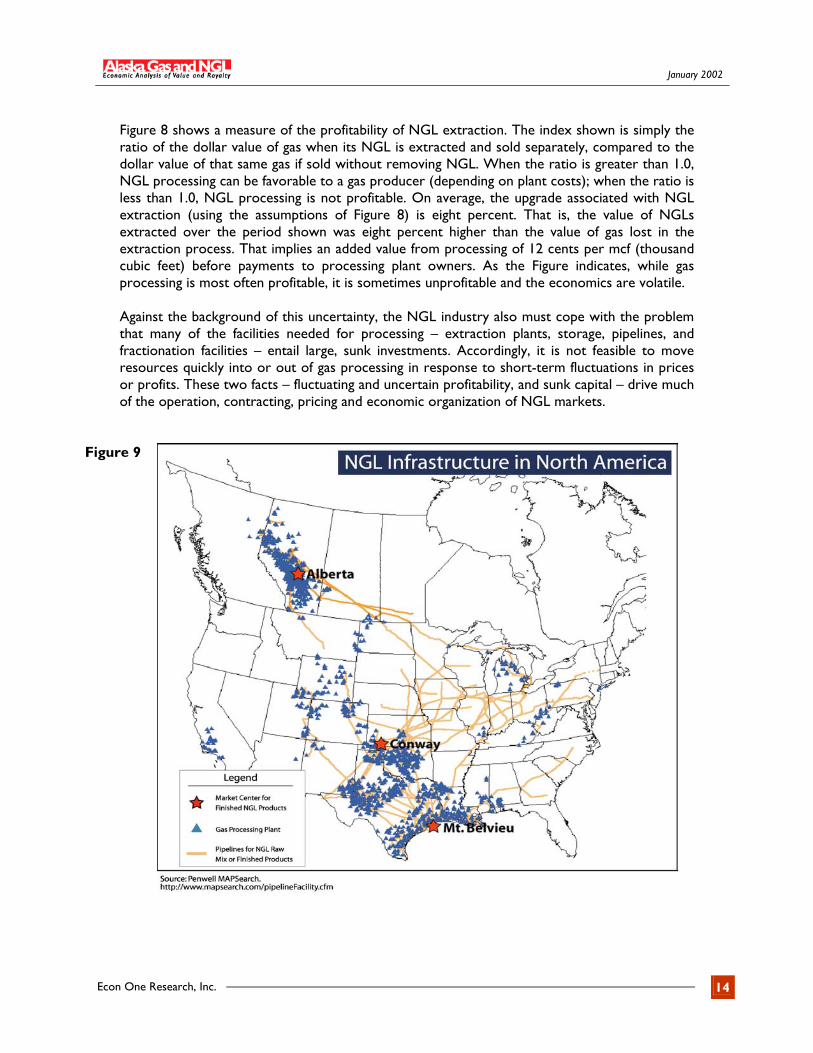
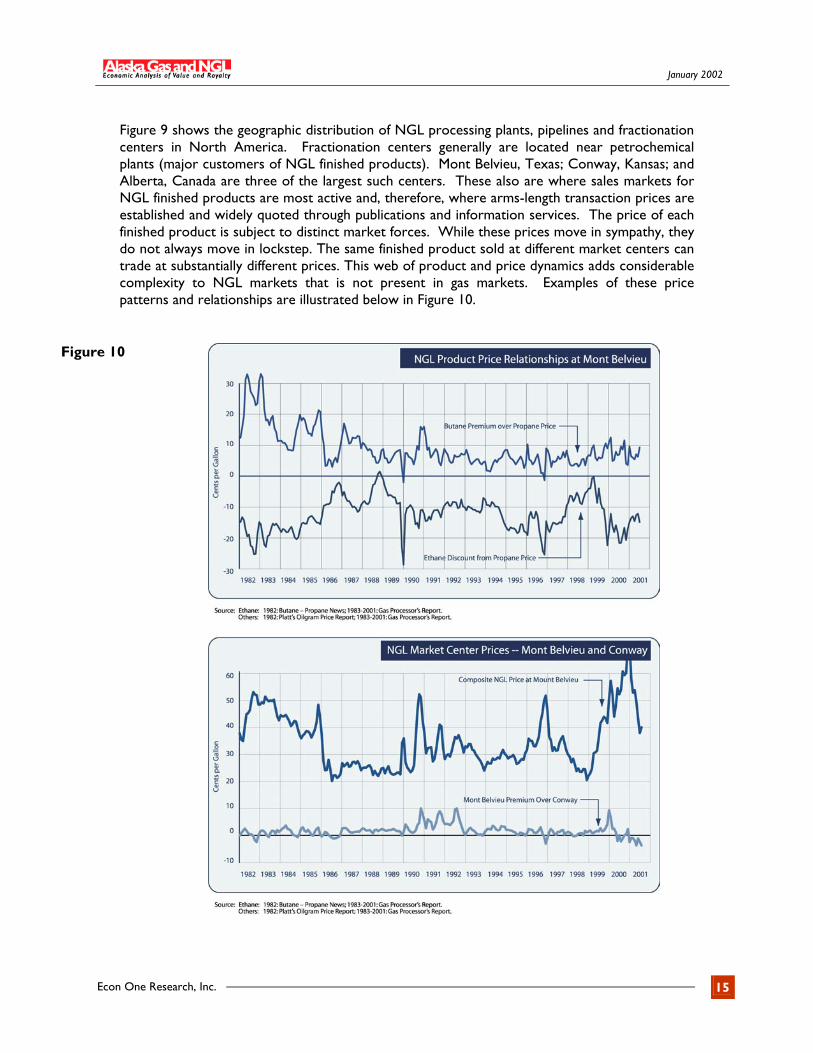
Figure 9 shows the geographic distribution of NGL processing plants, pipelines and fractionation centers in North America. Fractionation centers generally are located near petrochemical plants (major customers of NGL finished products). Mont Belvieu, Texas; Conway, Kansas; and Alberta, Canada are three of the largest such centers. These also are where sales markets for NGL finished products are most active and, therefore, where arms-length transaction prices are established and widely quoted through publications and information services. The price of each finished product is subject to distinct market forces. While these prices move in sympathy, they do not always move in lockstep. The same finished product sold at different market centers can trade at substantially different prices. This web of product and price dynamics adds considerable complexity to NGL markets that is not present in gas markets. Examples of these price patterns and relationships are illustrated below in Figure 10.
Figure 10
Econ One Research, Inc. 15
January 2002
Processing Agreements Producers of NGL-bearing gas usually enter into a contractual agreement with a nearby processing plant to remove raw-mix NGL. These agreements allocate the costs, benefits, and risks of processing.
1. Keep-Whole Agreements. Here the gas producer allows the processing plant owner to extract and sell NGL present in the gas. In return, the producer receives a quantity of MMbtu’s, in the form of gas, equivalent to the heat content of the extracted liquids. Thus, the gas producer is “kept whole” for the loss of heat that results from removal of NGL from his gas stream.
2. Percent of Proceeds Agreements. Under this arrangement, the gas producer and processing
company split proceeds of NGL sales, with the producer usually retaining 70 percent or more. Normally, the producer bears the cost of fuel consumed in operating the processing plant, and the cost of heat “shrinkage” associated with removal of NGL-related MMbtu’s from the raw gas stream.
3. Fee for Service Agreement. Under this arrangement the gas producer simply pays a fee to
the processing company for its service, bears all the opportunity cost associated with plant fuel and shrink, and sells for its own account all the NGL that is extracted.
Variations within each type affect the cost-, benefit-, and risk-sharing characteristics of each, but in general keep-whole arrangements allocate cost, risk, and reward to the processing company; fee-for-service arrangements allocate cost, risk and reward to the gas producer; and percent-of-proceeds arrangements allocate some cost, some risk, and some reward to both. Downstream Finished Product Prices Determine Upstream Raw-Mix Values Processing plants are located in gas producing areas and most are far removed from fractionation centers and finished-product sales markets (see Figure 9). There are over 1,500 processing plants sprinkled throughout the gas production belt that extends from western Canada to the Gulf of Mexico. By contrast there are 86 fractionation plants, with over half of total fractionation capacity located in the Houston, Texas area, Conway, Kansas, and Alberta, Canada.
Because little or no active market trading occurs at most upstream processing plants, the value of raw mix NGL produced at them depends upon the plant’s location relative to one of the large NGL fractionation and finished product sales markets. Upstream NGL prices typically are set equal to published prices for finished products sold at Mont Belvieu, Texas or Conway, Kansas less deductions for transportation of the raw-mix NGL and fractionation costs. That formulation sounds simple, but in practice it can be a complex derivation of value, owing mostly to the difficulty of obtaining information concerning cost deductions. Gas producers, with operations upstream even of processing plants, can readily obtain published information as to finished product prices at downstream market centers, but often they have little or no information about transportation and fractionation costs incurred to move their raw mix NGL from a nearby plant to those markets. Plant owners, who must bear those costs, have direct access to them. As a consequence of this information asymmetry, intentional or inadvertent distortion of deductions can be used to lower the value paid to producers (or
Econ One Research, Inc. 16
January 2002
equivalently, to raise processing plant charges). At a minimum, the asymmetry presents an ever-present negotiating tension between producers and plant owners.
This wellhead NGL valuation difficulty is a persistent problem for gas producers and allied claimants (royalty owners, taxing authorities) for a number of reasons:
1. The transportation grid for NGL is not comparable to the gas grid – It is smaller, with
fewer interconnections, fewer market centers and, for the most part, it is not a displacement network. See Figure 4 in Chapter 1 and compare it to Figure 9 above.
2. There are far fewer marketers buying and selling NGL than for gas.
3. NGL finished product customers tend to be clustered around the major fractionation
and market centers. This leads to active trading at these market centers, but little outside of them.
4. Accumulation and dissemination of information concerning prices and the cost of
services such as transportation and fractionation is much less than exists for gas markets.
In short, NGL buyers and sellers work with less public information and fewer trading tools than those in gas markets. There is little or no publicly-available price information, for example, regarding prices paid for NGL at upstream locations away from the major NGL market centers. Upstream NGL values that are derived or estimated solely from public information may only approximate what actual transaction prices might be if upstream market activity was widely reported. There are other attributes of the NGL industry that distinguish it from natural gas. For example, contracting and exchange in NGL markets is not highly standardized and still involves significant cost of negotiating and monitoring agreements. Agreements tend to be longer than is typical for gas sales. Both input costs and product prices are subject to economic forces in related markets (natural gas, petrochemicals, gasoline refining). And, an imbalance of knowledge and information exists among those in the industry. In short, NGL markets in North America are far less “commoditized” than those for gas. North American NGL Markets Over the Next Several Decades Like gas markets, NGL markets are likely to operate in the future much as they do today, but for different reasons. The gas industry has moved a long way toward commoditizing not only gas, but related services such as transportation, storage and financial instruments. This makes those markets accessible to a wide variety of participants. While some NGL finished products may be considered commodities, the ease of market exchange is far less than it is for gas. That is not likely to change in the foreseeable future. NGL markets will remain the domain of specialists. There will continue to be a relatively small number of NGL market centers in North America where prices are determined by trading among a relatively small number of buyers and sellers. That limits the amount of information upon which to base value estimates outside these market centers. And finally, there is no regulatory force at work now to push NGL markets in any discernible new direction. Though every market undergoes change over time, there is no basis today for predicting that NGL markets will change.
Econ One Research, Inc. 17

January 2002
Econ One Research, Inc. 18
January 2002
Chapter 3
Valuation of ANS Gas and NGL Current gas consumption in North America is about 70 billion cubic feet (Bcf) per day. Consensus growth projections, if realized, would put consumption at 85-90 Bcf per day by 2010. Current NGL consumption in North America is about 120 million gallons per day. Assuming continued NGL extraction rates, projected NGL production for 2010 would be 154 million gallons per day. A developed and flowing ANS supply of 4 Bcf per day of gas and 10 million gallons per day of NGL would account then for about 5 percent of total North American gas sales and 7 percent of NGL sales.
The value of Alaska gas and NGL when it begins production will depend upon prices and market conditions in North America, not in-state markets. Local markets cannot absorb the large volume of gas produced from ANS fields, even at very low prices. The bulk of ANS gas and NGL will flow to markets in North America and accordingly, analysis of valuation must focus on its anticipated role in those established markets. A few key factors will determine that role: the pace of North American demand growth; the ability of existing producing areas to maintain or increase output; the size, development cost, and accessibility of frontier supply areas other than Alaska; and the specific intermediate and destination markets within North America to which ANS gas and NGL are most likely to be routed. North American Demand Growth Judging whether consensus projections of North America gas consumption are accurate is, of course, difficult. A skeptic could point to forecasters’ inability to predict, even for relatively short periods, prices of gas, electricity or crude oil. Relationships among these are critical inputs to any gas consumption forecast and given our inability to forecast them, no consumption forecast deserves much respect. Yet, short of adopting that agnostic view, there is no better basis for planning and conducting analyses of future markets than to utilize these projections, with due scrutiny of their assumptions. A number of organizations and government agencies forecast gas consumption, including the Gas Research Institute, the U.S. Energy Information Administration, and the Canadian Energy Research Institute. These and others generally predict that gas consumption will increase 2-3 percent per year over the next two decades. These forecasts are based upon projections of economic growth and continued expansion of gas use in electricity generating plants and other industrial uses. Notwithstanding the recent dramatic price increases of 2000-2001, it is generally accepted that gas will continue to play a dominant and expanding role in North America’s energy mix over the years to come. Certainly there are “wild cards” that could alter that picture, such as advances in fuel cell technology, distributed electricity generation (which could increase or decrease gas use depending on the technology developed), and environmental regulations. But none of these has risen yet to a level of commercial importance sufficient to cause forecasters to predict a slowing or reversal of gas consumption growth. Thus, under almost any expected growth scenario, expansion of gas and NGL consumption in North America will continue. But that expansion cannot occur without development of new supply areas. By its nature, production from existing fields declines over time, or can be
Econ One Research, Inc. 19
January 2002
maintained only with continuous development of new geologic strata or “step-outs” from already developed acreage. Advancing technology applied to existing supply areas surely will extend the economic life of those fields as it has in years past, but relying on such technology alone is not likely to satisfy growing consumption markets in North America. Figure 11 below illustrates the dual effects of a depleting gas supply and growing consumption – the gap between them grows quite rapidly indeed. That gap must be filled by technology applied to existing fields, or by development of new supply areas.
Figure 11
Frontier Supply Regions “Frontier” supply areas are regions believed or known to contain large undeveloped reserves for which little or no delivery infrastructure currently is in place. Alaska is one area; others include: deepwater Gulf of Mexico, Northwestern Canada (Alberta, British Columbia, Mackenzie Delta and Valley), U.S. Rockies, and U.S. coal-bed methane production (principally in Wyoming).
Though Alaska gas is farther away from the North American pipeline grid than any of the other areas, that fact alone does not mean that it will be developed last or valued less. Development of all frontier areas will require substantial investment, not only in exploration and drilling under adverse weather and terrain conditions, but also in infrastructure and facilities such as compression, treating, processing, gathering and pipelines. As noted in Chapter 1, current industry structure makes coordinated planning of such development quite difficult. By virtue of the long history of oil production in Alaska, and existing investment in North Slope infrastructure (seismic information, personnel, roads, etc.), Alaska gas development is more advanced than most of the other areas. The companies that will be producing most of Alaska’s
Econ One Research, Inc. 20
January 2002
gas – Exxon Mobil, Phillips, and BP Amoco – are large, established energy producers with access to financial capital and expertise. In addition, partners in one of the primary pipeline proposals – the Alaska Highway route – are established, experienced pipeline companies that have been organized and functioning since the late 1970s. Many of the necessary permits for that project are already in hand.
In addition, ANS gas production is relatively rich in NGL while some of the other areas are not. Coal-bed methane, for example, has no NGL but does have high levels of carbon dioxide and other impurities that must be removed. Treating and conditioning will add substantially to the cost of delivering that gas to the pipeline grid but unlike NGL, those costs will result in little or no offsetting sales value.
Production characteristics of two of the frontier areas – Gulf of Mexico and coal-gas – are particularly risky from the perspective of large up-front investments in facilities and other infrastructure. Production from wells in these areas tend to exhibit a brief “pop” of early production that tails off to low (albeit steady and long-lived) production thereafter. Gulf production in particular has caused great concern in this regard – new wells there have shown steep decline patterns. In short, Alaska’s existing status as a major oil producing region, coupled with the head-start (almost actual start) it experienced in the late 1970s positions it well in the competition it faces from other frontier supply areas in North America. What North American Markets Will ANS Gas and NGL Serve? Assuming that North American demand projections are realized, and that those projections result in development and integration of ANS gas and NGL, the two remaining factors of critical importance to its valuation concern which downstream markets ANS supplies will serve, and how the costs of shipping gas to those markets will be determined and applied in setting values in Alaska. Alaska gas and NGL most likely will be moved to North America via a dense-phase pipeline (one carrying gas and NGL in the same stream) that traverses or terminates in Alberta, Canada. Though LNG and Gas-to-Liquids (GTL) markets and related facilities also are potential outlets, they appear at this time to be secondary to pipeline transport. Intermediate and Destination Markets. For purposes of analyzing determinants of ANS gas and NGL value, it is useful to distinguish two kinds of gas marketplaces in North America. Some are locations where end-users (or the local retail distributor that delivers to them) buy and consume gas. Call these “destination” markets. They ultimately are the destination points for gas produced and transported within North America. An “intermediate” marketplace is located upstream of destination markets, but downstream of individual gas wells or fields. These are places where gas supplies are aggregated, stored, traded, and routed on to destination markets. These were described in Chapter 1 as production-area “market centers” or “hubs.” Transactions at these locations occur primarily between commercial parties (producers and marketers), with little or no involvement of end-users. Large destination markets like Chicago and California are served by more than one upstream intermediate market and, conversely, large intermediate markets like Southwest Wyoming and West Texas, can reach more than one downstream destination market. Some Gulf Coast areas
Econ One Research, Inc. 21
January 2002
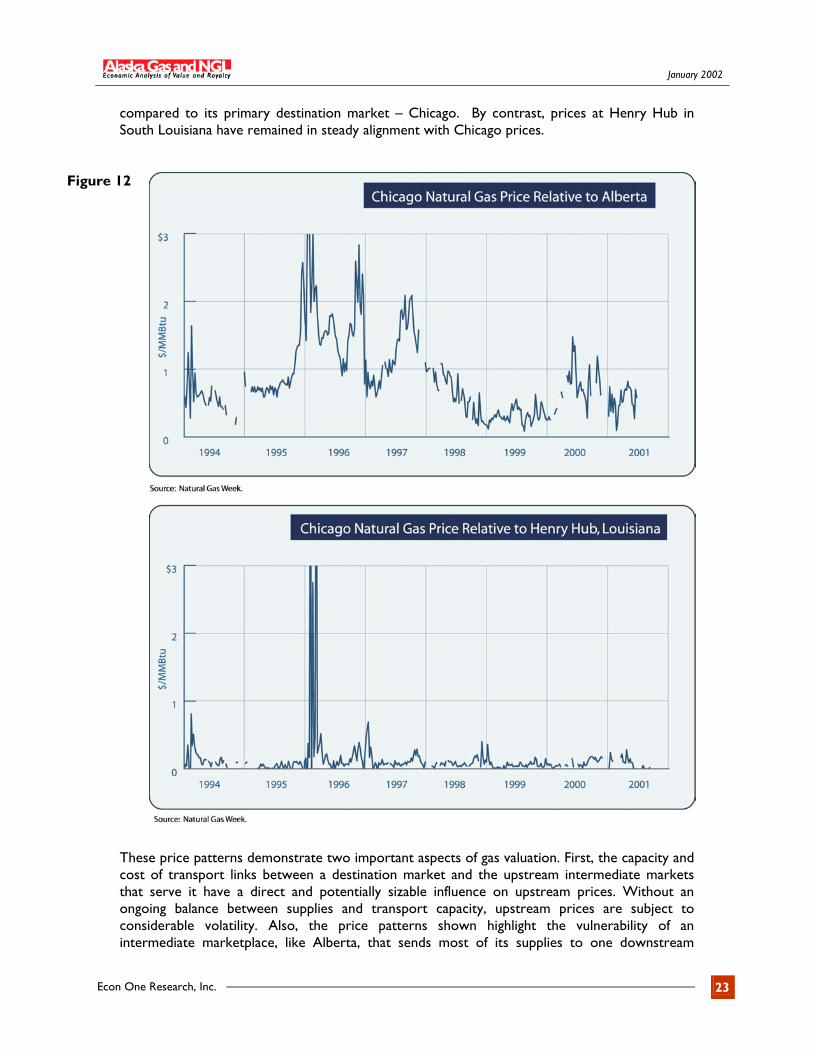
enjoy both attributes – they are at the same time aggregation points for gas moving to downstream destination markets but also serve large nearby consumers. Prices at destination markets and intermediate markets are greatly influenced by the number of supply or sales options available to them. For example, a destination market capable of receiving gas flows from a number of different upstream hubs provides valuable options for consumers there, and prices reflect those options. They are lower and more stable than prices paid by consumers in markets served by fewer upstream hubs. For gas producers and other sellers, the same is true of upstream hubs – those with gas at a hub capable of routing supplies to more than one destination market typically enjoy higher and less volatile prices than those with supplies at a hub that serves only one downstream consumption market. The large pipeline corridors spanning the North American gas grid are connections among intermediate markets and destination markets. Prices across the system adjust to prevailing market conditions at each node, and reflect the capacity and cost of transportation between nodes. Observed price differences between some pairs of nodes remain quite stable over time, reflecting a balance between gas flows and transport capacity. Other pairs experience volatile price relationships, caused by periodic imbalances in available supplies or demands relative to interconnecting capacity. This distinction between intermediate and destination marketplaces applies to gas. For NGL the situation is somewhat different. As described in Chapter 2, there is no comparable pipeline grid and system of hubs for NGL to that which serves gas. Rather, NGL typically is first extracted upstream, near the point of gas production, then piped or truck downstream to one of a relatively few fractionation centers where final NGL products are produced and sold, usually to nearby large customers such as petrochemical companies. These fractionation centers can be considered analogous to destination markets for NGL. The Potential Role of Alberta in Valuation of ANS Gas and NGL Under most of the pipeline transport options proposed for ANS gas, the routing will traverse and most likely terminate in Alberta, Canada. Alberta is an intermediate marketplace on the North American gas grid, but a destination marketplace for NGL. These facts point to some important questions whose answers in years to come will greatly affect ANS valuation. First, what are the downstream destination markets accessible to gas that is aggregated in Alberta, and what are current and expected transport costs and capacity to them? Second, if ANS gas is routed in such a way as to bypass (or “bullet through”) Alberta in an effort to reach higher-value downstream gas markets, will NGL values at those markets suffer compared to the sales opportunities in Alberta? And third, if ANS gas and NGL bypass Alberta, where will it go? With respect to gas, the Alberta marketplace has a rough history. Though there is an established hub, or market center in Alberta that provides support facilities such as storage and trading services (actually there are several such hubs – See Figure 6 in Chapter 1), throughout its history to date, Alberta gas and the pipelines that carry it to downstream destination markets have failed to achieve a stable role in North American markets because production and takeaway pipeline capacity have not grown in a balanced way. This can be seen in the pattern of Alberta prices shown in Figure 12, which shows that prices in Alberta fluctuate substantially
Econ One Research, Inc. 22
January 2002
compared to its primary destination market – Chicago. By contrast, prices at Henry Hub in South Louisiana have remained in steady alignment with Chicago prices.
Figure 12
These price patterns demonstrate two important aspects of gas valuation. First, the capacity and cost of transport links between a destination market and the upstream intermediate markets that serve it have a direct and potentially sizable influence on upstream prices. Without an ongoing balance between supplies and transport capacity, upstream prices are subject to considerable volatility. Also, the price patterns shown highlight the vulnerability of an intermediate marketplace, like Alberta, that sends most of its supplies to one downstream
Econ One Research, Inc. 23
January 2002
destination market. While some Alberta gas can, and does, flow to Western U.S. markets, the bulk of it is shipped to the upper Midwest. In that situation, any excess pipeline capacity or bottlenecks that develop between Alberta and Chicago have an immediate effect on Alberta prices. If Alberta served Chicago and Western markets more equally, that effect would be dampened and Alberta prices would be more stable as a result. The Alliance Pipeline. The prices shown in Figure 12 do not reflect much experience with the presence of the newest pipeline serving Alberta: Alliance. That pipeline went into service in December 2000. It carries Western Canadian gas to a point near Chicago. There the gas stream is processed at the Aux Sable plant, built in conjunction with the pipeline, and then is delivered to sales markets in the upper Midwest or to markets in the Northeast. The Aux Sable plant is the largest in North America in terms of gas throughput. The Alliance/Aux Sable arrangement, where gas and raw mix NGL are transported together for a long distance, is unique among North American pipelines, but similar to the pipeline and processing arrangement envisioned for ANS gas. The advantage of that arrangement is that it transports raw mix NGL at lower cost than if that mix were extracted at or near production (as is the norm) and transported via a separate pipeline to a downstream fractionation center and finished products market. The disadvantage of that system is that it isolates its gas stream from the North American grid until it reaches markets near Chicago. This is because the grid does not accept gas containing raw mix NGL. That isolation limits sales and market options available to Alliance gas, though its proximity to large markets in Chicago mitigates this problem. In effect the Alliance pipeline is a large, long gathering system that delivers to a single processing plant. Only then can the gas enter the pipeline grid and participate in the merchant activities that take place along the grid.
The Alliance system has created excess pipeline capacity serving production in Western Canada. Accordingly, prices there are today little different than downstream market prices in Chicago, especially in comparison to past years when the reverse situation – not enough pipeline capacity – had depressed Alberta prices relative to Chicago. The situation today is favorable to producers in Alberta, but over the longer term, the see-saw relationship of pipeline capacity and production that has plagued Alberta over the years makes it difficult to assess its true and permanent economic role in North American gas consumption markets vis-à-vis other producing areas. The uncertainty impedes investment in exploration and transport facilities. How Will ANS Gas and NGL Affect Alberta Markets? If flows into Alberta become commingled with other supplies that are aggregated there, ANS gas and NGL will become subject to the same market forces that act on all Alberta supplies. As noted, to date those forces have created periods of benefit to producers with gas there, as well as periods of very low prices when supplies faced constrained transport outlets. It is possible that introduction of a large new supply source that ANS gas would represent could bring the region to a size threshold sufficient to create a stable marketplace there, particularly if that size prompted creation or expansion of takeaway pipeline routes serving destination markets other than the upper Midwest. In that scenario, the Alberta region could become a northern “Henry Hub” with volumes from Alaska solidifying the Alberta region as a permanent and active marketplace for gas and NGL. As shown by Henry Hub, that reputation itself encourages investment in services and facilities that enhance trading, such as storage, organized trading markets, and take-away pipeline capacity. Financial markets also could recognize Alberta as a legitimate location for establishment of a northern futures market, for gas and/or NGL. That, of course, would further enhance the region’s legitimacy as a stable and reliable market center.
Econ One Research, Inc. 24
January 2002
But whether ANS gas and NGL will bring about market stability in Alberta is not a certainty. The added ANS volumes may simply offset production declines in that region, both for gas and NGL, and even should the ANS volumes represent incremental supplies there, the critical factor influencing Alberta prices is pipeline takeaway capacity relative to those supplies. Excess pipeline capacity can be expected to produce strong prices in Alberta, relative to downstream markets, while constrained capacity will generate weak prices. Alone, nothing about the increased size of gas supplies available in Alberta upon the arrival of ANS gas will change that fundamental fact. While excess capacity would benefit ANS producers and the State, its presence sets up the very see-saw phenomenon of alternating excess and constrained capacity that Alberta has experienced over the years. The same has occurred in other regions as well, the U.S. Rockies being a prime example. Experience shows that when pipeline capacity serving a region is tipped out of balance with the region’s production capacity, it is difficult to regain that balance, and the result is fluctuating periods of abnormally low and abnormally high gas prices. That fact highlights the importance of today’s estimates of the volume of ANS gas that will be produced and piped into Alberta, and – equally important – the expected volume of Alberta gas (including perhaps supplies from the MacKenzie Delta and Valley areas) that also will be offered to market at that time. Such volume estimates are critical in determining how much takeaway pipeline capacity should be added, if any. If ANS plus Alberta volumes in 2010 exceed expectations, pipeline capacity out of Alberta may not accommodate it, with resulting low prices. Given the long lead-time for pipeline construction, such estimates of joint ANS/Alberta/MacKenzie production must be made and evaluated now, not after ANS gas begins to flow. A second factor highlighted by Alberta’s uneven development to date is the value of diversification of sales options. The value of ANS gas will be enhanced if, when it begins to flow to markets, it can readily access two or more large destination markets. The ability of ANS gas to flow either to Western markets such as California, or to Midwestern markets such as Chicago will give ANS producers valuable options. Again, given the long lead time associated with expansion or construction of pipelines from Alberta to either Western or Midwestern markets, it is vital that such pipeline proposals and plans be evaluated in conjunction with ANS development plans. Can ANS Gas and NGL By-Pass Alberta? If ANS gas producers determine that injecting their production into the Alberta marketplace is likely to subject them to too much uncertainty in terms of the rates and capacity of takeaway pipelines, they may devise means to avoid the Alberta market entirely. There are two potential ways to accomplish such a by-pass. First, the pipeline constructed to handle ANS gas could be extended to other markets downstream of Alberta. Or, the producers could obtain long-term commitments in advance of production on existing takeaway pipelines to assure themselves adequate capacity to move beyond Alberta at known, consistent rates. These options pose a number of hazards and costs for ANS producers. The cost of a pipeline system extending from, say, Alaska’s North Slope to Chicago would be enormous. Moreover it would effectively lock ANS producers into a single downstream sales market. In addition, if such a pipeline were, as planned, a dense-phase line carrying both gas and NGL, the NGL portion of the stream would by-pass a market (in Alberta) that may well be superior to any available near Chicago. Alberta is home to a large petrochemical industry (which Chicago lacks) that would
Econ One Research, Inc. 25
January 2002
provide a substantial market for NGL. Arranging capacity on takeaway pipelines now serving Alberta would indeed enable ANS producers to sell NGL in Alberta and ship gas downstream to potentially more attractive sales markets, but that option must confront the risk of committing to a sizable portion of existing lines’ capacity. These are difficult choices for ANS producers but ones that, once taken, will substantially affect the value realized by them for years to come. One of the major conclusions of this Report with respect to royalty determination is that as those choices are being made and as events surrounding them unfold, it is critical that producers and the State share detailed information concerning the actual disposition of ANS gas and NGL. Information relating to transportation routes and costs, and ultimate sales realizations in whichever markets ANS gas and NGL ultimately reach should be made available to the State under either proceeds-based, or value-based royalty methods. Netback Calculations for ANS Gas and NGL The amount North America buyers in Alberta or markets further downstream will pay producers for ANS gas and NGL depends on prevailing price levels for gas and NGL available to them in other supply markets, and on the cost of moving ANS gas and NGL.
In the gas and NGL business the term “netback price” refers to a calculated, or estimated price, as opposed to an observed arms-length transaction price. A netback price is calculated by deducting transportation costs required to move gas or NGL from a producing area (where the netback is being applied) to a downstream market area where transactions occur and prices are collected and published. The use of netbacks is quite common to derive gas and NGL values at remote points in North America
The economic rationale for calculating and using a netback derivation of value is that competitive buying and selling should, in theory, force prices at different locations to equal the cost of transportation between them. If that relationship did not hold, it would give rise to an arbitrage profit opportunity. The actions of those seeking to exploit that opportunity would return the price differential to transport costs. The same concept also can be used to estimate the price of one product based upon observed prices for a second product and the costs of converting one into the other. So, for example, one could estimate prices for NGL in one location based upon prices for gas in a second location, less transport and processing costs. The netback methodology for estimating value, though simple in theory (sales price less transport costs) requires special care in practice. Problems can arise in the determination and application of transport cost data in the formula. When a pipeline has excess capacity, its fully-allocated cost of service is little or no different that if it were running full (variable operating costs could differ, but these are normally a small part of total pipeline costs). But market forces tend to reduce the rates paid for transportation on a pipeline that has excess capacity to rates below those derived to recover total costs. Thus the actual price paid by a shipper using a line with excess capacity would be less than the pipeline’s full cost of service. The reverse could be true in the event of a pipeline bottleneck. In that case shippers competing to assure that their gas flows through the constrained line can reduce sales prices – effectively bidding up the price paid for using the pipeline. This time the true cost of using such a line, for purposes of applying a netback pricing methodology, would be higher than its fully-allocated cost of service. This has happened periodically in Alberta over the years, when pipeline capacity out
Econ One Research, Inc. 26
January 2002
of the area has been constrained. Competition among Alberta producers bid up transport rates, usually through purchases of capacity in the secondary transportation market, to assure their gas moves through the constrained pipe. In that circumstance, a netback value utilizing the pipeline’s tariff transportation rate would overstate actual gas sales value. The conditions posed above – surplus or deficiency of pipeline capacity – are not uncommon and therefore except by coincidence, the actual economic costs to shippers of using a pipeline are unlikely to match up with tariff rates or other full cost-recovery transportation rates. The same is true for transportation and processing of NGL. The mis-match arises from the fact that gas and NGL pipelines and plants are large, long-lived sunk investments that are susceptible to fluctuating throughput. That can create for them periods of above-normal rates reflecting scarcity rents, and periods of below-normal rates that under-recover full costs.
Notwithstanding these complications associated with its use, the netback methodology is frequently used by gas buyers and sellers and, with appropriate care and access to relevant information concerning transport and processing costs, can be a good means of determining upstream values based upon downstream sales prices.
The potential complications warrant special attention in the case of Alaska gas and NGL because sufficient local trading is not likely to occur in Alaska to establish local, transaction-based measures of value and some type of netback methodology is likely to be used by producers and buyers of ANS gas to arrive at wellhead transaction prices. That task will be made somewhat more difficult if a single pipeline moves all ANS production because it will almost never be the case that the pipeline is optimally loaded, and accordingly there could be persistent and potentially unobservable transport rates above full pipeline costs, or persistent discounts below full costs. Either would make use of a netback methodology more difficult. It is in part for this reason that the State and producers should implement a period of intensive analysis and sharing of information during the initial years of ANS production in order to comprehend fully the nuances of netback value measurements for ANS gas and NGL. This suggestion is described in more detail in Chapter 6.
Econ One Research, Inc. 27

January 2002
Econ One Research, Inc. 28
January 2002
Chapter 4
Economic Aspects of Royalty
A royalty arrangement is a partnership between a resource owner and a resource developer. One contributes the resource, the other contributes expertise, investment, and effort to develop and “commercialize” the resource. A royalty agreement is a contractual mechanism for sharing that enterprise’s benefits and responsibilities between these partners. While the economic purpose and benefit of royalty is to capture efficiencies of specialization, delegation of development and marketing powers by the resource owner to a non-owner creates two kinds of problems that the partnership, through its contractual agreement, must address. The first is principal/agent problems arising from the fact that once the enterprise is launched the developer (the owner’s agent in commercializing the resource) is likely to possess superior information, which it can be expected to exploit to its advantage where possible. The other is problems stemming from the difficulty (or impossibility) of using a long-term contract to provide certainty and stability to the partnership, while at the same time enabling adaptation to changed circumstance. Principal/Agent Problems In theory, an agent (in this case a gas production company, or lessee under an oil and gas lease) always acts in harmony with the principal’s (mineral owner; lessor) interests. But in practice, agents can and often do pursue their own interests, even when doing so harms the principal. Where that danger is present and the parties foresee that it may cause problems, contractual agreements between principals and agents will specify oversight and monitoring mechanisms to police agent conduct. A primary tool of oversight in gas royalty agreements is the lessor’s right periodically to audit a producer’s financial, production, and operating records to determine if performance has been in accordance with lease terms. That right serves both as a means to correct past errors in royalty sharing, and as an incentive for the producer to establish procedures and data collection that will demonstrate its faithful performance of obligations. Yet, as many producers and mineral owners can attest, audits often are complex, costly, and inevitably involve interpretation and judgment. These weaken its power to fully assure producer performance. When such oversight is not possible or proves too costly to administer, a principal may seek to structure the agent’s compensation in some creative way so as to align incentives. It would be possible of course for a gas producer to be paid by a mineral owner based upon time and expenses, with no payment linked to the volume or value oil and gas produced and sold. But clearly a producer under that deal has little or no incentive to maximize development value, or to operate efficiently. In contrast, permitting the producer to keep all product upon payment of a fixed amount – effectively buying the mineral from its owner – presents the difficult task for both parties of arriving at a price, with little or no information about future production levels or revenues. For gas royalty agreements, a better compensation scheme than either of these extremes is one in which lessor and lessee share revenues from production, or share in physical production. Production or revenue sharing does better align producer and mineral owner incentives, but it is
Econ One Research, Inc. 29
January 2002
subject to its own set of problems. For example, when revenues are shared (as opposed to physical volumes) the producer is positioned to exploit its natural advantage over the mineral owner regarding important revenue-related data such as reserve size, production levels, NGL content, costs, prices and sales opportunities. In a revenue sharing arrangement where that kind of information is used, the producer can capture a larger-than-agreed share by withholding or distorting such information. That can result from intentional acts of deception, but also simply because information used to calculate revenues and costs often requires interpretation and analysis. It is natural for a producer to apply interpretations favorable to it and to create and share information consistent with that interpretation.
Unfortunately, recognizing these problems does not aid much in their resolution. Audits and litigation of detailed contract terms are costly forms of contract administration. Writing a contract that accurately and fully describes which among many possible interpretations is the “correct” one is difficult at best. Even if such language could be agreed to, the danger remains that the lessor won’t be able to detect and enforce it, even with audit rights, or to take steps to correct faulty sharing. Contract Adaptability Problems Oil and gas leases normally last for many years, well beyond the time frame that a lessor (mineral owner) and a lessee (producer) could be expected to predict how production and value determination will unfold. Royalty terms and sharing methodologies that today efficiently carry out the parties’ intentions, can become onerous to one side or the other as circumstances change. There is no perfect royalty agreement in an ever-changing market environment – one capable of continuously implementing (at acceptable cost) the parties’ initial intentions. Every agreement entails a tradeoff between the low-adaptability and high administrative cost of highly specified agreements that carry a degree of certainty, and the hassle and costs of (and potential hold-up associated with) renegotiating agreements with flexible but open-ended terms. Types of Gas Royalty Sharing Agreements The following is a list of royalty sharing principles, methodologies, and procedures often appearing in oil and gas royalty agreements:
1. Royalty paid in value
a. Lessee producer’s wellhead sale b. Wellhead sales proceeds of other, comparably-situated producers c. Lessee producer’s sale proceeds from downstream sales points (netback
calculations). d. Market value measures constructed from sale activity at major downstream
markets to which lessee producer’s gas could, or should, flow (netback calculations).
2. Royalty in Kind
These methods of royalty determination are briefly described below, with explanation of the economic benefits underlying them and difficulties presented by each.
Econ One Research, Inc. 30
January 2002
Royalty in Value 1. Proceeds from producer’s wellhead sales. Though wellhead sales are not common today, this measure of value still appears in many leases. Clearly this value measure is the simplest and easiest to determine. The potential problems with its use relate to determination that the producer’s proceeds are not artificially depressed (owing perhaps to sales to an affiliate, or to an independent party where compensation is received in forms other than sales proceeds), or that the producer’s marketing efforts have been adequate to obtain the highest available proceeds. 2. Wellhead sales proceeds of other, comparably-situated producers. This lease term evolved as a means of assuring that a producer’s marketing efforts were adequate to obtain proceeds at least equal to those being obtained by comparable sellers. It is not an easy formulation to implement owing to the cost of obtaining relevant information concerning third-party transactions. Even where such information is available, the difficulty in implementing such a measure lies in performing an adequate comparison of sales terms other than price, and adjusting for legitimate sources of price differences such as gas quality or location.
3. Lessee producer’s sale proceeds from downstream sales points (netback calculations). Under this measure, a producer pays royalty based upon sales revenue it obtains for gas and NGL produced and sold. For sales that occur downstream from the wellhead, this methodology is intended to document actual sales and actual costs incurred to move and sell gas and NGL at those downstream locations. Some portion of such costs often are deducted from revenue to determine the lessor’s share of value. In theory this arrangement can give a precise measure of value received by producer at the wellhead even when no wellhead sales occur. That makes it a highly desirable measure. Weighed against that substantial benefit, though, are a number of costs and administrative challenges:
a. The producer is likely to have superior access to information needed to make value determination. That leads to opportunity to cheat; when that occurs and is not detected, the lessor is deprived of his agreed-upon share. When it occurs and is detected, trust is destroyed, potentially raising future compliance and enforcement costs. That in turn heightens producer incentive to cheat, and the cycle continues. The result can lead to expenditure of resources by both sides that cut into the economic benefit to both parties of gas and NGL sales.
b. Because gas is transported in a displacement pipeline network, often it is not possible accurately to physically trace gas from point of production to point of sale. Therefore, by necessity, both revenues and costs in a net proceeds measure are accounting determinations that result from allocation procedures. These may bear little or no resemblance to true revenues and economic costs. In addition, the producer may aggregate lessor’s gas with gas from other sources and provide valuable services to customers with the resulting “package” of gas. Attributing a portion of the value of such services to a particular lessor’s gas is, again, a difficult task, involving accounting allocations that may bear little relationship to the value-
Econ One Research, Inc. 31
January 2002
added by any particular gas source, and which may be subject to manipulation and distortion by the producer to reduce royalty sharing.
c. Affiliate transactions – likely to be present in movement and sale of ANS gas and
NGL – also present opportunity for a producer to shift costs to avoid royalty payments. Producers that use affiliates to gather, process, transport or provide other services prior to sale have an incentive to inflate the costs reported for those activities so as to reduce the lessor’s share of value.
d. The presence of NGL in Alaska gas, and the likelihood that such NGL will be transported long distances in the same stream as gas, complicates net proceeds determination because the cost of such joint transportation must be allocated between gas and NGL.
4. Market value measures constructed from third-party transactions at downstream
markets (netback calculations).
Under this approach royalty payments use an agreed-upon downstream published price index, less agreed-upon market indicators of costs for moving of gas and NGL to that downstream sales point. This approach does not require specialized information that only the producer is likely to possess and must share with lessor, and that puts them on more equal footing. It eliminates the opportunity for a producer to manipulate information to its advantage, and eliminates the perceived need by the lessor to impose costly compliance standards and procedures for producer to perform (or seek in turn to avoid or distort). Weighed against these benefits are the following disadvantages:
a. The downstream market index chosen may not reliably reflect value for the production covered by the royalty agreement. For example, the index could be subject to manipulation by one or more buyers or sellers at the index location. In addition, the agreed-upon index may be subject to short-run or long-run changes that do not accurately reflect changes in value of the royalty production. Also, the producer may find and sell into more lucrative markets than those chosen for index.
b. Published data for NGL transportation rates, processing costs and fractionation costs are not as readily available as published gas prices; in addition, such transport and processing information requires a greater level of interpretation. That presents opportunity for manipulation, distortion, or at least disagreement about, the meaning and application of such information.
c. Transport rates for ANS gas are likely to be highly influenced by the dominance of the three largest ANS producers in the takeaway pipeline. Even if producers do not own that pipeline, they still are likely to dominate its use and affect the structure and level of rates paid. This will affect value determination for both gas and NGL.
d. Market rates paid for transportation can differ from tariff rates, and short-term market rates may differ from long-term market rates. These complicate use of independent rates in netback calculations. To the extent that producers are positioned to affect collection and presentation of such information, the opportunity exists for manipulation.
Econ One Research, Inc. 32
January 2002
Royalty in Kind It is relatively rare that gas royalty is paid in gas. Unlike oil, gas cannot easily be stored at the lease by the lessor and disposed of separately from the lessee’s production. That could potentially require duplicate or costly facilities. Instead, royalty-in-kind for gas, when it occurs, is more likely to involve separate contracting by the lessor or royalty-in-kind purchaser for use of the facilities also used by the lessee. It is possible for a lessor to administer such contracting itself – though that would appear to destroy the primary reason for a royalty partnership (specialization) – or it could contract with a “commercializer” that is distinct from the original lessee. Such contracting, though, presents the same kinds of problems as those discussed above inherent in the royalty relationship: establishing verifiable value principles, and implementing monitoring or compensation mechanisms. One advantage to royalty-in-kind is the possibility of harnessing periodic competition among potential marketers, including the lessee producer, to achieve maximum value. This alone is reason for a lessor to retain the option to switch periodically and with due notice, from royalty-in-value to royalty-in-kind.
Econ One Research, Inc. 33

January 2002
Econ One Research, Inc. 34
January 2002
Chapter 5
Alaska State Lease Provisions and Historical Experience with Oil Royalty
The discussion in this Chapter is not intended to provide a legal interpretation of the rights and obligations of the State and its oil and gas lessees. Rather, it is intended to illustrate and highlight issues and complexities likely to be encountered in valuation of the State’s royalty gas and NGL. Historical Experience with ANS Oil Royalty ANS crude oil royalty is based on a determination of the value of the oil at the point of production, sometimes referred to as “wellhead value.” For purposes of computing royalties, the value of ANS crude oil at the point of production has been computed both by the producers and the State using a netback mechanism since oil production first came on stream in mid-1977. Under that netback mechanism, value at the point of production is based on the value of ANS crude oil in destination markets where it is sold or consumed, less a measure of the cost associated with transporting the product from the North Slope to those markets. The use of a netback approach to wellhead value determination arose from the way in which ANS crude oil was sold and consumed – in destination markets rather than at the point of production itself. Historically, the vast majority of ANS crude oil production has been transported thousands of miles from the North Slope of Alaska before being sold and consumed in destination markets. Today almost all ANS production is sold to refiners on the U.S. West Coast. Until recently, however, large volumes of ANS production were sold in markets as distant as the U.S. East Coast, the Caribbean and/or Asia. Since most ANS crude oil has been sold by producers in destination markets far from the North Slope, nearly all of the transactional information regarding ANS value comes from sales of ANS in destination markets, rather than sales at the point of production itself. To the extent sales occurred on the North Slope, those transactions have almost always themselves incorporated a netback formula, with the price determined from ANS prices or values in destination markets, less a measure of transportation costs to those markets. Alaska’s Oil and Gas Lease Provisions The companies that will produce gas from the Prudhoe Bay Unit and Pt. Thomson Unit signed lease contracts and royalty settlement agreements with the State of Alaska that will govern the calculation of the value of the State’s royalty gas. The leases establish the State’s right to retain a royalty share of production – usually 12.5 percent of gross production – and allow the State to take its royalty share in-kind or in-value. When the State takes its royalty in-kind, it sells its royalty share to third parties. When the State takes its royalty in-value, the lessees pay a cash value for it. The leases provide a mechanism to calculate the cash value of royalty paid in-value.
Econ One Research, Inc. 35
January 2002
The DL-1 Lease Form. Most of the leases in the Prudhoe Bay Unit are DL-1 form leases originally adopted by the State as administrative regulations in 1959. Some of the leases in the Point Thomson Unit also are DL-1 leases but many are new-form leases issued after 1978. There are several important differences between the DL-1 and new-form leases, but both establish the size of the State’s royalty share and give the State the option to take its royalty share in-kind or in-value. They differ in the terms that describe the mechanisms to calculate value for royalty the State takes in-value. Paragraphs 15 and 16 of the form DL-1 lease read as follows:
¶ 15. ROYALTY IN VALUE. At the option of the Lessor, which may be exercised from time to time upon not less than six months notice to Lessee, and in lieu of royalty in kind, Lessee shall pay to Lessor, the field market price or value at the well of all royalty oil and/or gas….
¶ 16. PRICE. The field market price or value of royalty oil or gas shall not be less than the highest of: (1) The price actually paid or agreed to be paid to Lessee at the well by the purchaser thereof, if any; or (2) The posted price of Lessee in the field for such oil or gas at the well, if any; or (3) The prevailing price received by other producers in the field at the well for oil of like grade and gravity or gas of like kind and quality at the time such oil or gas is removed from said land or run into storage, or such gas is delivered to an extraction plant.
Disagreements between the State and the Prudhoe Bay Unit lessees concerning DL-1 lease terms led to the ANS Royalty Litigation in 1977. Over the course of that litigation many of the lease terms were interpreted by the Superior Court and modified by royalty settlement agreements. Some of the issues ruled on include:
1. The cash value of the state’s royalty share is equal to the price of the royalty oil or gas in the market(s) where it is sold, minus the cost of transportation to deliver that oil or gas to market. 2. Each lessee deducts its own reasonable and actual transportation cost from the price in the market(s) where its gas is sold, which may differ from the market value of that transportation.
3. In addition to transportation costs, the State bears field costs on royalty taken in-kind. When the State takes its royalty in-value, the lessees provide it free of field costs. 4. An early Superior Court ruling (that was later superseded by the 1980 royalty settlement agreements) held that the State could take its royalty in-kind only if it received at least as much from sale of the oil to royalty in-kind purchasers as it would have received if lessees paid royalty in value. Only then would taking the royalty in-kind meet the constitutional requirement that it be “in the best interests of the State and for the maximum benefit of its people.”
Econ One Research, Inc. 36

January 2002
The New-Form Lease. In 1980 the State began issuing new-form leases, with royalty and value terms intended to minimize opportunities for dispute over royalty value. These leases have never been litigated. Like the DL-1 leases, the new-form lease describes a variety of mechanisms to calculate royalty value and the lessee must use the mechanism that yields the highest value. An example of the value term found in the new-form lease is illustrated as follows:
¶ 36. VALUE.
(a) For the purposes of computing royalties due under this lease, the value of royalty oil, gas, or associated substances shall not be less than the highest of (1) the field price received by the lessee for the oil, gas, or associated substances. (2) the volume-weighted average of the three highest field prices received by other producers in the same field or area.… the lessee’s posted price in the field.… the volume-weighted average of the three highest posted prices in the same field…
(b) If oil, gas, or associated substances are sold away from the leased or unit area, the term ‘field price’ in subparagraph (a) above will be the cash value of all consideration received by the lessee or other producer from the purchaser of the oil, gas, or associated substances, less the reasonable costs of transportation away from the lease or unit area to the point of sale. The ‘reasonable costs of transportation’ are as defined in 11 AAC 83.228 and 11 AAC 83.229 as those regulations exist on the effective date of this lease.
(c) In the event the lessee does not sell in an arm’s length transaction the oil, gas, or associated substances, the term ‘field price’ in subparagraphs (a) and (b) above will mean the price the lessee would expect to receive for the oil, gas, or associated substances if the lessee did sell the oil, gas, or associated substances in an arm’s-length transaction, minus reasonable costs of transportation….The lessee must determine this price in a consistent and logical manner using information available to the lessee and report that price to the state.
(d) The state may establish minimum values for the purposes of computing royalty on oil, gas, or associated substances obtained from this lease, with consideration being given to the price actually received by the lessee, to the price or prices paid in the same field or area…to posted prices, to prices received by the lessee and/or other producers from sales occurring away form the leased area, and/or to other relevant matters. In establishing minimum values, the state may use, but is not limited to, the methodology for determining ‘prevailing value’ as defined in 11 AAC 83.227. Each minimum value determination will be made only after the lessee has been given notice and a reasonable opportunity to be heard. Under this provision, it is expressly agreed that the minimum value of royalty oil, gas, or associated substances under this lease may not necessarily equal, and may exceed, the price of the oil, gas, or associated substances.
Econ One Research, Inc. 37
January 2002
The new-form lease explicitly acknowledges that the lessees will sell royalty gas in distant markets and that prices of gas in these markets are appropriate data in determining royalty value. The lessees are allowed to deduct their own reasonable costs of transportation. Paragraph 36(d) allows the State to define the minimum value for its royalty. Although the lessees retain a mechanism to voice disagreement with the State, the lessee must pay the higher-of the minimum value or the highest price yielded from the other lease terms. The new-form lease also requires the State to evaluate the same kinds of information that it might consider when establishing the Paragraph 15 value under the DL-1 lease. A critical distinction between Paragraph 15 and Paragraph 36(d) is that the lessees must accept Paragraph 36(d) as determined by the state to be the minimum value for their royalty obligation. Disputes Concerning Proper Calculation of Royalty Values Settled ANS Gas Royalty Disputes. A 1980 royalty settlement agreement anticipated the construction of a pipeline to take ANS gas from the North Slope for Prudhoe Bay only. It includes details about how the State and the lessees are to account for the royalty deduction for the cost of removing CO2 and other impurities in a gas conditioning plant. The conditioning costs to be deducted from the value of royalty gas will depend on whether the lessees own the plant and whether the plant is a unit facility or part of a pipeline project. The magnitude of conditioning costs will not be known until the gas conditioning plant is built. The same agreement provides a formula for calculation of Prudhoe Bay Unit field costs on oil and gas that would apply to all royalty dispositions whether taken in-kind or in-value. At present, the field cost deduction for gas produced from the Prudhoe Bay Unit calculated per the 1980 agreement is $0.19 per mcf. In 1995, near the conclusion of the ANS Royalty Litigation, the State and lessees entered into several gas royalty settlement agreements and set out royalty valuation provisions that differ from the requirements of the DL-1 lease. These provisions apply only to sales of royalty bearing gas referred to as “Local Gas,” defined as dispositions of royalty bearing gas volumes less than 50 mmcf/d. These settlements also determined a royalty deduction on “Blendable NGLs” produced from the Prudhoe Bay Unit, i.e., NGLs that can be blended with oil for shipment on TAPS. A significant term in the 1995 gas royalty settlement agreements prohibits the lessees from charging, as a royalty deduction, the cost of Prudhoe Bay’s Central Gas Facility on gas sold for deliveries to an ANS gas pipeline project. If a lessee sells “New Gas,” defined as a disposition of gas in excess of 50 mmcf/d, the gas royalty settlement agreements leave the question of appropriate valuations and royalty deductions up to the provisions of the DL-1 lease provisions. Volumes of this magnitude would be expected to supply the ANS gas pipeline. In the event that the ANS gas pipeline is built, we understand from DNR that the State will look to Paragraph 15 and 16 of the DL-1 to value most of the royalty gas produced from the Prudhoe Bay Unit. The State and the lessees have not agreed on an interpretation of all of the terms in Paragraph 15 and 16. Settled ANS Oil Royalty Disputes. From the start of ANS oil production the producers computed royalties using one of two basic approaches: 1) proceeds or 2) a measure of market value. In some instances producers used a combination of the two approaches depending on how they
Econ One Research, Inc. 38
January 2002
marketed their oil. Where producers sold oil to another party they often based royalties on the proceeds they received in those sales. Where producers used their ANS oil production in their own refineries, they determined royalties based on a measure of market value. In both cases producers netted back these prices to the point of production by subtracting their determination of transportation cost from the North Slope to the point of delivery. ANS producers used a number of approaches in determining market value for ANS production. In some cases producers constructed market value-based, transparent formulae. These included basing ANS value on the prices of one or more “proxy” crude oils sold in the same destination markets in which ANS was delivered, or basing ANS values on the average price received by the producer in its own sales transactions. In other cases producers determined market value based on a more subjective “assessment” of market factors. The manner in which the major producers computed royalties was contested by the State for many years and was the subject of litigation between the State and producers in the ANS Royalty Litigation. In that litigation the State took issue with the way in which the producers calculated the proceeds they received from sales to third parties and the methods used by producers to determine market value. The State also took issue with many of the cost deductions made by the producers when netting back destination values to the point of production. In the ANS Royalty Litigation the State obtained detailed data relating to all transactions entered into by the producers for the purchase, sale, exchange and transport of ANS oil. The State also obtained data from the producers regarding the cost of transporting ANS oil from the North Slope to destination markets. The process of obtaining and analyzing this information in the context of litigation was lengthy and costly, involving the efforts of many people over several years. The State analyzed the transaction data it obtained from producers during litigation to determine the proceeds actually received by the producers to develop a measure of ANS market value that would closely track prices actually received by ANS producers; it analyzed the information obtained regarding cost deductions to determine appropriate deductions when netting back from destination values. Based on its analysis of producers’ transactions, the State made determinations of proceeds and ANS market values that often resulted in large discrepancies relative to the proceeds and market values reported by producers for royalty payments. In some cases these discrepancies amounted to several dollars per barrel over extended periods of time. Likewise, the State’s analysis of ANS transportation costs resulted in large differences relative to the costs claimed by the producers. The State and major producers settled the oil valuation phase of the ANS Royalty Litigation in the early 1990s. As a result of these settlements, the three major producers agreed to pay the State a total of $736 million in additional back royalty payments. In addition, the State and major producers agreed on a prospective approach for determining royalty values. The prospective valuation approach incorporated in the royalty settlement agreements between the State and producers established a netback formula for royalty payments that consisted of: 1) a destination value measure, and 2) specified cost deductions for transportation to destination markets. Destination values were established by reference to independent, published market assessments for ANS and other crude oils; transportation deductions were based on agreed-upon costs that were, in some cases, indexed to changes in industry-wide transportation cost measures. The royalty settlement agreements include provisions that allow either party to “reopen” or renegotiate terms of the valuation formula with respect both to destination valuation and to
Econ One Research, Inc. 39
January 2002
cost deductions. Either party may reopen in the event it feels the current formula does not produce results that are consistent with true ANS market values. The agreements also specify that if the parties fail to reach agreement on a new formula after one of the parties has formally reopened the negotiation, then their dispute will be settled by binding arbitration. Since entering into royalty settlement agreement in the early 1990s, the State and producers have reopened agreements on several occasions. In each instance, the parties have been able to reach agreement without arbitration. In some instances, the parties have amended the agreements without resorting to a formal reopener notice. Knowledge Gained by the State after Years of Analysis The ANS oil royalty settlement agreements between the State and producers have provided a workable, mutually agreeable framework for royalty valuation over the past decade. Implicit in the agreements is recognition of the costs of compliance and enforcement associated with detailed proceeds accounting (and audits) and the potential controversy surrounding a subjective determination of appropriate value measures. Also implicit is recognition of the economy associated with use of independent, publicly available measures of value and costs that are themselves regularly used by industry participants when contracting for the sale or transportation of ANS. For the State, the agreements have provided a mechanism that enables it to receive a measure of market value for its oil without the need to engage in continuous, detailed auditing of producers’ transactions and accounting data. For the producers, the agreements have provided a formula for paying royalties that removes uncertainties as to how to comply with payment provisions of the lease agreements. That certainty is valuable to the producers. The success of the royalty settlement agreements in striking a balance among the interests of all parties is indicated by the fact that the parties have on occasion renegotiated agreements without the aid of arbitration. The royalty settlement agreements were negotiated by the State after ANS crude oil production had been flowing for more than a decade. They were negotiated after the State had the opportunity to analyze the way in which ANS was transported and sold. By the time the agreements were put in place the State had reviewed thousands of contracts involving ANS transportation, sales and exchanges, as well as accounting statements used by producers to support cost deductions in their netback calculations. The experience and expertise gained by the State through its analysis of data and contracts involving ANS transportation and marketing was a key factor in the State’s ability to negotiate the prospective royalty valuation formulae contained in the agreements. This experience helped insure that the valuation methodology agreed to by the State accurately captured ANS value at the outset, and that the agreements gave the State the ability to modify terms in the event markets changed going forward. Since ANS production came on line in the late 1970s, oil markets have undergone several changes that have affected markets into which ANS has been sold. For example, during the first few years of ANS production, crude oil markets were characterized by long-term contractual relationships between producers and buyers. World events in 1979 set in motion a multi-year change in the oil industry that resulted in greater emphasis on short-term or spot markets. This in turn led to a rise in importance of financial or “paper” markets. In short, the world and the way in which crude oil – including ANS – was marketed changed dramatically over the first
Econ One Research, Inc. 40
January 2002
decade of ANS production in a way that was not anticipated by market participants when ANS production first came on line. Oil markets have continued to evolve as ANS production has declined since the early 1990s. Today, all ANS production is marketed on the U.S. West Coast or in Alaska. The structure of the West Coast market itself has undergone dramatic transformation over the past several years as refiners have merged and consolidated into fewer companies. And as ANS production has declined, West Coast refiners, that until recently benefited from a surplus of ANS production relative to refining demand, have had to import large quantities of foreign crude oil again. This recent change has brought a renewed emphasis on long-term relationships again at the expense of spot transactions. It also has brought about direct competition between ANS crude oil and foreign crude oils imported into the West Coast. Implications of Oil Royalty Experience for Gas Royalty Determination As these changing market environments illustrate, even the best-conceived royalty valuation formula can go astray over time unless it adapts to new conditions. This in fact has happened periodically during the past decade that the royalty settlement agreements have been in place. The agreements have been modified several times. Each of these was occasioned by a recognition that market conditions had changed substantially enough to change the nature of the bargain originally agreed to. This history of ANS oil royalties highlights both the need to maintain flexibility in the procedures and mechanisms used to value and pay gas and NGL royalties and, more importantly, the critical need for information sharing between producers and the State as to how ANS gas and NGL is moved to market and sold. As discussed in Chapter 3, producers of ANS gas and NGL face a number of difficult marketing and transportation choices with respect to gas and NGL. How they solve those in a way that maximizes their own value will no doubt require experimentation with various marketing and transport options. While ANS producers and the North American markets that they sell into adjust to the new volumes and settle into a balanced, consistent flow of gas and NGL to sales markets, information as to actual dispositions will be vital both to producers and to the State in understanding how ANS gas and NGL value can be maximized.
Econ One Research, Inc. 41

January 2002
Econ One Research, Inc. 42
January 2002
Chapter 6
Conclusions
This Report has provided an overview of gas and NGL markets in North America as they are structured and operate today, with observations as to how those markets can be expected to perform in years to come. In addition, we have described and analyzed market factors that are likely to determine the value of ANS gas and NGL when these begin to flow to North American markets within the next several years, and economic considerations relevant to structuring and applying royalty principles, methods, and procedures to best accommodate the State’s interests as lessor of that gas and NGL. This Chapter draws these findings together in summary form. Gas and NGL Markets in North America
1. North American gas markets have become flexible and responsive to supply and demand conditions, and are likely to remain so in years to come. Gas flows and prices respond to localized supply and demand conditions and pipeline capacity constraints or surpluses. Producers, marketers and end-users utilize the extensive pipeline network, along with storage facilities, market centers and financial instruments to consume and produce gas efficiently and to capture value when and where it arises.
2. Gas consumption in North America is expected to exceed 30 Tcf per year within the next 10 to 20 years. To accommodate that demand growth, producers not only must replace today’s depleting wells, they must find and develop new reserves. Alaska gas will be one of those new supply sources. Substantial infrastructure – pipelines, storage, hubs – must be built to move new-found reserves to markets.
3. Based upon historical trends, gas and NGL prices – always a hazard to forecast – are unlikely to rise substantially, except for periodic spikes at various times and at various locations in response to temporary conditions.
4. NGL markets in North America are not as commoditized as gas markets. There are fewer active trading points, and the transport network, less extensive than that for gas, does not for the most part operate as a displacement network. That reduces opportunities to exploit logistic and financial efficiencies that are present for gas.
5. NGL finished product prices are established at a handful of market centers. Upstream raw-mix prices are set by reference to market center prices, less deductions for transport and fractionation costs.
6. NGL finished product prices are buffeted by numerous and diverse influences including oil and gas prices, petrochemical demand, heating fuel demand, and oil refinery output. The family of NGL finished products – ethane, propane, butane, and others – are each subject to distinct market forces. Wellhead NGL is a mixture of these finished products and therefore its value is affected to some degree by each distinct factor in addition to locational factors, transportation costs and fractionation costs.
7. NGL markets are likely to operate in the future much as they do today – largely the domain of a comparatively small group of specialists. Raw-mix NGL prices will continue to be set by downstream product prices (published and available for select locations) less transportation and fractionation cost deductions (limited reliable public information).
Econ One Research, Inc. 43
January 2002
ANS Gas and NGL Value
1. Alaska gas most likely will enter the North American market at Alberta, Canada or at consuming markets downstream of Alberta. Alberta is a large “node” on the North American gas grid, but one which to date has been subject to periodic price fluctuations owing to imbalanced development of gas production and takeaway pipeline capacity.
2. Alaska wellhead gas value will be set by conditions in North American markets and by transport costs from the North Slope of Alaska to those markets. Even should in-state markets develop substantially, the bulk of produced volumes will flow to out-of-state markets.
3. Alaska NGL also is likely to enter North American NGL markets at Alberta, which is a major NGL trading center in North America.
4. Alaska gas and NGL are likely to be transported to Alberta in the same pipeline. While that may be the least cost method to move ANS gas and NGL, it complicates determination of transport costs for both gas and NGL. Transport cost is an important component in determining the wellhead value of both products.
5. The time horizon over which ANS gas and NGL will be produced is long – 50 years or more. It is not possible now to predict fully how North American gas and NGL markets will change over that time period, or to predict the evolving role of Alberta within the North American gas grid and in its role as a major NGL and petrochemical center. These will be the major factors to understand and factor into ongoing ANS value determination. Only time and experience can reveal the specific consumption markets to which ANS gas will flow downstream of Alberta.
ANS Gas and NGL Royalty
1. Efficient and workable royalty agreements should specify principles, methodologies and procedures to be used by lessor and lessee as they share production or revenues. In addition, there should be a well-understood and readily-identifiable mechanism that tells the parties when to modify existing methodologies or procedures (or change to entirely new ones) in order to remain faithful to their initial sharing principles.
2. The State’s experience with oil royalty provides a useful template for gas and NGL royalty. Lessons learned and expertise developed there can be applied to gas and NGL royalty. In particular, the basic approach taken for oil – to gather and analyze information as to actual proceeds, then construct value measures from that information – should serve the State and producers well for gas and NGL royalty.
3. Because the role of ANS gas in North American markets for the next 50 years cannot be predicted today, the parties should provide sufficient royalty flexibility to adapt methods and procedures as conditions warrant. Within that framework though, there is room for agreement now as to first principles of production and/or revenue sharing, but these should not be carried to the point of eliminating adaptability.
4. Information is a primary source of royalty problems, even for mature production at or near major markets. ANS gas, at least in the early years of its production, and probably for much longer than that, enjoys neither of those characteristics. Information sharing therefore takes on heightened importance for ANS gas and NGL royalty. This suggests that the State and producers may both be well served to put in place a mechanism at the
Econ One Research, Inc. 44
January 2002
outset of production for generating and sharing information that is above and beyond that which might be called for in mature areas.
5. The information so shared should relate to the actual sale of ANS gas and NGL as well as actual transport and processing costs incurred. Agreement should be reached as to measures of such revenues and costs that accurately track ANS gas and NGL flows and transactions from points of production to points of sale. The State should be allowed to utilize source documents and data in order to apply and test the effects of alternative revenue and cost allocations where commingling of gas makes such allocation necessary.
6. Information from such a mechanism will guide the State and producers in understanding
how ANS gas and NGL fits into North American markets. It is likely to take some time for market dynamics there to adjust fully to introduction of ANS gas and NGL. The heightened information sharing period should last until markets have digested ANS volumes and an adequate understanding is reached as to how and where ANS volumes are sold and priced.
7. When that level of understanding is achieved, it may be possible then to turn to mechanisms that utilize published market information and are less costly to implement, such as use of downstream market price indicators and market-based transport and processing cost indicators.
Econ One Research, Inc. 45

January 2002
Econ One Research, Inc. 46
January 2002
Selected Research and Bibliographic Resources
Law/Economics Articles and Books
"Business Practices and the Flexibility of Long-Term Contracts." Virginia Law Review, Vol. 36, No. 5 (1950), 627-653.
Macneil, Ian R. "Contracts: Adjustment of Long-Term Economic Relations Under Classical, Neoclassical,
and Relational Contract Law." Northwestern University Law Review, Vol. 72, No. 6 (1978), 854-905.
Stiglitz, Joseph E. "Principal and Agent." Palgrave's Dictionary of Political Economy. London: The
Macmillan Press, Ltd. (1998). Williamson, Oliver E. "Transaction-Cost Economics: The Governance of Contractual Relations." Journal
of Law and Economics, Vol. 22 (October, 1979), 233-261. Dixit, Avinash K. and R. Pindyck. Investment Under Uncertainty. Princeton: Princeton University Press.
(1994).
Gas Industry Books and Published Studies
Gas Industry Standards Board, Business Practice Standards: Standards Relating to Nominations, Flowing Gas, Invoicing, Electronic Delivery Mechanisms, Capacity Release, Contracts, and Interpretations. Version 1.3. (July 31, 1998).
"The Imperatives of Arctic Natural Gas Development." Longbottom, James and R. Oligney, University of
Houston. (November 2001). Gas Industry Standards Board, A Concise Guide to GISB. (1997). Bradley, Robert L., Jr. Oil, Gas & Government. Vol 1, 2. Lanham: Rowman & Littlefield Publishers, Inc,
(1996). Natural Gas Supply Association, Building America with Natural Gas. (October 2000). Canadian Gas Potential Committee. Natural Gas Potential in Canada, 2001: A Report by the Canadian
Gas Potential Committee. (2001). Natural Gas Division, Natural Resources Canada. Canadian Natural Gas Market Review & Outlook.
(May, 2001). American Petroleum Institute. Economic State of the U.S. Oil and Natural Gas Exploration and
Production Industry: Long-Term Trends and Recent Events. API Policy Analysis and Strategic Planning Department. (April, 1999).
Herbert, John. "The Relationship Between Natural Gas and Electricity Prices." Natural Gas Supply
Association. (May, 2001).
Econ One Research, Inc. 47
January 2002
MacAvoy, Paul W. The Natural Gas Market: Sixty Years of Regulation and Deregulation. New Haven:
Yale University Press. (2000). Wright, Arthur J., and C. Sharpe (editors). Natural Gas Contracting: Strategies for the New Marketplace.
Chicago: American Bar Association. (1998). Arthur Andersen and Cambridge Energy Research Associates, North American Natural Gas Trends, 2000
Edition. Interstate Natural Gas Association of America. Pipeline and Storage Infrastructure Requirements for a 30
Tcf U.S. Gas Market. (1999). Potential Gas Agency, Colorado School of Mines. Potential Supply of Natural Gas in the United States:
Report of the Potential Gas Committee. (March, 2001). American Gas Association. The Evolution of Underground Natural Gas Storage: Changes in Utilization
Patterns. (August, 2001). National Energy Marketers Association. Uniform Code of Conduct for Regulated and Unregulated
Suppliers of Energy and Related Services and Technologies. (April 1998).
Compilations of Data
American Gas Association. Gas Facts. Published annually. BP Statistical Review of US Energy. Published annually. Canadian Gas Association. Canadian Gas Facts. Published annually. U.S. Energy Information Administration. Petroleum Supply Annual, Natural Gas Annual. Baker Hughes, Inc. Worldwide Rig Count.
Government Federal Energy Regulatory Commission. “Regulation of Short-Term Natural Gas Transportation Services,
and Regulation of Interstate Natural Gas Transportation Services,” RM98-10 and RM98-12; Order No. 637. (February 9, 2000). 90 FERC 61,109
Federal Energy Regulatory Commission. “Regulation of Short-Term Natural Gas Transportation Services,
and Regulation of Interstate Natural Gas Transportation Services,” RM98-10 and RM98-12; Order No. 637-A. (May 19, 2000).
Massey, William L. "Federal Role in Evolving Energy Markets." Remarks at The McGraw-Hill Companies
2001 Symposium. Washington, D.C. (May 23, 2001). Massey, William L. "Regulatory Perspective on Fundamental Changes in the Energy Industry." Speech at
Fifth Annual Washington Energy Policy Conference. Washington, D.C. (April 6, 2000).
Econ One Research, Inc. 48
January 2002
Mark D. Myers. "Alaska's Natural Gas Potential." Alaska Department of Natural Resources, May 2001.
U.S. Energy Information Administration, Deliverability on the Interstate Natural Gas Pipeline System. (May
1998). U.S. Senate Committee on Energy and Natural Resources. “Alaska Natural Gas Transportation Act: Staff
Report of the Federal Energy Regulatory Committee." (January 18, 2001). U.S Energy Information Administration. U.S. Natural Gas Markets: Recent Trends and Prospects for the
Future. (May 2001). Breathitt, Linda K. "2010 - A 30 TCF Journey." Remarks at INGAA 56th Annual Meeting. San Antonio,
Texas. (October 16, 2000). Breathitt, Linda K. “Regulation for an Industry in Transition: Order No. 637 and Beyond." Speech to
NARUC Committee on Gas. (March 7, 2000). Breathitt, Linda K. “FERC Activities and Horizons” Sixth Gas Industry Standards Board Annual Meeting,
San Antonio, Texas. (September 25, 2000). Canadian National Energy Board. Annual Report to Parliament, 2000. Tobin, James. Natural Gas Transportation – Infrastructure Issues and Operational Issues. U.S. Energy
Information Administration/Natural Gas Division. (October 2001). U.S. Department of the Interior, Minerals Management Service. 1997 Royalty in Kind Feasibility Study.
(August 1997). U.S. Energy Information Administration. The Majors' Shift to Natural Gas. (September 2001). Federal Energy Regulatory Commission, The Governance of Energy Displacement Network Oligopolies.
Office of Economic Policy, Discussion Paper 96-08. (October 1996, Revised May 1997). Federal Energy Regulatory Commission, The Development of Market Centers and Electronic Trading in
Natural Gas Markets. Office of Economic Policy, Discussion Paper 99-01. (June, 1999).
Trade Press Natural Gas Week: Aboriginals, Gas Companies Align to Build Canadian Arctic Pipe, June 4, 2001. Gas Properties Attract Conoco in 35% Premium Gulf Canada Bid, June 4, 2001. E-Trading Growing, But Slowly, June 18, 2001. Industry, Government Disagree on Royalty Payment Systems, June 18, 2001. Gas Buyers Returning from Oil as Markets Forge a New Fusion, July 2, 2001. An Aboriginal Group Defection Muddies Gas Pipeline Project, July 9, 2001. Wood's Interconnection Ideas Please Merchants, July 23, 2001. Competing Pipeline Routes Involve Politics, July 30, 2001. Study Cites Infrastructure Needs, July 30, 2001. Price Tag High for Alaska Pipe; Chicago Extension Adds to Cost, August 13, 2001. AGA Under the Gun, August 27, 2001.
Econ One Research, Inc. 49
January 2002
Industry Reaps what it Sows in AGA Storage Pandemonium, August 27, 2001. Frontiers will be Supplemental to Western Canadian Gas Fields, September 17, 2001. Lost Gas Demand May Not Return but More Supplies Still Needed, September 17, 2001. Voice Brokering Not Going Away, But Online Trade Volume Growing, October 1, 2001. Wood Sets Out on Bold Agenda; FERC Pushing RTOs, Oversight, October 1, 2001. AGA to Discontinue Storage Report, October 15, 2001. Options For Alaskan Gas Narrow As Yukon LNG Project Scaled Back, October 15, 2001. New Foothills Group Readies Push for Revamped Alaskan Pipeline, November 19, 2001, p.17-18. Pendulum Swings on Alaskan Pipe with Combined Conoco Phillips, November 26, 2001. Enron's Business is Drying Up, But Molecules Continue to Flow, December 10, 2001. EOL May Be Surviving Enron Entity, December 10, 2001. More Gas Reserves Are Needed To Support Mackenzie Pipeline, December 17, 2001. Industry Should Be Better Off With EIA Doing Storage Survey, December 24, 2001. Foothills Eyes Scaled-Back Plan to Pipe Alaskan Gas to Lower 48, December 24, 2001. Gas Daily: Land access, pipe issues dominate conference, August 9, 2001. Conoco Supports Mackenzie Valley Pipe Route, August 15, 2001. Top players shift in latest marketer rankings, August 17, 2001. ICE to offer clearing for certain OTC trades, August 30, 2001. TradeSpark passes $100 billion milestone, September 4, 2001. Western Gas advances CBM production, September 5, 2001. Hearing looks at federal role in CBM production, September 7, 2001. For some, 30 Tcf not the magic number, September 11, 2001. Williams to invest $400M in deepwater Gulf, September 19, 2001. CMS Carves Out Niche in Powder River Basin, September 20, 2001. GISB votes to form energy standards group, September 21, 2001. FERCers praise standards plan, September 21, 2001. Wilston Basin plans pipe for Powder River, October 1, 2001. El Paso presses ahead with Blue Atlantic, October 3, 2001. Senate mulls action on Alaska pipeline, October 3, 2001. The Wall Street Journal: Canada Isn't Natural-Gas Panacea for U.S. November 6, 2001. Energy Markets Remain Untouched by Enron's Deepening Fiscal Crisis. November 28, 2001. Oil and Gas Journal: US gas-processing profitability statistics, May 21, 2001. Largest Lower-48 Gas Plant: Running Smoothly After 6 Months, July 2, 2001. Gas Processors Report: MOU Signed for 1,700-Mile Alaskan Gas Pipeline Project, November 26, 2001. Kinder to Buy the Northern Border GP Interest?, December 17, 2001. Oil Daily: Pipeline Firms to Push Alaskan Gas Link, November 16, 2001. The Economist: Into Deeper Water, December 8, 2001, p.16-18.
Econ One Research, Inc. 50
January 2002
Dow Jones Newswires: Alliance Pipeline Market Impact Muted But Not Silent, January 11, 2001. Alberta NGL Bottleneck Affecting Markets, August 29, 2001. Energy Companies Plan Alberta Gas Liquids Projects, August, 19, 1999. Petroleum News Alaska: Cambridge Energy Research Pesimistic About Alaska Gas, December 30, 2001.
Websites www.naturalgas.conoco.com -- Conoco Propane Marketing. www.aga.org -- American Gas Association. www.alberta-canada.com. Alberta's Chemical and Petrochemical Industry. www.altra.com. Altra Energy Technologies. www.atcomidstream.com. "ATCO Midstream Facilities." December 7, 2001. www.ccpa.ca -- Canadian Chemical Producers' Association, Overview of Canadian Chemical
Manufacturing Industry. www.ingaa.org -- Interstate Natural Gas Association of America. www.mapsearch.com -- PennWell MAPSearch. www.gisb.org -- Gas Industries Standards Board. www.energymarketers.com -- National Energy Marketers Association.
Econ One Research, Inc. 51

January 2002
.
Econ One Research, Inc. 52
www.econone.com