economic analysis and justification for automated welding …
TRANSCRIPT
Graded by: __________________ Date of Submission: _____________________ Checked by: _________________ Approved by: _________________________
ECONOMIC ANALYSIS AND JUSTIFICATION FOR AUTOMATED WELDING SYSTEMS
A Senior Project submitted
In Partial Fulfillment
of the Requirements for the Degree of
Bachelor of Science in Manufacturing Engineering
California Polytechnic State University,
San Luis Obispo
by
Roxanne Raye
June 2015

2
Abstract
Economic Analysis and Justification for Automated Welding Systems
Roxanne Raye
This report looks at designing a new welding process for a company in the Oil & Gas
industry, ensuring method consistency and performance quality of their steel drill bit while
increasing overall production. The current product is welded manually with a flux core wire,
resulting in high cycle times and numerous cases of required rework.
The use of automation systems will be analyzed for their increased consistency, quality,
safety, and production estimates. Specifically robotic cell design will be considered, since it can
work on more parts with fewer operators, adding efficiency and flexibility to the production
floor. Other areas of researched covered in this report include welding parameters and methods,
fixture use in relation to automation, preheating and material properties of steel, and investment
justification of automated systems.
The design will be modeled and simulated in a 3D environment, and analyzed with
economic considerations in the form of payback period and return on investment. All
calculations, given values and assumed values will be stated and explained. Results include an
estimated payback period of 2.14 years, a 34% ROI, and savings of $ 13,140.00 per year from
the robot alone, with capacity for additional savings analysis based on use of the design.
Recommendations to go forward with prototype testing on actual weld quality and
efficiency improvements as well as cell design finalization.

3
Table of Contents Abstract ........................................................................................................................................... 2
List of Tables .................................................................................................................................. 4
List of Figures ................................................................................................................................. 5
Introduction ..................................................................................................................................... 6
Background ..................................................................................................................................... 7
Literature Review............................................................................................................................ 8
Automation ................................................................................................................................. 8
Welding ....................................................................................................................................... 9
Fixtures and Future Trends ....................................................................................................... 12
Return On Investment ............................................................................................................... 13
Design ........................................................................................................................................... 16
Methods......................................................................................................................................... 19
Results & Discussion .................................................................................................................... 22
Conclusion .................................................................................................................................... 25
References ..................................................................................................................................... 26
Appendices .................................................................................................................................... 28
Appendix A ............................................................................................................................... 28
Appendix B ............................................................................................................................... 29
Appendix C ............................................................................................................................... 30
Appendix D ............................................................................................................................... 31

4
List of Tables
Table 1 Given Variables and Costs ............................................................................................... 17
Table 2 Assumed Variables and Costs .......................................................................................... 18
Table 3 Equations and Variables .................................................................................................. 21
Table 4 Calculated and Estimated Savings ................................................................................... 23
Table 5 Economic Calculations .................................................................................................... 24

5
List of Figures
Figure 1 Typical Weld Joint Variations ........................................................................................ 10
Figure 2 Induction Coil Shape Variations .................................................................................... 11
Figure 3 Robotic Weld Cell Model ............................................................................................... 19

6
Introduction
This report will describe the justification of using automated systems for welding by
comparing the manual and automated setups of a steel pipe welding operation. Automated
systems for welding processes, specifically those utilizing industrial robotics, are increasingly
common in manufacturing environments as they offer increased production, consistency, and
quality while decreasing labor costs, re-work, and human exposure to hazardous environments.
Industries experiencing major growth, such as the Oil & Gas industry in the United States, are
starting to utilize automation for simple or hazardous tasks; however it is important to analyze
the each operation individually to mesh production styles and successfully integrate an
automated system. This project aims to design an automated welding production cell and prove
its economic advantage over a manual set up.
The defined problem will assess the welding operation of a steel drill bit used by a large
company in the oil and gas industry, who need to ensure method consistency and performance
quality. To consider automation for this process, the following objectives must be completed:
• Analyze the current process and its associated costs.
• Consider welding techniques and fixtures for the material and quality requirements.
• Design an automation setup of the welding operation and analyze its associated costs.
These objectives will be achieved by implementing the engineering knowledge and skills
learned from research and the curricula for the Bachelor of Science in Manufacturing
Engineering provided by California Polytechnic State University in San Luis Obispo, CA. Tools
and knowledge that will be applied include: automation of industrial systems, material joining by
welding, engineering economics, and lean manufacturing.

7
Background
The Oil & Gas industry is one of the largest and most powerful industries in the world.
Fossil fuels, which include oil, coal, and natural gas, are refined into fuel to provide electricity,
heating, and transportation. In recent years, technological innovation in the form of horizontal
drilling and hydraulic fracturing has dramatically increased energy reserves in the United States.
Fracking involves water, sand, and chemical fluids being injected underground at pressure to
fracture the shale rock and release gas and oil. In 2006, 1 trillion cubic feet (tcf) of shale gas was
produced in the United States; by 2010 it had increased to 4.8 tcf with the increased use of
fracking (Dunn & McClelland, 2015). This rapid expansion of available resources has generated
growth in nearly all sectors of the Oil & Gas industry and in October 2013, the United States
domestic oil production exceeded crude oil imports for the first time since 1995 (Utech, 2013).
To keep up with this growth, companies are looking for ways to increase and streamline
production. This project looks at improving the manufacturing process for a steel bit used in
drilling for oil and gas, justifying the chosen method, and economically analyzing the process.
Currently the product is manually welded using flux-core arch welding (FCAW) and rotated in a
lathe chuck. The product use two different steel alloys for mechanical strength and must be
preheated with a gas torch to avoid cracks in the weld. The difficulty with flux core wire is that
each pass must be cleaned to remove slag build up, extending the time needed for the process
and increasing the possibility of defects if the steel temperature drops too low or slag build up is
missed. Automation is an ideal way to improve the process and involves changing the welding
parameters, preheating operation, and fixtures; however it also requires a significant financial
investment. The following literature review will look into key concepts related to developing and
justifying an automated process.

8
Literature Review
Automation
As defined by the International Organization for Standardization (ISO), specifically ISO
8373, an industrial robot is “an automatically controlled, reprogrammable, multipurpose
manipulator, programmable in three or more axes. The field of robotics may be more practically
defined as the study, design and use of robot systems for manufacturing” (ISO, 1994). Robot
systems can also include any devices required for the robot to perform tasks, or sensors for
sequencing and monitoring communication interfaces.
In 1954 George C. Devol revolutionized the industrial robotics world with his mechanical
arm, Unimate. It relied on digital control, magnetic drum memory, and solid-state control
components, making it the first digitally operated and programmable robot. A General Motors
plant in Trenton, New Jersey, was the first to install one of these robots in 1961, using it to assist
a hot die-casting machine (Malone, 2011). Modern day industrial robots are generally used to
perform unsafe, hazardous, highly repetitive tasks. They have a huge range of functions such as
material handling, assembly, arc welding, resistance welding, machine tool loading and
unloading, painting, and spraying; and are used in nearly every industry. Outside of
manufacturing plants, robots are used for anything from care of the disabled to space and deep
sea exploration. An important argument to consider is that robots do not have to directly remove
labor. Implemented correctly, workers of the old process would be assigned new tasks such as a
different process, quality inspection, supervision, support technician work, and similar changes.
Looking specifically at welding robots, automated welding systems have the potential to
increase productivity by increasing speed while decreasing scrap and rework rates, improve
visual and mechanical weld quality, reduce labor and materials costs, mitigate the welder

9
shortage, and increase a company's overall profitability (Summers & Stevens, 2008). The
potential downsides to the system include that shop-floor personnel must be able to provide the
robot with a consistent supply of material and work to perform. Since the efficiency of a robot
far exceeds that of a human worker, increased production may accumulate in another part of the
plant, shifting the bottleneck and not truly improving productivity.
When looking at automation options there are two basic types for welding systems:
robotic and fixed. Robotic systems are more expensive and more complicated than fixed
automation systems, but they can be reprogrammed to accommodate different product lines
which can prevent shifted bottlenecks. Fixed automation systems usually involve the welding
gun or the part is fixed in place, making it a single setup operation. A product that requires only
straight or curved welds along a single plane is usually a good candidate for a fixed automation
system, while complicated and multiple path welds are best under a robotic system.
Welding
The use of welding robots has become a common means of industrial automation for
manufacturers of steel products. Shown alongside other operations in Appendix A, manual
welding operations have an efficiency of roughly 20-30% while an automated welding process
has an efficiency of 90% or higher. The increase comes from more control and consistency in the
wire feed rate, pulse waveform, and arc stability combined with robotic movement within a
single tightly integrated system (Groover, 2007). Other parameters of the arc process include:
peak current, base current, arc voltage, pulse mode, and pulse frequency ("Automated MIG
Welding of Aluminum," 2004). Some of these parameters are set within the welding equipment
while others are dependent on the welder’s skill and repeatability. Typical weld joint variations
can be seen in Figure 1 below (Kou, 2003).

10
Figure 1 Typical Weld Joint Variations
There are three major types of fusion welding processes are as follows: gas welding, arc
welding, and high-energy beam welding. Gas–metal arc welding (GMAW) is the most widely
used arc welding process, especially for aluminum alloys, and uses an electric arc established
between a continuously fed filler wire electrode, and the metal work piece. Shielding the arc and
the molten weld pool is often done with inert gases such as argon and helium. Flux-core arc
welding (FCAW) is similar to GMAW, but the electrode is a metal tube with flux wrapped
inside. The functions of the flux include protecting the molten metal from air and allow the use
of additional shielding gas to be optional. The downside is the molten flux floats to the weld pool
surface and solidifies into a slag layer which must be cleaned off (Kou, 2003). Comparatively
GMAW is a more economic process because it has higher speeds, higher deposition rates, few to
zero stops to change electrodes, and needs minimal post weld cleaning. The electrode wire is fed
automatically and a self-adjustment mechanism maintains the arc length. These advantages make
the process very well suited to being automated, particularly to robotic welding systems (Pires,
Loureiro, & Bölmsjo, 2006).

11
When considering weld quality outside of weld parameters, cracking from improper
temperature levels and potential warping from the heat affected zone (HAZ) are mainly material
dependent. High carbon steel, for example, has a tendency to form martensite (a hard crystalline
structure) in the HAZ and therefore create hydrogen cracking. A hydrogen crack occurs when a
hard microstructure (in this case martensite) cools too quickly from around 800°C to 500°C.
Cooling can be slowed down by applying preheat, maintaining a high weld inter-pass
temperature, increasing welding power and reducing travel speed (Economic Commission for
Europe, 2001). In order to determine what preheating level is needed for a given carbon content,
the following equation is used (Yurioka & Kasuya, 1995):
CE(IIW) = C + Mn/6 + (Cu + Ni)/15 + (Cr + Mo + V)/5 [wt%]
Preheating is commonly done by a gas flame, usually a hand torch or furnace. Open flames
however, have a very inefficient energy use to heat input ratio. A more efficient option is
electromagnetic induction, or simple “induction,” which is a method of heating electrically
conductive materials. Considering the diagram in Appendix B, induction uses alternating
electrical currents to internally move though the material to be heated (Zinn & Semiatin, 1988).
Figure 2 Induction Coil Shape Variations

12
The coils can be bent and turned into a variety of shapes as seen in Figure 2, as long as the metal
being heated is between them. This offers a new flexibility to heating specific zones of a material
for various operations.
Fixtures and Future Trends
The use of fixtures is very important when working with automation and robotics; the
program will run to the exact same location every time therefore it is important for the part and
work piece to also be in the exact same place each time. In short a fixture provides proper
position and rigidity of work piece for ease and safety of operation. There are three main
structural components in a fixture: a locator, clamp and support. A locator is generally an
immobile unit, such as a pin or surface, which constrains freedom of movement. Clamps
constitute the mobile part of fixture and apply forces to grab the work piece. Support is mostly
stable, holding and facilitating the work piece to maintain its geometry under thermal stresses
(Vural, Muzafferiglu, & Tapici, 2007). A well designed fixture will reduce the amount of
distortions by accounting for welding forces, thermal expansions, and position consistency. As
part of position consistency, the fixture should account for movements of the work piece, such as
rotations on any axis, so that the entire operation can be performed in with ideally a single set up.
One of the most time consuming components of creating a robotic welding system is
programming each new weld that needs to be performed and determining how that plays into
external features such as preheating operations and fixture choice. Recently, research studies
have focused on the increased use of sophisticated 3D CAD/CAM systems and combining them
with robot simulation systems. One such method is case-based reasoning (CBR); a memory
based system that reflects how humans remember old problems and solutions and use them as a

13
starting point for solving a new problem. Aamodt and Plaza’s classic model of the problem
solving cycle in CBR had four main modules (Wang & Rong, 2008):
• Retrieve: Given a target problem, retrieve relevant cases from memory to solve it. A case
consists of a problem, its solution, and annotations about how the solution was derived.
• Reuse: Compare the solution from the previous case to the target problem and adapt the
solution as needed to fit the new situation.
• Revise: Test the new solution in the real world (or a simulation) and, if necessary, revise.
• Retain: Store the resulting experience as a new case in memory.
Using a system such as CBR would allow companies to generate welding parameters, cell set
ups, and fixture choices for new products based on ones they, or others, have previously devised
and found successful. By increasing the number of products a robotic system can work on,
production can increase across operations, instead of in just one area, creating a more flexible
and economically beneficial system.
Return On Investment A major part of justifying an automated system, or any new process, is the calculation of
the potential economic benefits. The two main measures of how well a system will benefit a
company are the payback period and the return on investment percentage (ROI). The payback
period is a measure of time, usually month or years, for how long it will take for the system to
generate enough savings to overcome the investment costs. Factors that go into the calculation
include: direct wages saved by removing labor, savings from robot such as scrap or energy use,
depreciation of value, new maintenance costs, and new staff and supplies costs. For welding
operations specifically, payback starts with determining the current product cycle times and
comparing those values to the cycle times an automated system can achieve. Since automated

14
systems can produce parts in roughly a quarter of the time manual welding can, lost time costs
are greatly reduced. Approximately 70% of a welding operation's costs are for labor since
manual work includes weld time, rework, injury compensation, slower cycle times, and more
material waste (Summers & Stevens, 2008).
Payback period is just one measure of ROI, a full ROI consideration takes into account
the lifespan of the system, inflation and deflation rates, future value of money and more. A
positive ROI shows that the investment generates successful gains over the costs. Factors such as
reduced labor, inventory, and operating cost are generally easy to calculate and consider, but
more complex considerations that are harder to measure, such as capabilities return on
investment (CROI) and total cost of ownership (TCO), are equally important to a company
(Beretta, 2015). CROI looks at the economic value of being innovative, that is are there
opportunities in marketing, award recognition, or employee inspiration that could also benefit the
company. TCO looks in depth at accounting for all direct and indirect costs, including possible
ecological and social costs that might be associated with implementing the system. These risks
and more are just as important to consider as direct investment costs. One example is to consider
the constant increase of labor costs alongside the decreased cost of technology over time. A
graph representing these trends in relation to robot prices can be seen in Appendix C.
Ron Potter of Factory Automation Systems in Atlanta, Georgia, explains “Justification
should be a strategic decision made by informed management that balances short-term goals of
survival with longer-term goals of growth, to posture the company to have competitive
advantage. It should not be relegated to an accounting function without foresight of long-term
strategy” (Beretta, 2015). Looking purely at the “headcount” of labor reduction an automated
system will reduce will fail most project proposals, there needs to be a more positive attributes

15
that can be applied. Employee mentality and acceptance is another risk that is hard to measure,
but the culture and atmosphere of a work environment is extremely important for a prosperous
company.

16
Design
For this design, the company has asked that the new welding process for their steel drill
product ensures method consistency and performance quality while increasing production. There
are multiple ways to consider and potentially improve the process, such as applying lean
principles to worker operations, however to increase production by a significant amount, the
process as a whole will need to be adjusted. For this design, the mechanical weld properties will
be looked at as well as the option of automation, as a method for increasing production.
To better understand what changes need to be made, the following is an outline of the
current set up. The product being analyzed consists of two different steel alloy pipes, 4140 and
8620, which are screwed together and have a diameter of about 8 inches, but changes depending
on the various product models. The part is loaded into a lathe chuck and able to support its own
weight without additional fixtures. It is slowly rotated while the operator preheats the weld
groove with a gas flame torch. Once heated to 500oF (260oC), the rotation is slowed and
continued manually by the operator, who welds the V groove where the two steels meet with a
flux core wire for four passes. Between each pass, the slag must be cleaned from the weld and
the part reheated to temperature before the next pass can begin. The overall cycle time is 50
minutes, and any rework that needs to happen due to quality issues, takes the welder 1 hour.
Additional variables and costs provided by the company can be seen in Table 1 below, these
include the available work hours, current production, worker pay rates, and estimated training
costs associated with moving to an automated robotic system.

17
Table 1 Given Variables and Costs
Given Variables
Given Costs Shift length 8 hours Operator $ 34.00 /hour
Days worked 5 /week Robot Work $ 0.40 /hour
Weeks worked 50 /year Maintenance staff $ 40.00 /hour
Available hours 4000 Current Staff Training $ 5,000.00 one time
Current cycle time 0.83 hours Continued Education $ 2,000.00 yearly
Current Production 4100 units/year Maintenance Training $ 2,500.00 one time
Target Payback 2 years Robot life 8 years
Any design generated is required to overcome the costs given as well as any costs
associated with that new design. Beyond the investment cost of the physical system,
implementing an automation process requires initial and continued staff training, as well as
hiring new staff specialized in that field. To avoid some of these costs, one initial design idea
was to simply have the welding operator use a non-flux wire to remove the need for cleaning
between passes and increase the overall cycle time. While it increases efficiency, this method
does not meet the requirements of consistent method and performance quality due to the natural
variation of a human operator. Even at a highly skilled level, each weld will be unique in
position, speed, and angle which could lead to quality issues and is hard to troubleshoot. The
only way to truly ensure method and quality would be to automate the system.
When considering automation, fixed and robotic systems are the two main options. Since
the operation is fairly simple (the weld torch stays in same position for nearly the entire weld), a
fixed option seems ideal. While it certainly would ensure method and quality, the production
levels would only increase for that one operation. With the increased speed of production, any
automated system used will be left with time to spare in the work day and to run it all day would

18
risk an inventory backlog. To meet this new dilemma, a flexible system is more appropriate and
would allow multiple products to be worked on throughout the day. Only a robotic system, with
a multi-axis design, can offer a heightened level of flexibility and will be the system looked at
for this design.
With the automation choice determined, the next design steps need to look at the process
layout and details. Design options will be modeled in simulation software called WeldPro,
provided by FANUC Robotics alongside Lincoln Electric welding. Where possible, pre-built or
off the shelf parts will be used. This decision is justified by the fact that a fully custom set up is
much more expensive on a monetary level, increases the time frame to implement the system,
and requires additional testing before operations can being. The same rules govern the new
fixture design and preheating methods needed to assist the new system. The ideal layout will
follow lean principles, by not wasting space or movement, and will allow for quick set up
changes to match the flexible capabilities of the robotic welder.
Assumed variables and costs based off previously given variables and costs, general
company information, and industry accepted estimates can be seen below in Table 2. The values
take into consideration both manual and robotic processes.
Table 2 Assumed Variables and Costs
Assumed Variables Assumed Costs
Operators 2 /shift Robot System Cost $ 250,000
Shifts 2 /day Robot Upkeep $ 500 yearly
Manual Efficiency 0.3 Daily Labor Cost $ 1,088
Robot Efficiency 0.95 Annual Labor Cost $ 272,000
Time decrease 1400 hours Daily Robot Cost $ 6.40
Manual Scrap Rate 0.05 /hour = $6,800.00 /year Annual Robot Cost $ 2,100
Robot Scrap Rate 0.01 /hour = $1,360.00 /year

19
Methods
Taking into consideration all areas of research and the design considerations, the
following cell layout and process for the welding operation was developed. Below, Figure 2
shows the modeled setup, a larger version can be viewed in Appendix D. The design uses a six
axis FANUC robot with Lincoln Electric welding capabilities. Wire type, welding method, and
torch shape are interchangeable within the system through programming and accessories. For
this simulated setup, a standard MIG operation using non-flux, solid wire will be used. The
robotic arm has a large movement envelop allowing it to reach forward to weld the parts as well
as retract far enough to avoid collisions.
Figure 3 Robotic Weld Cell Model
Each work piece will be mounted to one of four individual positioners, all connected to a
turntable with a divider allowing different sections for work and preparation to be possible. The
positioners will be equipped with a base plate for mounting various fixture types; for this design
and operation, the fixture plate would feature a three jaw lathe chuck. The overall cell could be
operated by one worker trained to inspect weld quality and understand basic robot operations,

20
and preheating would be performed by induction coils instead of a gas flame; moved in and out
of position automatically in relation to the robot and turntable.
In the above design, the table has two sides: one for two parts to be welded by the robot,
and the other for two parts to be prepared and loaded before the operation, and cleaned and
unloaded after the operation. This set up allows for work value to constantly be added to the
parts, there is little waiting time where the robot or operator is not able to do anything. A
potential improvement to this design would be to have the divider separate the four positioners
individually, since the robot and human operator can each only work on one part at a time. An
individual division would create four stages: loading and unloading, preheating, weld operation,
and post heat or cool down time. Both possible set ups present more efficiency than a manual
operation and the turntable utilizes the available space well. Prototype testing would be needed
to fully examine the success rates of each set up.
Other considerations of the above design include that the cell could be run by a single
operator who could inspect and clean the welds once the robot has finished. This job would be an
easy transition for the current welding operator and a suitable match in terms of skill and ability.
Additional training would be needed for the operator to understand potential problems the robot
could run into and how to solve them. A separate robot and automated system maintenance
employee would also need to be added. This worker would not be needed full time however and
can be used in other areas of the company.
To analyze the potential success of the new system, general calculations will be used to
find the payback period and ROI percentage. Variables and equations were generated within
Microsoft Excel to allow for quick adjustments as assumed values become more accurate. Table
3 below shows the general equations and associated variables used in the calculations.
21
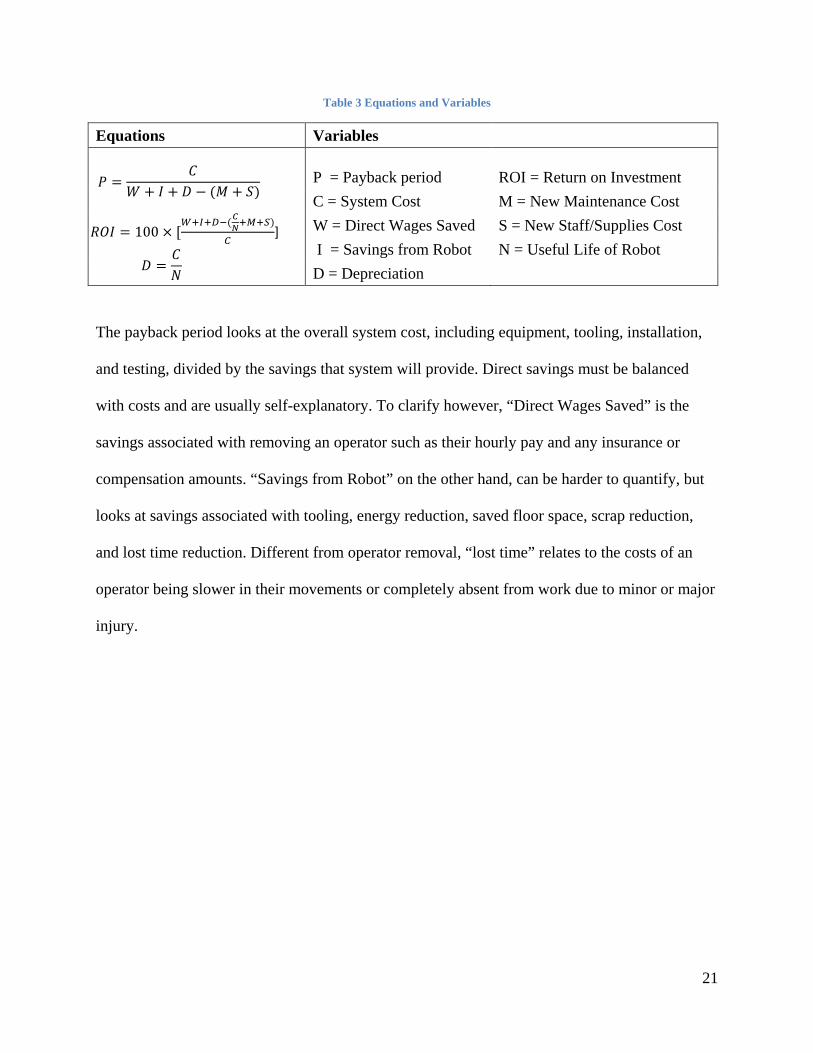
Table 3 Equations and Variables
Equations Variables
P = Payback period ROI = Return on Investment
C = System Cost M = New Maintenance Cost
W = Direct Wages Saved S = New Staff/Supplies Cost
I = Savings from Robot N = Useful Life of Robot
D = Depreciation
The payback period looks at the overall system cost, including equipment, tooling, installation,
and testing, divided by the savings that system will provide. Direct savings must be balanced
with costs and are usually self-explanatory. To clarify however, “Direct Wages Saved” is the
savings associated with removing an operator such as their hourly pay and any insurance or
compensation amounts. “Savings from Robot” on the other hand, can be harder to quantify, but
looks at savings associated with tooling, energy reduction, saved floor space, scrap reduction,
and lost time reduction. Different from operator removal, “lost time” relates to the costs of an
operator being slower in their movements or completely absent from work due to minor or major
injury.
𝑃 =𝐶
𝑊 + 𝐼 + 𝐷 − (𝑀 + 𝑆)
𝑅𝑅𝐼 = 100 × [𝑊+𝐼+𝐷−(𝐶𝑁+𝑀+𝑆)
𝐶]
𝐷 =𝐶𝑁
22
Results & Discussion
Going back to problem defined by the company, the results of the simulated design will
be tested against their need for ensured method consistency, performance quality, and increased
production in relation to the welding operation of their steel drill bit. All three of these areas are
improved upon by the use of an automated, robotic system.
Automation ensures a consistent process through programming, identifying specific
parameters for the welding material feed, travel speed, and weld angle. Consistent parameters
make it easy to troubleshoot quality issues since changes can easily be seen in reaction to
updates. The efficient movement and maintained parameters will also reduce variability in each
weld pass. Including increased speed and deposition rates associated with solid wire welding,
switching the weld wire decreases cycle time removing the cleaning time usually associated with
flux core wire and the re-heating needed when the part cools during the cleaning. Without these
delays, the four weld passes can be performed in a single continuous movement.
With use of the rotating platform, parts can be heated directly before welding with little
to no down time in-between. While more than four work pieces could potentially be loaded onto
the design, this design allows for quick inspection of each finished product and can identify
potential quality problems before they affect multiple parts. In conjunction with the turntable,
induction coils would be used for preheating, providing a more effective heating system than a
gas flame. Electrical heat uses less energy resources and applies heat to the work area with less
diffusion than open flames. Additionally, induction increases safety with the removal of open
flame exposure to the operator and environment, and the electrical current only effects
electrically conductive materials inside the coils.

23
In terms of fixtures, due to the variety of diameter sizes in the product and the need for it
to rotate to access the weld grooves, the current use of a lathe chuck works well. Modifying the
classic three jaw chuck to fit a mountable plate that can be bolted individually to the four
positioners would allow for easy use and flexibility. With a mountable plate setup, different
fixtures can be installed for different products, adding to the system flexibility and increased
production capability value for the company as a whole. As mentioned previously, this is an
important aspect when considering the long term growth and strategy of the company. Simply
increasing production in one area will create problems with inventory back log and not using the
robot to its full work potential is a waste of time and lost value added.
Moving forward to calculation analysis, Table 3 shows the calculated and estimated
savings gained by using a robotic system. The values for safety, lost time, and tool savings are
harder to measure and estimate from outside of industry, and the present values are general
estimates based on the company size, difficulty of work, process operation, and current
production rate. The “Removed Labor Savings” estimate is based off the removal of one welder
per shift and the addition of one robot maintenance worker. It is important to note that the
removal of the welder should be considered in the frame of the operation under scrutiny and if
possible, the employee should be relocated to another area of the company where their skills can
be utilized appropriately.
Table 4 Calculated and Estimated Savings
Savings
Removed Laborer Savings $ 80,000.00 /year
Scrap Savings $ 5,440.00 /year
Safety $ 2,700.00
Lost time $ 3,000.00
Tool Savings $ 2,000.00

24
Applying the above savings to the previously established equations, the below economic
calculations in Table 4 were generated. The results show a payback period of 2.14 years and a
ROI of 34%. For a system of this large of a capital investment, a period of 2 to 4 years for the
payback is expected and accepted as good option for the company to move forward with.
Similarly a positive ROI shows that the system will generate value over its lifespan that exceeds
its investments by 34%. Considering that these savings only analyze the direct use of the
automated system in the single operation and not the added capabilities to work with multiple
operations, an automated robotic welding system would be an excellent choice of process
improvement for the company to follow through with. Were the system to be used full time on
the defined operation, production would increase from 4,100 units per year to just over 11,700
units per year.
Table 5 Economic Calculations
Variable Unit Values Calculations
P = Payback period Years
2.14
C = System Cost $ $250,000.00
W = Direct Wages Saved $/year $ 80,000.00
I = Savings from Robot $/year $ 13,140.00
D = Depreciation $/year
$ 31,250.00
M = New Maintenance Cost $ $ 2,500.00
S = New Staff/Supplies Cost $ $ 5,000.00
N = Useful Life of Robot Years 8
ROI = Return on Investment %
34%

25
Conclusion
This report focused on the economic analysis and justification of design for a simulated
layout of an automated robotic welding process. As presented, the numerous benefits of
switching to a robotic system from a manual one are worth a long term investment by the
company. These benefits include increased weld efficiency and consistency which lead to higher
quality, reduced rework, and overall production increase, as well as reduced employee exposure
to hazardous environments.
Estimated savings, calculated from given and assumed values, resulted in a payback
period of 2.14 years and an ROI of 34%. Both of these values fall well within the accepted range
of the company and it is highly recommended that they move forward with moving to an
automated process for this product’s welding operation. To fully analyze the potential benefits of
the system and prepare it for industry implementation, a testable prototype would need to be set
up and analyzed for actual efficiency and production values. Further research and testing on
induction coils would also be valuable, especially when integrating with the robotic arm and
turntable positioners described in the suggested design.
In the event that another analysis of this type should be performed, it is highly
recommended that the operation being analyzed is studied in person and with close and open
communication between the researcher and company representatives. This would allow for more
accurate data variables and for more thorough economic analysis.

26
References
"Automated MIG Welding Of Aluminum." Welding Design & Fabrication 77.2 (2004): 22-26.
Business Source Premier. Web. 2 Feb. 2015.
Beretta, Jim. "ROI Automation Systems." Market Trends Webinar Series. Robotics Industries
Association. 5 Mar. 2015. Lecture.
Dunn, David Hastings, and Mark J. L. McClelland. "Shale Gas And The Revival Of American
Power: Debunking Decline?" International Affairs 89.6 (2013): 1411-1428. Academic
Search Premier. Web. 9 Feb. 2015.
Economic Commission for Europe. World Robotics 2001: Statistics, Market Analysis, Forecasts,
Case Studies and Profitability of Robot Investment. New York: United Nations, 2001.
Print.
Groover, Mikell P. Automation, Production Systems, and Computer-Integrated Manufacturing.
Prentice Hall Press, 2007.
"ISO Standard 8373:1994, Manipulating Industrial Robots." International Organization for
Standardization. N.p., n.d. Web. <http://www.iso.org/>.
Kou, Sindo. Welding Metallurgy. John Wiley & Sons, 2003.
Malone , Bob. "George Devol: A Life Devoted to Invention, and Robots." IEEE Spectrum. N.p.,
n.d. Web. <http://spectrum.ieee.org/automaton/robotics/industrial-robots/george-devol-a-
life-devoted-to-invention-and-robots>.
Pires, J. Norberto, Altino Loureiro, and Gunnar Bölmsjo. Welding robots: technology, system
issues and application. Springer Science & Business Media, 2006.
Summers, Kevin, and Randy Stevens. "Automating WELDING OPERATIONS." Manufacturing
Engineering 141.6 (2008): 87,88,90-92,94. ProQuest. Web. 2 Feb. 2015.

27
Utech, Dan. "Driving Toward Greater Energy Security." The White House. The White House, 13
Nov. 2013. Web. 27 Feb. 2015. <http://www.whitehouse.gov/blog/2013/11/13/driving-
toward-greater-energy-security>
Vural, M., H.F. Muzafferoglu, and U.C. Tapici. "The Effect of Welding Fixtures on Welding
Distortions." Journal of Achievements in Materials and Manufacturing Engineering 20.1-
2 (2007): 511-14. Web. 5 May 2015.
Wang, Hui, and Yiming (Kevin) Rong. "Case Based Reasoning Method for Computer Aided
Welding Fixture Design." Computer-Aided Design 40.12 (2008): 1121-132. Print.
Yurioka, N. and T. Kasuya: "A chart method to determine necessary preheat in steel welding"
Welding in the World, vol. 35 (1995), p. 327-334
Zinn, S., and S.L. Semiatin. Elements of Induction Heating: Design Control and Applications.
ASM International, 1988. Print.

28
Appendices
Appendix A
Robot Industry Association, 2013

29
Appendix B
Zinn & Semiatin, 1988

30
Appendix C
Economic Commission for Europe, 2001
Labor Costs
Robot Prices
0
20
40
60
80
100
120
140
160
180
200
2000 2001 2002 2003 2004 2005 2006 2007 2008 2009 2010 2011 2012 2013 2014 2015
Index of average robot prices in the US and index of labor compensation in the US business
sector
Inde
x 20
00 =
100

31
Appendix D