economic analysis of air pollution regulations
TRANSCRIPT

Economic Analysis of Air Pollution Regulations: Miscellaneous Organic NESHAP for Coatings (MON-Coatings)

EPA-452/R-03-022 August 2003
Economic Analysis of Air Pollution Regulations: Miscellaneous Organic NESHAP for Coatings (MON-Coatings)
By: Katherine B. Heller Brooks M. Depro
Laurel Clayton RTI International*
Research Triangle Park, NC 27709
Prepared for: John L. Sorrels
U.S. Environmental Protection Agency Office of Air Quality Planning and Standards
Innovative Strategies and Economics Group (ISEG), (C339-01) Research Triangle Park, NC 27711
Contract No. 68-D-99-024
*RTI International is a trade name of Research Triangle Institute.

CONTENTS Section Page
1 Introduction . . . . . . . . . . . . . . . . . . . . . . . . . . . . . . . . . . . . . . . . . . . . . . . . . . 1-1 1.1 Agency Requirements for an EIA . . . . . . . . . . . . . . . . . . . . . . . . . . . . 1-1 1.2 Summary of EIA Results . . . . . . . . . . . . . . . . . . . . . . . . . . . . . . . . . . 1-1 1.3 Organization of this Report . . . . . . . . . . . . . . . . . . . . . . . . . . . . . . . . . 1-2
2 Industry Profile . . . . . . . . . . . . . . . . . . . . . . . . . . . . . . . . . . . . . . . . . . . . . . . 2-1
2.1 Paints and Allied Products . . . . . . . . . . . . . . . . . . . . . . . . . . . . . . . . . 2-1 2.1.1 Supply Side of the Industry . . . . . . . . . . . . . . . . . . . . . . . . . . . 2-2
2.1.1.1 Production Processes . . . . . . . . . . . . . . . . . . . . . . . . 2-2 2.1.1.2 Types of Output . . . . . . . . . . . . . . . . . . . . . . . . . . . . 2-3 2.1.1.3 Costs of Production . . . . . . . . . . . . . . . . . . . . . . . . . 2-3 2.1.1.4 Capacity Utilization . . . . . . . . . . . . . . . . . . . . . . . . . 2-4
2.1.2 Demand Side of the Industry . . . . . . . . . . . . . . . . . . . . . . . . . . 2-4 2.1.3 Organization of the Industry . . . . . . . . . . . . . . . . . . . . . . . . . . 2-4
2.1.3.1 Firm Characteristics . . . . . . . . . . . . . . . . . . . . . . . . . 2-4 2.1.3.2 Geographical Distribution . . . . . . . . . . . . . . . . . . . . . 2-5
2.1.4 Markets and Trends . . . . . . . . . . . . . . . . . . . . . . . . . . . . . . . . 2-5
2.2 Industry Organization . . . . . . . . . . . . . . . . . . . . . . . . . . . . . . . . . . . . . 2-5 2.2.1 Production Facilities . . . . . . . . . . . . . . . . . . . . . . . . . . . . . . . . 2-5 2.2.2 Quantities of MON Coatings Produced . . . . . . . . . . . . . . . . . . 2-6
3 Engineering Cost and Emission Reduction Estimates . . . . . . . . . . . . . . . . . . . 3-1
3.1 Control Costs . . . . . . . . . . . . . . . . . . . . . . . . . . . . . . . . . . . . . . . . . . . 3-1
3.2 National Emissions Reductions and Compliance Costs . . . . . . . . . . . . 3-1
4 Economic Impact Analysis: Methods and Results . . . . . . . . . . . . . . . . . . . . . 4-1
4.1 Conceptual Approach . . . . . . . . . . . . . . . . . . . . . . . . . . . . . . . . . . . . . 4-1
iii

4.2 Operational Model . . . . . . . . . . . . . . . . . . . . . . . . . . . . . . . . . . . . . . . 4-3 4.2.1 Market Supply . . . . . . . . . . . . . . . . . . . . . . . . . . . . . . . . . . . . 4-3 4.2.2 Market Demand . . . . . . . . . . . . . . . . . . . . . . . . . . . . . . . . . . . 4-3 4.2.3 Control Cost Inputs and With-Regulation Equilibrium . . . . . . . 4-3
4.3 Market Model Results . . . . . . . . . . . . . . . . . . . . . . . . . . . . . . . . . . . . 4-4 4.3.1 Market-Level Impacts . . . . . . . . . . . . . . . . . . . . . . . . . . . . . . . 4-4 4.3.2 Industry-Level Impacts . . . . . . . . . . . . . . . . . . . . . . . . . . . . . . 4-5
4.4 Additional Firm-Level Analysis . . . . . . . . . . . . . . . . . . . . . . . . . . . . . . 4-5
4.5 Social Costs . . . . . . . . . . . . . . . . . . . . . . . . . . . . . . . . . . . . . . . . . . . . 4-6 4.5.1 Engineering Compliance Costs . . . . . . . . . . . . . . . . . . . . . . . . 4-6 4.5.2 Estimated Social Cost . . . . . . . . . . . . . . . . . . . . . . . . . . . . . . . 4-6
5 Small Business Impact Analysis . . . . . . . . . . . . . . . . . . . . . . . . . . . . . . . . . . . 5-1
5.1 Identifying Small Businesses . . . . . . . . . . . . . . . . . . . . . . . . . . . . . . . . 5-2
5.2 Screening-Level Analysis . . . . . . . . . . . . . . . . . . . . . . . . . . . . . . . . . . 5-2 5.2.1 Effects of the Regulation of Coatings Manufacturers . . . . . . . . 5-2
5.3 Summary Assessment . . . . . . . . . . . . . . . . . . . . . . . . . . . . . . . . . . . . . 5-6
References . . . . . . . . . . . . . . . . . . . . . . . . . . . . . . . . . . . . . . . . . . . . . . . . . . . . . . . . . R-1
Appendices
A MON Economic Model . . . . . . . . . . . . . . . . . . . . . . . . . . . . . . . . . . . . . . . . . A-1
B Sensitivity Analysis of Assumed Elasticities of Demand and Supply . . . . . . . . B-1
C Small Business Screening Sensitivity Analysis . . . . . . . . . . . . . . . . . . . . . . . . C-1
D Industry Profile of Affected SIC Codes . . . . . . . . . . . . . . . . . . . . . . . . . . . . . D-1
iv

LIST OF FIGURES
Number Page
5-1 Distribution of Cost-to-Sales Ratios for Companies owning MON Coating Facilities . . . . . . . . . . . . . . . . . . . . . . . . . . . . . . . . . . . . . . . . . . . . . . . . . . . . . 5-4
5-2 Distribution of Profit Margins for Companies owning MON Coating Facilities . . . . . . . . . . . . . . . . . . . . . . . . . . . . . . . . . . . . . . . . . . . . . . . . . . . . . 5-7
v

LIST OF TABLES
Number Page
2-1 Industry Group Profiled and Related SIC and NAICS Codes . . . . . . . . . . . . . 2-1 2-2 Number of Facilities in SIC 2851 by State . . . . . . . . . . . . . . . . . . . . . . . . . . . 2-6 2-3 Number of Facilities by SIC Code by Industry Segment . . . . . . . . . . . . . . . . . 2-7
3-1 Estimated Baseline HAP Emissions, Emission Reductions, and Cost of Compliance for Facilities Affected by the MON Coatings Rule ($1998) . . . . . . . . . . . . . . . . . . . . . . . . . . . . . . . . . . . . . . . . . . . . . . . . . . . . . 3-2
4-1 Estimated Baseline Quantities and Price for the MON Markets: 1998 . . . . . . 4-5 4-2 U.S. Industry-Level Impacts (106 1998 $/yr) . . . . . . . . . . . . . . . . . . . . . . . . . 4-5 4-3 Distribution of the Social Costs (106 1998 $/yr) . . . . . . . . . . . . . . . . . . . . . . . 4-7
5-1 Total Annual Costs for Complying with MON: February 1999 . . . . . . . . . . . 5-2 5-2 Summary Statistics for SBREFA Screening Analysis:
MON—Regulation of Coating Facilities: 1998 . . . . . . . . . . . . . . . . . . . . . . . 5-3 5-3 Profit Margins With and Without Regulation of Coatings
Manufacturers . . . . . . . . . . . . . . . . . . . . . . . . . . . . . . . . . . . . . . . . . . . . . . . . 5-6
vi

SECTION 1
INTRODUCTION
The U.S. Environmental Protection Agency (EPA) is developing a maximum achievable control technology (MACT) standard to reduce hazardous air pollutants (HAPs) from the miscellaneous organic coatings (MON coatings) manufacturing source category. EPA estimates that 127 facilities produce MON coatings.
To support EPA’s development of the MACT standards, hereafter referred to as the Miscellaneous Organic Coatings NESHAP or MON Coatings, EPA’s Innovative Strategies and Economic Group (ISEG) has conducted an economic impact analysis (EIA) to assess the potential costs of the rule. This report documents the methods and results of this EIA.
1.1 Agency Requirements for an EIA
Congress and the Executive Office have imposed statutory and administrative requirements for conducting economic analyses to accompany regulatory actions.1 In the case of the MON Coatings NESHAP, these requirements are fulfilled by examining the effect of the regulatory alternatives on the following:
• market-level impacts,
• industry-level impacts, and
• societal-level impacts.
1.2 Summary of EIA Results
The MON rule will impose small increases in production costs and therefore generate small economic impacts in the form of small increases in market prices and decreases in MON coatings produced. The impacts of these price increases will be borne largely by other
1In addition, Executive Order (EO) 12866 requires a more comprehensive analysis of benefits and costs for proposed significant regulatory actions. Office of Management and Budget (OMB) guidance under EO 12866 stipulates that a full benefit-cost analysis is required only when the regulatory action has an annual effect on the economy of $100 million or more. Other statutory and administrative requirements include examination of the composition and distribution of benefits and costs. For example, the Regulatory Flexibility Act (RFA), as amended by the Small Business Regulatory Enforcement and Fairness Act of 1996 (SBREFA), requires EPA to consider the economic impacts of regulatory actions on small entities.
1-1

manufacturers that use the MON coatings as inputs and to some extent by some domestic producers in terms of lower profits. The behavioral responses and adjustments by consumers and producers to changes in market conditions will ensure that, by and large, the social costs of the regulation are lower than the pure financial or “engineering” costs. The key results of the EIA for MON are as follows:
• Engineering Costs: Total annual costs measure the costs incurred by affected industries annually. EPA estimates that coating manufacturers will incur an $16 million in total annualized costs ($1998).
• Price and Quantity Impacts: These impacts are small.
– The average prices for MON coatings are projected to increase by less than 0.5 percent, or less than $0.01 per pound.
– The quantity of regulated coatings is estimated to decline by 3.7 million pounds, less than 0.2 percent of baseline production.
• Small Businesses: EPA performed a screening analysis for impacts on small businesses, by comparing compliance costs to baseline company revenues. EPA estimates that seven small businesses that own MON coatings facilities will incur costs exceeding 1 percent of their baseline sales.
• Social Costs: Within the MON coatings sector, EPA estimates that eight businesses, including seven small businesses, will incur costs to comply with MON that exceed 1 percent of their baseline sales.
1.3 Organization of this Report
The remainder of this report supports and details the methodology and the results of the EIA of the Miscellaneous Organic Coatings NESHAP.
• Section 2 presents a profile of the affected industry.
• Section 3 describes the estimated costs of the regulation.
• Section 4 describes the EIA methodology and reports market-, industry-, and societal-level impacts.
• Section 5 presents estimated impacts on companies owning MON facilities, including small businesses.
• Appendix A provides a description of the operational model used to develop quantitative estimates of the economic impacts.
1-2

• Appendices B reports the results of sensitivity analyses of impact estimates.
• Appendix C analyzes the impacts of combined regulation of MON chemicals and MON coatings, because some affected companies produce both types of commodities.
• Appendix D is a profile of the affected industry segment.
1-3

SECTION 2
INDUSTRY PROFILE
The MON Coatings rulemaking will affect facilities and companies producing miscellaneous organic coatings. EPA’s data do not permit clearly identifying the marketed commodities produced by these facilities or the production processes used. EPA is able to determine the general types of products produced, based on the Standard Industrial Classification (SIC) or North American Industrial Classification System (NAICS) code identified for each facility. This section summarizes a profile of the affected industry as identified by its SIC code. A detailed SIC code profile is provided in Appendix F. Table 2-1 provides the industry group and related SIC and NAICS codes.
Table 2-1. Industry Group Profiled and Related SIC and NAICS Codes
Industry Group Related SIC NAICS Codes Codes
Paints and Allied Products 2851 32551
The SIC code potentially affected by the MON coatings rulemaking is 2851 Paints and Allied Products, which corresponds to NAICS code 32551. To understand the context for the regulation, EPA prepared an industry profiles for this SIC code, presented in Appendix F. This section summarizes that profile.
2.1 Paints and Allied Products
The paint and allied products industry is relatively small when compared to other manufacturing industries. In 1997, the sector (SIC 2851, NAICS 32551) shipped $19,221.7 million dollars worth of products. All dollar values are 1998 dollars unless otherwise indicated. This industry supplies essential products to major manufacturing and consumer industries from automobiles to home furnishings.
2-1

Typical products manufactured by the industry include paints (ready-made and paste), varnish, lacquers, enamels and shellac putties, wood filters and sealers, paint and varnish removers, paint brush cleaners, and other allied paint products.
Three market segments account for the vast majority of output: architectural coatings (SIC 28511), original equipment manufacturer (OEM) product coatings (SIC 28512), and special purpose coatings (SIC 28513). While SIC 2851 grew 16.4 percent over the period 1987 to 1995, architectural coatings grew 20.9 percent, OEM grew 18.2 percent, and special purpose coatings grew 24.0 percent in real terms. Overall, despite the recession in the early 1990s, the value of shipments increased 25.8 percent from 1987 to $19,221.7 million in 1997.
Architectural coatings accounted for 33.7 percent of this industry’s total value of shipments in 1995. Commonly referred to as house paint, the architectural coatings sector generates nearly half of the industry’s revenue. In 1995, sales of OEM constituted 29.3 percent of the industry’s total value of shipments. OEM products are often custom formulated to meet applications specified by the end user. Primary users of OEM paints are automobile, appliance, equipment manufacturing, and furniture industries. Special purpose coatings shipments amounted to 17.3 percent of the 1995 industry receipts. While similar to architectural coatings in that this sector could be classified as stock or shelf goods, the special purpose coatings sector formulates its product for specific applications and/or environmental conditions and typically sells directly to the end user. The primary markets for its products are automotive, machine refinishing, industry maintenance, bridge and traffic markings, and marine.
2.1.1 Supply Side of the Industry
2.1.1.1 Production Processes
Paints primarily comprise pigments, resins, and solvents. The industry purchases the majority of its inputs from other manufacturers in the chemical industry (SIC 28). Most paints comprise four basic groups of chemical raw materials: binders and resins, pigments and extenders, solvents, and additives. When a paint is applied to a surface, the solvents begin to evaporate while the binder, pigments, and additives remain on the surface and harden to form a solid film. The chemical and physical properties of paints are directly related to the choice and concentration of raw materials determined during the production process. Paints are divided into two categories: water- and solvent-based paints and powder paint.
2-2

2.1.1.2 Types of Output
The various products produced by the paint and allied products industry can be divided and described as follows:
• Architectural coatings: Protective and decorative coatings applied onsite to the interior or exterior surfaces of industrial, commercial, institutional, or residential buildings for ordinary use and exposure. Architectural coatings include clear finishes and spar varnishes, enamels, primers, paints, stains, and lacquers.
• OEM coatings: Coatings designed specifically for an OEM to meet application and product requirements to be applied during the manufacturing process. OEM coatings include both powder coatings and electrical insulating coatings.
• Special purpose coatings: These coatings differ from architectural coatings in that they are formulated for special applications and/or environmental conditions such as extreme temperatures, chemicals, and fumes. Types include:
– industrial new construction and maintenance paints,
– marine paints including ships and offshore facilities,
– traffic paints,
– refinish paints, and
– aerosol paints.
2.1.1.3 Costs of Production
The inputs for paints and allied products include various resins, solvents, pigments, extenders, binders, and other additives. In constant 1998 dollars, the cost of materials rose 27 percent over the period 1987 to 1997 to $9,948 million. The higher cost of materials reflects the changing content of paint products. The use of higher solids content and environmental concerns necessitated using more expensive ingredients and using epoxies in paint. Prices for acetone, benzene, chlorine, and fiber-grade increased; however, phenol prices remained steady. The increasing cost of raw materials has been a concern for the industry.
The amount of labor employed by the industry dropped from 55,200 in 1987 to 52,700 in 1997, while the industry’s payroll increased by $289.5 million (1998 dollars), indicating that the manufacturing process became increasingly mechanized and required
2-3

skilled labor. In 1992, energy costs were $129.4 million, which is a 1.02 percent increase over 1992 figures.
2.1.1.4 Capacity Utilization
Full production capacity is broadly defined as the maximum level of production an establishment can obtain under normal operating conditions. The capacity utilization ratio is the ratio of the actual operations to the full production levels. From 1993 to 1998, the capacity utilization rates fell from 67 to 59 percent. Capacity utilization rates typically fall near 70 percent for the industry.
2.1.2 Demand Side of the Industry
Modern chemistry has produced coatings that add aesthetic value and are also resistant to natural elements, or electrical conduction, or wear and tear by vehicles. The paint and allied products industry is able to formulate a coating to fulfill almost any request a client may have. In the last 20 years, the industry has made major advances in the durability and quality of coatings.
The coatings industry is essential to nine other major U.S. industries: automobiles, trucks and buses, metal cans, farm machinery and equipment, construction machinery and equipment, metal furniture and fixtures, wood furniture and fixtures, major appliances, and coil coating (high speed application of industrial coatings to continuous sheets, strips, and coils of aluminum or steel) (U.S. Department of Commerce, 1995f).
There are few substitutes for coatings. Within the industry, the 20 percent growth of powdered paints in the 1980s quelled the demand for liquid products. Powdered paints are popular because of environmental concerns.
2.1.3 Organization of the Industry
2.1.3.1 Firm Characteristics
In 1997, the majority (61 percent) of facilities producing paints and allied products were small facilities with fewer than 20 employees. However, these facilities contributed only 8.2 percent to the total value of shipments. In 1992, the five largest coatings companies accounted for 31.1 percent of 1992 sales of coatings.
Based on concentration ratios and the Herfindahl-Hirschmann index (HHI), paints and allied coatings is not a concentrated industry. This indicates that the paint and allied products market is fairly competitive.
2-4

2.1.3.2 Geographical Distribution
Facilities involved in the coatings industry are concentrated in states with heavy involvement in manufacturing. Ohio, California, and Illinois alone accounted for 35.3 percent of the total value of shipments and 33 percent of total employment in the industry.
2.1.4 Markets and Trends
There has been mild growth in the percentage of domestic production of paints and allied products being exported. Domestic consumption of paints and allied products increased by 10.7 percent, while domestic production increased by 14.1 percent over the period 1987 to 1994.
2.2 Industry Organization
This section provides information for describing firm behavior within markets for miscellaneous organic coatings, describes the location of facilities producing miscellaneous organic coatings, and characterizes the companies owning miscellaneous organic coatings plants.
Market structure is of interest because it determines the behavior of producers and consumers in the industry. If an industry is perfectly competitive, then individual producers are unable to influence the price of the output they sell or the inputs they purchase. Competitive conditions are most likely in industries with a large number of firms, homogeneous inputs and outputs, and few barriers to entry or exit. The paints and allied coatings industry is not concentrated according to concentration ratios and the HHI. Inputs and outputs are typically fairly homogeneous. Thus, we are modeling the industry as perfectly competitive.
2.2.1 Production Facilities
EPA estimates that 127 facilities produce MON coatings. MON coatings facilities are located in many states, with the largest number of facilities concentrated in Texas, Louisiana, California, Illinois, and Ohio. Table 2-2 shows the geographic distribution of MON coatings facilities.
2-5

Table 2-2. Number of Facilities in SIC 2851 by State
State Number of Facilities State Number of Facilities AL 4 NC 9 AR 0 NJ 8 CA 15 NV 0 CT 1 NY 2 DE 0 OH 11 FL 2 OK 1 GA 2 OR 2 IA 2 PA 9 IL 35 RI 0 IN 5 SC 0 KS 2 TN 5 KY 2 TX 19 LA 25 VA 2 MA 1 WA 0 MD 5 WI 1 MI 6 WV 0 MN 1 None 0 MO 9 MS 1 Total 167
Many of the MON facilities are characterized by SIC codes that indicate the primary industrial activity at that site. Table 2-3 shows SIC codes for facilities in the coatings industry segment. As shown, the majority of facilities that produce MON coatings report SIC 2851 as their primary SIC code.
2.2.2 Quantities of MON Coatings Produced
EPA has data on quantities of MON coatings produced. Because many of these data have been claimed by the companies as confidential business information (CBI), and because the product descriptions given by the companies were company-specific and difficult to interpret, EPA has for modeling purposes aggregated across all products within the sector to estimate the total market quantity of MON organic chemicals and MON coatings. EPA
2-6

Table 2-3. Number of Facilities by SIC Code by Industry Segment
SIC Code Paints and Coatings
2821 3 2851 96
2891 13 2893 14
None 1 Total 127
estimates that production of MON coatings totals 2.62 billion pounds, or 1.19 million metric tons (refer to Section 4 for further analysis).
2-7

SECTION 3
ENGINEERING COST AND EMISSION REDUCTION ESTIMATES
This section presents the Agency’s estimates of the compliance costs associated with the NESHAP on the production of miscellaneous organic coatings. This regulation will affect all 127 facilities producing paints and allied products. The Agency estimated facility-specific costs for the industry.
3.1 Control Costs
Estimated costs of control include the following types of costs:
• total capital costs, an estimate of the cost of investment in new plant and equipment required to comply with the regulation;
• operating and maintenance costs, which include the annual costs of compliance such as additional labor, materials, or energy used for compliance activities, monitoring, recordkeeping, and reporting;
• product recovery credits; and
• total annual costs, which include annual capital costs, annual operating and maintenance costs, and recovery credits.
3.2 National Emissions Reductions and Compliance Costs
EPA’s estimated costs of control are shown in Table 3-1, along with baseline emissions and estimated emission reductions. The MACT standard would result in substantial reductions in HAP emissions, 5,674 tons of HAP emissions.
3-1

Tab
le 3
-1.
Est
imat
ed B
asel
ine
HA
P E
mis
sion
s, E
mis
sion
Red
ucti
ons,
and
Cos
t of
Com
plia
nce
for
Fac
iliti
es A
ffec
ted
by t
he M
ON
Coa
ting
s R
ule
($19
98)
Bas
elin
e H
AP
H
AP
O
pera
ting
&
Ann
ualiz
ed
Cos
t-E
mis
sion
s R
educ
tion
T
otal
Ann
ual
Tot
al C
apit
al M
aint
enan
ce C
apit
al C
osts
R
ecov
ery
effe
ctiv
enes
s (t
n/yr
) (t
n/yr
) C
ost
($/y
r)
Cos
t ($
/yr)
($
) ($
/yr)
C
redi
t ($
) ($
/tn
HA
P)
Cos
ts f
or C
oatin
g P
rodu
cers
Min
imum
1.
7 0.
4 6,
048
5,14
8 5,
394
733
79
Mea
n 61
.4
44.7
12
6,09
2 45
2,89
3 85
,909
49
,990
9,
808
Max
imum
45
4.2
312.
9 41
8,42
9 2,
238,
111
238,
826
246,
618
68,9
86
Tot
al, C
oatin
g P
rodu
cers
7,
792.
3 5,
674.
1 16
,013
,704
57
,517
,432
10
,910
,495
6,
348,
699
1,24
5,64
0 2,
822
3-2

The final column in Table 3-1 shows the cost-effectiveness of the regulation for each market segment. Overall, the rule costs approximately $2,822 per metric ton of HAPs removed.
Total annual costs measure the costs incurred by the industry annually. For the industry as a whole, they total approximately $16.0 million. Estimated total annual compliance cost for coating manufacturers ranges from $6,050 to $418,000 and averages $126,000 per facility.
3-3
SECTION 4
ECONOMIC IMPACT ANALYSIS: METHODS AND RESULTS
The MACT standard requires miscellaneous organic coatings manufacturers to meet emission standards for the release of HAPs into the environment. To meet these standards, firms will have to install control devices on process vents, storage tanks, and waste water systems and to regularly search equipment components for leaks. These changes result in higher capital and operating costs for the affected producers. They also have broader societal implications because these effects are transmitted through market relationships to consumers of these products.
To measure the size and distribution of these economic impacts, the Agency compared the baseline conditions for two affected aggregate MON commodities with those for the with-regulation conditions expected to result from implementing the MACT standard. The main elements include
• a general description of the conceptual approach consistently used in previous economic analyses to estimate the impacts of MACT regulations and
• development of an economic model that characterizes aggregate baseline supply and demand for each commodity and evaluates the behavioral responses of economic agents to the regulation.
The economic model projects a price increase of MON coatings of 0.26 percent. Coatings manufacturers are expected to see a 0.30 percent decrease in profit. Coatings consumers (domestic and foreign) are expected to experience $9.6 million in lost welfare; directly affected producers are expected to experience $6.4 million in reduced profits. Hence, the total social cost associated with the rule is $16 million, almost identical to the compliance costs shown in section 3.
4.1 Conceptual Approach
The Agency conducted a market-level rather than the facility-level characterization for the market for MON coatings. The analysis was restricted to the market-level for three reasons:
4-1

• data limitations: The Section 114 survey responses showed a wide array of commodities potentially impacted by the regulation. However, sufficient commodity information (i.e., descriptions and particularly prices) was not available to appropriately model these markets at this level of detail.
• use of confidential business information: Lower levels of aggregation were not used in order to avoid disclosure of confidential business information.
• per-unit cost screening analysis: EPA computed the per-unit cost of regulation for each facility and this analysis suggested these costs are small and similarly distributed across industries.
Given this conclusion, the Agency considered whether producers and consumers act as price-takers in the market (i.e., perfect competition), or whether they have some degree of market power (i.e., monopoly or oligopoly). For this analysis, EPA modeled the market as competitive. The Agency concluded this assumption is appropriate given the following information:
• product characteristics and substitution possibilities: Limited commodity descriptions were available. However, similar SIC industry groupings were reported and used as the next best alternative to infer that the grouped products could be considered homogeneous or close substitutes.
• empirical measures of market concentration: The degree of competition in a market is often addressed by looking at census statistics such as the sum of the squared market shares of all firms (Herfindahl Hirschmann Index). Although definitive conclusion about market concentration cannot be drawn from this measure, HHI indices for the industry group with the most facility observations (SIC 2851) are below 1,000. Therefore, these industries could be considered “unconcentrated” using the Department of Justices’s horizontal merger guidelines.
In competitive markets, buyers and sellers exert no individual influence on market prices. Price is set by the collective actions of producers and consumers, who take the market price as a given in making their production and consumption choices. The baseline consists of a market price and quantity that are determined by the intersection of the downward-sloping market demand curve and the upward-sloping market supply curve. With the regulation, the cost of production increases for suppliers costs associated with the installation of pollution control equipment and associated operating costs. Incorporating these costs is represented by an upward shift of the aggregate supply curve by the per-unit compliance cost. At the new equilibrium with the regulation, the market price increases and market output declines.
4-2
4.2 Operational Model
To develop quantitative estimates of economic impacts, the Agency developed an operational model using spreadsheet software. As described below and in Appendix A, this model characterizes baseline supply and demand in the market and the behavioral responses to changes in costs and/or market prices.
4.2.1 Market Supply
The Agency modeled the market as having one aggregate supplier with upward-sloping supply curves, reflecting increasing marginal costs as output increases. For this analysis, the simple specification (Cobb-Douglas) was used to derive the supply curves for the aggregate producer subject to the regulation. The supply function parameters are calibrated using baseline production, price data, and assumptions about the responsiveness of supply to changes in price (supply elasticity). Absent literature estimates, EPA used a supply elasticity of 1 (i.e., a 1 percent change in the price of the commodity would result in a 1 percent increase in the supply). Sensitivity analysis was conducted in order to assess the impact of this assumption on impact estimates (see Appendix B).
4.2.2 Market Demand
EPA modeled one aggregate consumer with a downward-sloping demand curve that is consistent with the theory of demand (i.e., consumption of the commodity is high at low prices and low at high prices, reflecting the opportunity costs of purchasing these products). The Agency developed this curve using baseline quantity, price data, and assumptions about the responsiveness to changes in price (demand elasticity). For domestic demand, a demand elasticity of –0.5 was used (i.e., a 1 percent increase in the price of the commodity would result in a 0.5 percent decrease in quantity demanded, and vice versa). Sensitivity analysis was also conducted for this assumption, which is presented in Appendix B.
4.2.3 Control Cost Inputs and With-Regulation Equilibrium
Incorporating the control costs into the market model shifts the market supply curve upward by the per-unit compliance cost. In other analyses performed for the Agency, only compliance costs that vary with output levels are included in computing this shift under the assumption that only these costs affect the firm's decision regarding how much to produce. The fixed cost component of compliance costs is typically assumed to only influence a firm’s decision regarding whether to operate or to exit the market. Nonetheless, an argument can be made that, prior to investing in compliance capital, the scale of these expenditures could, at
4-3

least in principle, vary with the level of output. Therefore, EPA computed a parallel shift in the supply curve using the average annual total compliance costs for each market.
4.3 Market Model Results
The theory presented above suggests that producers attempt to mitigate the impacts of higher-cost production by shifting the burden onto other economic agents to the extent the market conditions allow. As expected the model projects upward pressure on prices as producers reduce output rates in response to higher costs. Higher prices reduce quantity demanded and output for the commodity, leading to changes in economic surplus to consumers and profitability of firms. These market adjustments determine the social costs of the regulation and its distribution across stakeholders (producers and consumers).
The model estimates impacts for the coatings market. The coatings market includes all the facilities identified as affected by EPA. Market quantity is computed by summing the quantities of MON coatings they produce. An average price for the MON coating market was computed based on SIC-level customs value of imports and import quantities2 reported by the U.S. International Trade Commission (USITC, 2000).
EPA believes that all domestic producers of the MON organic coatings will be affected by the regulation. Thus, there are no domestic suppliers that would be indirectly affected by the rulemaking through changes in market price. Because EPA has only limited information on the specific products being affected by the rulemaking, it was not possible to compile data on imports and exports of those commodities. Thus the market analyzes only impacts on directly regulated facilities.
4.3.1 Market-Level Impacts
The increased cost of production due to the regulation is expected to increase the price of MON commodities and reduce their production/consumption from baseline levels. As shown in Table 4-1, the regulatory alternative is projected to increase prices of coatings
2Import quantities for these industries include different units of measure (i.e., weight [kilograms] and volume [liters]). The Section 114 responses report quantities in pounds; thus, these values were used for price calculations.
4-4

Table 4-1. Estimated Baseline Quantities and Price for the MON Markets: 1998
With Absolute Relative Baseline Regulation Change Change
Market price ($/lb) $1.43 $1.43 $0.004 0.28%
Market quantity (106 lbs) 2,625 2,622 –3.73 –0.14%
by less than one-half percent, 0.28 percent. Coatings output declines by 0.14 percent, or 3.7 million pounds.
4.3.2 Industry-Level Impacts
Revenue, costs, and profitability of the affected industries also change as prices and production levels adjust to increased control costs. In the coatings industry (see Table 4-2), revenues are estimated to increase by $5.3 million, or 0.14 percent, while costs are estimated to increase by $10.7 million, or 0.57 percent. Thus, coating manufacturers are estimated to experience a decline in profits of approximately $5.3 million.
Table 4-2. U.S. Industry-Level Impacts (106 1998 $/yr)
With Absolute Relative Baseline Regulation Change Change
Coatings
Revenue $3,754 $3,760 $5.3 0.142%
Costs $1,877 $1,888 $10.7 0.568%
Control NA $16 $16.0 NA
Production $1,877 $1,872 –$5.3 –0.284%
Operating Profit $1,877 $1,872 –$5.3 –0.284%
4.4 Additional Firm-Level Analysis
Although facility-specific impacts (i.e. closures) cannot be estimated using the aggregate model described above, the Agency did conduct a screening analysis that develops limited quantitative estimates of the economic impacts on individual firms. Using this approach, producers “fully absorb” the compliance costs and their production choice is
4-5
limited to compliance at the current operating rates. For each firm, the Agency computed a “sales” and “profit” test statistic to measure economic impacts of the rule. The “sales” test compares the annual compliance costs to baseline sales of the firm. The “profit” test compares annual compliance costs and baseline profit margins. Note, however, this approach excludes behavioral responses (i.e. changes in production/consumption rates and prices) that economic theory suggests will occur with changes in costs of production. Results of the firm-level analysis are presented in Section 5, and a screening analysis of small business impacts is presented in Appendix E.
4.5 Social Costs
The value of a regulatory action is traditionally measured by the change in economic welfare that it generates. The regulation’s welfare impacts, or the social costs required to achieve environmental improvements, will extend to consumers and producers alike. Consumers experience welfare impacts due to changes in market prices and consumption levels associated with the rule. Producers experience welfare impacts resulting from changes in profits corresponding with the changes in production levels and market prices. However, it is important to emphasize that this measure does not include benefits that occur outside the market, that is, the value of reduced levels of air pollution with the regulation.
4.5.1 Engineering Compliance Costs
The national compliance cost estimates are often used as an approximation of the social cost of the rule. The engineering analysis estimated annual costs of $16.0 million for MON coating producers. Using engineering compliance costs to estimate social costs assumes the burden of the regulation falls solely on the MON facilities that experience a profit loss exactly equal to the cost estimate. Thus, the entire loss is a change in producer surplus with no change (by assumption) in consumer surplus. This is typically referred to as a “full-cost absorption” scenario in which all factors of production are assumed to be fixed and firms are unable to adjust their output levels when faced with additional costs.
4.5.2 Estimated Social Cost
In contrast, the economic analysis accounts for behavioral responses by producers and consumers to the regulation (i.e., shifting costs to other economic agents). This approach may result in a social cost estimate that differs from the engineering estimate and also provides insights on how the regulatory burden is distributed across stakeholders. As shown in Table 4-3, the economic model estimates a social cost of the rule of $16.0 million.
4-6

Table 4-3. Distribution of the Social Costs (106 1998 $/yr)
Consumer Surplus –$10.7 67%
Producer Surplus –$5.3 33%
Total Social Cost –$16.0
Consumers (domestic and foreign) are projected to lose $10.7 million, and directly affected producers lose $5.3 million. (Note that in the case of the market for MON commodities, consumers are generally other producers of intermediate or final goods.)
4-7

SECTION 5
SMALL BUSINESS IMPACT ANALYSIS
This regulatory action will potentially affect the economic welfare of owners of facilities that manufacture coatings. The ownership of these facilities ultimately falls on private individuals who may be owners/operators that directly conduct the business of the firm (i.e., single proprietorships or partnerships) or, more commonly, investors or stockholders that employ others to conduct the business of the firm on their behalf (i.e., privately held or publicly traded corporations). The individuals or agents that manage these facilities have the capacity to conduct business transactions and make business decisions that affect the facility. The legal and financial responsibility for compliance with a regulatory action ultimately rests with these agents; however, the owners must bear the financial consequences of the decisions. Environmental regulations like this rule potentially affect all businesses, large and small, but small businesses may have special problems in complying with such regulations.
The Regulatory Flexibility Act (RFA) of 1980 requires that special consideration be given to small entities affected by federal regulation. The RFA was amended in 1996 by the Small Business Regulatory Enforcement Fairness Act (SBREFA) to strengthen the RFA’s analytical and procedural requirements. Prior to enactment of SBREFA, EPA exceeded the requirements of the RFA by requiring the preparation of a regulatory flexibility analysis for every rule that would have any impact, no matter how minor, on any number, no matter how few, of small entities. Under SBREFA, however, the Agency decided to implement the RFA as written and that a regulatory flexibility analysis will be required only for rules that will have a significant impact on a substantial number of small entities (SISNOSE). In practical terms, the amount of analysis of small entities’ impacts has not changed, for SBREFA required EPA to increase involvement of small entity stakeholders in the rulemaking process. Thus the Agency has made additional efforts to consider small entity impacts as part of the rulemaking process.
5-1

5.1 Identifying Small Businesses
As described in Section 2 of this report, the Agency identified a number of small businesses potentially affected by the rule. Based on SBA employee size definitions, 32 (55 percent) of the 58 affected MON coatings companies can be classified as small.
5.2 Screening-Level Analysis
Prior to completing the economic analysis, the Agency completed a preliminary screening-level analysis to assist in determining whether this rule is likely to impose a significant impact on a substantial number of small businesses. The analysis employed a “sales test,” which computed the annualized compliance costs as a share of sales for each company. The annual compliance costs were defined as the engineering control costs imposed on facilities owned by these companies (see Table 5-1).
Table 5-1. Total Annual Costs for Complying with MON: February 1999
Number of Facilities Type of Facility Total Annual Costs ($)
127 Coatings manufacturing $16,013,704
Appendix C presents a sensitivity analysis, one that considers the combined impacts of the two regulations.
5.2.1 Effects of the Regulation of Coatings Manufacturers
Table 5-2 reports total compliance costs of the regulation on facilities that manufacture coatings, the number of companies affected at the 1 percent and 3 percent levels, and summary statistics of the cost-to-sales ratios (CSRs) of small companies. Figures 5-1(a) and 5-1(b) illustrate the distribution of these ratios across small and large companies with sales data.
The aggregate compliance costs of the regulation for facilities producing coatings total $3.8 million for small businesses (see Table 5-2). Thirty-two (44 percent) of the 72 small companies affected by the miscellaneous organic chemical NESHAP own facilities that manufacture coatings. RTI obtained sales data for 30 of the 32 small companies that
5-2

Tab
le 5
-2.
Sum
mar
y St
atis
tics
for
SB
RE
FA
Scr
eeni
ng A
naly
sis:
MO
N—
Reg
ulat
ion
of C
oati
ng F
acili
ties
: 1
998
Smal
l L
arge
A
ll C
ompa
nies
Tot
al n
umbe
r of
com
pani
es
32
26
58
Ann
ual c
ompl
ianc
e co
sts
($10
6 /yr)
$3
.8
$12.
2 $1
6.0
Num
ber
Shar
ea N
umbe
r Sh
are
Num
ber
Shar
ea
Com
pani
es w
ith
sale
s da
ta
30
26
56
Com
plia
nce
cost
s ar
e <1
% o
f sa
les
23
77%
25
96
%
48
86%
Com
plia
nce
cost
s ar
e 1
to 3
% o
f sa
les
5 17
%
1 4%
6
11%
� �
Com
plia
nce
cost
s ar
e 3%
of
sale
s 2
7%
0 0%
2
4%
Com
plia
nce
cost
-to-
sale
s ra
tios
Ave
rage
1.
02%
0.
10%
0.
60%
Med
ian
0.50
%
0.03
%
0.17
%
Max
imum
7.
74%
1.
45%
7.
74%
Min
imum
0.
08%
0.
00%
0.
00%
Not
e: A
ssum
es n
o m
arke
t res
pons
es (
i.e.,
pric
e an
d ou
tput
adj
ustm
ents
) by
reg
ulat
ed e
ntiti
es.
a T
otal
is g
reat
er th
an 1
00 d
ue to
rou
ndin
g.
5-3

0%
20%
40%
60%
80%
100% F
req
uen
cy
0% 0 - .05% 0.05 -1%
1 - 3% 3 - 5% 5 - 7%
CSR Range
7 - 10% 10 -15%
15 -20%
>20%
(a) Small Companies
100%
Fre
qu
ency
80%
60%
40%
20%
0%
0% 0 - .05% 0.05 - 1 - 3% 3 - 5% 5 - 7% 7 - 10% 10 - 15 - >20% 1% 15% 20%
CSR Range
(b) Large Companies
Figure 5-1. Distribution of Cost-to-Sales Ratios for Companies owning MON Coatings Facilities
5-4

own coating facilities, or 94 percent. For these companies, the annual compliance costs for small businesses range from 0.08 to 7.74 percent of sales. The average (median) compliance CSR is 1.02 (0.50) percent for the identified small businesses with sales data. As shown, five small companies are affected at the 1 percent to 3 percent level and two small companies are affected at the 3 percent level. In contrast, only one out of the 26 large companies that own facilities affected by this regulation will find compliance costs to be greater than 1 percent of sales.
The effect of cost increases is best understood in the context of the change in profit margin that will result from the regulation. Table 5-3 shows that the average and median profit margins of firms owning facilities that produce coatings will decrease more for small firms than for large firms. Figures 5-2(a) and (b) show the distribution of profit margins for small and large firms under regulation. Table 5-3 shows that three additional small companies may become unprofitable due to the regulation.
Table 5-3. Profit Margins With and Without Regulation of Coatings Manufacturers
Small Large All Companies Companies Companies
Profit margins without regulation
Average 2.74% 4.92% 3.75%
Median 2.70% 3.85% 2.70%
Maximum 5.10% 15.05% 15.05%
Minimum –0.24% 1.59% –0.24%
Number of firms with profit margin less 1 0 1 than zero
Profit margins with regulation
Average 1.71% 4.82% 3.16%
Median 2.70% 3.85% 2.70%
Maximum 5.10% 15.05% 15.05%
Minimum –5.01% 1.55% –5.01%
Number of firms with profit margin less 4 0 4 than zero
5.3 Summary Assessment
5-5

The RFA generally requires an agency to prepare a regulatory flexibility analysis of any rule subject to notice and comment rulemaking requirements under the Administrative Procedure Act or any other statute, unless the agency certifies that the rule will not have a significant economic impact on a substantial number of small entities. Small entities include small businesses, small organizations, and small governmental jurisdictions.
For purposes of assessing the impacts of today’s rule on small entities, a small entity is defined as (1) a small business according to Small Business Administration size standards by 6-digit NAICS of the ultimate parent entity (in this case, ranging from 500 to 1,000 employees); (2) a small governmental jurisdiction that is a government of a city, county, town, school district, or special district with a population of less than 50,000; and (3) a small organization that is any not-for-profit enterprise which is independently owned and operated and is not dominant in its field.
After considering the economic impact of today’s rule on small entities, I certify that this action will not have a significant impact on a substantial number of small entities. In accordance with the RFA, as amended by the SBREFA, 5 U.S.C. 601, et. seq., EPA conducted an assessment of the standard on small business within the industries affected by the rule. Based on SBA size definitions for the affected industries and reported sales and employment data, the Agency identified 32 of the 58 companies, or 55 percent, owning affected coating manufacturing facilities as small businesses. Although small businesses represent 55 percent of the companies within the source category, they are expected to incur only 24 percent of the total industry compliance costs of $16 million. There are only two small firms with compliance costs equal to or greater than 3 percent of their sales. In addition, there are only five small firms with cost-to-sales ratios between 1 and 3 percent.
An economic impact analysis was performed to estimate the changes in product price and production quantities for the coating manufacturing firms affected by this rule. The analysis shows that of the 70 facilities owned by affected small firms, only three are expected to shut down in response to the implementation of the rule. Hence, it seems reasonable to conclude that the closures will not lead to a significant economic impact due to the small reduction in facilities owned by affected small firms.
5-6

Fre
quen
cy
Freq
uen
cy
100%
80%
60%
40%
20%
0%
100%
80%
60%
40%
20%
0%
<0 0 0 -.05%
0.05 - 1 - 3% 3 - 5% 5 - 7% 1%
Profit Margin Range
7 - 10% 10 -15%
>15%
(a) Small Companies
<0% 0% 0 - 0.05 - 1 - 3% 3 - 5% 5 - 7% 7 - 10% 10 - >15% .05% 1% 15%
Profit Margin Range
(b) Large Companies
Figure 5-2. Distribution of Profit Margins for Companies Owning MON Coatings Facilities
5-7

In summary, this analysis indicates that the rule should not generate a significant impact on a substantial number of small entities for the MON coatings manufacturing source category for the following reasons. First, there are only seven small firms (or 22 percent of all affected small firms) with compliance costs equal to or greater than 1 percent of their sales. In addition, there are only two small firms (or 6 percent of all affected small firms )with compliance costs equal to or greater than 3 percent of their sales. Second, the results of the economic impact analysis show that only three facilities owned by a small business may close due to the implementation of this rule. It should be noted that the baseline economic condition of the facility predicted to close affects the closure estimate provided by the economic model (i.e., facilities that are already experiencing adverse economic conditions will be more severely impacted than those that are not, and that the facilities predicted to close appear to currently have low profitability). This analysis therefore allows us to certify that there will not be a significant impact on a substantial number of small entities from the implementation of this rule. For more information, consult the docket for this project.
Although this rule will not have a significant economic impact on a substantial number of small entities, the EPA nonetheless has tried to limit the impact of this rule on small entities.
5-8
REFERENCES
D’Amico, Esther. 1996. “Soaps and Detergents: The Push to Perform.” Chemical Week
158(3):31.
DRI McGraw Hill, Standard and Poor’s and U.S. Department of Commerce, International Trade Administration. 1998. U.S. Industry and Trade Outlook 1998. New York: McGraw Hill.
Gale Research Inc. 1995. U.S. Industry Profiles: Paints and Allied Products. New York: Gale Research Inc.
The McGraw Hill Companies and U.S. Department of Commerce, International Trade Administration. 20000. U.S. Industry and Trade Outlook 2000 New York: McGraw Hill.
Mote, David. 1994. Organic Fibers Noncellulosic. Encyclopedia of American Industries Volume I: Manufacturing Industries. p. 485.
Sawinski, Diane (ed.). 1995. U.S. Industry Profiles: The Leading 100. Detroit, MI: Gale Research, Inc.
Society of the Plastics Industry. 1997. Facts and Figures of the U.S. Plastics Industry.
Tollefson, Chris. 1994. “Profitable News: Adhesives and Sealants are Showing a Firmer Tone and Environmental Regulations are Driving Innovations.” Chemical Marketing Reporter 245(17).
U.S. Bureau of Labor Statistics, Producer Price Index Revision—Current Series. Series ID PCU2821#. <http://www.bls.gov>. Obtained August 18, 2000.
U.S. Department of Commerce, Bureau of the Census. 1989. 1987 Census of Manufactures,
Industry Series: Soaps, Toilet Goods, and Cleaners. Washington, DC: Government Printing Office.
U.S. Department of Commerce, Bureau of the Census. 1990a. 1987 Census of Manufactures, Industry Series: Agricultural Chemicals. Washington, DC: Government Printing Office.
R-1

U.S. Department of Commerce, Bureau of the Census. 1990b. 1987 Census of
Manufactures, Industry Series: Industrial Organic Chemicals. Washington, DC: Government Printing Office.
U.S. Department of Commerce, Bureau of the Census. 1990c. 1987 Census of
Manufactures, Industry Series: Medical Instruments; Opthalmic Goods;
Photographic Equipment; Clocks, Watches, and Watchcases. Washington, DC: Government Printing Office.
U.S. Department of Commerce, Bureau of the Census. 1990d. 1987 Census of Manufactures, Industry Series: Miscellaneous Chemical Products. Washington, DC: Government Printing Office.
U.S. Department of Commerce, Bureau of the Census. 1990e. 1987 Census of
Manufactures, Industry Series: Paints and Allied Products. Washington, DC: Government Printing Office.
U.S. Department of Commerce, Bureau of the Census. 1990f. 1987 Census of Manufactures, Industry Series: Plastics Materials, Synthetic Rubber, and Man-made
Fibers. Washington, DC: Government Printing Office.
U.S. Department of Commerce, Bureau of the Census. 1990g. 1988 Annual Survey of
Manufactures. Washington, DC: Government Printing Office.
U.S. Department of Commerce, Bureau of the Census. 1991. U.S. Merchandise Trade:
Exports, General Imports, and Imports for Consumption 1990. FT925/90-A. Washington, DC: Government Printing Office.
U.S. Department of Commerce, Bureau of the Census. 1992a. 1990 Annual Survey of
Manufactures. Washington, DC: Government Printing Office.
U.S. Department of Commerce, Bureau of the Census. 1992b. U.S. Merchandise Trade:
Exports, General Imports, and Imports for Consumption 1991. FT925/91-A. Washington, DC: Government Printing Office.
U.S. Department of Commerce, Bureau of the Census. 1993a. 1992 Census of Manufactures, Industry Series: Miscellaneous Chemical Products. Washington, DC: Government Printing Office.
U.S. Department of Commerce, Bureau of the Census. 1993b. 1994 U.S. Industrial Outlook. Washington, DC: Government Printing Office.
R-2

U.S. Department of Commerce, Bureau of the Census. 1993c. U.S. Merchandise Trade:
Exports, General Imports, and Imports for Consumption 1992. FT925/92-A. Washington, DC: Government Printing Office.
U.S. Department of Commerce, Bureau of the Census. 1994. U.S. Merchandise Trade:
Exports, General Imports, and Imports for Consumption 1993. FT925/93-A. Washington, DC: Government Printing Office.
U.S. Department of Commerce, Bureau of the Census. 1995a. Concentration Ratios in
Manufacturing. Washington, DC: Government Printing Office
U.S. Department of Commerce, Bureau of the Census. 1995b. 1992 Census of Manufactures, Industry Series: Agricultural Chemicals. Washington, DC: Government Printing Office.
U.S. Department of Commerce, Bureau of the Census. 1995c. 1992 Census of
Manufactures, Industry Series: Industrial Organic Chemicals. Washington, DC: Government Printing Office.
U.S. Department of Commerce, Bureau of the Census. 1995d. 1992 Census of Manufactures, Industry Series: Medical Instruments; Opthalmic Goods;
Photographic Equipment; Clocks, Watches, and Watchcases. Washington, DC: Government Printing Office.
U.S. Department of Commerce, Bureau of the Census. 1995e. 1992 Census of
Manufactures, Industry Series: Miscellaneous Chemical Products. Washington, DC: Government Printing Office.
U.S. Department of Commerce, Bureau of the Census. 1995f. 1992 Census of
Manufactures, Industry Series: Paints and Allied Products. Washington, DC: Government Printing Office.
U.S. Department of Commerce, Bureau of the Census. 1995g. 1992 Census of
Manufactures, Industry Series: Plastics Materials, Synthetic Rubber, and Man-made Fibers. Washington, DC: Government Printing Office.
U.S. Department of Commerce, Bureau of the Census. 1995h. 1992 Census of
Manufactures, Industry Series: Soaps, Toilet Goods, and Cleaners. Washington, DC: Government Printing Office.
R-3

U.S. Department of Commerce, Bureau of the Census. 1995i. 1993 Annual Survey of
Manufactures. Washington, DC: Government Printing Office.
U.S. Department of Commerce, Bureau of the Census. 1995j. U.S. Merchandise Trade: Exports, General Imports, and Imports for Consumption 1994. FT925/94-A. Washington, DC: Government Printing Office.
U.S. Department of Commerce, Bureau of the Census. 1996. Survey of Plant Capacity:
1994. Washington, DC: Government Printing Office.
U.S. Department of Commerce, Bureau of the Census. 1997a. 1995 Annual Survey of
Manufactures. Washington, DC: Government Printing Office.
U.S. Department of Commerce, Bureau of the Census. August 1997b. 1996 Current Industrial Reports: Paint, Varnish, and Lacquer. Washington, DC: Government Printing Office.
U.S. Department of Commerce, Bureau of the Census. 1998. 1996 Annual Survey of
Manufactures. Washington, DC: Government Printing Office.
U.S. Department of Commerce, Bureau of the Census. 1999a. 1997 Census of
Manufacturers, Industry Series. Washington DC, Government Printing Office.
U.S. Department of Commerce, Bureau of the Census. 1999b. 1997 Census of Manufactures, Industry Series: Noncellulosic Organic Fiber Manufacturing. <http://www.census.gov/prod/www/abs/97ecmani.html>.
U.S. Department of Commerce, Bureau of the Census. 1999c. 1997 Census of
Manufacturers, Industry Series: Photographic Film, Paper, Plate and Chemical
Manufacturing. Washington DC, Government Printing Office.
U.S. Department of Commerce, Bureau of the Census. 1999d. 1997 Census of Manufacturers, Industry Series: Photographic and Photocopying Equipment. Washington DC, Government Printing Office.
U.S. Department of Commerce, Bureau of the Census. 1999e. 1997 Census of
Manufactures, Industry Series: Polish and Other Sanitation Goods Manufacturing. Washington, DC: Government Printing Office.
R-4

U.S. Department of Commerce, Bureau of the Census. 1999f. 1997 Census of
Manufactures, Industry Series: Surface Active Agent Manufacturing. Washington, DC: Government Printing Office.
U.S. Department of Commerce, Bureau of the Census. 1999g. 1997 Census of
Manufactures, Industry Series: Soap and Other Detergent Manufacturing. Washington, DC: Government Printing Office.
U.S. Department of Commerce, Bureau of the Census. 1999h. 1997 Economic Census. Washington DC, Government Printing Office.
U.S. Department of Commerce, Bureau of the Census. 1999i. Survey of Plant Capacity: 1997. Washington, DC: Government Printing Office.
U.S. Department of Commerce, Bureau of the Census. 2000. Survey of Plant Capacity:
1998. Washington, DC: Government Printing Office.
U.S. Department of Commerce, Bureau of the Census. 1997 NAICS and SIC Correspondence Tables. <http://www.census.gov/epcd/www/naicstab.htm>. As obtained March 6, 2000.
U.S. Department of Commerce, International Trade Administration. 1989. 1989 U.S. Industrial Outlook. Washington, DC: Government Printing Office.
U.S. Department of Commerce, International Trade Administration. 1990. 1990 U.S.
Industrial Outlook. Washington, DC: Government Printing Office.
U.S. Department of Commerce, International Trade Administration. 1991. 1991 U.S.
Industrial Outlook. Washington, DC: Government Printing Office.
U.S. Department of Commerce, International Trade Administration. 1993. 1994 U.S.
Industrial Outlook. Washington, DC: Government Printing Office.
U.S. Department of Justice and the Federal Trade Commission. April 2, 1992. Horizontal Merger Guidelines. Washington, DC: Government Printing Office.
U.S. International Trade Commission (USITC). 2000. Interactive Tariff and Trade Data Web. <http://205.197.120.17/>. Obtained June 29, 2000.
R-5

Appendix A
MON Economic Model

EPA developed an economic model for the market for MON coatings to estimate the economic impacts of the rule. This appendix describes the model in detail
• characterize the supply of the affected commodities at the market level,
• characterize demand, and
• use a solution algorithm to determine the new with-regulation equilibrium.
A.1 Baseline Data Set
EPA collected the following information in order to characterize the baseline:
• market quantities: Data for more than 300 facilities were aggregated to develop baseline market quantities for the coatings markets (see Table A-1).
• market prices: An average price for the market was computed based on SIC-level customs value of imports and import quantities3 reported by the U.S. International Trade Commission (USITC, 2000).
Table A-1. Baseline Data Set: 1998
Market Average Price ($/lb)
Coatings $1.43
Quantity (109 lbs)
2.63
A.2 Market Supply
Coatings producers subject to the regulation have some ability to vary output in the face of production cost changes. Their production cost curves, coupled with the market price, could be used to determine the optimal production rate. RTI will model supply as a single representative supplier with the following supply characterization:
(A.1)
3Import quantities for these industries include different units of measure (i.e., weight [kilograms] and volume [liters]). The Section 114 responses report quantities in pounds; thus, these values were used for price calculations.
A-1

In this Cobb-Douglas specification, pi is the market price for the ith market, �Si is the domestic supply elasticity (assumed value = 1), and ASi is a multiplicative supply parameter that calibrates the supply equation to replicate the aggregate production obtained from survey responses.
Regulation-Induced Shift in the Supply Function. The control costs associated with the NESHAP total $16.0 for the coatings market (see Table A-2). The estimated annual compliance cost per pound (ci) enters the supply equation as a net price change (i.e., pi – ci). Thus, the supply function from Eq. (A.1) becomes:
(A.2)
Table A-2. Computing Regulatory-Induced Shift in Supply Function: 1998
Market Total Annual Costs ($106) Per-Unit “Cost-Shifter”
Coatings $16.0 $0.006
% Shift
0.43%
A.3 Market Demand
Demand will be expressed as
(A.3)
where pi is the market price, �Di is the demand elasticity, and ADi is a multiplicative demand parameter that calibrates the demand equation, given data on price and the demand elasticity to replicate the observed baseline year level of consumption (assumed to equal production).
A.4 With-Regulation Market Equilibrium
Supply/demand responses can be conceptualized as an interactive feedback process. Producers face increased production costs due to compliance and respond with output reduction. This leads to an increase in the market price that both types of producers (directly affected and indirectly affected) and consumers face. This increase leads to further
A-2

responses by all producers and consumers and, thus, new market prices. The new with-regulation equilibrium is the result of a series of these iterations between producer and consumer responses and market adjustments until a stable market price equilibrium is reached in which total market supply equals total market demand (i.e., QS = QD).
A.5 Economic Welfare Impacts
The economic welfare implications of the market price and output changes with the regulation can be examined as changes in the net benefits of consumers and producers based on the price changes. This analysis focuses on the changes in the net benefits of consumers and producers. Figure A-1 depicts the change in economic welfare by first measuring the change in consumer surplus and then the change in producer surplus. In essence, the demand and supply curves previously used as predictive devices are now being used as a tool to measure changes in economic welfare.
In a market environment, consumers and producers of the good or service derive welfare from a market transaction. The difference between the maximum price consumers are willing to pay for a good and the price they actually pay is referred to as “consumer surplus.” Consumer surplus is measured as the area under the demand curve and above the price of the product. Similarly, the difference between the minimum price producers are willing to accept for a good and the price they actually receive is referred to as “producer surplus” or profits. Producer surplus is measured as the area above the supply curve and below the price of the product. These areas can be thought of as consumers’ net benefits of consumption and producers’ net benefits of production, respectively. In Figure A-1, baseline equilibrium occurs at the intersection of the demand curve, D, and supply curve, S. Price is Pl with quantity Ql. The increased cost of production with the regulation will cause the market supply curve to shift upward to S'. The new equilibrium price of the product is P2. With a higher price for the product, there is less consumer welfare, all else being unchanged as real incomes are reduced. In Figure A-1(a), area A represents the dollar value of the annual net loss in consumers’ benefits with the increased price. The rectangular portion represents the loss in consumer surplus on the quantity still consumed, Q2, while the triangular area represents the foregone surplus resulting from the reduced quantity consumed, Ql–Q2.
A-3

P1
P2
S
S’
D
$/Q
A
Q2 Q1 Q/t
(a) Change in Consumer Surplus with Regulation
P1
P2
S
S’
D
$/Q
B
C
Q2 Q1 Q/t
(b) Change in Producer Surplus with Regulation
P1
P2
Q1Q2
S
S’
D
Q/t
$/Q
D
(c) Net Change in Economic Welfare with Regulation
Figure A-1. Economic Welfare Changes with Regulation: Consumer and Producer Surplus
A-4

In addition to the changes in consumer welfare, producer welfare also changes with the regulation. With the increase in market price, producers receive higher revenues on the quantity still purchased, Q2. In Figure A-1(b), area B represents the increase in revenues due to this increase in price. The difference in the area under the supply curve up to the original market price, area C, measures the loss in producer surplus, which includes the loss associated with the quantity no longer produced. The net change in producer welfare is represented by area B–C. The change in economic welfare attributable to the compliance costs of the regulation is the sum of consumer and producer surplus changes, that is, – (A) + (B–C). Figure A-1(c) shows the net (negative) change in economic welfare associated with the regulation as area D. However, this analysis does not include the benefits that occur outside the market (i.e., the value of the reduced levels of air pollution with the regulation). Including this benefit will reduce the net social cost of the regulation.
A-5

Appendix B
Sensitivity Analysis of Assumed Elasticities of Demand and Supply

EPA has estimated that the elasticity of demand for MON coatings is –0.5. The Agency expects the demand to be relatively inelastic because the commodities being produced are typically inputs to other production processes, and may be relatively small cost shares of the final products they are ultimately embodied in. EPA has assumed that the elasticity of supply is 1.
This Appendix presents a sensitivity analysis of these assumptions, varying the demand elasticity and the supply elasticity by 25 percent in either direction.
B-1
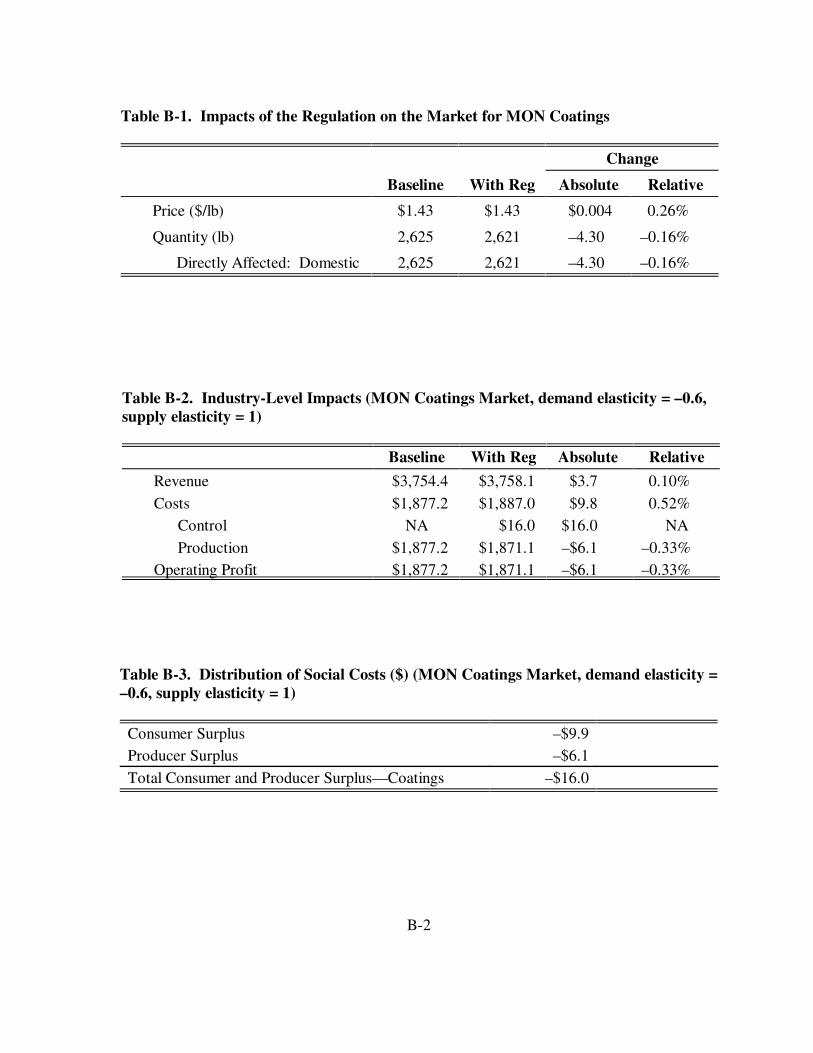
Table B-1. Impacts of the Regulation on the Market for MON Coatings
Change
Baseline With Reg Absolute Relative
Price ($/lb) $1.43 $1.43 $0.004 0.26%
Quantity (lb) 2,625 2,621 –4.30 –0.16%
Directly Affected: Domestic 2,625 2,621 –4.30 –0.16%
Table B-2. Industry-Level Impacts (MON Coatings Market, demand elasticity = –0.6, supply elasticity = 1)
Baseline With Reg Absolute Relative
Revenue $3,754.4 $3,758.1 $3.7 0.10%
Costs $1,877.2 $1,887.0 $9.8 0.52% Control NA $16.0 $16.0 NA
Production $1,877.2 $1,871.1 –$6.1 –0.33% Operating Profit $1,877.2 $1,871.1 –$6.1 –0.33%
Table B-3. Distribution of Social Costs ($) (MON Coatings Market, demand elasticity = –0.6, supply elasticity = 1)
Consumer Surplus –$9.9 Producer Surplus –$6.1
Total Consumer and Producer Surplus—Coatings –$16.0
B-2

Table B-4. Market-Level Impacts (MON Coatings Market, demand elasticity = –0.4, supply elasticity = 1)
Change
Baseline With Reg Absolute Relative
Price ($/lb) $1.43 $1.43 $0.004 0.31% Quantity (lb) 2,625 2,622 –3.05 –0.12%
Directly Affected: Domestic 2,625 2,622 –3.05 –0.12%
Table B-5. Industry-Level Impacts (MON Coatings Market, demand elasticity = –0.4, supply elasticity = 1)
Baseline With Reg Absolute Relative
Revenue $3,754.4 $3,761.7 $7.3 0.19%
Costs $1,877.2 $1,888.8 $11.6 0.62% Control NA $16.0 $16.0 NA
Production $1,877.2 $1,872.8 –$4.4 –0.23% Operating Profit $1,877.2 $1,872.8 –$4.4 –0.23%
Table B-6. Distribution of Social Costs ($) (MON Coatings Market, demand elasticity = –0.4, supply elasticity = 1)
Consumer Surplus –$11.6
Producer Surplus –$4.4 Total Consumer and Producer Surplus—Coatings –$16.0
B-3

Table B-7. Market-Level Impacts (MON Coatings Market, demand elasticity = –0.5, supply elasticity = 1.25)
Change
Baseline With Reg Absolute Relative
Price ($/lb) $1.43 $1.43 $0.004 0.30%
Quantity (lb) 2,625 2,621 –3.99 –0.15%
Directly Affected: Domestic 2,625 2,621 –3.99 –0.15%
Table B-8. Industry-Level Impacts (MON Coatings Market, demand elasticity = –0.5, supply elasticity = 1.25)
Baseline With Reg Absolute Relative
Revenue $3,754.4 $3,760.1 $5.7 0.15%
Costs $2,085.8 $2,096.1 $10.3 0.49%
Control NA $16.0 $16.0 NA
Production $2,085.8 $2,080.1 –$5.7 –0.27%
Operating Profit $1,668.6 $1,664.1 –$4.6 –0.27%
Table B-9. Distribution of Social Costs ($) (MON Coatings Market, demand elasticity = –0.5, supply elasticity = 1.25)
Consumer Surplus –$11.4 Producer Surplus –$4.6
Total Consumer and Producer Surplus—Coatings –$16.0
B-4
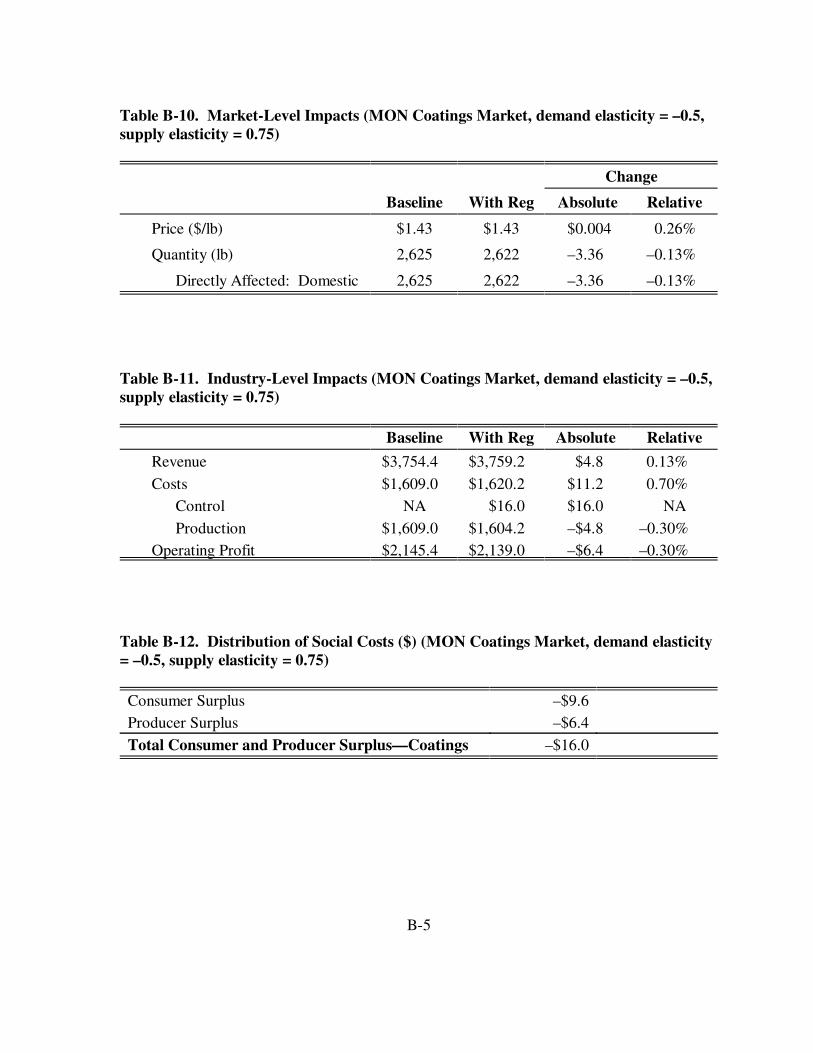
Table B-10. Market-Level Impacts (MON Coatings Market, demand elasticity = –0.5, supply elasticity = 0.75)
Change
Baseline With Reg Absolute Relative
Price ($/lb) $1.43 $1.43 $0.004 0.26%
Quantity (lb) 2,625 2,622 –3.36 –0.13%
Directly Affected: Domestic 2,625 2,622 –3.36 –0.13%
Table B-11. Industry-Level Impacts (MON Coatings Market, demand elasticity = –0.5, supply elasticity = 0.75)
Baseline With Reg Absolute Relative
Revenue $3,754.4 $3,759.2 $4.8 0.13%
Costs $1,609.0 $1,620.2 $11.2 0.70% Control NA $16.0 $16.0 NA
Production $1,609.0 $1,604.2 –$4.8 –0.30% Operating Profit $2,145.4 $2,139.0 –$6.4 –0.30%
Table B-12. Distribution of Social Costs ($) (MON Coatings Market, demand elasticity = –0.5, supply elasticity = 0.75)
Consumer Surplus –$9.6 Producer Surplus –$6.4
Total Consumer and Producer Surplus—Coatings –$16.0
B-5

Appendix C
Small Business Screening Sensitivity Analyses
B-6

The small business screening analysis presented in Section 5 is based on an examination of impacts on companies owning MON coatings facilities. This section presents a sensitivity analysis in which the effects of the coating and chemical regulations are combined. Because they are likely to own multiple facilities, large firms are more likely than small firms to be affected by both the coatings and other miscellaneous organic chemicals regulations. The combined impact of both regulations, then, may result in no difference between the impacts of the MON regulation on large and small firms. The combined analysis, presented in Section E.2 of this appendix, leads to the same basic conclusion as the analysis in the main body of this report: large businesses will experience slightly milder effects from the regulation than small businesses.
Table C-1 reports the combined total compliance costs of the regulation of facilities that manufacture miscellaneous organic chemicals of any kind, including those that produce coatings and those that produce other chemicals using batch and/or continuous processes. The table also shows the number of companies affected at the 1 percent and 3 percent levels and summary statistics of the CSRs of small companies. As Table C-1 shows, the combined impact of both the regulation of coatings manufacturers and of other miscellaneous organic chemicals manufacturers does not appear more significant than the individual impacts of the regulation did, largely because small firms are less likely than large firms to own facilities affected by both regulations. Figures C-1(a) and (b) illustrate the distribution of these ratios across small and large companies with sales data.
The aggregate compliance costs of the regulation of facilities producing miscellaneous organic chemicals total $12.6 million for small businesses (see Table C-1). RTI obtained sales data for 65 of the 72 small companies that which own affected facilities, or 90 percent. Six small companies (8 percent) own facilities that will be affected by both regulations. For small companies, the annual compliance costs for small businesses range from 0 to 9.32 percent of sales. The average (median) compliance CSR is 1.19 (0.51) percent for the identified small businesses with sales data. As shown, 12 small companies are affected at the 1 percent to 3 percent level and seven small companies are affected at the 3 percent level. In contrast, only one of the 109 large companies that own facilities affected by one or both of the regulations will find compliance costs to be greater than 1 percent of sales.
Table C-2 shows that the average and median profit margins of firms owning facilities that produce coatings will decrease more for small firms than for large firms. Figures C-2(a) and (b)
C-1

Tab
le C
-1.
Sum
mar
y St
atis
tics
for
SB
RE
FA
Scr
eeni
ng A
naly
sis:
Com
bine
d Im
pact
of
the
Reg
ulat
ion
of t
he
Man
ufac
ture
of
Coa
ting
s an
d O
ther
Mis
cella
neou
s O
rgan
ic C
hem
ical
s
Smal
l L
arge
A
ll C
ompa
nies
Tot
al n
umbe
r of
com
pani
es
72
109
181
Ann
ual c
ompl
ianc
e co
sts
($10
6 /yr)
$1
2.6
$82.
3 $9
4.9
Num
ber
Shar
e N
umbe
r Sh
are
Num
ber
Shar
e
Com
pani
es w
ith
sale
s da
ta
65
109
174
Com
plia
nce
cost
s ar
e <1
% o
f sa
les
46
71%
10
8 99
%
154
89%
Com
plia
nce
cost
s ar
e 1
to 3
% o
f sa
les
12
18%
1
1%
13
7%
� �
Com
plia
nce
cost
s ar
e 3%
of
sale
s 7
11%
0
0%
7 4%
Com
plia
nce
cost
-to-
sale
s ra
tios
Ave
rage
1.
19%
0.
07%
0.
49%
Med
ian
0.51
%
0.02
%
0.06
%
Max
imum
9.
32%
1.
45%
9.
32%
Min
imum
0.
00%
0.
00%
0.
00%
Not
e: A
ssum
es n
o m
arke
t res
pons
es (
i.e.,
pric
e an
d ou
tput
adj
ustm
ents
) by
reg
ulat
ed e
ntiti
es.
C-2

0%
20%
40%
60%
80%
100% F
req
uen
cy
0% 0 - 0.05 - 1 - 3% 3 - 5% 5 - 7% 7 - 10% 10 - 15 - >20% .05% 1% 15% 20%
CSR Range
(a) Small Companies
0%
20%
40%
60%
80%
100%
Fre
qu
ency
0% 0 - .05% 0.05 -1%
1 - 3% 3 - 5% 5 - 7%
CSR Range
7 - 10% 10 -15%
15 -20%
>20%
(b) Large Companies
Figure C-1. Distribution of Cost-to-Sales Ratios
C-3

Table C-2. Profit Margins With and Without Combined Regulation of Coatings Manufacturers and Manufacturers of Other Miscellaneous Organic Chemicals
Small Large All Companies Companies Companies
Profit margins without regulation
Average 3.69% 5.81% 5.02%
Median 3.00% 4.50% 4.00%
Maximum 18.53% 82.74% 82.74%
Minimum –0.24% –13.92% –13.92%
Number of firms with profit margin less 1 4 5 than zero
Profit margins with regulation
Average 2.50% 5.74% 4.53%
Median 2.37% 4.42% 3.69%
Maximum 18.52% 82.73% 82.73%
Minimum –6.62% –13.95% –13.95%
Number of firms with profit margin less 6 4 10 than zero
show the distribution of profit margins for small and large firms under regulation. Three small coatings businesses are projected to incur costs exceeding their estimated baseline profits. Two small businesses owning MON chemical facilities are estimated to incur costs exceeding their baseline profits.
C-4

0%
20%
40%
60%
80%
100% F
req
uen
cy
<0 0% 0 - 0.05 - 1 - 3% 3 - 5% 5 - 7% 7 - 10% 10 - >15% .05% 1% 15%
Profit Margin Range
(a) Small Companies
0%
20%
40%
60%
80%
100%
Fre
qu
ency
<0% 0% 0 -.05%
0.05 - 1 - 3% 3 - 5% 5 - 7% 1%
Profit Margin Range
7 - 10% 10 -15%
>15%
(b) Large Companies
Figure C-2. Distribution of Profit Margins With Regulation
C-5

Appendix D
Industry Profile Listed by SIC/NAICS Code
The MON rulemaking will affect facilities and companies producing miscellaneous organic chemical products and coatings. EPA’s data do not permit clearly identifying the marketed commodities produced by these facilities or the production processes used. EPA is able to determine the general types of products produced, based on the Standard Industrial Classification (SIC) code identified for each facility. This section presents profiles of several industries as identified by their SIC codes. These SIC codes represent the industries for the majority of potentially affected facilities.
D.1 Paints and Allied Products
The paint and allied products industry is relatively small when compared to other manufacturing industries. In 1997, the sector (SIC 2851, NAICS 325510) shipped $19,221.7 million dollars worth of products. All dollar values are 1998 dollars unless otherwise indicated. This industry supplies essential products to major manufacturing and consumer industries from automobiles to home furnishings.
Typical products manufactured by the industry include paints (ready-made and paste), varnish, lacquers, enamels and shellac putties, wood filters and sealers, paint and varnish removers, paint brush cleaners, and other allied paint products.
Three market segments account for the vast majority of output: architectural coatings (SIC 28511), original equipment manufacturer (OEM) product coatings (SIC 28512), and special purpose coatings (SIC 28513). While SIC 2851 grew 16.4 percent over the period 1987 to 1995, architectural coatings grew 20.9 percent, OEM grew 18.2 percent, and special purpose coatings grew 24.0 percent in real terms. Overall, despite the recession in the early 1990s, the value of shipments increased 25.8 percent from 1987 to $19,221.7 million in 1997 (see Table D-1).
Architectural coatings accounted for 33.7 percent of this industry’s total value of shipments in 1995. Commonly referred to as house paint, the architectural coatings sector generates nearly half of the industry’s revenue.
In 1995, sales of OEM constituted 29.3 percent of the industry’s total value of shipments. OEM products are often custom formulated to meet applications specified by the end user. Primary users of OEM paints are automobile, appliance, equipment manufacturing, and furniture industries.
D-1

Table D-1. Value (1998 $106) and Quantity of Shipments (106 gallons)
Year SIC 2851 SIC 28511 SIC 28512 SIC 28513 Value of Shipments
1987 15,279.7 5,106.8 4,549.9 2,557.2
1988 15,388.7 5,034.3 4,667.8 2,560.7 1989 14,966.5 4,959.4 4,624.9 2,732.7
1990 15,508.8 5,351.9 4,392.3 3,029.6 1991 15,367.5 5,283.1 4,318.0 3,138.0
1992 16,282.1 5,615.6 4,657.4 3,047.0 1993 17,382.6 6,089.1 5,192.2 3,185.5
1994 18,415.5 6,230.7 5,364.7 3,383.2 1995 18,338.2 6,174.6 5,379.7 3,171.4
1996 18,630.5 NA NA NA 1997 19,221.7 NA NA NA
Quantity of Shipments 1987 1,183.6 527.0 340.2 145.5
1988 1,229.0 535.9 365.7 154.4 1989 1,239.7 537.5 359.9 179.0
1990 1,281.9 558.4 338.6 195.6 1991 1,226.8 537.9 320.4 179.5
1992 1,270.5 562.3 334.0 169.5 1993 1,336.5 608.1 356.6 179.0
1994 1,431.1 644.8 372.9 193.8 1995 1,408.3 621.1 376.2 195.1
1996 NA NA NA NA 1997 NA NA NA NA
NA = not available
Sources: U.S. Department of Commerce, Bureau of the Census. 1995f. 1992 Census of Manufactures, Industry Series: Paints and Allied Products. Washington, DC: Government Printing Office.
U.S. Department of Commerce, Bureau of the Census. 1995i. 1993 Annual Survey of Manufactures. Washington, DC: Government Printing Office.
U.S. Department of Commerce, Bureau of the Census. 1997a. 1995 Annual Survey of Manufactures. Washington, DC: Government Printing Office.
U.S. Department of Commerce, Bureau of the Census. August 1997b. 1996 Current Industrial Reports: Paint, Varnish, and Lacquer. Washington, DC: Government Printing Office.
U.S. Department of Commerce, Bureau of the Census. 1999h. 1997 Economic Census. Washington,
D-2

Special purpose coatings shipments amounted to 17.3 percent of the 1995 industry receipts. While similar to architectural coatings in that this sector could be classified as stock or shelf goods, the special purpose coatings sector formulates its product for specific applications and/or environmental conditions and typically sells directly to the end user. The primary markets for its products are automotive, machine refinishing, industry maintenance, bridge and traffic markings, and marine.
D.1.1 Supply Side of the Industry
D.1.1.1Production Processes
Paints primarily comprise pigments, resins, and solvents. The industry purchases the majority of its inputs from other manufacturers in the chemical industry (SIC 28). At one time, lead was a primary component of paint; however, its use was banned in the 1980s because of concerns over lead poisoning from paint chips. Most paints comprise four basic groups of chemical raw materials: binders and resins, pigments and extenders, solvents, and additives. When a paint is applied to a surface, the solvents begin to evaporate while the binder, pigments, and additives remain on the surface and harden to form a solid film. The chemical and physical properties of paints are directly related to the choice and concentration of raw materials determined during the production process.
The particular raw material ingredients used in paints are chosen not only for their appearance and performance attributes, but also for their compatibility with each other and the ease with which they are mixed together to create a stable and homogenous paint product without undergoing significant chemical reactions during the process. Although some chemical reactions occur during the mixing process, the manufacturing process results in a near 100 percent yield. No reactions take place that produce unwanted chemical by-products. The manufacturing of paints is concerned with the proper blending and mixing of raw materials to ensure that the ingredients are evenly dispersed in the finished paint.
Paints are divided into two categories: water- and solvent-based paints and powder paint.
Water- and Solvent-Based Paints Production. The manufacturing process for both water- and solvent-based paints begins with weighing-out and premixing batch ingredients. Next, the pigment particles are wet with resins and then dispersed in the paint system. For water-based paints, surfactants must be added to prevent flocculation. This process may take from 10 minutes to 48 hours to complete.
D-3
After the pigment has dispersed through the resin, the paste is thinned with a solvent (such as toluene or xylene) or more resin. After a second run through the system, the thinned paste is transferred to a let-down tank to receive more additives. The primary difference between solvent- and water-based paints is that solvent-based paints receive the binder during the dispersion process. Water-based paints receive the binder while in the let-down tank. After leaving the let-down tank, the paint undergoes further thinning and filtration before flowing into the canning apparatus.
When the manufacturer decides to change the color or content of the product, the tanks and equipment are washed with solvents to remove residue and any buildup that may adversely affect the quality of the paint.
Powder-Based Paints. To manufacture powdered paints, the dry components of powder-based paints (40 to 50 percent binder, 40 to 50 percent pigments and filler, and 1 to 2 percent additives) are transferred from holding areas, weighed-out, and then placed into a mixer. After being mixed, the material is then transferred to a double screw extruder where it is processed at 100°C to 120°C. The components exit the machine in sheet form. The sheet is allowed to cool before being chipped and eventually pulverized and sieved into a fine powder with a mean size of 50 µm. The powder is then bagged for shipment.
The most significant development in the modern paint industry is the development of waterborne paints, or latex paint. Prior to the 1950s, the majority of paint sold was solvent-or oil-based. By the 1990s, waterborne paints accounted for over 75 percent of gallonage. Other industry trends include high solids that contain more resins and pigments than solvents, and the aforementioned powder paints that are sprayed on dry and electrically adhere to the surface, almost eliminating the need for organic solvents.
D.1.1.2Major By-products and Co-products
The chemical by-products associated with manufacturing paints and allied products are few because the manufacturing process does not involve chemical reactions. In those instances where a minor chemical reaction does occur, chiefly during the mixing stage, the resultant reaction is not significant enough to reduce the yield. However, chemical emissions do result from the transportation and handling of the product.
Half of the chemical by-products are generated during the manufacturing process when the ingredients used to create the product change. The tanks are cleaned with solvents that produce volatile organic compounds (VOCs) as they evaporate. Any solvents gathered after the cleansing process is complete are distilled onsite. Wastewater is filtered to remove
D-4

solids before being discharged to a publicly owned treatment works (POTW) as nonhazardous waste. Still bottoms and filters are collected and dried before being sent offsite for treatment and disposal as nonhazardous waste.
The remaining emissions associated with paints and allied products result during the application process. After the product is applied, the solvents and other ingredients evaporate to leave behind the protective or decorative film. During evaporation, VOCs and hazardous air pollutants (HAPs) are emitted, constituting the second half of chemical by-products associated with this industry.
Co-products of paints and allied products are caulking and spackling compounds.
D.1.1.3Types of Output
The various products produced by the paint and allied products industry can be divided and described as follows:
• Architectural coatings: Protective and decorative coatings applied onsite to the interior or exterior surfaces of industrial, commercial, institutional, or residential buildings for ordinary use and exposure.
– Clear finishes and spar varnishes: Transparent protective and/or decorative films, including urethane coatings, natural varnishes, and shellac varnishes.
– Eggshell finish: Low sheen (semimatte) surface that exhibits its surface reflectance (gloss) similar to that of an eggshell, between flat and semigloss.
– Enamels: Normally high gloss, but increasingly less glossy, these topcoats are used for their ability to form a smooth surface.
– Primer: A paint designed to provide adequate adhesion to new surfaces and to meet special requirements such as absorption and/or corrosion control.
– Stains: Transparent and semitransparent solutions or suspensions of coloring matter in a vehicle designed to color a surface without hiding it or to color a material into which it was incorporated.
– Solvent: A volatile nonaqueous liquid used to dissolve or disperse the coating constituents. This liquid evaporates during the drying process and does not become part of the dried coating.
– Lacquers: Coatings composed of synthetic thermoplastic materials dissolved in organic solvent and dried primarily by solvent evaporation. Typical
D-5

lacquers include those based on nitrocellulose and other cellulose derivations, vinyl resins, and acrylic resins.
– Undercoat: A coat of paint applied on a new wood, over a primer or previous coat of paint, to improve the seal and to serve as a base for a topcoat.
– Exterior coatings: Coatings that are expected to possess reasonable durability when exposed to natural weathering.
• OEM coatings: Coatings designed specifically for an OEM to meet application and product requirements to be applied during the manufacturing process.
– Powder coatings: 100 percent solid coatings applied as dry powders and subsequently formed into a film with heat.
– Electrical insulating coatings: Often used in conjunction with mica and fabrics, these coatings provide insulation for electrical equipment and have a high resistance to electrical conduction.
• Special purpose coatings: These coatings differ from architectural coatings in that they are formulated for special applications and/or environmental conditions such as extreme temperatures, chemicals, and fumes.
– Industrial new construction and maintenance paints: High-performance coatings formulated to withstand extreme uses, such as environmental elements, abrasion, fungi, chemicals, corrosion, electrical, or solvent exposure. They are also used to protect public utilities’ facilities, railroads, roads and highways, and industrial interiors and exteriors.
– Marine paints including ships and offshore facilities: Paints and coatings designed to withstand water immersion and exposure to marine atmosphere.
– Traffic paints: Marking paints formulated to withstand the wear of vehicular traffic and to be highly visible at night. These paints are used to mark traffic lanes and crosswalks, for example. Also includes shelf goods and paints designed for the highway departments.
– Refinish paints: Coatings formulated specifically to meet certain product and application requirements and sold to the refinishing trade.
– Aerosol paints: Paints packaged in an aerosol can under pressure.
D-6

D.1.1.4Costs of Production
The inputs for paints and allied products include various resins, solvents, pigments, extenders, binders, and other additives. In constant 1998 dollars, the cost of materials rose 27 percent over the period 1987 to 1997 to $9947.9 million (see Table D-2). The higher cost of materials reflects the changing content of paint products. The use of higher solids content and environmental concerns necessitated using more expensive ingredients and using epoxies in paint. Prices for acetone, benzene, chlorine, and fiber-grade increased; however, phenol prices remained steady. The increasing cost of raw materials has been a concern for the industry.
The amount of labor employed by the industry dropped from 55,200 in 1987 to 52.7 in 1997, while the industry’s payroll increased by $289.5 million (1998 dollars), indicating that the manufacturing process became increasingly mechanized and required skilled labor. The rise in the level of employment from 1995 to 1997 is expected to be temporary. Industry analysts expect the number of jobs at the manufacturing level to decrease by a minimum of 30 percent by the year 2005 (Gale Research, 1995). Energy costs averaged $118.5 million a year during the period 1987 to 1997.
D.1.1.5Capacity Utilization
Full production capacity is broadly defined as the maximum level of production an establishment can obtain under normal operating conditions. The capacity utilization percentage is the ratio of the actual operations to the full production levels. Table D-3 presents historical trends in capacity utilization in this industry. The capacity utilization ratio for the paints and allied products industry was 66 percent in 1997, indicating that plants were operating below potential.
D.1.2 Demand Side of the Industry
D.1.2.1Product Characteristics
Modern chemistry has produced coatings that add aesthetic value and are also resistant to natural elements, or electrical conduction, or wear and tear by vehicles. The paint and allied products industry is able to formulate a coating to fulfill almost any request a client may have. In the last 20 years, the industry has made major advances in the durability and quality of coatings.
D-7

Table D-2. Inputs Used in Paints and Allied Products Industry
Labor New Capital
Quantity Payroll Materials Investment Energy Year (103) (1998 $106) (1998 $106) (1998 $106) (1998 $106)
1987 55.2 1,794.2 7,830.8 330.9 122.1
1988 56.9 1,779.5 8,061.3 287.3 133.4
1989 55.0 1,761.7 7,991.1 263.9 120.6
1990 53.9 1,772.8 8,077.8 295.5 117.6
1991 51.1 1,690.6 8,014.9 275.6 117.3
1992 51.2 1,860.9 8,488.3 315.6 117.4
1993 50.2 1,839.2 8,985.9 277.9 124.7
1994 50.0 2,020.5 9,579.4 295.9 104.7
1995 52.4 2,024.7 9,796.7 426.4 109.4
1996 51.1 1,979.4 10,050.6 411.9 110.6
1997 52.7 2,083.7 9,947.9 NA 129.7
NA = Not available
Sources: U.S. Department of Commerce, Bureau of the Census. 1990f. 1988 Annual Survey of Manufactures. Washington, DC: Government Printing Office.
U.S. Department of Commerce, Bureau of the Census. 1992a. 1990 Annual Survey of Manufactures. Washington, DC: Government Printing Office.
U.S. Department of Commerce, Bureau of the Census. 1995f. 1992 Census of Manufactures, Industry Series: Paints and Allied Products. Washington, DC: Government Printing Office.
U.S. Department of Commerce, Bureau of the Census. 1995i. 1993 Annual Survey of Manufactures. Washington, DC: Government Printing Office.
U.S. Department of Commerce, Bureau of the Census. 1997a. 1995 Annual Survey of Manufactures. Washington, DC: Government Printing Office.
U.S. Department of Commerce, Bureau of the Census. 1999a. 1997 Census of Manufactures, Industry Series. Washington, DC: Government Printing Office.
D-8

D.1.2.2Uses and Consumers of Products
The coatings industry is essential to nine other major U.S. industries: automobiles, trucks and buses, metal cans, farm machinery and equipment, construction machinery and equipment, metal furniture and fixtures, wood furniture and fixtures, major appliances, and coil coating (high speed application of industrial coatings to continuous sheets, strips, and coils of aluminum or steel) (U.S. Department of Commerce, 1995f).
The quantity of architectural coatings demanded is directly related to the number of building sales and starts for a given period. When construction slows on residential, commercial, and industrial structures, the demand for architectural coatings slows down as well, albeit much later because of lag effects. Special purpose coatings are used in much the same way as architectural coatings, but they are formulated for special applications. Typical consumers and uses of these coatings include highway departments for road markings and bridges, ship builders for hulls, automakers for cars, and refinishers for refinishing.
OEM coatings are predominantly used during the manufacturing process of a product. Powder coatings and electrical insulating coatings are the most common products manufactured by this industrial sector. The demand for powder coats is expected to drop off due to a slowdown in durable goods production, such as home appliances (the largest market for powdered products), and a drop in conversion from liquid to powder paints. Table D-7 in Section D.1.4 presents historical data on paint production, consumption, and net exports.
D.1.2.3Substitution Possibilities
There are few substitutions for coatings. Within the industry, the 20 percent growth of powdered paints in the 1980s quelled the demand for liquid products. Powdered paints are popular because of environmental concerns. The Clean Air Act and other regulations favored powdered paints because they do not emit any VOCs during the application process. Manufacturers of liquid coatings responded to both the regulations and the popularity of powdered coatings by increasing the amount of pigments and resins in their product and reducing the amount of solvents added. Subsequently, the demand for powdered paints decreased somewhat.
D-9

D.1.3 Organization of the Industry
D.1.3.1Firm Characteristics
In 1997, the majority (61 percent) of facilities producing paints and allied products were small facilities with fewer than 20 employees (see Table D-4). However, these facilities contributed only 8.2 percent to the total value of shipments. As Table D-4 indicates, 907 facilities had fewer than 20 employees. These small entities are typically regional paint companies that supply local hardware stores or home repair centers.
Ownership concentration in this industry decreased from 1987 to 1992, but increased again from 1992 to 1997. In 1987, 1,121 companies operated 1,426 facilities in SIC 2851. By 1992, 1,130 companies operated 1,418 facilities in this industry. In 1997, less than 1,206 companies operated 1,486 facilities. To remain competitive, many producers have invested in research and development to develop a better product.
In 1992, the five largest coatings companies were Sherman-Williams Co. ($2,747.8 million in sales), Valspar ($683.5 million), RPM ($552.1 million), Grow Group ($416.2 million), and Standard Brands Paint ($253.0 million). These companies accounted for 31.1 percent of 1992 sales of coatings.
The four- and eight-firm concentration ratios (CR4 and CR8) and Herfindahl-Hirschmann indexes (HHI) are used to assess the market structure of an industry. The CR4 for the paints and allied products industry was 29 in 1992, meaning that the top four firms accounted for only 29 percent of the industry’s total sales. The CR8 for the same year was 43 (U.S. Department of Justice, 1992). This indicates that the paint and allied products market is fairly competitive. Furthermore, the HHI for paints and allied products was 305 in 1992. According to the Department of Justice’s (1992) Horizontal Merger Guidelines, industries with HHIs below 1,000 are considered to be unconcentrated (i.e., more competitive). Therefore, firms in the paints industry are more likely to be price takers. Table D-5 shows the CR4, CR8, HHI, number of companies, and number of facilities data for SIC 2851 for 1992.
D-10

Table D-4. Size of Establishments and Value of Shipments for SIC 2851
1992 1997
Value of Value of Establishments With an Number of Shipments Number of Shipmentsa
Average of Facilities (1998 $106) Facilitiesa (1998 $106)
1 to 4 employees 329 170.7 412 220.9
5 to 9 employees 247 368.1 245 438.9
10 to 19 employees 264 882.8 250 920.8
20 to 49 employees 306 2,378.8 296 2,495.3
50 to 99 employees 146 3,389.8 153 3,948.2
100 to 249 employees 100 5,537.4 105 6,723.8
250 to 499 employees 23 3,554.4 20 D
500 to 999 employees 1 D 3 935.0
1,000 to 2,499 employees 2 D 2 D
Total 1,418 16,282.1 1,486 19,221.7
D = undisclosed
a Data are estimates based on the 1997 Economic Census Report for the NAICS-coded industry 325510. Estimates based on the fact that 99.47% of the value of shipments for the NAICS-coded industry are derived from firms classified under SIC code 2851.
Sources: U.S. Department of Commerce, Bureau of the Census. 1990e. 1987 Census of Manufactures, Industry Series: Paints and Allied Products. Washington, DC: Government Printing Office.
U.S. Department of Commerce, Bureau of the Census. 1995f. 1992 Census of Manufactures, Industry Series: Paints and Allied Products. Washington, DC: Government Printing Office.
D-11

Table D-5. Measures of Market Concentration by SIC: 1992
SIC Description CR4 CR8 HHI Number of Companies
Number of Facilities
SIC 2851 Paints and Allied Products
29 43 305 1,130 1,418
Sources: U.S. Department of Commerce, Bureau of the Census. 1995a. Concentration Ratios in Manufacturing. Washington, DC: Government Printing Office.
U.S. Department of Commerce, Bureau of the Census. 1995f. 1992 Census of Manufactures, Industry Series: Paints and Allied Products. Washington, DC: Government Printing Office.
D.1.3.2Geographical Distribution
Facilities involved in the coatings industry are concentrated in states with heavy involvement in manufacturing. Ohio, California, and Illinois alone accounted for 35.3 percent of the total value of shipments and 33 percent of total employment in the industry (see Table D-6).
D.1.4 Markets and Trends
D.1.4.1Production
Table D-7 shows production and consumption trends for the period 1987 to 1994. There has been mild growth in the percentage of domestic production of paints and allied products being exported. Domestic consumption of paints and allied products increased by 10.7 percent, while domestic production increased by 14.1 percent.
Domestic. In 1996, the U.S. coatings industry produced 1,438.6 million gallons of product worth $18,630.5 million in 1998 dollars. Growth is projected to be roughly 2 to 3 percent a year through the year 2000. Markets slated for the most growth are product finishes and specialty coatings (DRI McGraw Hill, 1998).
D-12

Table D-6. Industry Statistics for the Top Ten States for SIC 2851, 1992
Value of Facilities With Shipments Number of Fewer Than 20 Number of
State (1998 $106) Facilities Employees Employees
Ohio 2,014.7 79 36 6,000
California 1,912.3 189 127 5,400
Illinois 1,821.9 125 60 5,500
Michigan 1,012.9 76 49 3,200
Texas 997.6 84 55 2,500
Pennsylvania 952.4 65 34 3,000
New Jersey 827.9 91 52 2,800
Georgia 693.0 45 25 1,500
Kentucky 639.5 26 10 1,200
Maryland 504.2 20 10 1,200
USA 16,282.1 1,418 840 51,200
Sources: U.S. Department of Commerce, Bureau of the Census. 1995f. 1992 Census of Manufactures, Industry Series: Paint and Allied Products. Washington, DC: Government Printing Office.
Foreign. In 1996, foreign producers exported $1,215.6 million worth of pigments, paints, varnishes, and related materials (Standard International Trade Classification, SITC 533) to the United States. Major exporters to the United States include NAFTA members, Germany, Japan, and Belgium.
D.1.4.2Consumption
Domestic. Domestic consumption of foreign products is increasing, particularly since the liberalization that occurred because of NAFTA. Another significant factor affecting domestic consumption of paints is the do-it-yourself orientation of Americans. Due to this factor, the consumption of architectural coatings was expected to remain steady and possibly increase through the year 2000.
D-13

Table D-7. Production and Consumption Trends for SIC 2851, 1987 to 1994 (1998 $106)
Domestic Net Year Domestic Production Consumption Exports
1987 14,180.4 14,037.0 143.4
1988 14,260.2 14,031.3 228.9
1989 14,415.9 14,046.4 369.5
1990 14,894.3 14,394.3 500.0
1991 14,325.0 13,724.9 600.1
1992 14,792.2 14,172.4 619.8
1993 15,680.4 15,053.3 627.0
1994 16,183.0 15,539.6 643.4
Note: Consumption = Domestic Production - Exports + Imports
Sources: U.S. Department of Commerce, International Trade Administration. 1989. 1989 U.S. Industrial Outlook. Washington, DC: Government Printing Office.
U.S. Department of Commerce, Bureau of the Census. 1995f. 1992 Census of Manufactures, Industry Series: Paint and Allied Products. Washington, DC: Government Printing Office.
U.S. Department of Commerce, Bureau of the Census. 1995i. 1993 Annual Survey of Manufactures. Washington, DC: Government Printing Office.
U.S. Department of Commerce, International Trade Administration. 1993. 1994 U.S. Industrial Outlook. Washington, DC: Government Printing Office.
U.S. Department of Commerce, Bureau of the Census. 1997a. 1995 Annual Survey of Manufactures. Washington, DC: Government Printing Office.
DRI McGraw Hill, Standard and Poor’s and U.S. Department of Commerce, International Trade Administration. 1998. U.S. Industry and Trade Outlook 1998. New York: McGraw Hill.
Foreign. In 1996, U.S. producers exported $2,392.2 million worth of paints, varnishes, pigments, and related materials (SITC 533). Asian, South American, and Western European markets have improved in the past 5 years, helping to stabilize the North American industry.
D-14

TECHNICAL REPORT DATA (Please read Instructions on reverse before completing)
1. REPORT NO.
EPA-452/R-03-022 2. 3. RECIPIENT’S ACCESSION NO.
4. TITLE AND SUBTITLE
Economic Analysis of Air Pollution Regulations: Miscellaneous Organic Coatings (MON Coatings): Final Report
5. REPORT DATE
August 2003
6. PERFORMING ORGANIZATION CODE
7. AUTHOR(S) 8. PERFORMING ORGANIZATION REPORT NO.
RTI Project Number 7647-004-384
9. PERFORMING ORGANIZATION NAME AND ADDRESS
RTI International Center for Regulatory Economics and Policy Research, Hobbs Bldg. Research Triangle Park, NC 27709
10. PROGRAM ELEMENT NO.
11. CONTRACT/GRANT NO.
68-D-99-024
12. SPONSORING AGENCY NAME AND ADDRESS
Steve Page, Director Office of Air Quality Planning and Standards Office of Air and Radiation U.S. Environmental Protection Agency Research Triangle Park, NC 27711
13. TYPE OF REPORT AND PERIOD COVERED
14. SPONSORING AGENCY CODE
EPA/200/04
15. SUPPLEMENTARY NOTES
16. ABSTRACT
This report evaluates the economic impacts of the Miscellaneous Organic Coatings NESHAP (MON Coatings) . The social costs of the rule are estimated by incorporating the expected costs of compliance in a partial equilibrium model and projecting the market impacts. The report also provides the screening analysis for small business impacts.
17. KEY WORDS AND DOCUMENT ANALYSIS
a. DESCRIPTORS b. IDENTIFIERS/OPEN ENDED TERMS c. COSATI Field/Group
economic impacts small business impacts social costs
Air Pollution Control Economic Impact Analysis Regulatory Flexibility Analysis
18. DISTRIBUTION STATEMENT
Release Unlimited
19. SECURITY CLASS (Report)
Unclassified 21. NO. OF PAGES
73
20. SECURITY CLASS (Page)
Unclassified 22. PRICE
EPA Form 2220-1 (Rev. 4-77) PREVIOUS EDITION IS OBSOLETE

Uni
ted
Sta
tes
Off
ice
of A
ir Q
ualit
y P
lann
ing
and
Sta
ndar
ds
Pub
licat
ion
No.
EP
A-4
52/R
-03-
022
Env
iron
men
tal P
rote
ctio
n A
ir Q
ualit
y S
trat
egie
s an
d S
tand
ards
Div
isio
n A
ugus
t 200
3 A
genc
y R
esea
rch
Tri
angl
e P
ark,
NC