economic analysis of underground coal gasification … analysis of underground coal gasification end...
TRANSCRIPT

Economic Analysis of Underground Coal Gasification End Product Market:
Australian Case Study Sayara Saliyeva ([email protected]) PhD Candidate International Energy Policy Institute, UCL Australia University College London
Prof. S. Simons ([email protected])
Dr. P. Lettieri ([email protected])
Dr. J. Menicucci ([email protected])

UCL Australia: UCL’s first international campus
“Helping to make Adelaide a global centre for sustainable energy policy and research”
IEA, 2009
2

• Research Drivers • What is UCG (Linc vs Carbon) • Worldwide/Australian Development • UCG End Products Variety
• Oxygen Blown UCG Ammonia/Urea Synthesis • Oxygen Blown UCG Methanol Synthesis
• Market Demand • Specifications and Assumptions • Capital Investment & Total Annual Operational
Cost • Future Work
Outline
3

Copyright Australian Energy Market Operator 2010
Bureau of Resources and Energy Economics 2013
0
5
10
15
20
25
30
Automotive Gasoline
Aviation turbine fuel
Automotive diesel
Lubricating oils &
greases
Day
s
Monthly average stocks of petroleum products consumption cover, days
0 50000 100000 150000 200000 250000
US
Russia
China
Australia
India
Coal Proved Reserves, Mt
Anthracite and bituminous
Sub-bituminous and lignite
Research Drivers
BP p.l.c. 2013 4

Research Drivers Resources
2.2% 2.3%
95.5%
∼18 Tt of coal
Couch 2009
5

What is UCG
6

What is UCG
Copyright © 2014 Carbon Energy Limited
7

Worldwide UCG Developments
8

Australian UCG Developments
9
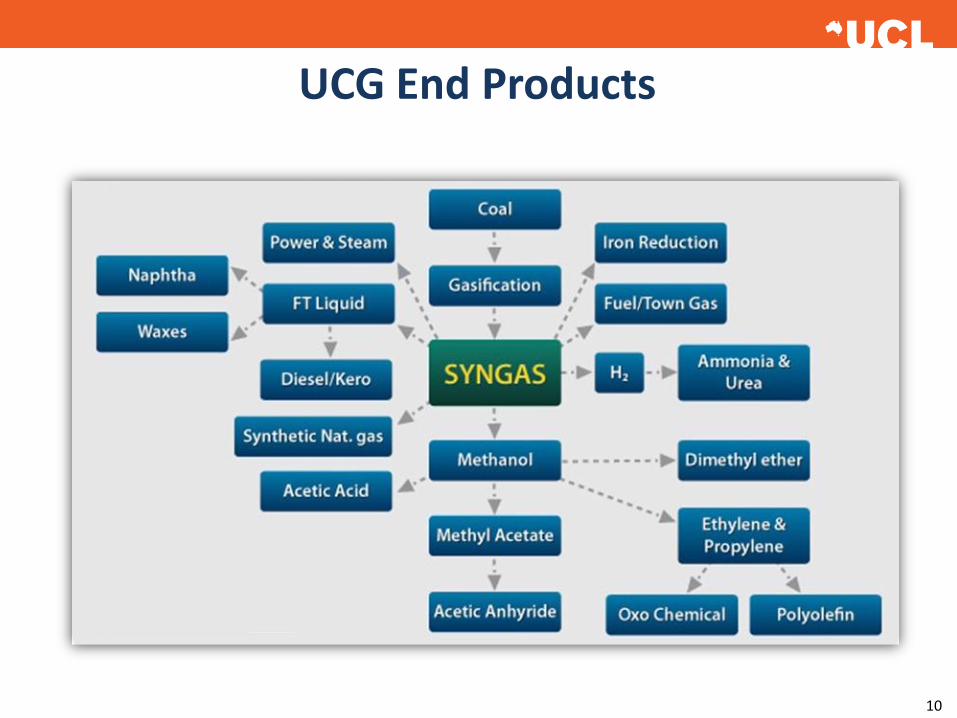
UCG End Products
10

Block flow diagram for Oxygen-blown UCG followed by Ammonia/Urea Synthesis
ASU: Air Separation Unit WGS: Water Gas Shift
11

Block flow diagram for Oxygen-blown UCG followed by Methanol Synthesis
ASU: Air Separation Unit
12
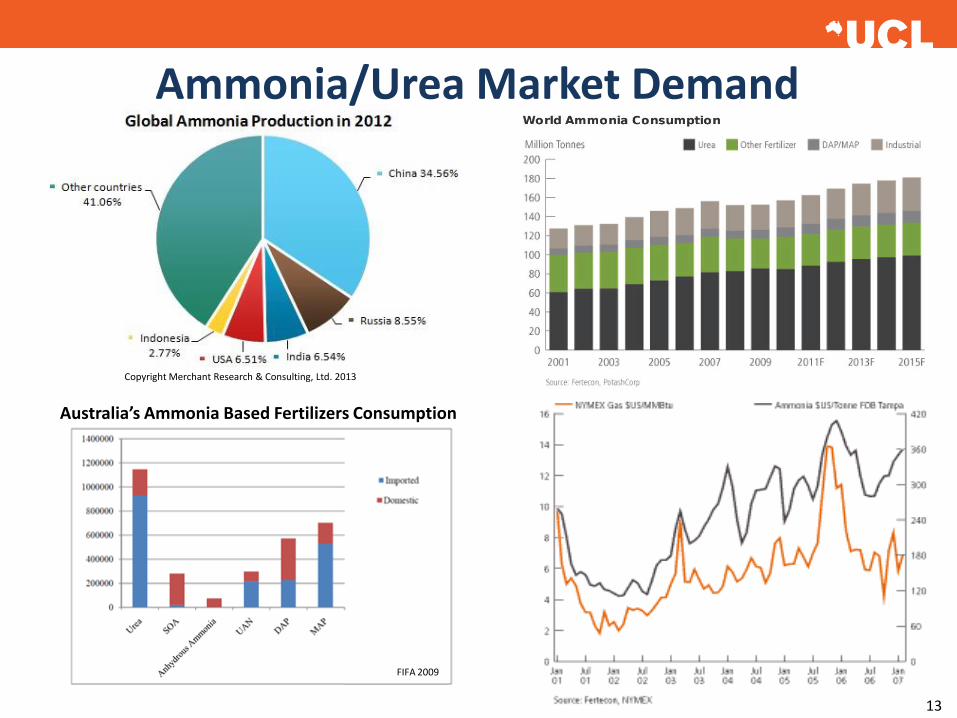
Copyright Merchant Research & Consulting, Ltd. 2013
Ammonia/Urea Market Demand
Australia’s Ammonia Based Fertilizers Consumption
FIFA 2009
13

Methanol Market Demand
14

Coal Related Specifications
Average coal seam depth, m 140
Average coal seam thickness, m 8
Cavity diameter, m 6
Cavity Length, m 1000
Cost of well drilling,
AUD/gasification channel 27,000
In situ coal density, t/m3 1.48
15
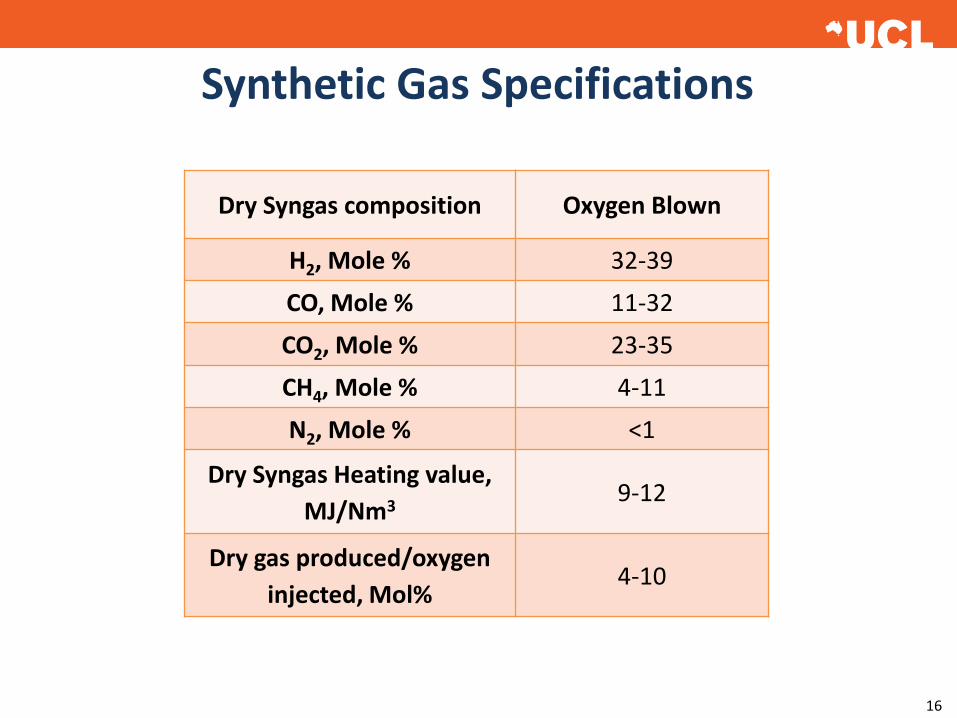
Synthetic Gas Specifications
Dry Syngas composition Oxygen Blown
H2, Mole % 32-39
CO, Mole % 11-32
CO2, Mole % 23-35
CH4, Mole % 4-11
N2, Mole % <1
Dry Syngas Heating value,
MJ/Nm3 9-12
Dry gas produced/oxygen
injected, Mol% 4-10
16

Urea Production 2NH3 + CO2 ↔ CO(NH2)2 + H2O
Ammonia Synthesis N2 + 3 H2 ↔ 2NH3
Water Shift Reaction CO + H2O ↔ CO2 + H2
Methanol Synthesis CO + 2H2 ↔ CH3OH
Methanol Synthesis CO2 + 3H2 ↔ CH3OH + H2O
Key Chemical Reactions
17

Plants Specifications
Plant life, years 30
Amount of urea production (∼import), Mt/yr 0.9
Urea plant availability, % 90
Amount of methanol production, Mt/yr 1.5
Methanol plant availability, % 90
18

Economic Assumptions
Oxygen injection rate, m3/min 122
Pipe diameter, m 0.15
Electricity Consumption by ASU, kWh/ton 425
Electricity price, $/kWh 0.11
Natural Gas Cost, c/MJ 2.02
19

Cost Estimation Down Stream Production
Cost Escalation
William’s Law
n
b
a
b
a
A
A
C
C
Cost Equipment Cost
Attribute - Size
Cost Exponent
20

Methane Separation Capital Cost $12,530,000/ $21,390,000
Methane Separation Operational Cost $2,520,000/ $4,303,000
Water Gas Shift Reactor Capital Cost $233,817/ $400,000
Water Gas Shift Reactor Operational Cost $10,200/ $17,400
Rectisol® Capital Cost $12,315,000/ $21,025,000
Rectisol® Operational Cost $2,360,000/ $4,029,000
Ammonia/Urea Synthesis Reactor Capital Cost $8,980,000
Ammonia/Urea Synthesis Reactor Operational
Cost $1,104,000
Methanol Synthesis Reactor Capital Cost $10,444,000
Methanol Synthesis Reactor Operational Cost $840,000
Economic Assumptions
21

Pipes and Accessories, % Capex 2.5
Project & Process Contingency, % Capex 20
Site facilities and equipment, % Capex 20
Engineering fees, % Capex 7.5
Pipes and accessories, % Opex 10
Salaries, % Opex 25
Maintenance labor and materials, % Opex 10
Assumptions
22

Capital Investment & Total Annual Operational Cost
Oxygen Blown
UCG
Ammonia/Urea
UCG
Methanol
Natural Gas
Ammonia/Urea
Natural Gas
Methanol
Production
Rate 900,000 t/yr 1,500,000 t/yr 2,000,000 t/yr 1,800,000 t/yr
Total Capital
Investment $222,520,000 $422,750,000 $3,500,000,000 $1,000,000,000
Total Annual
Cost $157,925,000 $380,800,000 - -
Production
Cost $191.56 $272 .20 - -
23

Future Work
• Refine Current Model • Various End Products Evaluation • Poly-generation
24

Acknowledgement
Financial Support from BHP Billiton under BHP Billiton Scholarship is gratefully acknowledged. However, current work does not necessarily reflect the views of BHPB.
Prof. S. Simons International Energy Policy Institute, UCL Australia University College London
Dr. P. Lettieri Department of Chemical Engineering University College London
Dr. J. Menicucci School of Engineering, Nazarbayev University
25

Thank you