economic and fiscal update october 2015 - azdor
TRANSCRIPT
Economic and Fiscal UpdateOctober 2015
L. Wm. Seidman Research Institute
1
Topics for the Day
• US Economy Issues• How we got here…• Hot button issues and pressures of the day
• Arizona Economy Issues• How we got here
• Recent Trends• Future Trends• Areas of Growth• Strategies for the Future
• Budget Issues• Historical Perspectives• Current issues and outlook
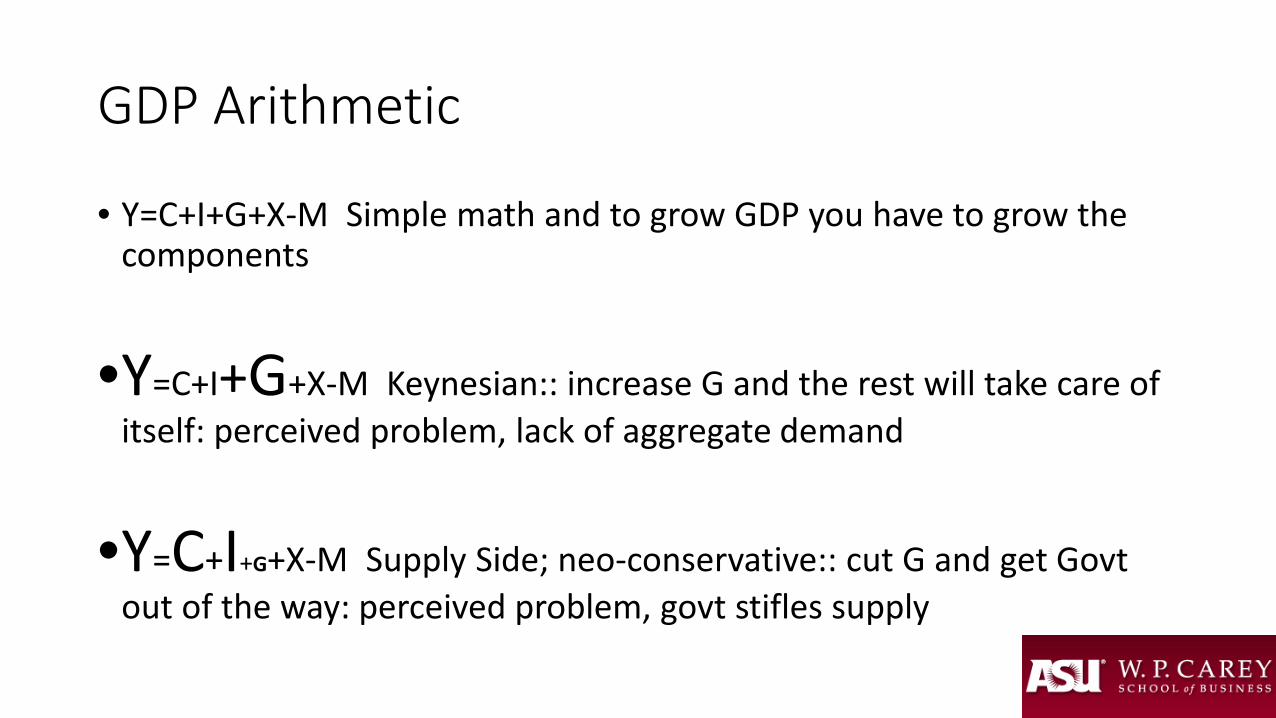
GDP Arithmetic
• Y=C+I+G+X-M Simple math and to grow GDP you have to grow the components
•Y=C+I+G+X-M Keynesian:: increase G and the rest will take care of itself: perceived problem, lack of aggregate demand
•Y=C+I+G+X-M Supply Side; neo-conservative:: cut G and get Govt out of the way: perceived problem, govt stifles supply


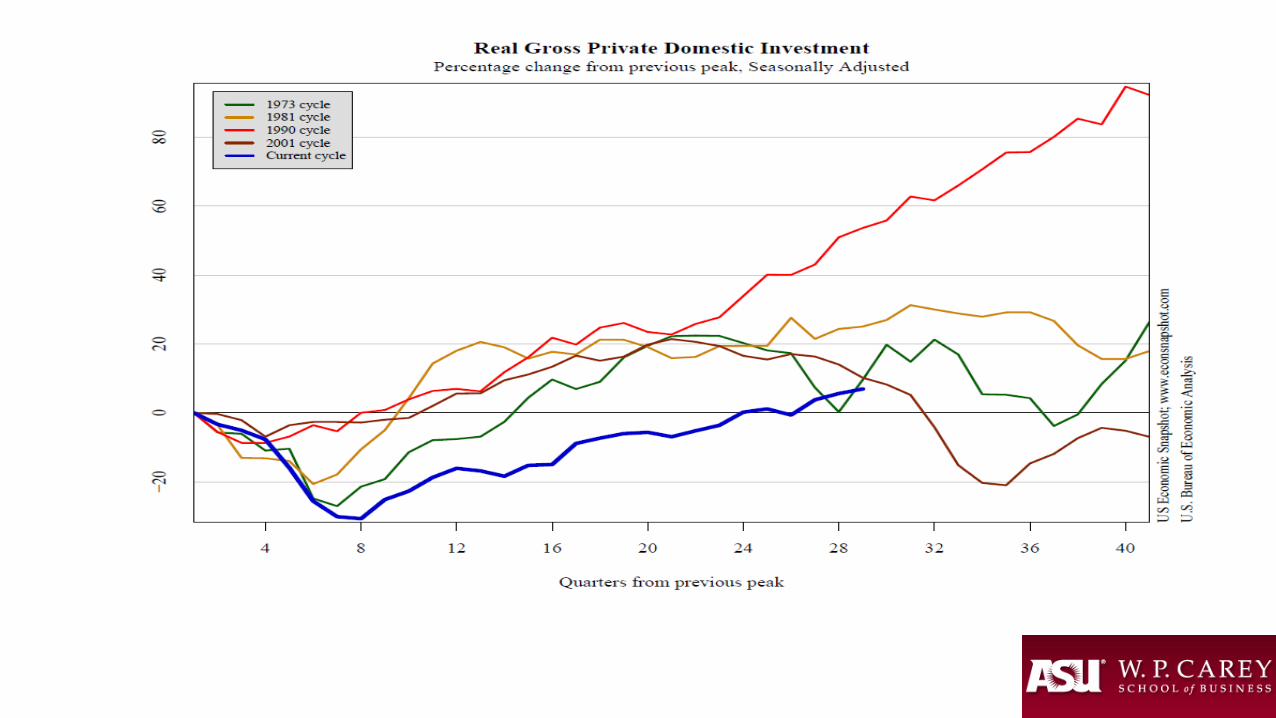


So what is holding the Economy back from running at full steam?


So why aren’t we growing faster?
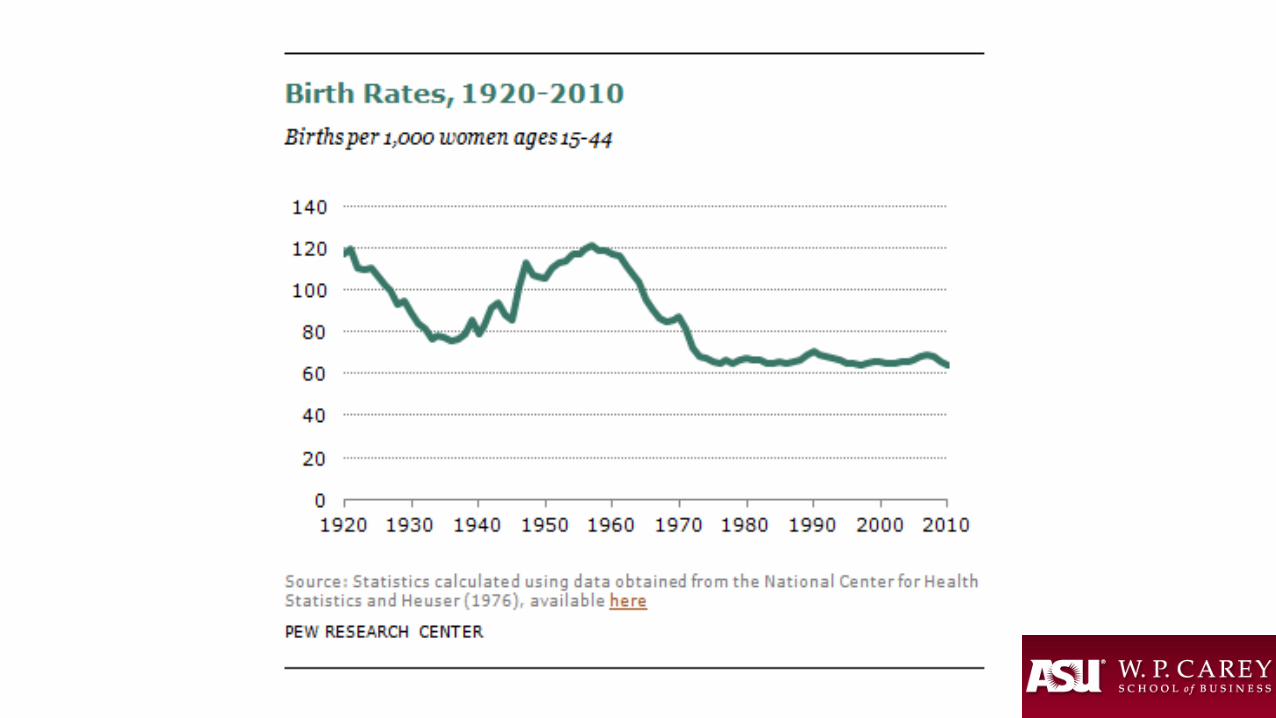
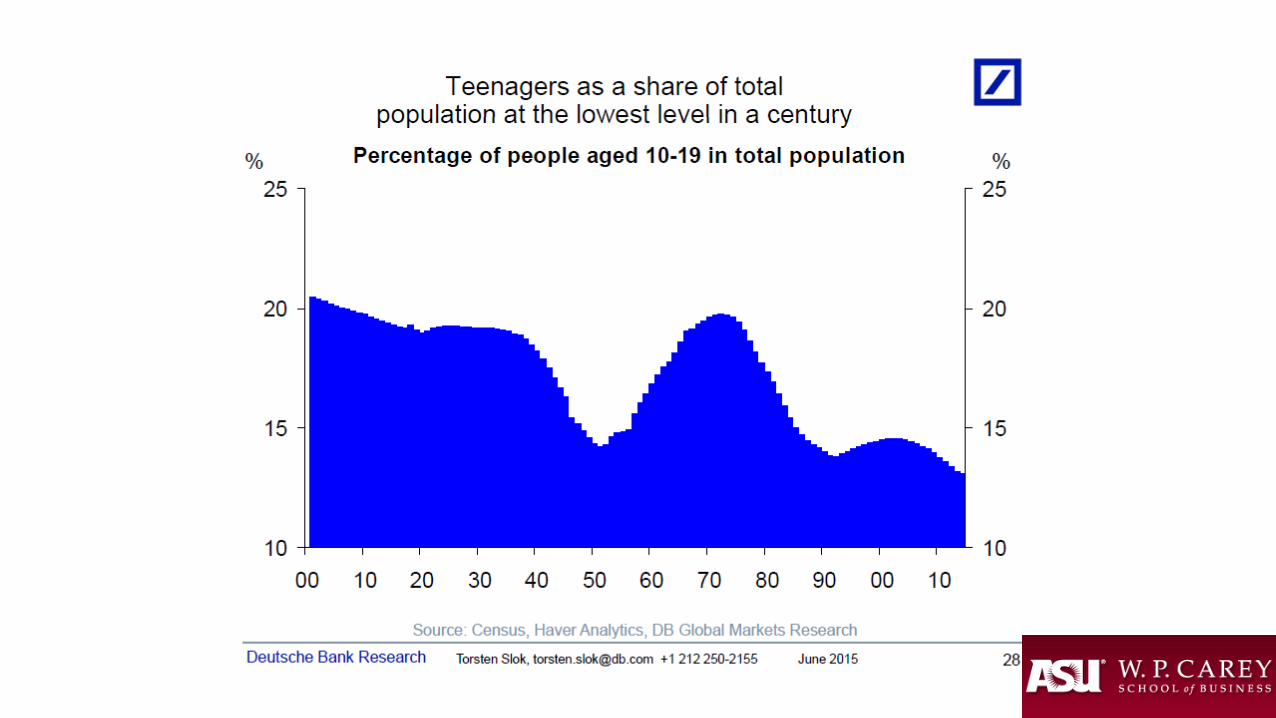
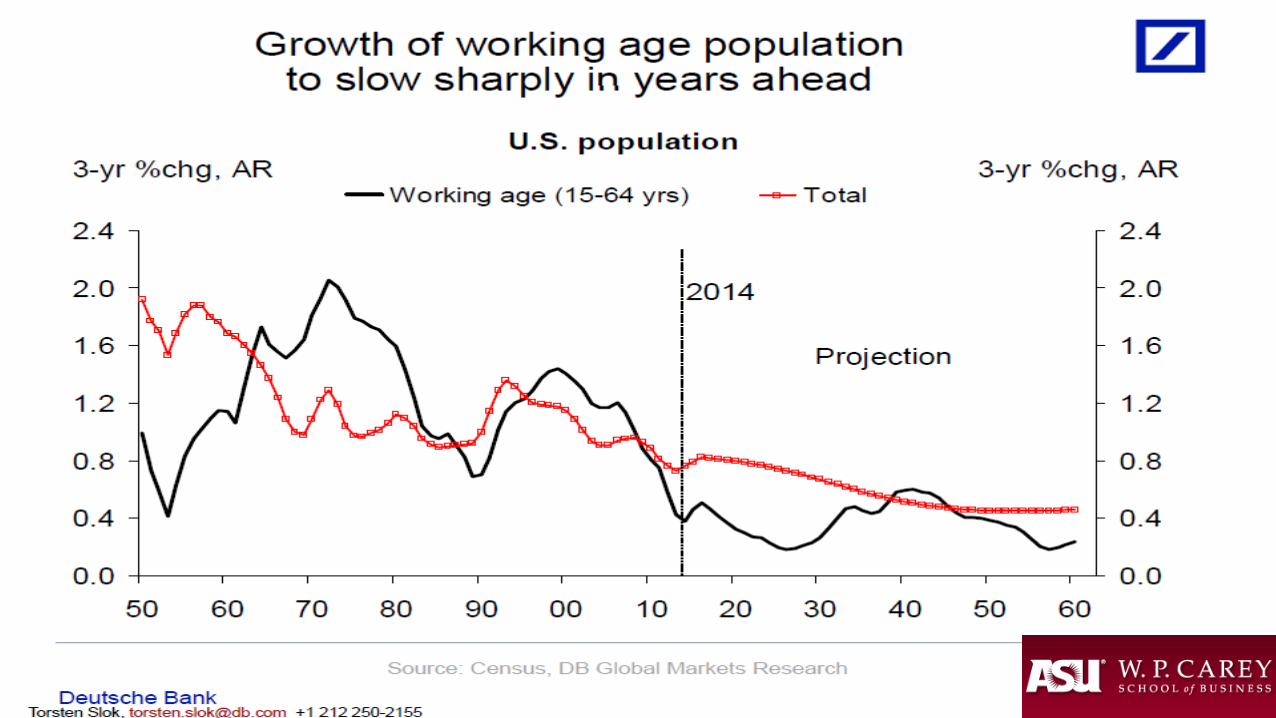
• Regulations, Taxes, bad policymakers• Lack of investment in infrastructure, e.g. austerity headwinds• Demographics, essentially the last 40 years were the anomaly and
now the baby boomers are entitlement recipients• Secular stagnation and the Great Reset. Tyler Cowen Richard Florida• We are, its just bad data..
So What will the FED do and will it hurt the Economy
• They say they are “data driven”• They want to raise Interest Rates• Many small HH savers wish they would• ?? Choke of Expansion, especially Housing• ?? Impact on Exports• ?? Impact on Equity Markets
Worrying about what the Fed will and will not do may be a waste of time
19


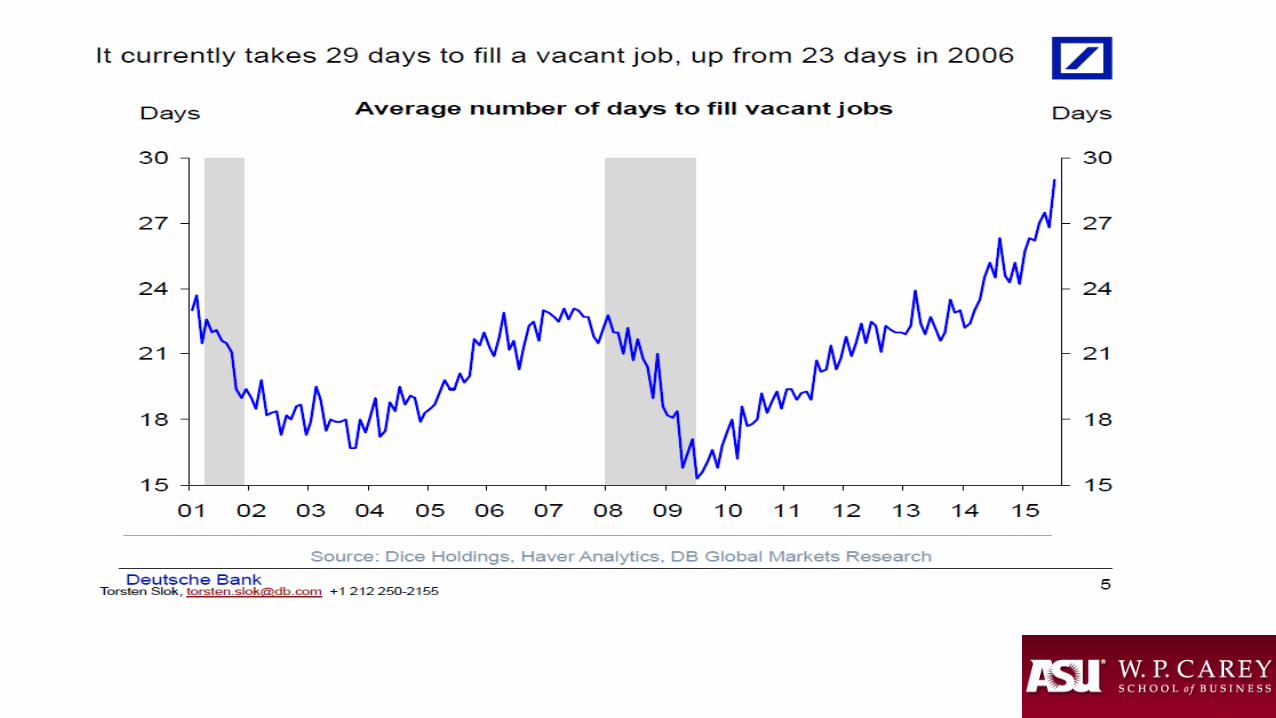
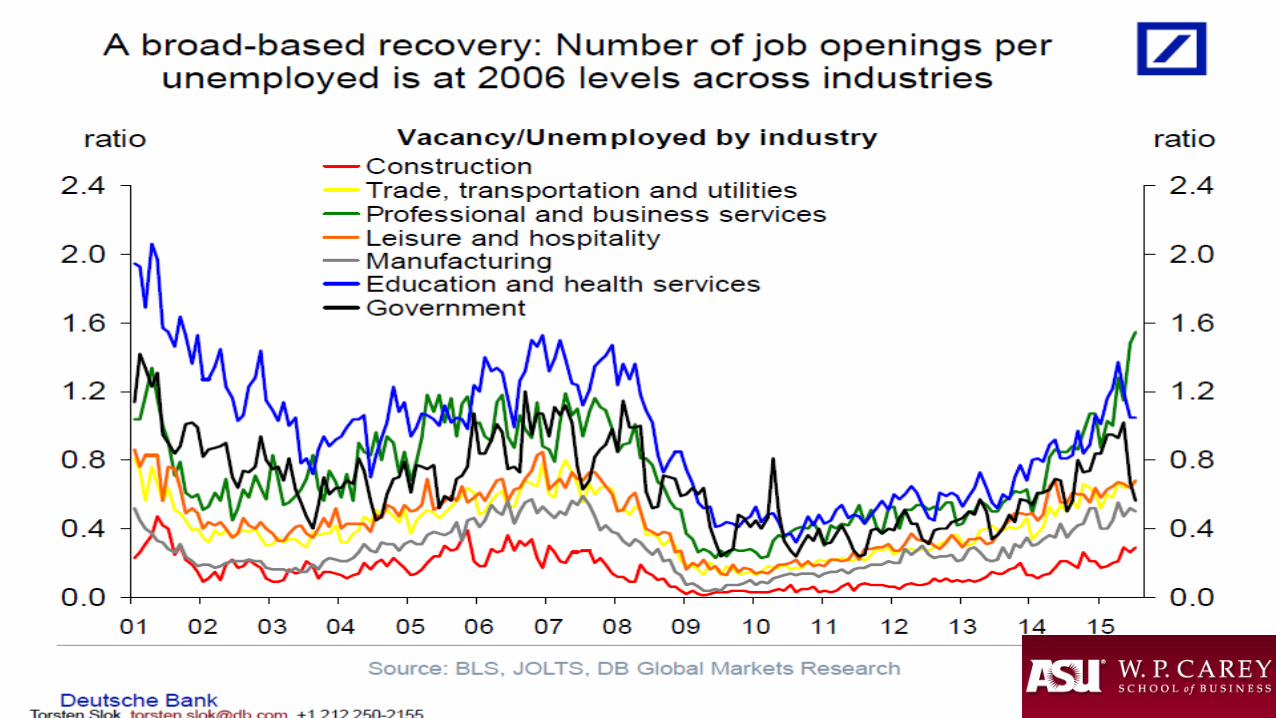
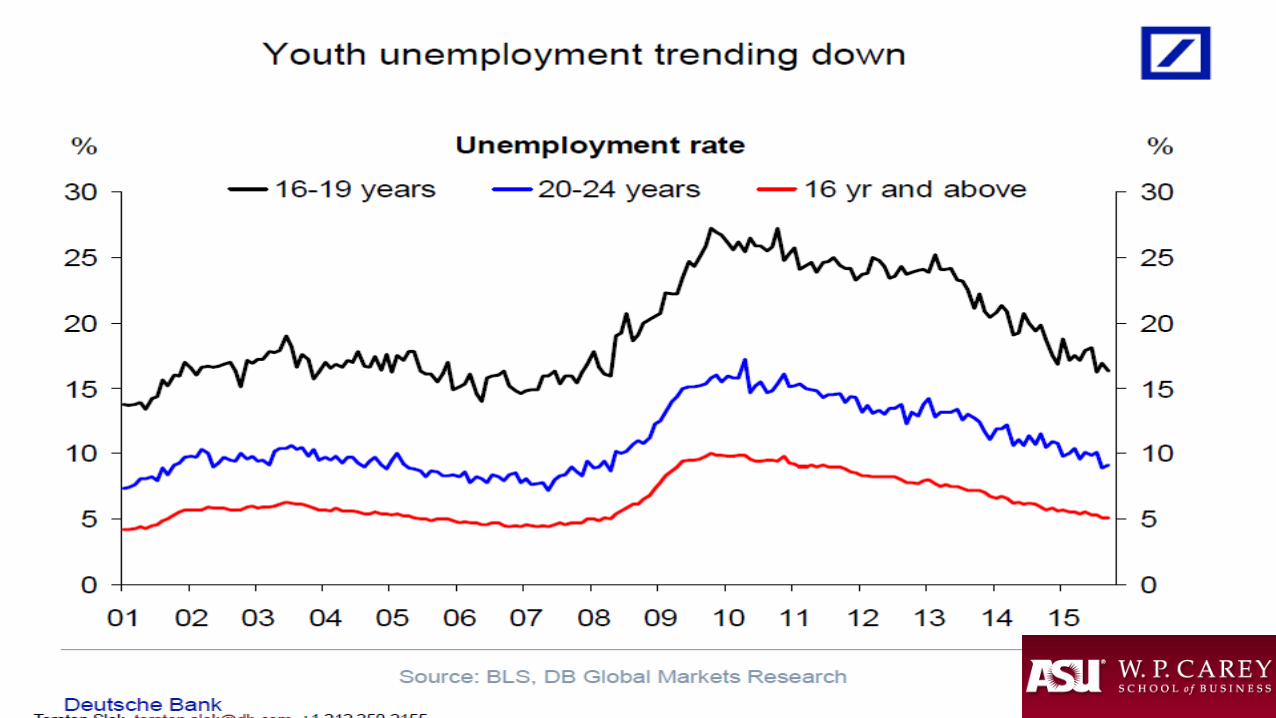
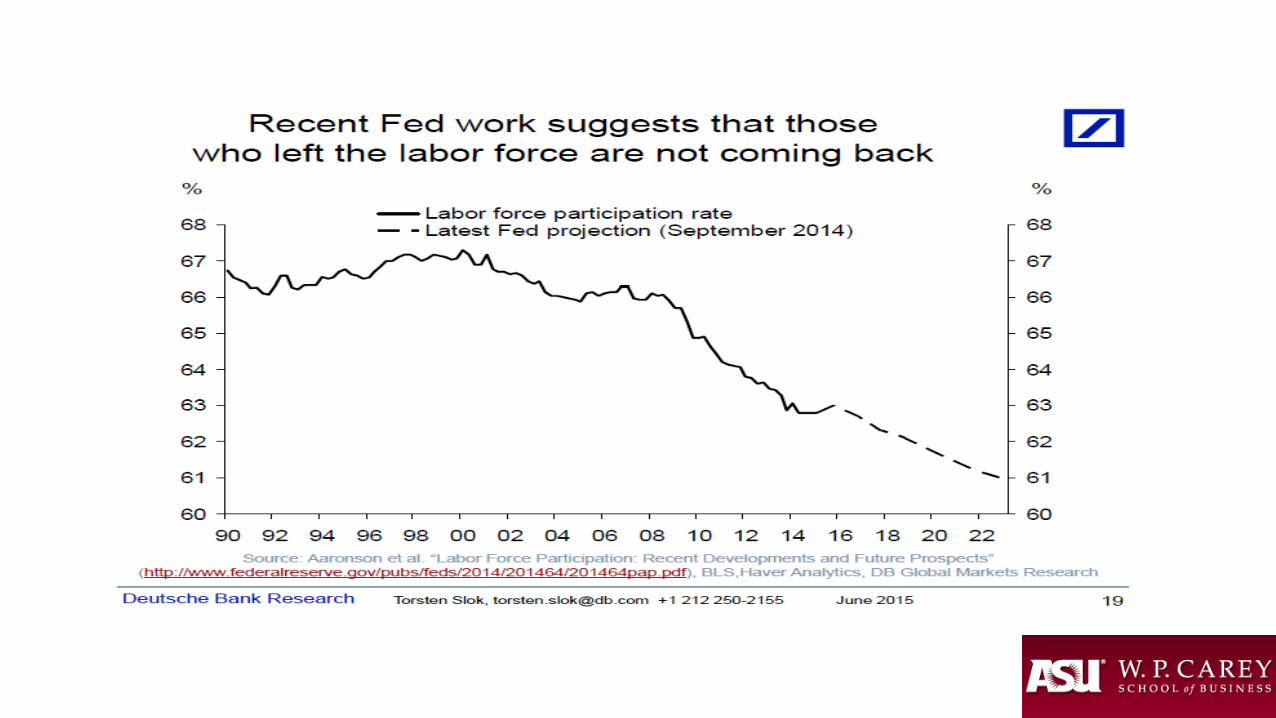
So How is the US Labor MKT doing??


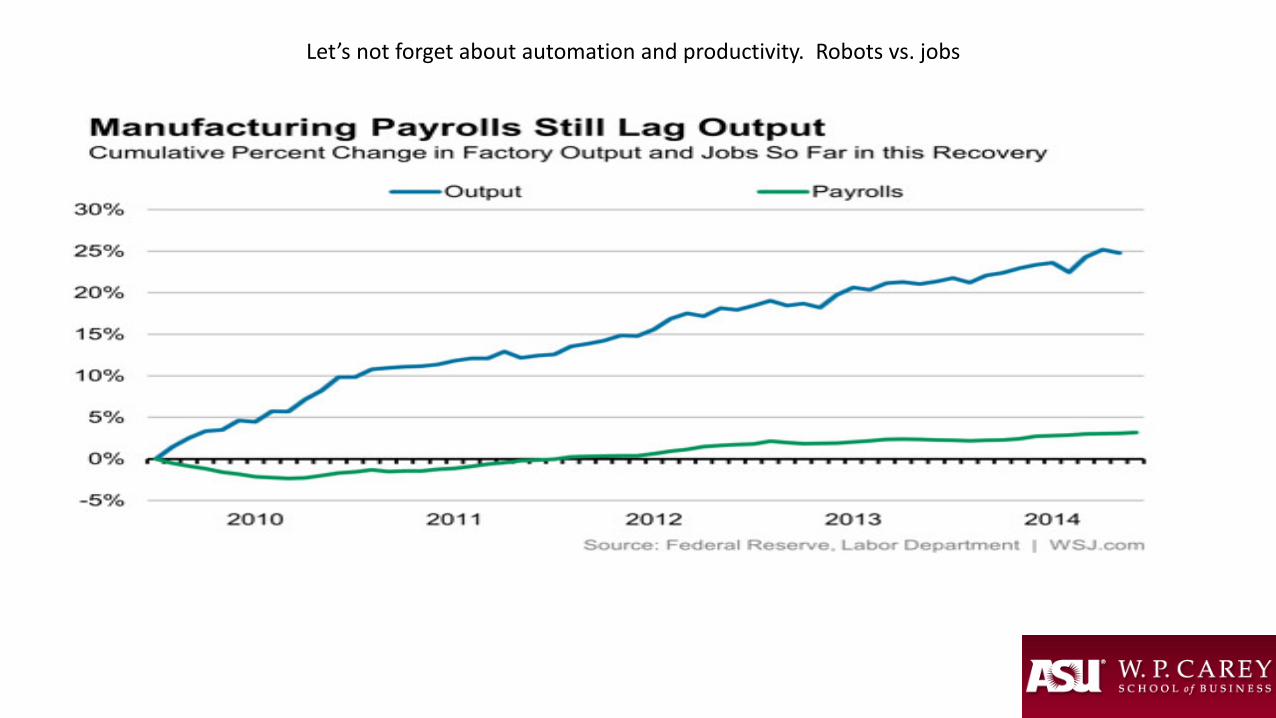
Let’s not forget about automation and productivity. Robots vs. jobs


Let’s spend a few moments on
• Demographics• Debt• National Outlook

Seniors Working more!! Biology Dominates

First Boomers reach 25
First Boomers reach 55
65


So will Washington create another crisis?

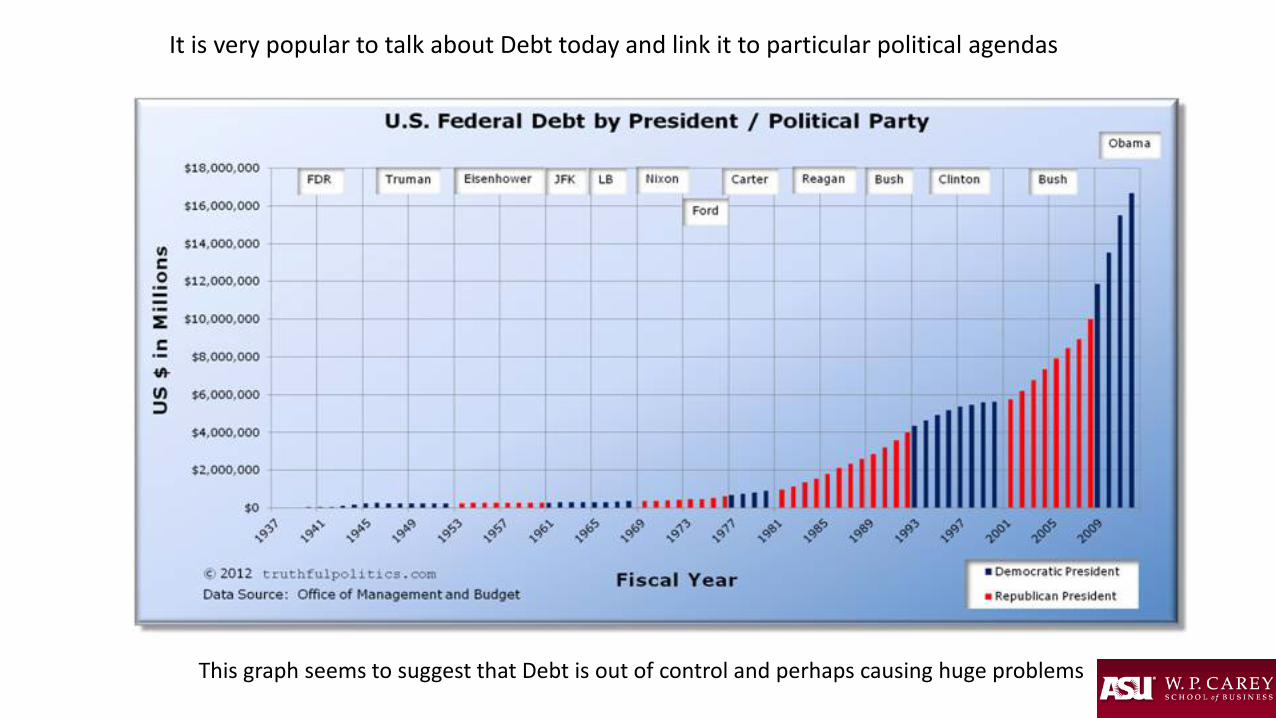
It is very popular to talk about Debt today and link it to particular political agendas
This graph seems to suggest that Debt is out of control and perhaps causing huge problems

Radio Personalities are raging against DebtAnd the private sectorIs responding accordingly
To many, Debt is Simply another fourLetter word!!
To some it’s literally a sinTo take on debt
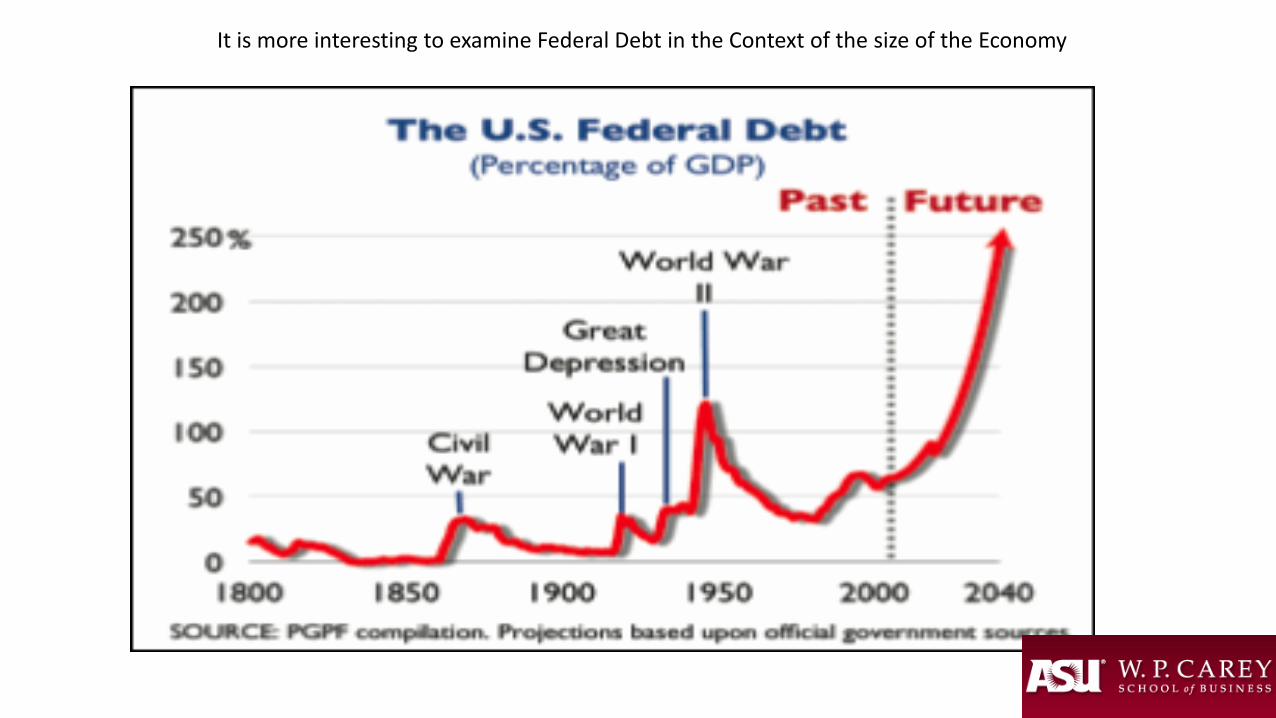
It is more interesting to examine Federal Debt in the Context of the size of the Economy
But has this helped or hurt the recovery??
• What is the role of Debt?• What does total Debt outstanding look like?• Should the Government have responded like individuals did over the
past 7 years?• If families have to balance budgets so too should governments,
right??

This graph depicts all debt, households, business, government, etc. as a share of GDP
The Graph suggests that the economy has seen unprecedented debt reduction recently

But Debt plays an important role in the Economy
• Without Debt many of us would not own a house• Without Debt we may not have the US interstate system• Without Debt we may not have been able to finance wars.• Too much debt is a problem, but debt avoidance has it’s own
problems.
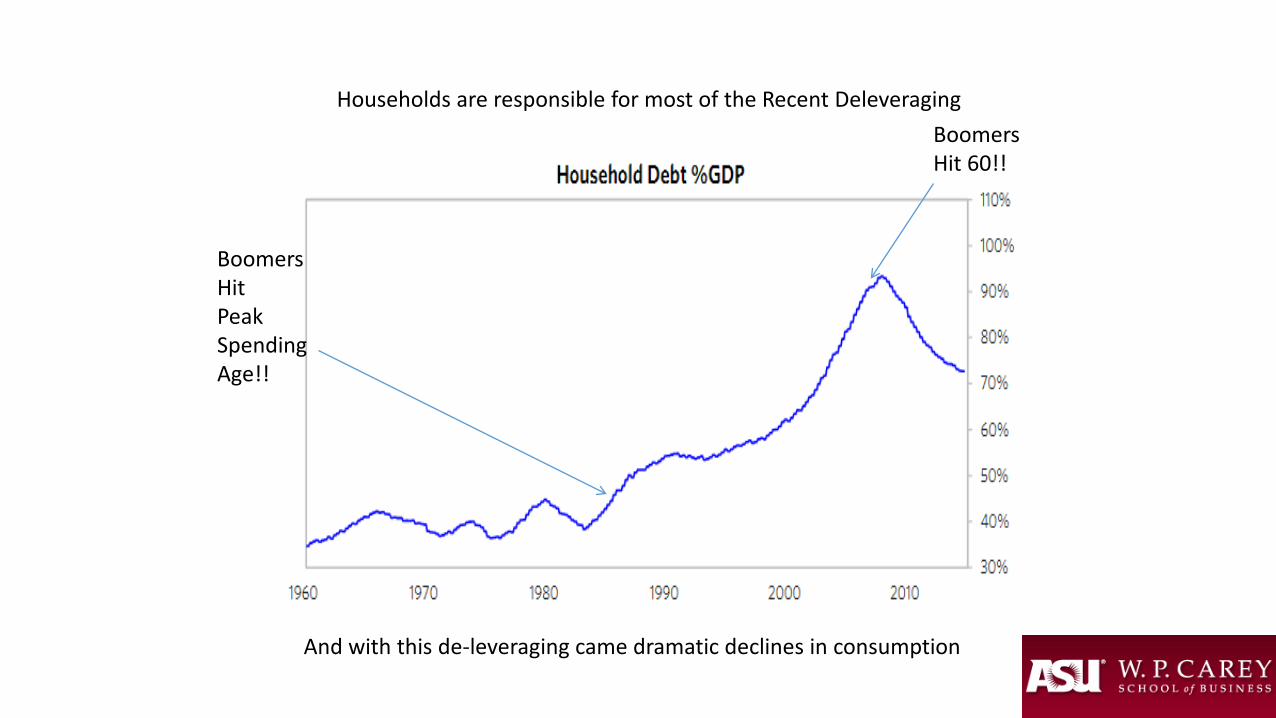
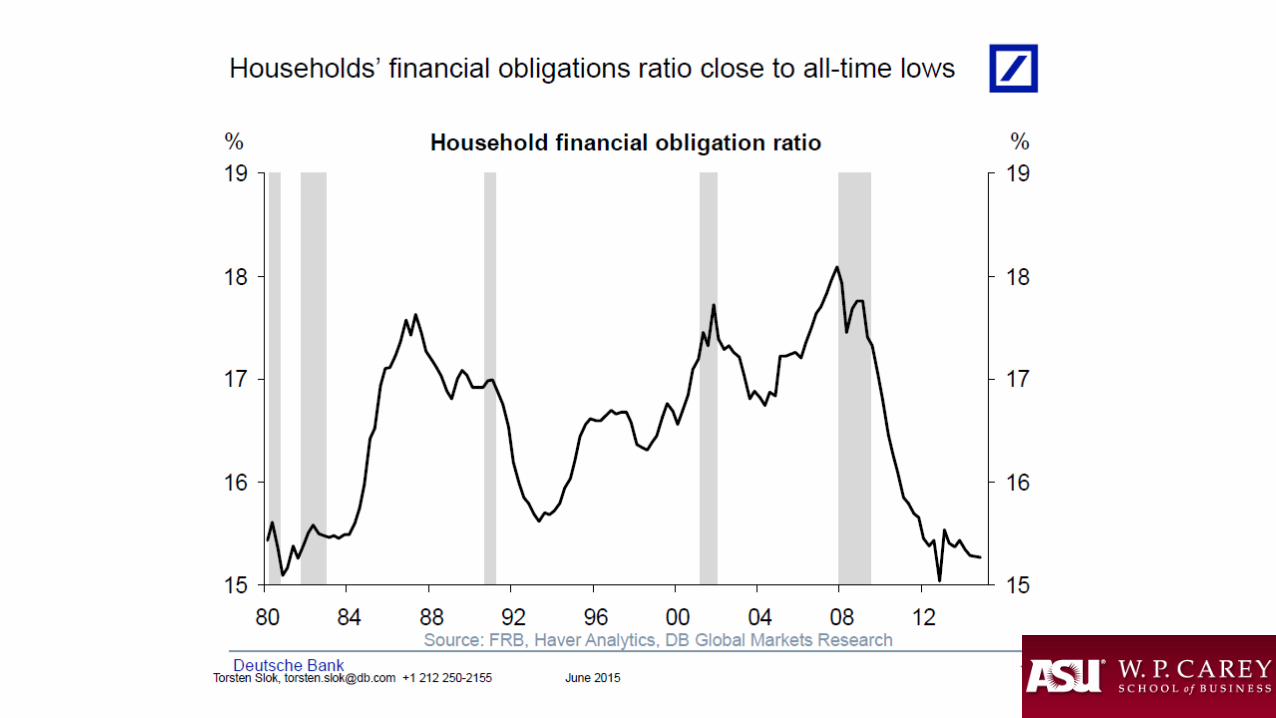
Households are responsible for most of the Recent Deleveraging
And with this de-leveraging came dramatic declines in consumption
BoomersHitPeak SpendingAge!!
BoomersHit 60!!
So what is the consensus on Debt
• Governments should act like a family?• Government Debt is always bad?• Debt in general is evil?• So should the Federal Government run a balanced budget?? Or
should we pay off the debt? Is this logical or feasible?• Is it good that states like Arizona must have a balanced budget??
And Debt today isn’t the problem
Its our unwillingness to confront it.
Since 1980 we have replaced “tax and spend” with “borrow and spend”
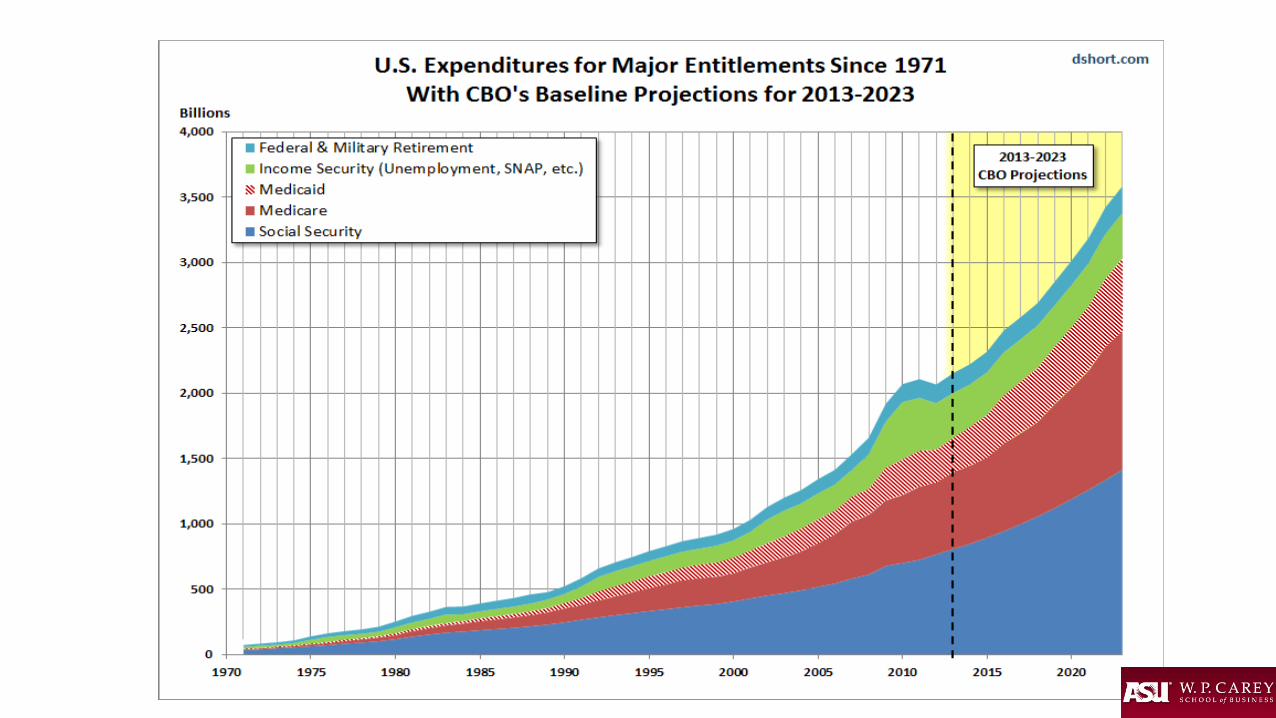
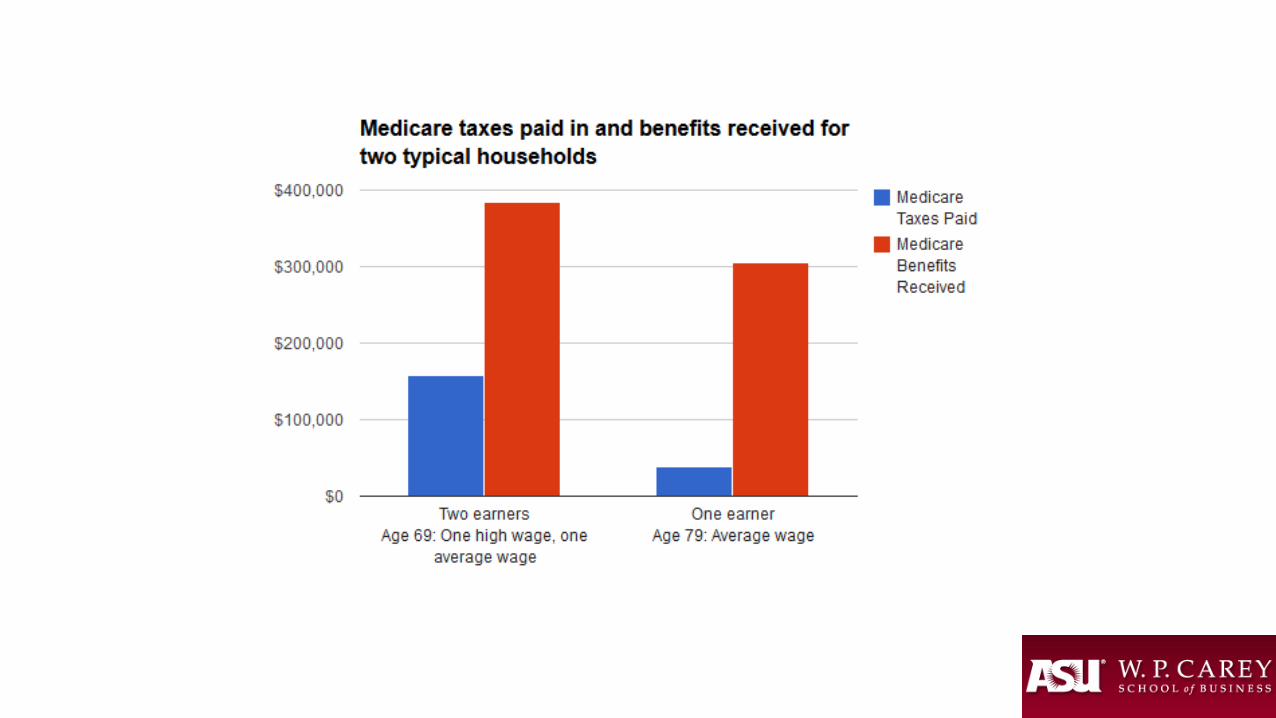
The biggest pressure on the Federal Budget over the next several years will be Medicare
• Have future Medicare recipients paid for the cost of their benefits??• How would we finance health care obligations under a balanced
budget constraint?• Can we grow our way out of this?? If so how?? So what should be
done?
Balanced Budgets
• Without access to debt, the Federal Government would have to • Raise taxes to pay for entitlements• Cut Benefits
• Likely it would be some combination of both.

Indicator 2014 2015 2016Real GDP Growth 2.4% 2.3% 2.7%10 Year Treasury Note 2.5% 2.3% 2.9%Inflation (CPI) 1.6% 0.2% 2.0%Employment (Jobs) 2.6 mil. 3.0 mil. 2.5 mil.Unemployment Rate 6.2% 5.3% 4.8%
U.S. Economic Outlook
W. P. Carey School of Business, ASU & Blue Chip Economic Indicators, Sept. 2015
GDP Grows Less than 3% (Again!) as WeakGlobal Markets Affect U.S. Economy

Issues for the Nation
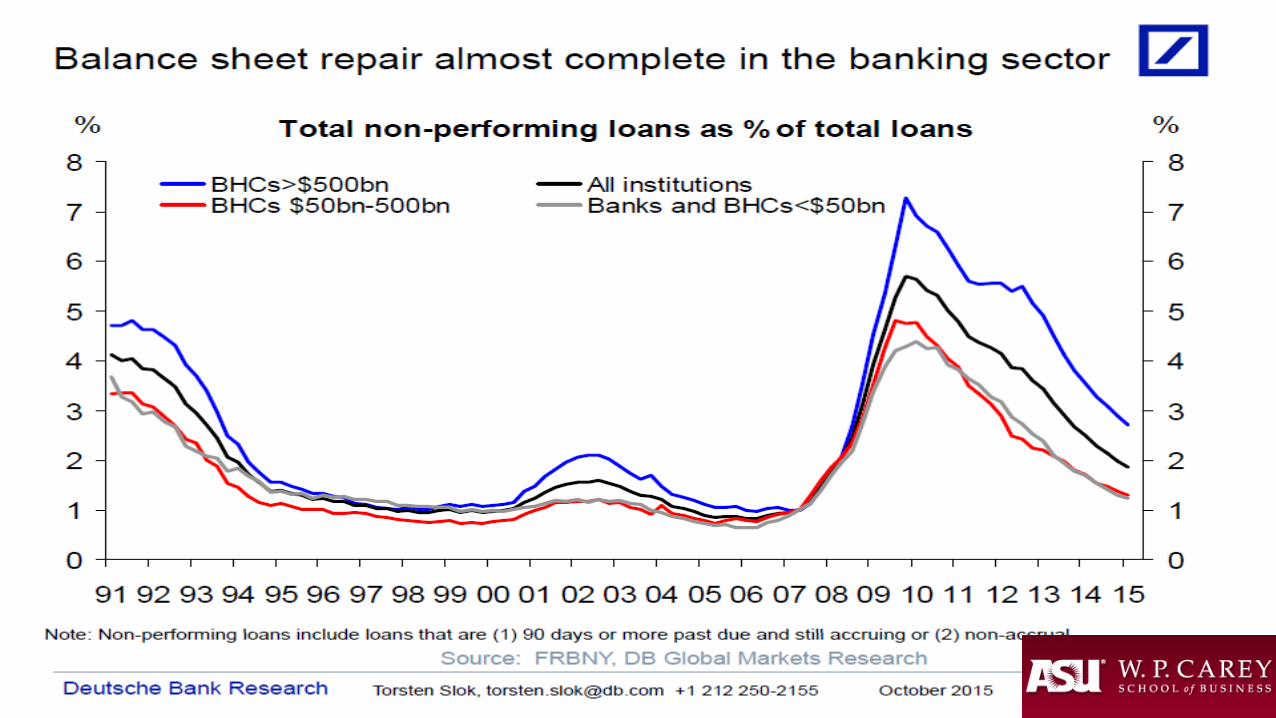
Positives• Balance Sheets• Most Private De-leveraging is
now done• Among the best economies in
the world• Potential of immigration and
trade reforms• Baby boomer retirements mean
new opportunities
Negatives• Demography is now a headwind
Legacy entitlements• Value of the Dollar• Dis-functional Federal Government• Susceptible to major shocks,
natural or otherwise• Potential bubbles in credit markets
and equities. • Fed tightening
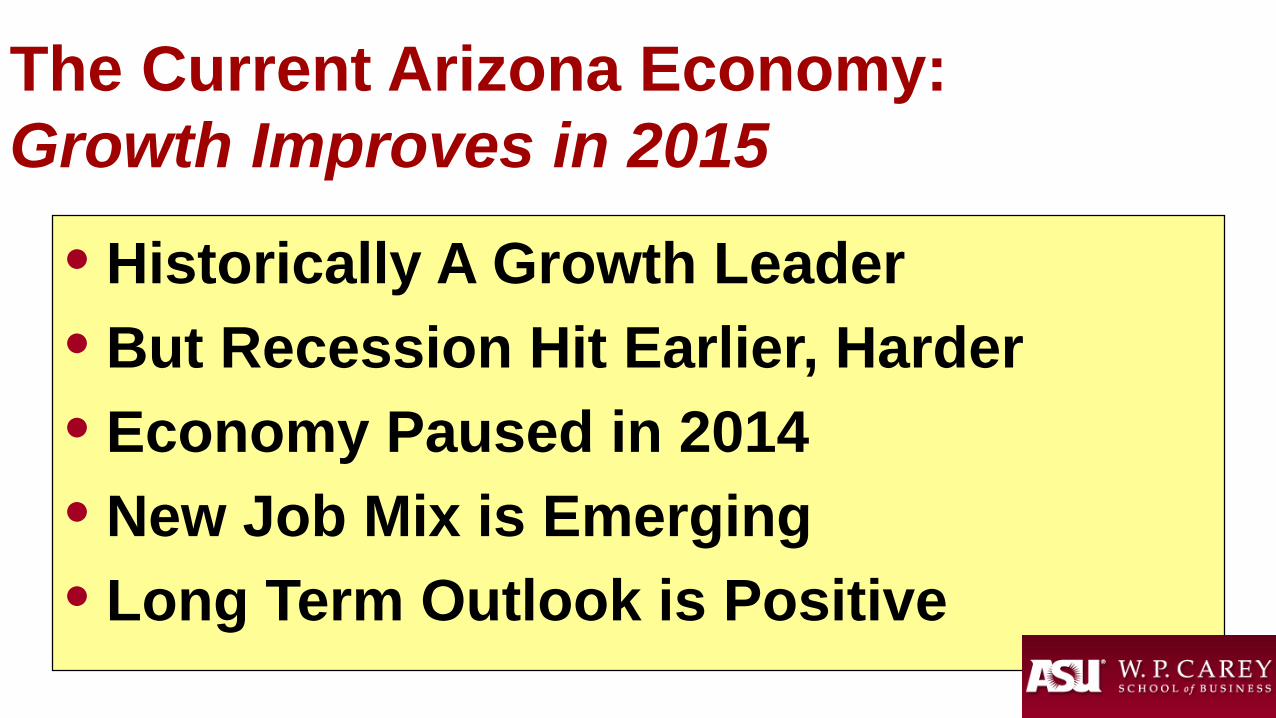
• Historically A Growth Leader• But Recession Hit Earlier, Harder• Economy Paused in 2014 • New Job Mix is Emerging• Long Term Outlook is Positive
The Current Arizona Economy:Growth Improves in 2015

1
7
6
2
5
94
8
30 States in RedLost Net DomesticPopulation to 20 States in Green
Domestic Migration 2014
3AlaskaHawaii
U.S. Census Bureau
10
+42,000
Net Migration not boosting construction in all states

Fuel Prices and the Economy
• Will add approximately 2 % to disposable income growth in AZ in 2015.
• Spend it• Save it• Will it have an impact on Auto purchases?
• National Effects Mixed but AZ should see benefits
65
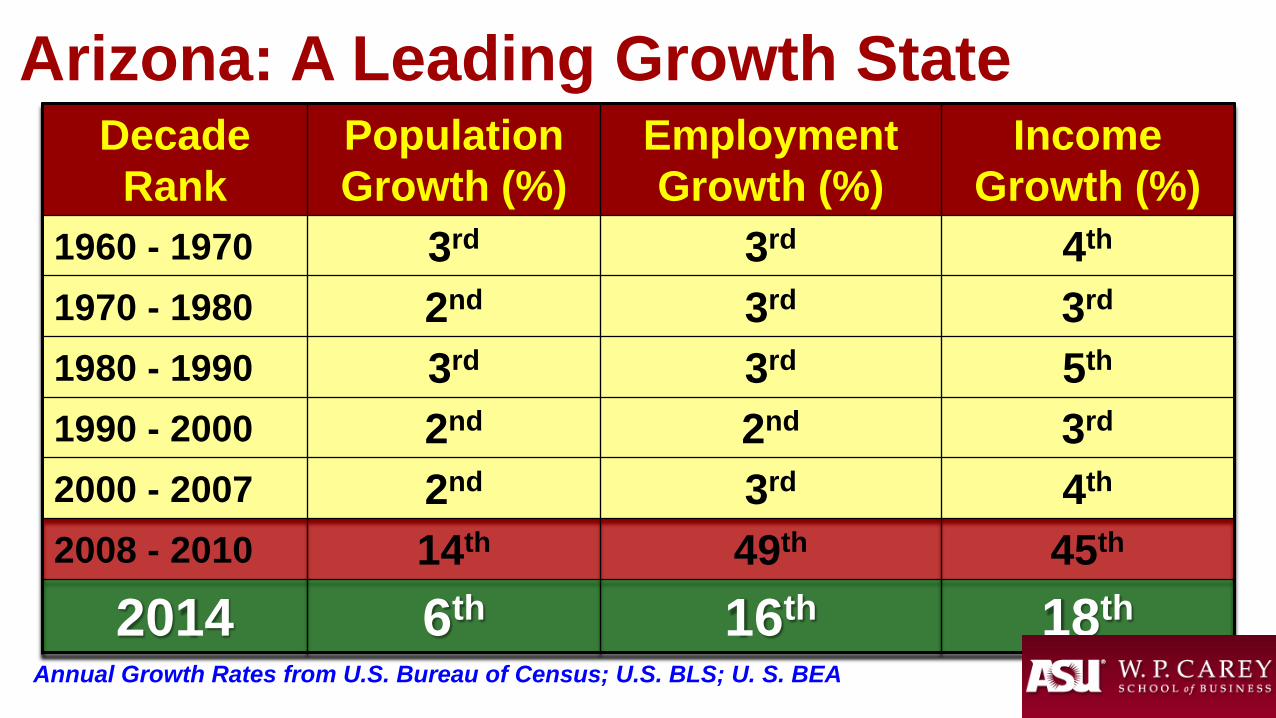
DecadeRank
PopulationGrowth (%)
EmploymentGrowth (%)
IncomeGrowth (%)
1960 - 1970 3rd 3rd 4th
1970 - 1980 2nd 3rd 3rd
1980 - 1990 3rd 3rd 5th
1990 - 2000 2nd 2nd 3rd
2000 - 2007 2nd 3rd 4th
2008 - 2010 14th 49th 45th
2014 6th 16th 18th
Arizona: A Leading Growth State
Annual Growth Rates from U.S. Bureau of Census; U.S. BLS; U. S. BEA

So How did we get here??
• Real Estate Bubble• Slow lingering effects of manufacturing slowdown• Demographics and aging baby boomers• Arizona image issues• Or Maybe its something else….
-10
-8
-6
-4
-2
0
2
4
6
8
10
12
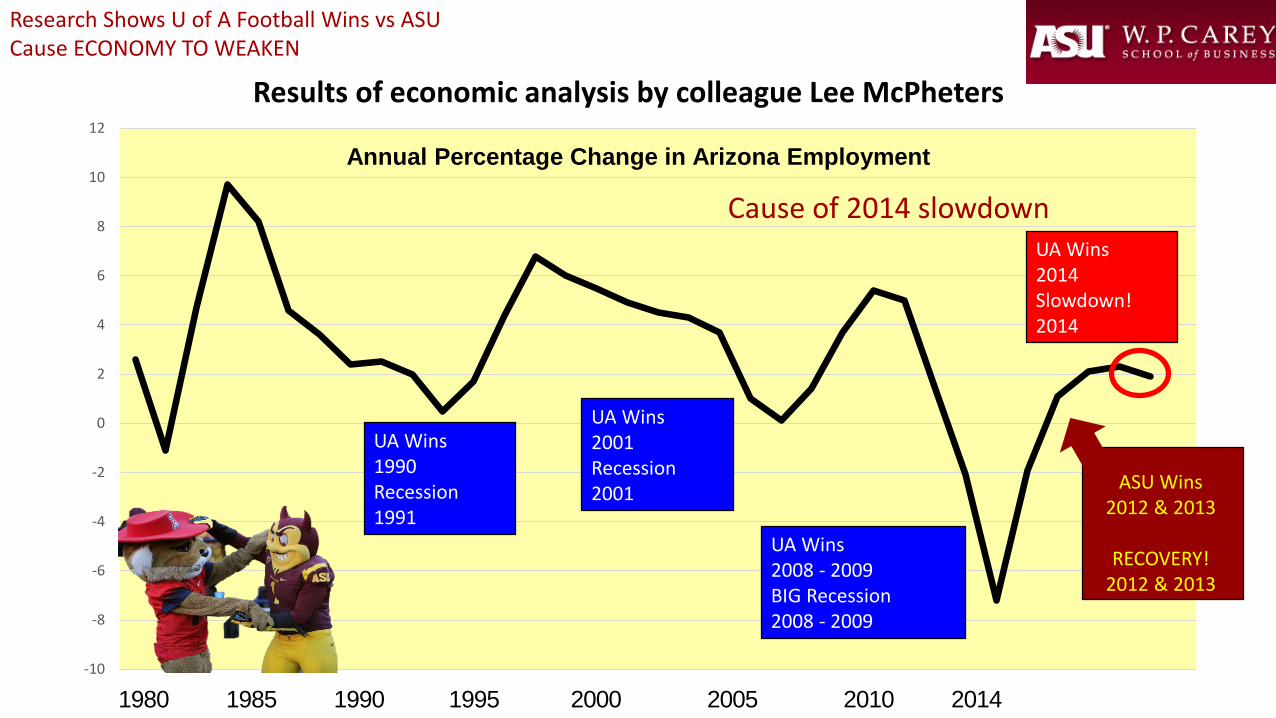
Annual Percentage Change in Arizona Employment
ASU Wins2012 & 2013
RECOVERY!2012 & 2013
1980 1985 1990 1995 2000 2005 2010 2014
Research Shows U of A Football Wins vs ASU Cause ECONOMY TO WEAKEN
Cause of 2014 slowdown
UA Wins1990Recession1991
UA Wins2001Recession2001
UA Wins2008 - 2009BIG Recession2008 - 2009
UA Wins2014Slowdown!2014
Results of economic analysis by colleague Lee McPheters
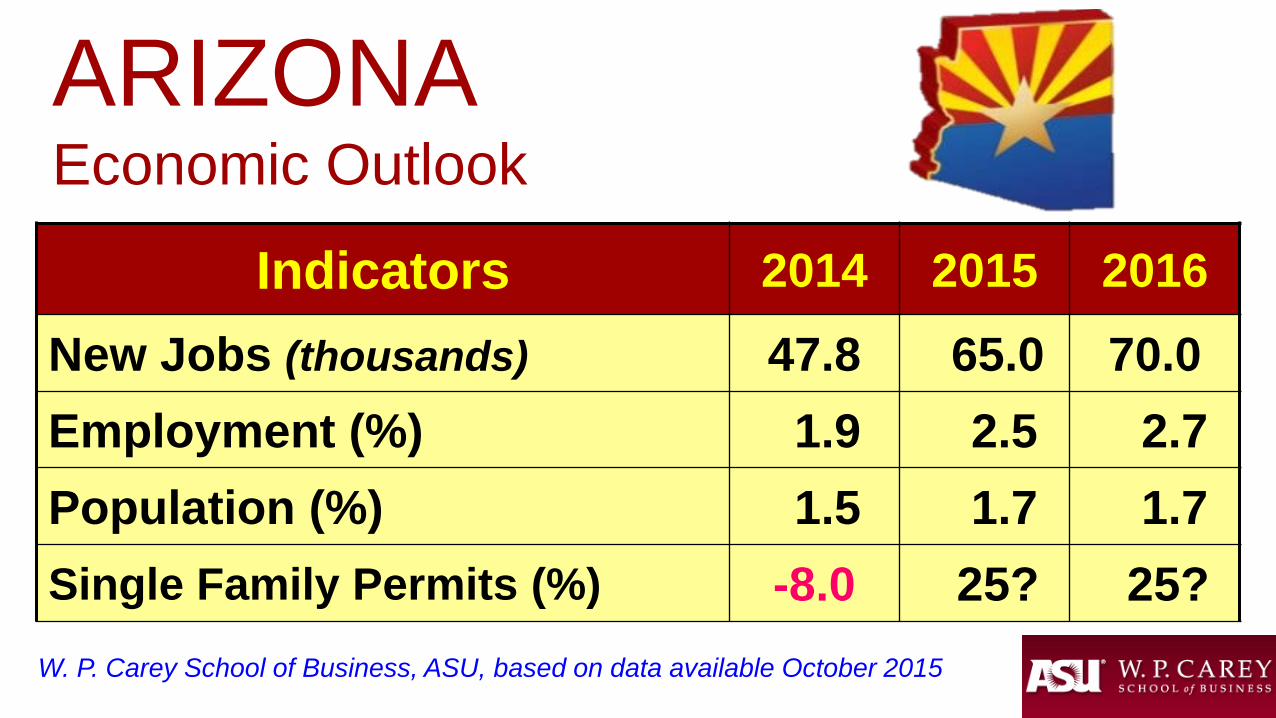
Indicators 2014 2015 2016
New Jobs (thousands) 47.8 65.0 70.0 Employment (%) 1.9 2.5 2.7Population (%) 1.5 1.7 1.7Single Family Permits (%) -8.0 25? 25?
ARIZONA Economic Outlook
W. P. Carey School of Business, ASU, based on data available October 2015

1
Ranked by % ChangeYear To Date July 2015
512
833
4
11
45
6
13
7
Top 10 Growth States
U. S. Bureau of Labor Statistics
46
2
Arizona Ranks 13th Among AllStates In Year-to-Date Job Growth
3
910
24

8/15 Top Large metros for Job Growth in 2015 are in the West
rnk pct grth # thous workforce thous
San Jose-Sunnyvale-Santa Clara, CA 1 5.41 54.7 1,065.00
Orlando-Kissimmee-Sanford, FL 2 3.99 44.5 1,161.00
Portland-Vancouver-Hillsboro, OR-WA 3 3.67 39.6 1,119.50
Seattle-Tacoma-Bellevue, WA 4 3.4 62.9 1,915.40
San Francisco-Oakland-Fremont, CA 5 3.31 72.8 2,271.00
Dallas-Fort Worth-Arlington, TX 6 3.23 106.1 3,391.80
Riverside-San Bernardino-Ontario, CA 7 3.14 40.7 1,335.90
San Diego-Carlsbad-San Marcos, CA 8 3.07 41.5 1,394.20
Baltimore-Towson, MD 9 2.95 39.8 1,388.10
Indianapolis-Carmel, IN 10 2.9 28.9 1,023.80
Tampa-St. Petersburg-Clearwater, FL 11 2.89 35.1 1,249.80
Atlanta-Sandy Springs-Marietta, GA 12 2.77 69.8 2,590.10
Miami-Fort Lauderdale-Pompano Beach, FL 13 2.63 64 2,501.80
Phoenix-Mesa-Glendale, AZ 14 2.57 47.8 1,905.00
Boston-Cambridge-Quincy, MA-NH 15 2.57 66.5 2,651.80

A Comparison of job growth in 2015Smaller AZ Metros
rnkpct grth
# thous
workforce thous
Prescott, AZ 38 3.25 1.91 60.69
Flagstaff, AZ 98 2.53 1.61 65.25
Tucson, AZ 239 0.96 3.49 366.1Lake Havasu City-Kingman, AZ 285 0.38 0.18 46.5
Yuma, AZ 330 -1.79 -0.92 50.8
Smaller UT Metros
rnkpct grth
# thous
workforce thous
Provo-Orem, UT 2 6.54 13.62 222.02Ogden-Clearfield, UT 16 3.96 9.05 237.77
Salt Lake City, UT 20 3.77 24.45 673.8
Logan, UT-ID 82 2.77 1.55 57.46
St. George, UT 124 2.19 1.18 54.81

Arizona Industry % Growth U.S. RankOverall Job Growth 2.7 12Private Job Growth 3.5 7Other Services* 3.9 1Finance/Insurance 4.2 8Prof/Business Services 4.9 9Health Care 3.6 9Construction 4.2 21
Arizona Job Growth RankingsRanked by Year/Year Growth: July 2015
U. S. Bureau Labor Statistics & W. P. Carey School of Business* Other Services includes Personal Services, Repair Services


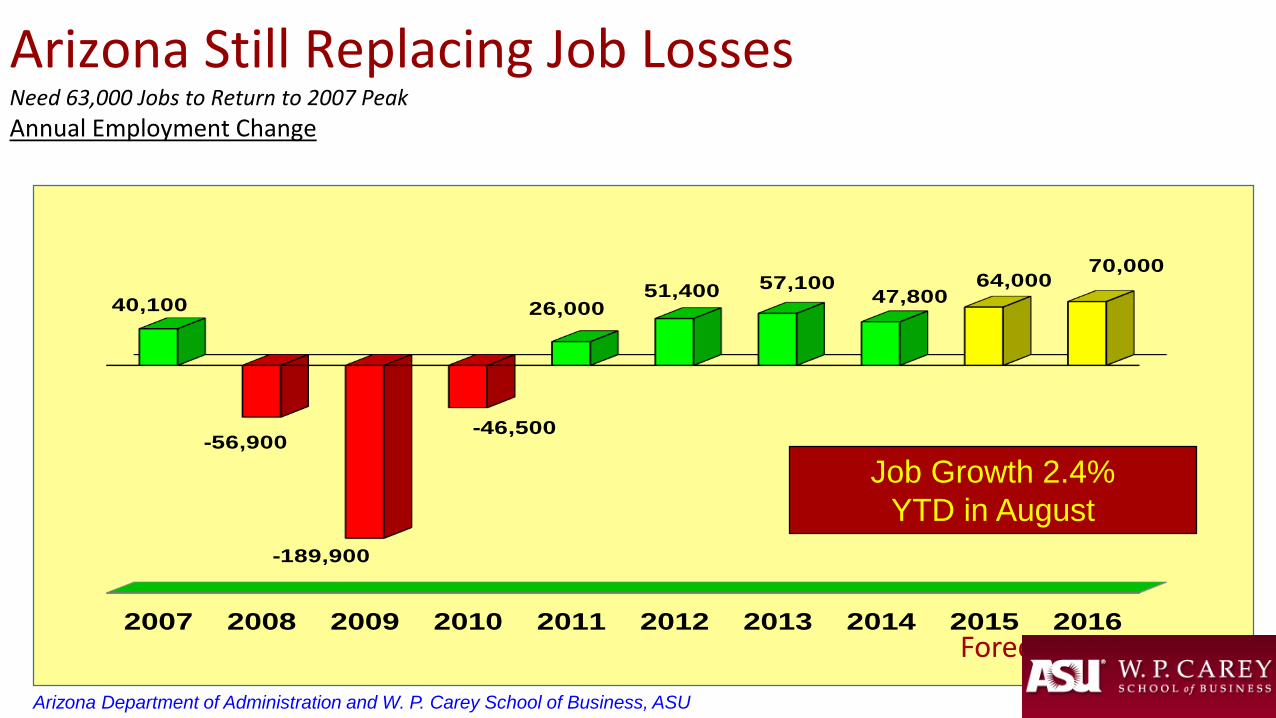
2007 2008 2009 2010 2011 2012 2013 2014 2015 2016
40,100
-56,900
-189,900
-46,500
26,00051,400 57,100
47,80064,000
70,000
Arizona Department of Administration and W. P. Carey School of Business, ASU
Arizona Still Replacing Job LossesNeed 63,000 Jobs to Return to 2007 PeakAnnual Employment Change
Forecast
Job Growth 2.4% YTD in August

2005 2006 2007 2008 2009 2010 2011 2012 2013 2014 2015 2016
3.3 3.3
2.31.8
1.0 1.0 0.91.3 1.2
1.5 1.7 1.7
Forecast
Arizona Population Growth RateBelow 3.2% Twenty Year* Average
W. P. Carey School of Business, ASU & U. S. Census Bureau; *Average is 1980 - 2000
Annual Percent Change

3
7
5
1
9
But Arizona Ranked 6th (1.5%) in Population Growth in 2014
U. S. States Ranked byPercent Change 2014
6
U. S. Census Bureau, Dec. 2014
42
40
10
817
14
12
46
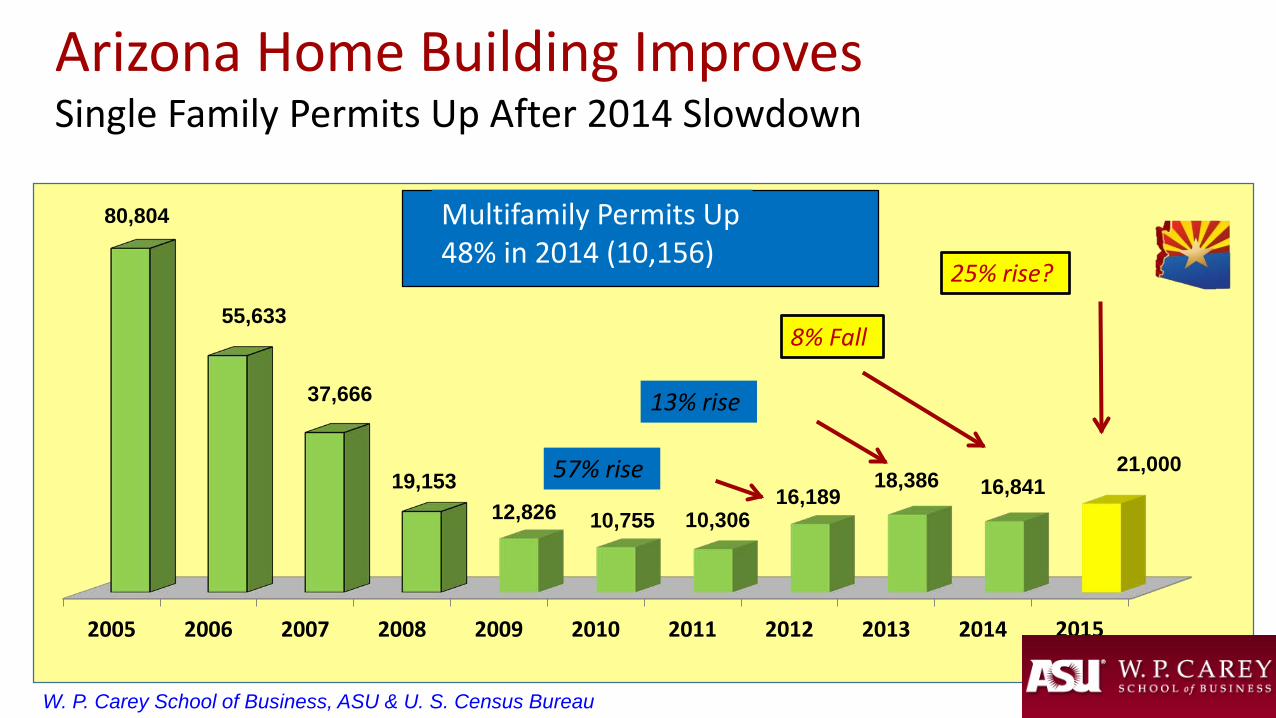
2005 2006 2007 2008 2009 2010 2011 2012 2013 2014 2015
80,804
55,633
37,666
19,15312,826 10,755 10,306
16,18918,386 16,841
21,000
Arizona Home Building Improves Single Family Permits Up After 2014 Slowdown
Forecast
57% rise
13% rise
8% Fall
25% rise?
W. P. Carey School of Business, ASU & U. S. Census Bureau
Multifamily Permits Up48% in 2014 (10,156)

Arizona Construction Is Down By 114,000 Jobs Since Peak
U. S. Bureau of Labor Statistics, Thousands of Jobs, Seasonally Adjusted
2005 2006 2007 2008 2009 2010 2011 2012 2013 2014 2015
June 2006 244,000
July 2015 129,600
Only 15% of Lost Jobs Regained
60% of Jobs Were Lost
Sept. 2010 109,000

Arizona ConstructionEmployment In the Savings & LoanRecession Of 1986
A Tale of Two Downturns: 1986 & 2006
1986 – 1995: Nine Years to Recover
2006: Nine Years & Counting!Arizona ConstructionEmployment In the Housing BubbleRecession of 2006
You Are Here
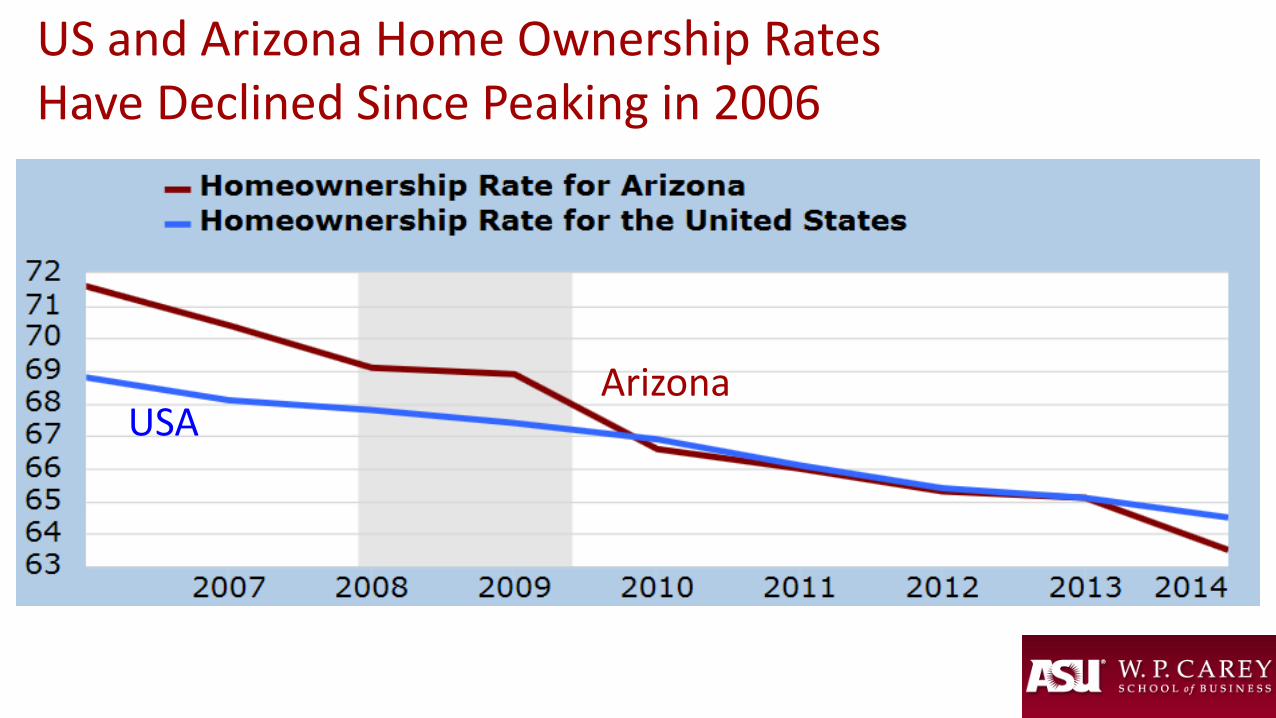
ArizonaUSA
US and Arizona Home Ownership RatesHave Declined Since Peaking in 2006

0
100
200
300
400
500
600
700
800
900
1000
Under 10 10 - 19 20 - 29 30 - 39 40 - 49 50 - 59 50 - 69 70 - Up
Millennials (20-29) Largest Population Group- When Will They Become Home Buyers?
20 – 29 Years Old
Arizona Population (000)
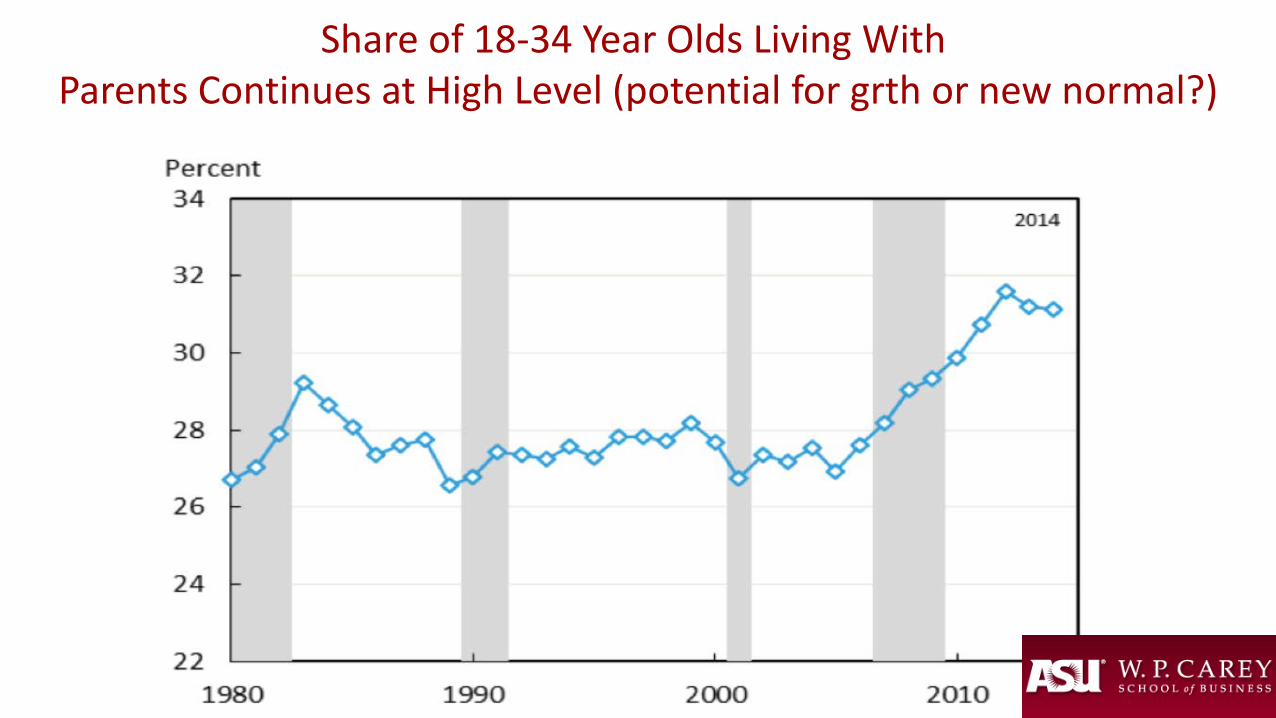
Share of 18-34 Year Olds Living With Parents Continues at High Level (potential for grth or new normal?)
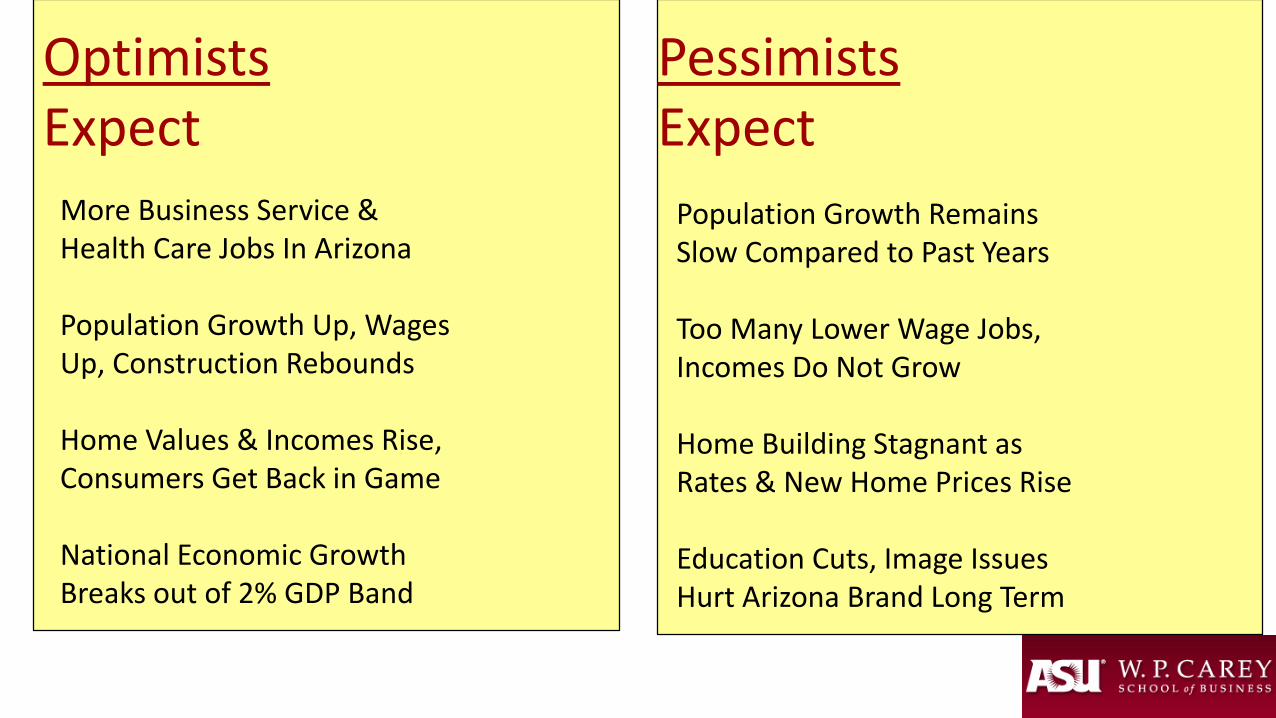
OptimistsExpect
More Business Service &Health Care Jobs In Arizona
Population Growth Up, WagesUp, Construction Rebounds
Home Values & Incomes Rise,Consumers Get Back in Game
National Economic GrowthBreaks out of 2% GDP Band
Population Growth RemainsSlow Compared to Past Years
Too Many Lower Wage Jobs,Incomes Do Not Grow
Home Building Stagnant asRates & New Home Prices Rise
Education Cuts, Image IssuesHurt Arizona Brand Long Term
PessimistsExpect

• 2015 – best recovery year yet – but stillbelow long term average growth rates
• Population growth to remain slow• Knowledge jobs – the new driver• Global economy is short term risk• Job quality greatest long term risk
Current Arizona Consensus


On The Arizona Road To Recovery2015 Likely Best Year Since Recession Ended

-20%
-15%
-10%
-5%
0%
5%
10%
15%
1993 1995 1997 1999 2001 2003 2005 2007 2009 2011 2013 2015Fiscal Year
Personal Income
Ongoing General Fund Revenue Without Tax Changes
Personal Income Growth And ongoing GF Revenue Base “without” tax cuts
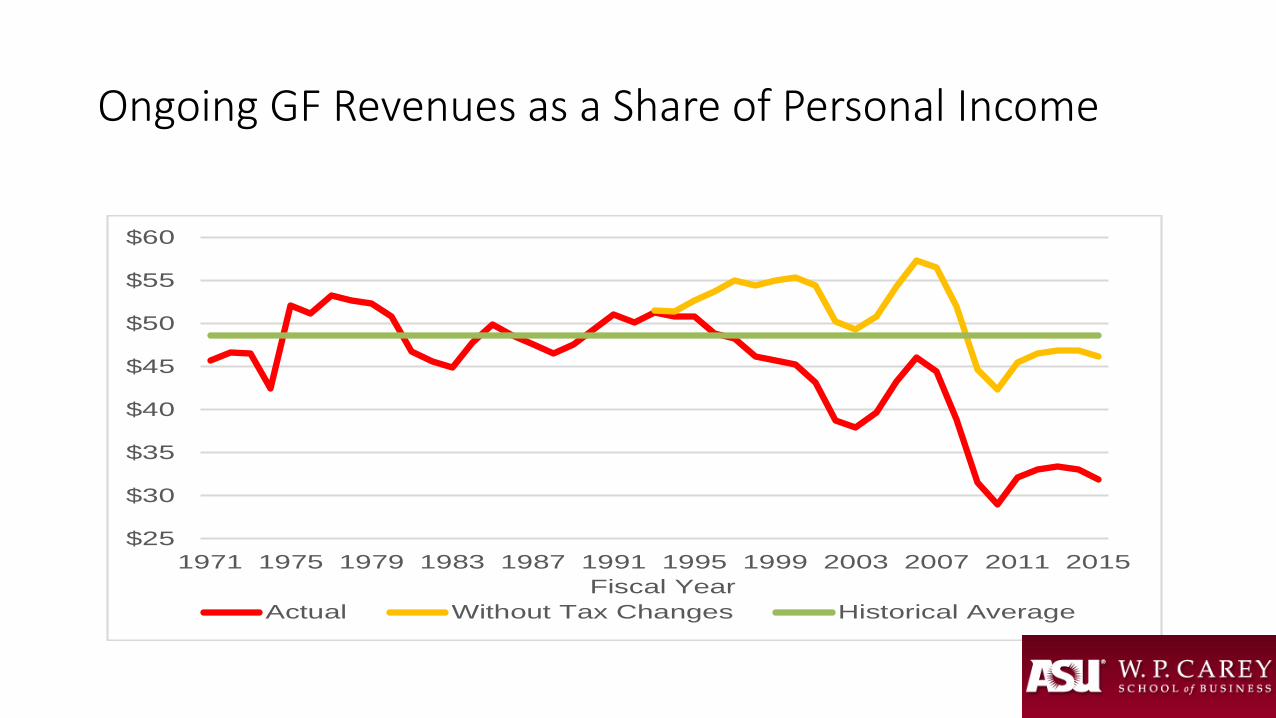
$25
$30
$35
$40
$45
$50
$55
$60
1971 1975 1979 1983 1987 1991 1995 1999 2003 2007 2011 2015Fiscal Year
Actual Without Tax Changes Historical Average
Ongoing GF Revenues as a Share of Personal Income
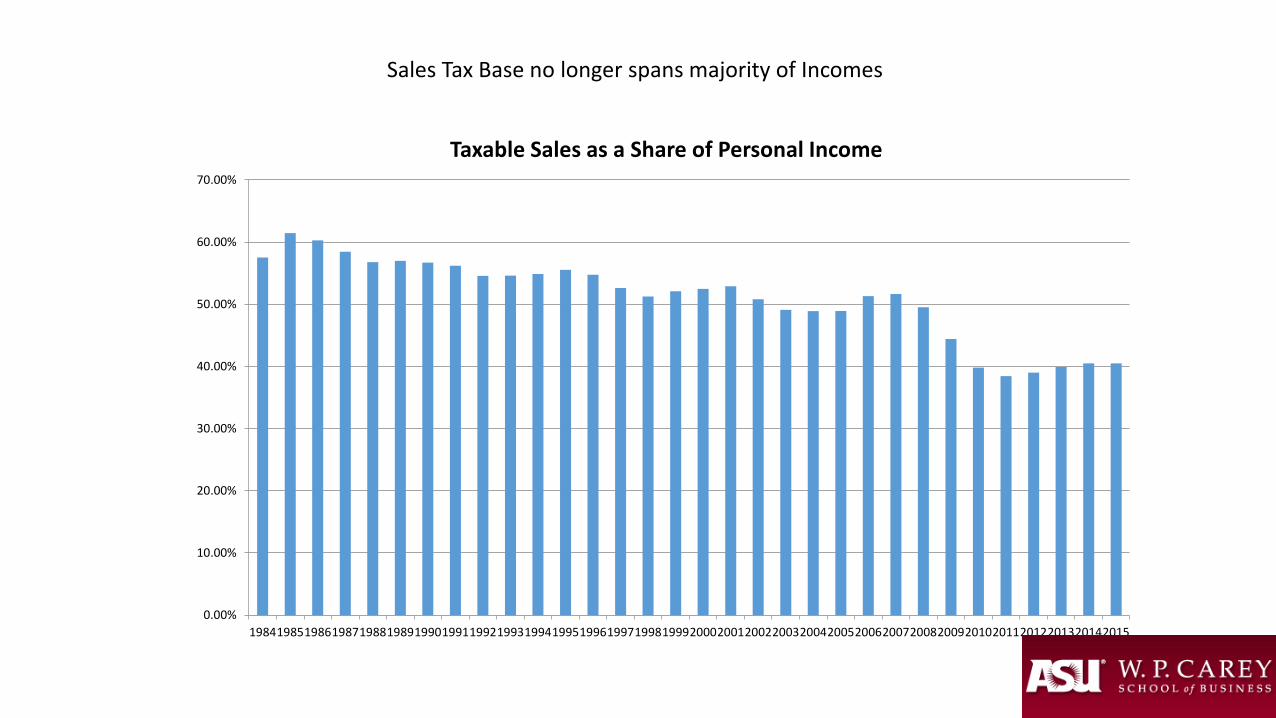
0.00%
10.00%
20.00%
30.00%
40.00%
50.00%
60.00%
70.00%
19841985198619871988198919901991199219931994199519961997199819992000200120022003200420052006200720082009201020112012201320142015
Taxable Sales as a Share of Personal Income
Sales Tax Base no longer spans majority of Incomes

0
100000
200000
300000
400000
500000
600000
700000
800000
900000
1000000
1988 1989 1990 1991 1992 1993 1994 1995 1996 1997 1998 1999 2000 2001 2002 2003 2004 2005 2006 2007 2008 2009 2010 2011 2012 2013 2014 2015 2016 2017 2018
AZ_SOI_GAIN_BASE AZ_SOI_GAIN_BASEF AZ_SOI_GAIN_OPTF AZ_SOI_GAIN_PESSF
Estimates of Income Tax Revenue Attributable to Capital Gains Income in AZ

Household Income$25,000 $50,000 $75,000 $100,000 $150,000
Total:Phoenix 100.0% 91.8% 89.4% 85.9% 85.9%Salt Lake City 95.5 94.7 95.8 93.7 91.5
Income Tax:Phoenix * 36.3 43.8 49.5 51.2Salt Lake City * 100.4 100.4 106.8 102.8
Property Tax:Phoenix 93.3 105.6 103.1 99.0 93.7Salt Lake City 93.6 80.1 78.2 75.1 71.1
Sales Tax:Phoenix 145.9 143.4 138.0 142.9 142.3Salt Lake City 126.8 125.3 118.0 122.5 120.5
Automotive Taxes:Phoenix 92.5 103.8 98.8 100.4 151.8Salt Lake City 115.8 111.8 104.5 100.0 101.3
TAXES PAID BY INDIVIDUALS IN 2013AS A PERCENTAGE OF THE MEDIAN OF 51 CITIES
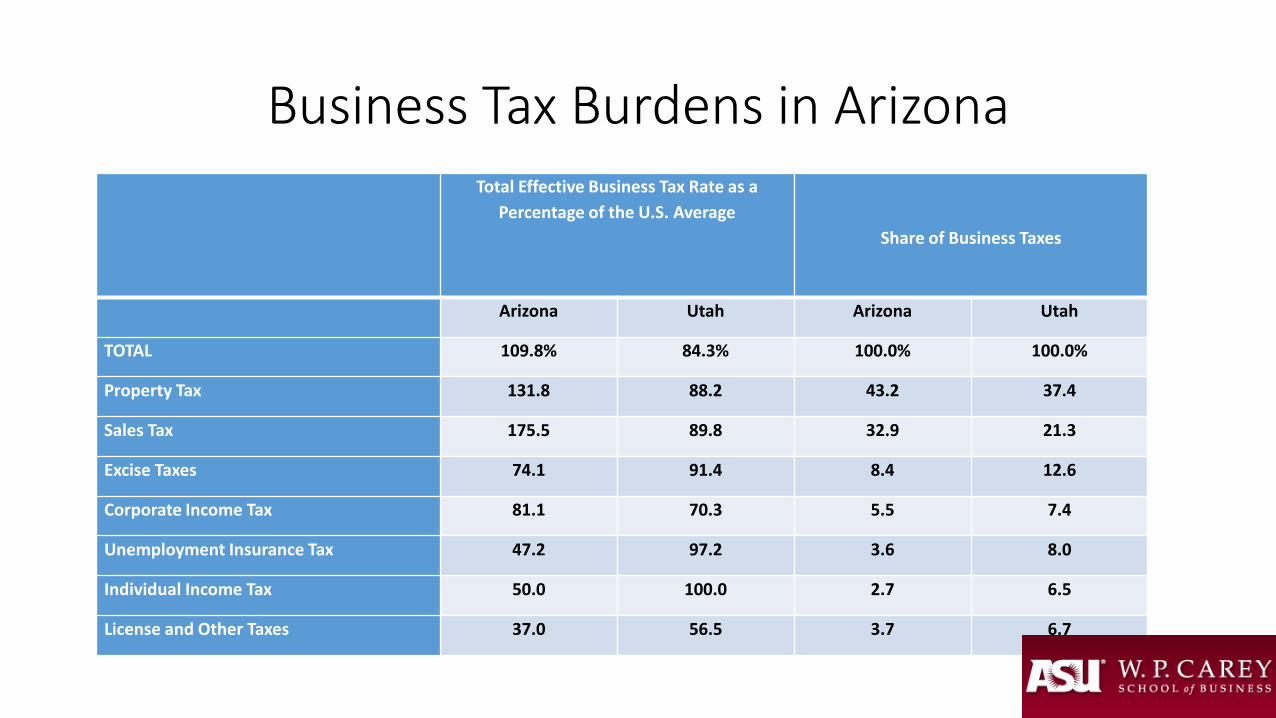
Business Tax Burdens in ArizonaTotal Effective Business Tax Rate as a
Percentage of the U.S. AverageShare of Business Taxes
Arizona Utah Arizona Utah
TOTAL 109.8% 84.3% 100.0% 100.0%
Property Tax 131.8 88.2 43.2 37.4
Sales Tax 175.5 89.8 32.9 21.3
Excise Taxes 74.1 91.4 8.4 12.6
Corporate Income Tax 81.1 70.3 5.5 7.4
Unemployment Insurance Tax 47.2 97.2 3.6 8.0
Individual Income Tax 50.0 100.0 2.7 6.5
License and Other Taxes 37.0 56.5 3.7 6.7
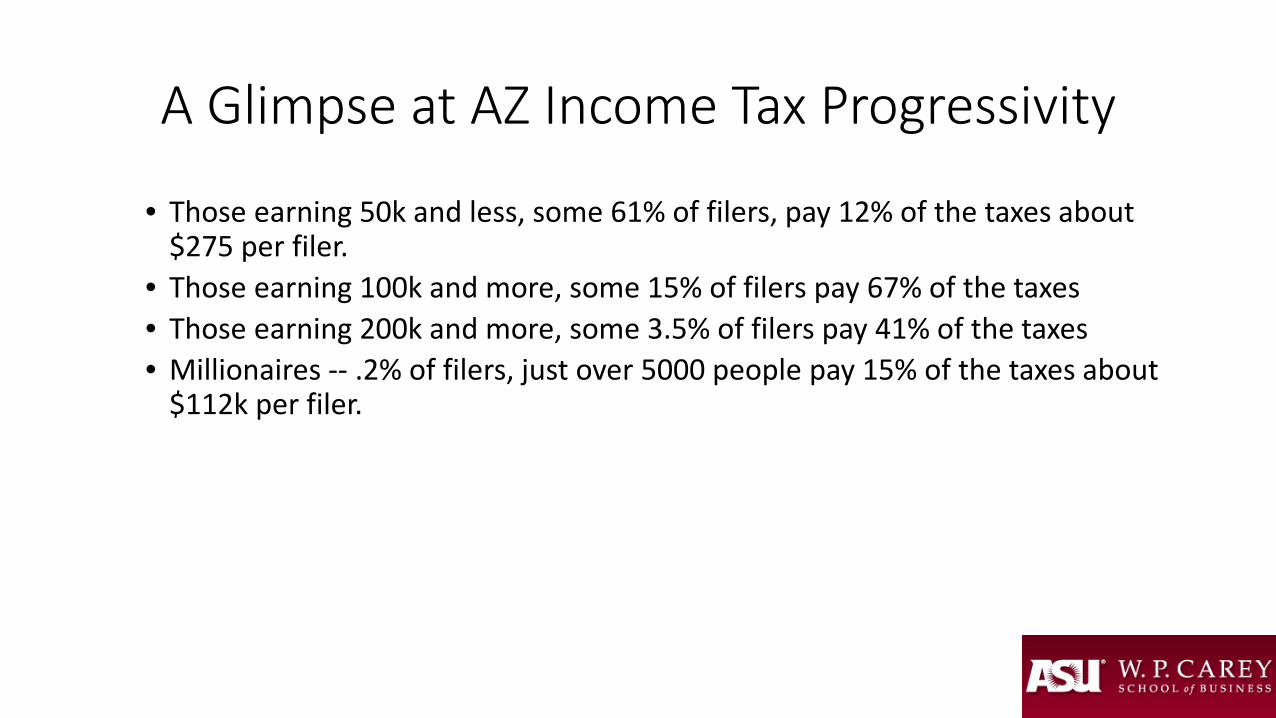
A Glimpse at AZ Income Tax Progressivity
• Those earning 50k and less, some 61% of filers, pay 12% of the taxes about $275 per filer.
• Those earning 100k and more, some 15% of filers pay 67% of the taxes• Those earning 200k and more, some 3.5% of filers pay 41% of the taxes• Millionaires -- .2% of filers, just over 5000 people pay 15% of the taxes about
$112k per filer.
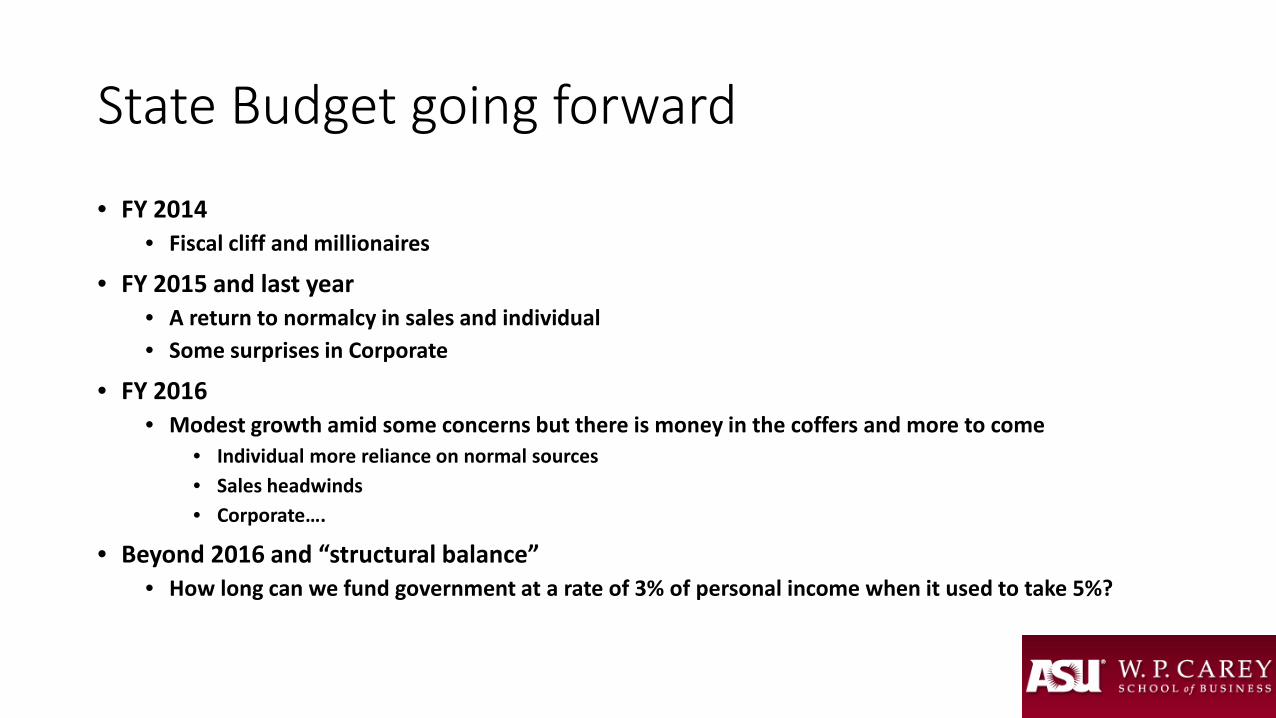
State Budget going forward
• FY 2014• Fiscal cliff and millionaires
• FY 2015 and last year• A return to normalcy in sales and individual• Some surprises in Corporate
• FY 2016• Modest growth amid some concerns but there is money in the coffers and more to come
• Individual more reliance on normal sources• Sales headwinds• Corporate….
• Beyond 2016 and “structural balance”• How long can we fund government at a rate of 3% of personal income when it used to take 5%?
Tax and Budget Reform
• Quest for Stability• Flatter income tax• Broader Sales tax• Greater reliance on residential property
• Concerns over Regressivity• Budgeting Reforms
• Two year cycles, • Wait till April• Triggers, surtaxes, rebates