economic and health benefits of bicycling in iowa · non-technical summary report title: ... to...
TRANSCRIPT
Economic and Health Benefits of Bicycling in Iowa
________________________________________________________________________________________________
The Economic and Health Benefits of Bicycling in Iowa www.uni.edu/step 2
Prepared for Iowa Bicycle Coalition
Research Team Brian Bowles
Kristine Fleming Kasee Fuller
Jordan Lankford Josh Printz
Advisors Jill Lankford, MLA, MUP
Sam Lankford, Ph.D. Oksana Grybovych, Ed.D.
Sustainable Tourism and Environment Program University of Northern Iowa, Fall 2011
Funding support provided by the Bikes Belong Coalition, Creating Great Places and the Iowa Bicycle Coalition
Economic and Health Benefits of Bicycling in Iowa
________________________________________________________________________________________________
The Economic and Health Benefits of Bicycling in Iowa www.uni.edu/step 3
NON-TECHNICAL SUMMARY
Report Title: Economic & Health Benefits of Bicycling in Iowa
Submitted to: Iowa Bicycle Coalition Principal Investigators: Jill Lankford, MLA, MUP, Director
Sam Lankford, Ph.D., Professor Oksana Grybovych, Ed.D., Assistant Professor
Brian Bowles, Research Assistant Kristine Fleming, M.A., Research Assistant
Kasee Fuller, M.A., Research Assistant Jordan Lankford, Research Assistant Josh Printz, B.A., Research Assistant
Sustainable Tourism and Environment Program
University of Northern Iowa Tel: (319) 273-6840 Fax: (319) 273-5958 Email: [email protected]
Web: www.uni.edu
Bicycling is a significant industry in the United States. Bicycle retailers represent a $5.9 billion industry in the United States (IBIS World, 2011). According to the Travel Industry Association of America, more than 27 million travelers have taken biking vacations in the past five years.
Research suggests tangible positive outcomes of bicycling. Bicycling has the potential to generate economic, social, and personal benefits and contribute to enhanced community identity. Importantly, bicycling leads to significant expenditures creating positive economic impacts in communities and in this case the State of Iowa. From a personal perspective and a health care perspective, cycling can reduce the prevalence of diseases related to obesity and sedentary lifestyles.
In 2010, a first-of-its kind study sponsored by the Bicycle Federation of Wisconsin estimated recreational cycling generates $1.5 billion in economic activity a year in Wisconsin. The figures, which include dollars produced by the state's bicycle manufacturing, sales and services industry, suggest cycling has as much impact on the state's economy as deer hunting. The Wisconsin study also quantified the health benefits of bicycling from reduced air pollution, and increased personal fitness.
Not only has biking grown to be one of the most popular outdoor vacations in America, Iowa attracts bikers due to the extensive trail system in the state, and high visibility events such as RAGBRAI (Register’s Annual Great Bicycle Ride Across Iowa). Total direct spending (dollars paid for services by travel parties for the event) while in Iowa for RAGBRAI was estimated at $16,908,642 (8802 travel parties paying an average of $1,921) (www.uni.edu/step).
________________________________________________________________________________________________
The Economic and Health Benefits of Bicycling in Iowa www.uni.edu/step 4
According to the Iowa Bicycle Coalition there are over 1,600 miles of trails. The Iowa State Comprehensive Outdoor Recreation Plan (SCORP, 2006) notes that 7% (152,000) of Iowans mountain bike and 41% use trails for fitness (biking/walking). In 2011, Iowa ranked sixth in the nation in terms of bicycle friendliness (League of American Bicyclists, 2011). Among the criteria of these rankings, Iowa ranks highly in bicycle education and encouragement, as well as enforcement. According to the Iowa Department of Public Health, 29.3% of Iowans do not meet the recommended levels of physical activity (2010). In addition, only 43% of Iowans participate in the recommended levels of physical activity (IDPH, 2004). Along with low levels of physical activity, the 2009 Center for Disease Control (CDC) Behavioral Risk Factor Surveillance System (BRFSS) data estimated 67.2% of Iowan adults were overweight or obese (28.5% - overweight; 38.7% - obese). With low levels of physical activity and higher rates of obesity, Iowans are at a great risk of developing chronic diseases that will not only impact their physical health, but also influence the cost of health care as the prevalence of non-communicable disease (NCD) continues to grow (WHO, 2010). In Iowa, the cost of health care associated with obesity-related diseases is estimated at $783 million (Finkelstein, Fiebelkorn, & Want, 2004). The estimated costs do not include expenses related to absenteeism and low work productivity (IDPH, 2009). This study identifies the economic and health impacts of bicycling in Iowa. Impacts are estimated based on spending by individual cyclists, bicycle specific retail sales, economic activity generated by bicycle organizations, and health cost savings in the State of Iowa. The study is based on primary data collected from individual cyclists, bicycle specific retail operators and bicycle organizations. Health impacts are based on selected primary and secondary data detailed in the methodology. This study presents:
A profile of the commuter and recreational cyclists in Iowa (party and trip characteristics, spending, and demographic profiles);
A profile of bicycle retail establishments in Iowa;
A profile of bicycle organizations in Iowa; and
A profile of the health benefits and health savings from cycling in Iowa. The data for the study were collected using three questionnaires that were distributed to bicycle riders, bicycle- specific retail businesses and bicycle organizations in Iowa during the fall of 2011. The U.S. Census and Iowa Department of Transportation statistics were utilized to estimate the number of bicycle riders. Health statistics were obtained from the Centers for Disease Control and the Iowa Department of Public Health.
________________________________________________________________________________________________
The Economic and Health Benefits of Bicycling in Iowa www.uni.edu/step 5
ECONOMIC AND HEALTH IMPACTS OF COMMUTERS. There are an estimated 24,921 bicycle commuters in Iowa, who ride to work from 1-6 times a week. Commuter respondents to the survey (n=1050, 1.43 travel party size) spend on average $1,160 per year for bicycle related activities. The IMPLAN models estimate the economic impact of commuter cyclist spending to generate $51,965,317 in direct and indirect impacts to the State of Iowa. The bicycle commuter population (assuming they are physically fit, and ride the amount of time/distance as reported in surveys) is estimated to save Iowa $13,266,020 in health care costs. ECONOMIC AND HEALTH IMPACTS OF RECREATIONAL RIDERS. There are an estimated 149,916 recreational riders on Iowa’s trails (this figure is conservative and may be higher due to tourism), who use the trails from 1-6 times a week. Sixty three percent (63%) of the recreational survey respondents (n=998, 1.47 travel party size) reported taking overnight bicycle trips to other Iowa communities. Recreation riders spend on average $1,208 per travel party. The IMPLAN models estimate the economic impact of recreational cyclist spending to generate $364,864,202 in direct and indirect impacts to the State of Iowa. Recreational bicycle riders (assuming they are physically fit and ride the amount of time/distance as reported in the surveys) are estimated to save the State of Iowa $73,942,511 in health care costs. CHARACTERISTICS OF BICYCLE RETAIL ESTABLISHMENTS. There are 61 known bicycle retail businesses in Iowa (not including large chains). Surveys were sent to 38 establishments (those with emails) and 52% responded. There were 18,300 bicycles sold (20% road bikes, 11% children, 21% mountain bikes, and 48% leisure bikes) last year. There was $8,063,834 sales in bikes, $1,921,500 sales in clothing, $4,209,000 sales in accessories, and $3,658,231 in repair work. The U.S. Bureau of Labor Statistics estimates the payroll in bicycle retail businesses in Iowa to be from $3,384,615 to $4,309,625 in employment impact. Throughout the state of Iowa, using the median revenues and expenses estimated by the survey, a total of $18,157,565 is the estimated total expenses for the sixty-one bicycle specific retail establishments in Iowa. Using the same method, a total of $8,665,568 was estimated for expenses in the establishments who responded to the survey. CHARACTERISTICS OF BICYCLE ORGANIZATIONS AND CLUBS. In Iowa there are approximately 800 bicycle organizations formed specifically for RAGBRAI. The majority of these organizations are not active throughout the year. However 15 do remain active and organize regional bicycle events. The average size of the membership of these organizations is 106 members. Nearly 90% of the respondents to the survey reported taking part in bicycle events. The average budget for the organizations is $21,587 per year, funded by corporations (19%); sponsorships (37%), and donations (44%). On average, there are 12 volunteers per organization (total 124) who spend about 21 hours a month working for the organization. Each organization holds at least 1 event a year and up to 7 per year. The economic value of these volunteers is estimated to be $339,040.

________________________________________________________________________________________________
The Economic and Health Benefits of Bicycling in Iowa www.uni.edu/step 6
Contents
NON-TECHNICAL SUMMARY ....................................................................................... 3
INTRODUCTION .......................................................................................................... 8
Purpose and Organization of the Study ................................................................ 10
Project Methodology ............................................................................................. 10
CYCLISTS’ RIDING BEHAVIORS AND SPENDING PATTERNS .......................................... 13
Methodology ......................................................................................................... 13
Research Participants. ......................................................................................... 13
Results ................................................................................................................... 13
Demographics. ..................................................................................................... 18
ECONOMIC IMPACT OF CYCLING IN IOWA ................................................................. 20
Understanding Direct, Indirect and Multiplier Effects ........................................ 20
Commuters .......................................................................................................... 21
Recreational Riders ............................................................................................. 22
BICYCLE RETAIL ESTABLISHMENTS ............................................................................. 24
Methodology ......................................................................................................... 24
Research Participants. ......................................................................................... 24
Results ................................................................................................................... 24
Customer Base..................................................................................................... 24
Bicycles Sold ........................................................................................................ 26
Revenue and Expense Impact. ............................................................................ 27
Employment Impact ............................................................................................ 28
Advocacy Importance and Funding. .................................................................... 30
BICYCLE ORGANIZATIONS ......................................................................................... 32
Methodology ......................................................................................................... 32
Participants. ......................................................................................................... 32
Results ................................................................................................................... 33
HEALTH AND BICYCLING ............................................................................................ 37
Methodology ......................................................................................................... 37
Population. .......................................................................................................... 38
Prevalence ........................................................................................................... 38

________________________________________________________________________________________________
The Economic and Health Benefits of Bicycling in Iowa www.uni.edu/step 7
Cost of Care. ........................................................................................................ 38
Results ................................................................................................................... 39
Summary of Health Impacts.................................................................................. 39
REFERENCES ............................................................................................................. 42
Health References ................................................................................................. 46
Bicycle Organizations/Cyclist Count References ................................................... 48
Bicycle Retail Establishment Economic Impact References .................................. 48
Appendix 1: Number of Cyclists ................................................................................. 51
Appendix 2: Model of Multiplier Concept ................................................................. 53
________________________________________________________________________________________________
The Economic and Health Benefits of Bicycling in Iowa www.uni.edu/step 8
INTRODUCTION
According to the Travel Industry Association of America, more than 27 million travelers have taken biking vacations in the past five years. Not only has biking grown to be one of the most popular outdoor vacations in America, Iowa attracts bikers due to the extensive trail system in the state, and high visibility events such as RAGBRAI (Register’s Annual Great Bicycle Ride Across Iowa). Bicycling is one of the most popular outdoor recreation activities in Iowa. According to the Iowa Bicycle Coalition there are over 1,600 miles of trails. The Iowa State Comprehensive Outdoor Recreation Plan (SCORP, 2006) notes that 7% (152,000) of Iowans mountain bike and 41% use trails for fitness (biking/walking).
The economic impact of bicycling special events and bicycle races/competitions are well documented in the literature. For example, the RAGBRAI event has been estimated to generate millions in spending. The total direct spending (dollars paid for services by travel parties for the event) while in Iowa for the event was estimated at $16,908,642 in Iowa. To arrive in Iowa, the participants’ total DIRECT spending (dollars paid for services by travel parties traveling to Iowa for the event) were estimated to be $20,684,700 (http://www.uni.edu/step/reports/STEP_RAGBRAI.pdf). In a study of the Outer Banks by North Carolina University, bicycling visitors have a direct and substantial economic impact on the area. A conservative estimate of bicyclists' expenditures in the northern Outer Banks is $60 million annually. These visitor expenditures are expected to produce many other widespread benefits to the local economy, including: 1) 1,400 jobs created or supported annually; 2) Increased retail sales to local restaurants, lodging establishments and retail stores; and 3) Subsequent expenditures by local merchants to suppliers of materials and services. An investment in infrastructure to support bicycling has the potential to revitalize communities and bring visitors to areas. These visitors when not biking will engage in cultural, arts, sports and heritage activities in the area.
In addition to complementing visitor attractions and spending, bicycling is a significant industry in the Unites States. Bicycle retailers represent $5.9 billion industry in the United States (IBIS World, 2011).
In 2010, a first-of- its kind study sponsored by the Bicycle Federation of Wisconsin estimated recreational cycling generates $1.5 billion in economic activity a year in Wisconsin. The figures, which include dollars produced by the state's bicycle manufacturing, sales and services industry, suggest cycling has as much impact on the state's economy as deer hunting. The Wisconsin study also quantified the health benefits of bicycling from reduced air pollution, and increased personal fitness.
________________________________________________________________________________________________
The Economic and Health Benefits of Bicycling in Iowa www.uni.edu/step 9
The Iowa Department of Transportation (retrieved 2010, http://www.iowadot.gov/iowabikes/trails/CHPT02.HTML) notes the benefits of trails in Iowa provide, aside from pure recreational opportunity, the following benefits:
Health, fitness, and quality of life. Transportation. Open space and natural area preservation and enhancement. Economic development. User safety.
As the health of Iowans continues to deteriorate, realistic measures need to be taken in order to improve the lives of residents. With physical activity, the prevalence of non-communicable diseases (NCDs) such as heart disease, stroke, diabetes, breast cancer, and colon cancer may be reduced (WHO, 2010). The Center for Disease Control (CDC) estimates that in addition to nutrition and smoking behavior, physical activity may help to reduce 80% of illnesses related to diabetes, heart disease, and stroke, as well as 40% of some cancers (2009). According to the Iowa Department of Public Health, 29.3% of Iowans do not meet the recommended levels of physical activity (2010). In addition, only 43% of Iowans participate in the recommended levels of physical activity (IDPH, 2004). Along with low levels of physical activity, the 2009 CDC Behavioral Risk Factor Surveillance System (BRFSS) data estimated 67.2% of Iowan adults were overweight or obese (28.5% - overweight; 38.7% - obese). Rates of obesity are often higher in people who live in rural areas compared to those living in urbanized communities (Ingram & Franco, 2006). In addition, physical activity levels are often lower in citizens of rural communities compared to those in urban areas (Ingram & Franco, 2006). With low levels of physical activity and higher rates of obesity, Iowans are at a great risk of developing chronic diseases that will not only impact their physical health, but also influence the cost of health care as the prevalence of NCDs continues to grow (WHO, 2010). The cost of health care associated with obesity related diseases is enormous. Throughout the US, $93 billion is estimated to be spent on obesity related health care. In Iowa, these costs are estimated at $783 million (Finkelstein, Fiebelkorn, & Want, 2004). The estimated costs do not include expenses related to absenteeism and low work productivity (IDPH, 2009). Health care costs related to diseases associated with obesity include heart disease, stroke, diabetes, and cancer (IDPH, 2009). With increased participation in physical activity, the rate at which NCDs occur will be reduced (WHO, 2010), thus minimizing the costs associated with these illnesses. The World Health Organization (WHO) recommends adults participate in 150 minutes of moderate-vigorous physical activity each week (2010). Transportation may be used to meet these standards through the use of cycling (WHO, 2010). Employees who cycle to work are more likely to have improved health outcomes than those who use motorized

________________________________________________________________________________________________
The Economic and Health Benefits of Bicycling in Iowa www.uni.edu/step 10
transportation (Vuori & Paronen, 1994; Chida, 2008). Active transportation to work allows for commuters to have increased rates of physical activity participation and more opportunities to establish and maintain the benefits of improved health (Oja, Vuori, & Paronen, 2000). In 2011, Iowa was ranked sixth in the nation in terms of bicycle friendliness (League of American Bicyclists, 2011). Among the criteria of these rankings, Iowa ranks highly in bicycle education and encouragement, as well as enforcement. Areas of extreme need, according to this ranking, are legislation, evaluation and planning. Increasing support in these areas may greatly affect the economic impacts, as well as the health of citizens. To examine the unique potential and the opportunities brought about by the bicycle industry and users in Iowa, the following study examines the economic and health benefits of bicycling in Iowa. The findings may be used to inform policy makers and potential investors of the potential of bicycling for economic development in the State of Iowa.
Purpose and Organization of the Study
The purpose of the present study is to identify the economic and health impacts of bicycling in Iowa. Economic impact is measured based on spending by individual cyclists, bicycle specific retail sales, economic activity generated by bicycle organizations, and health cost savings in the State of Iowa. The study is based on primary data collected from individual cyclists, bicycle specific retail operators and bicycle organizations. Health impacts are based on selected primary and secondary data detailed in the methodology. Measuring the economic impact of bicycling in Iowa requires assessing a range of related activities and business. This project focused on four areas of economic activity related to cycling and is organized into four sections. Each section includes the research methodology specific to the section and findings. The first section includes data collected from individual cyclists and details their riding and spending habits. The second section includes economic information collected from bicycle specific retail establishments. The third section includes information collected from bicycle organizations in the state. The fourth section discusses the health impacts of cycling in Iowa.
Project Methodology
This project methodology describes the general approach used to identify the economic and health impacts of cycling in Iowa. A more detailed methodological description introduces each section of the report. In developing the methodology of this research and displaying data for this project, the approach was to provide a rationale for the data and assumptions. A number of other similar studies were reviewed to develop the research approach. In particular, a document titled, “Estimating the Economic Benefits
________________________________________________________________________________________________
The Economic and Health Benefits of Bicycling in Iowa www.uni.edu/step 11
of Bicycling and Bicycle Facilities: an Interpretive Review and Proposed Methods,” was consulted (Krizec, 2007). While interpreting data, conservative methods were used, including using median values instead of mean values where valid, in order to make sure that the information provided to readers was the most accurate possible. One pitfall noted in the Krizec article that we could not prevent, however, was the involvement of a bicycle organization (Iowa Bicycle Coalition). Although this organization was the client for this project, careful attention was taken to make the most objective and conservative estimates possible. In fact, the Iowa Bicycle Coalition only provided support for contacting organizations and individuals in Iowa. Primary data were collected through a survey of individual cyclists, bicycle specific retail businesses, and bicycle organizations using three questionnaires. The Iowa Bicycle Coalition assisted with the distribution of each questionnaire by providing an introductory email with a link to the appropriate questionnaire. The Iowa Bicycling Coalition (IBC) was established in 2003 to promote Iowa cycling as safe and enjoyable recreation and transportation. The 501(c)(3) non-profit group was launched by bicycling advocates from across Iowa to unite the voices of road riders, mountain bikers, recreation riders, commuters, and anyone else who prefers to bicycle for recreation and transportation. Information received from the questionnaires was collected online through Survey Monkey. Spending patterns reported by individual cyclists were used to calculate the economic impact of spending by cyclists in Iowa using IMPLAN software. IMPLAN is a software program that assists in calculating the direct and indirect economic impact. The total economic impact of cyclers is based on an estimate of the total number of commuter and recreational cyclists in Iowa. This estimate was based on U.S Census Bureau American Community Survey (2010) and the Iowa Department of Transportation trail use data. The expenditure data for the model was derived from the survey mentioned above. Bicycle retailers range in size from small family owned stores to large national chains, and represent a $5.9 billion industry in the United States (IBIS World, 2011). A questionnaire was distributed to a segment of bicycle retail establishments in Iowa to determine basic economic indicators as well as market demographics. Participants for this project represent the industry segment of bicycle specific retailers in the State of Iowa. “Bicycle specific retail,” is a term that refers to retail establishments that sell and repair bicycles, bicycle accessories, clothing related to bicycling and other bicycle specific goods. No mixed athletic retail or general retail stores that may sell bicycles and complementary products were included. Accordingly, the economic activity related to bicycle sales and repair reported in this study is conservative and does not reflect all bicycle sales and repair in Iowa. In Iowa there are approximately 800 bicycle organizations, formed specifically for RAGBRAI. The majority of these organizations disband during the “off season” when
________________________________________________________________________________________________
The Economic and Health Benefits of Bicycling in Iowa www.uni.edu/step 12
RAGBRAI has ended. A questionnaire was distributed to 15 bicycle organizations which function throughout the year. The questionnaire included questions regarding membership, event planning and financial activity and support. Health care cost savings were determined by identifying the prevalence of non-communicable diseases related to inactivity, by cost of care, each specific to a metropolitan statistical area (MSA). This total was multiplied by the percentage of commuter cyclists in the MSA’s in Iowa. These data were derived from the Centers for Disease Control (CDC, 2010) risk trends in MSA’s. In addition, data for recreational riders were derived from the surveys mentioned above.

________________________________________________________________________________________________
The Economic and Health Benefits of Bicycling in Iowa www.uni.edu/step 13
CYCLISTS’ RIDING BEHAVIORS AND SPENDING PATTERNS
Nationally bicycling is one of the five most popular outdoor recreation activities (Outdoor Industry Foundation, 2006). The Iowa State Comprehensive Outdoor Recreation Plan (SCORP, 2006) notes that 7% (152,000) of Iowans mountain bike and 41% use trails for fitness (biking/walking). Iowa attracts bikers due to the extensive trail system in the state, and high visibility events such as RAGBRAI. The purpose of this section was to determine the riding behaviors, spending patterns and demographics of Iowa cyclists.
Methodology
Data were collected from cyclists using a questionnaire-based survey posted on survey monkey an online survey tool. The questionnaire consisted of 25 questions divided into four parts:
The first part of the questionnaire included questions relating to commuting to work by bicycle (e.g. frequency, average distance, average minutes ridden per ride).
The second part of the questionnaire included questions relating to cycling for recreation (e.g. frequency, average distance, average minutes per ride).
The third part of the questionnaire included questions regarding overnight trips and spending patterns.
The fourth part of the questionnaire included demographic questions (e.g. age, gender, residence, education level and total annual income).
Research Participants. Convenience sampling was used to select participants for the study. An initial email was sent to all members and contacts of the Iowa Bicycle Coalition to inform them about this study. Follow up emails were sent out to remind the members and contacts of the Iowa Bicycle Coalition to participate in the survey. Participants were given two weeks to complete the questionnaire.
Results
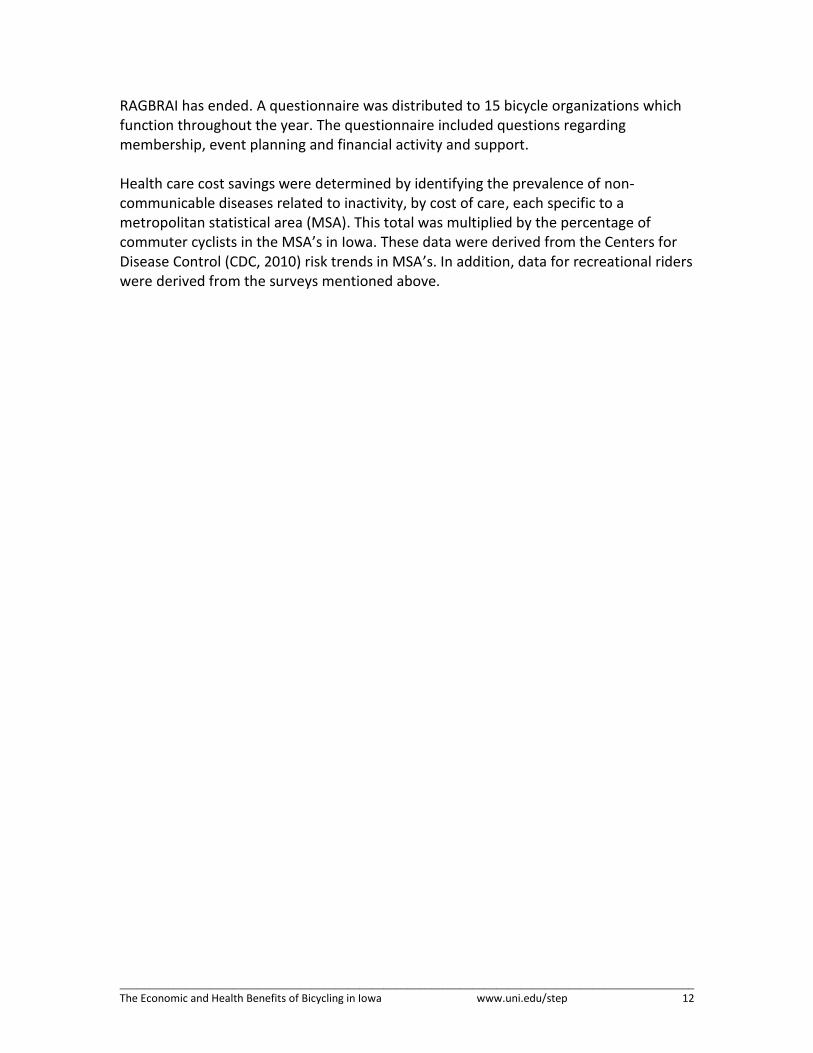
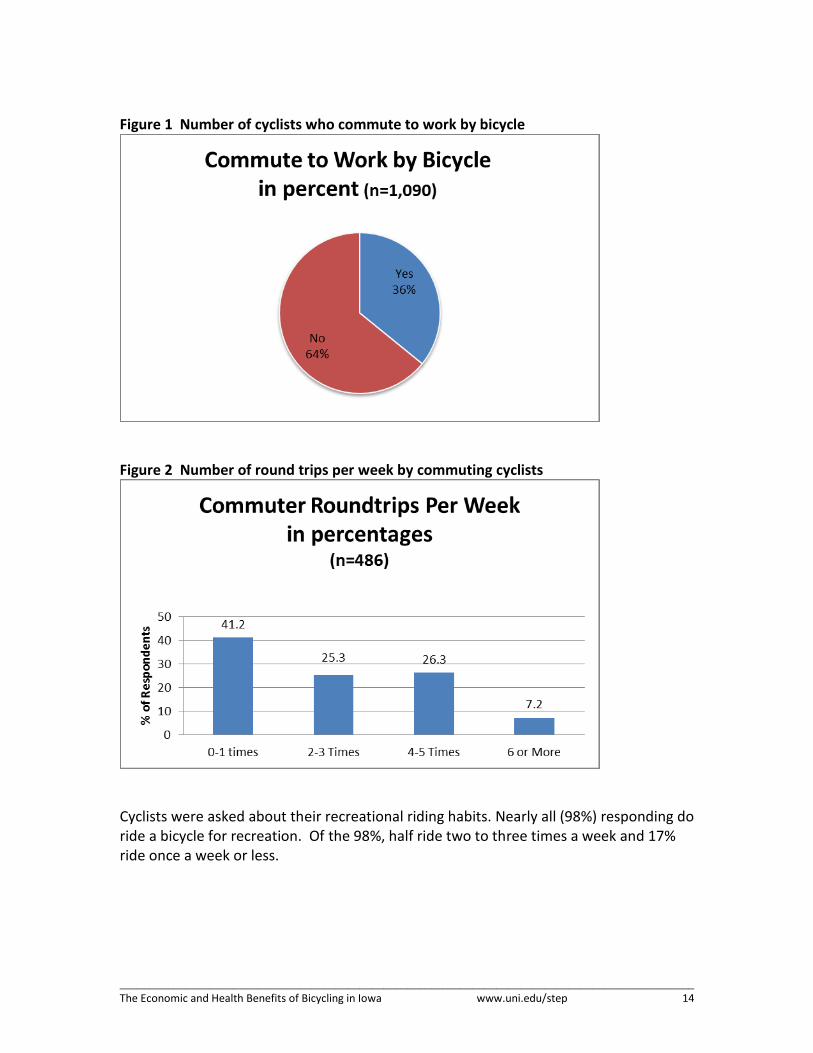
Cyclists were asked about their commuting behaviors. The majority of the participants (64%) do not commute to work via bike. Of the cyclists that do commute to work (n=390), Figure 2 shows the frequency of commute trips made each week. While 41% of those ride to work once a week or less, over 51% make between two to five round trips per week .
________________________________________________________________________________________________
The Economic and Health Benefits of Bicycling in Iowa www.uni.edu/step 14
Figure 1 Number of cyclists who commute to work by bicycle
Figure 2 Number of round trips per week by commuting cyclists
Cyclists were asked about their recreational riding habits. Nearly all (98%) responding do ride a bicycle for recreation. Of the 98%, half ride two to three times a week and 17% ride once a week or less.

________________________________________________________________________________________________
The Economic and Health Benefits of Bicycling in Iowa www.uni.edu/step 15
Figure 3 Number of cyclists who ride for recreation
Figure 4 Number of round trips per week by recreational cyclists
Cyclists were asked about their use of bicycles for short trips of five miles or less. Figure 5 displays the frequency with over 25% making short trips on bicycles often or always.

________________________________________________________________________________________________
The Economic and Health Benefits of Bicycling in Iowa www.uni.edu/step 16
Figure 5 Frequency of riding a bike for short trips vs. car
Figure 6 clearly identifies the degree to which cycling facilities influence participation according to respondents. Figure 6 Degree to which cycling facilities influence participation in cycling
Figure 7 displays that 58% of the cyclists spent over $250 annually on cycling. A majority (63%) of cyclists do take overnight cycling trips

________________________________________________________________________________________________
The Economic and Health Benefits of Bicycling in Iowa www.uni.edu/step 17
Figure 7 Average annual spending on cycling
Figure 8 Overnight cycling trips
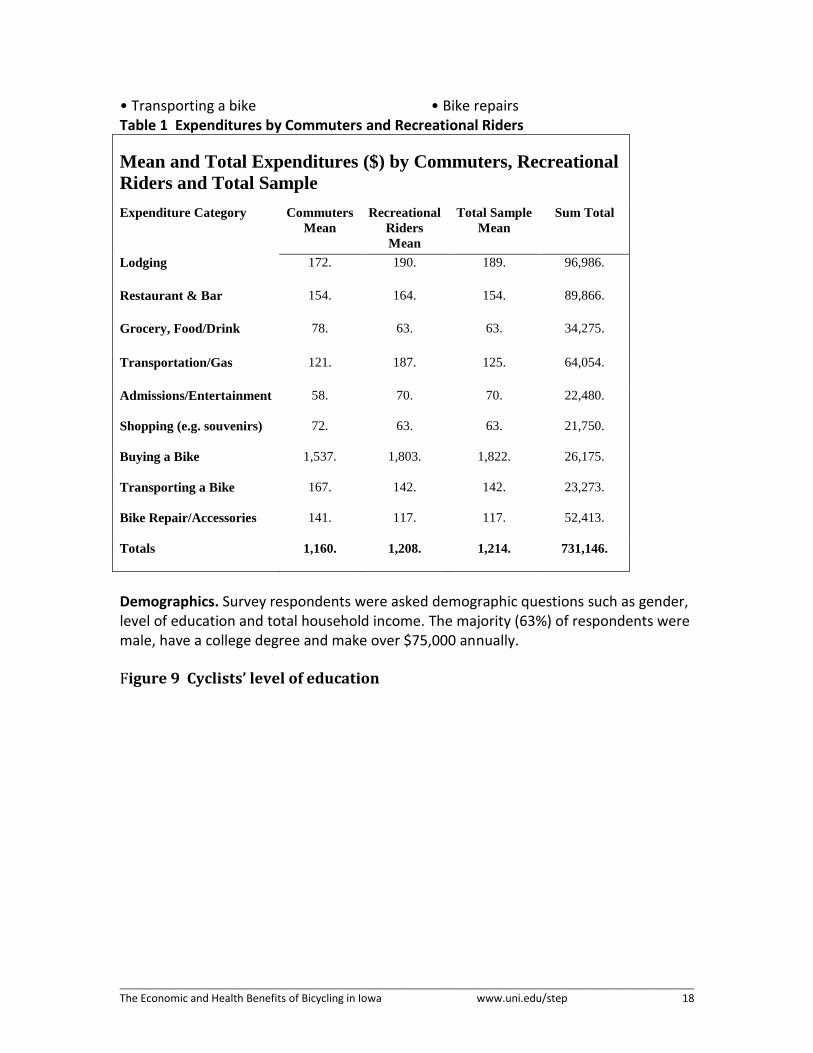
Survey respondents were asked to estimate their expenditures for their own travel party for overnight trips. Average travel party size was 1.5. Expenditures were broken up into eight different categories including: • Lodging • Restaurant and bar meals and drinks • Grocery/ convenience store purchases
• Transportation expenses/ gas • Admissions • Shopping (souvenirs, clothes, etc)
________________________________________________________________________________________________
The Economic and Health Benefits of Bicycling in Iowa www.uni.edu/step 18
• Transporting a bike • Bike repairs Table 1 Expenditures by Commuters and Recreational Riders
Mean and Total Expenditures ($) by Commuters, Recreational
Riders and Total Sample
Expenditure Category Commuters
Mean
Recreational
Riders
Mean
Total Sample
Mean
Sum Total
Lodging 172. 190. 189. 96,986.
Restaurant & Bar 154. 164. 154. 89,866.
Grocery, Food/Drink 78. 63. 63. 34,275.
Transportation/Gas 121. 187. 125. 64,054.
Admissions/Entertainment 58. 70. 70. 22,480.
Shopping (e.g. souvenirs) 72. 63. 63. 21,750.
Buying a Bike 1,537. 1,803. 1,822. 26,175.
Transporting a Bike 167. 142. 142. 23,273.
Bike Repair/Accessories 141. 117. 117. 52,413.
Totals 1,160. 1,208. 1,214. 731,146.
Demographics. Survey respondents were asked demographic questions such as gender, level of education and total household income. The majority (63%) of respondents were male, have a college degree and make over $75,000 annually. Figure 9 Cyclists’ level of education

________________________________________________________________________________________________
The Economic and Health Benefits of Bicycling in Iowa www.uni.edu/step 19
0.13.8
12.9
39.6
9.5
31.9
2.2
0
10
20
30
40
50
% o
f R
esp
on
den
ts
Education Levelin percentages (n=967)
Figure 10 Cyclists’ total 2011 annual household income

________________________________________________________________________________________________
The Economic and Health Benefits of Bicycling in Iowa www.uni.edu/step 20
ECONOMIC IMPACT OF CYCLING IN IOWA
Spending patterns reported by individual cyclists were used to calculate the economic impact of spending by cyclists in Iowa using IMPLAN software. The total economic impact of cyclers is based on an estimate of the total number of commuter and recreational cyclists in Iowa. This estimate was based on U.S Census Bureau American Community Survey (2010) and the Iowa Department of Transportation trail use data. In order to estimate the economic impact of cycling in Iowa, data were collected from recreational and commuter cyclists. Resulting IMPLAN models estimate economic effects of riders’ expenditures in selected counties in Iowa (based on completed U.S. Census data for bicycle riders for commuters and Iowa Department of Transportation data) on the total value of economic transactions, on the overall level of household income, and on the number of jobs created. Two economic impact models were created: (1) the first models accounted for riders’ mean expenditures in primary and adjacent counties; (2) the second models utilized median data for the primary and contiguous counties to deliberately avoid overinflating economic impacts and multipliers. Even though it is a common practice in economic impact studies to include contiguous areas into examination, enlarged study areas carry with them larger economic impacts and higher multipliers, and therefore a risk of overinflating economic impacts. In order to present the most accurate picture of economic impacts of bicycling in Iowa, the two models are compared side by side (see tables below). The reader is advised to think of real economic impacts as numbers somewhere in the middle or perhaps closer to the median values reported. Please note: The literature for multipliers of sporting events range anywhere from .7 to 5 and even 7. Several authors warn about the risks of overstating the impacts, and argue that even multipliers of 2 are too high.
Understanding Direct, Indirect and Multiplier Effects
Direct impacts (inputs) are injections in the economy that are multiplied further,
based on linkages of different economic sectors in the area. Direct effects are the economic impacts in different economic sectors that are derived directly from the injection of these inputs. Indirect effects measure the total value of supplies and services supplied to related businesses. Induced effects accrue when related businesses and businesses in the indirect industries spend their earnings (wages, salaries, profits, rent and dividends) in goods and services in the area. The total impacts are the sum of direct, indirect and induced effects and are the total of transactions attributable directly to expenditures of bike riders in the selected counties (see Appendix 2).
________________________________________________________________________________________________
The Economic and Health Benefits of Bicycling in Iowa www.uni.edu/step 21
The multiplier effect refers to the number of times a dollar “changes hands” within the community before it leaks out of the community. For example, the bike rider pays the local merchant, the local merchant spends money at the grocery store, the grocery store pays its cashier, and so on. For ease of interpretation, this number of times a dollar “changes hands” within the community is quantified as one number by which all expenditures are multiplied. It should be remembered however that a multiplier represents an estimate, and should be interpreted respectively.
Many studies rely on estimates of visitor expenditures and visitor data.
Therefore it is usually recommended that economic impact studies are customized for a specific area, and not rely on averages. Otherwise the likelihood of overemphasizing the impacts generated by sectors, and creating a misleading statement of the impacts, increases.
The multiplier effect demonstrates the process through which initial spending in a region generates further rounds of re-spending within the region. The rippling process of subsequent re-spending is the multiplier effect. The basic principle of the multiplier effect begins with an initial spending as an increased income into an economy. A portion of the increased income is spent and further re-spent within the region (Archer, 1984; Crompton, 1995; Wang, 1997). In summary, there are three elements that contribute to the total impact of visitor spending: Direct impact (the first-round effect of visitor spending), Indirect impact (the ripple effect of additional rounds of re-circulating the initial visitors' dollars), and Induced impact, which is further ripple effects caused by employees of impacted business spending some of their salaries and wages in other business in the host community (Howard & Crompton, 1995).
Commuters
The IMPLAN model for commuters included Black Hawk, Johnson, Linn, Polk, Pottawattamie, Woodbury, and contiguous counties (a total of thirty-seven counties). The area under examination is 22,427 square miles, with the population of 1,787,010 residents, or 728,087 households (IMPLAN model). Mean score values: Expenditures of commuters had a direct economic impact of $41.45 million in direct sales, $27.08 million in value added/ income, and supported 975 jobs in the region. In total, accounting for the secondary effects, commuters supported $91.16 million in direct sales, $56.36 million in value added/ income, and 1,484 jobs in the area (see table below). All reported estimates are based on the total number of 26,274 commuters (or 18,373 spending parties; mean party size 1.43).

________________________________________________________________________________________________
The Economic and Health Benefits of Bicycling in Iowa www.uni.edu/step 22
Median score values: Expenditures of commuters had a direct economic impact of $23.61 million in direct sales, $15,64 million in value added/ income, and supported 569 jobs in the region. In total, accounting for the secondary effects, commuters supported $51.97 million in direct sales, $32.38 million in value added/ income, and 862 jobs in the area (see table below). All reported estimates are based on the total number of 26,274 commuters (or 18,373 spending parties; mean party size 1.43).
Table 2 The economic impact of commuters (means and medians)*
*Model results have been deflated and aggregated
Recreational Riders
The IMPLAN model for recreational riders included Black Hawk, Bremer, Carroll, Cerro Gordo, Howard, Humboldt, Jasper, Jefferson, Johnson, Linn, Mahaska, Marion, Marshall, Pottawattamie, Poweshiek, Scott, Winneshiek, Woodbury, and contiguous counties (a total of fifty-six counties). The area under examination is 32,384 square miles, with the population of 2,263,767 residents, or 933,461 households (IMPLAN model). Mean scores: Expenditures of recreational riders had a direct economic impact of $250.09 million in direct sales, $164.57 million in value added/ income, and supported 6,097 jobs in the region. In total, accounting for the secondary effects, recreational riders supported $535.53 million in direct sales, $331.13 million in value added/ income, and 9,068 jobs in the area (see table below). All reported estimates are based on the total number of 149,916 recreational riders (or 101,984 spending parties; mean party size 1.47). Median scores: Expenditures of recreational riders had a direct economic impact of $170.27 million in direct sales, $113.37 million in value added/ income, and supported 4,277 jobs in the region. In total, accounting for the secondary effects, recreational riders supported $364.84 million in direct sales, $227.19 million in value added/ income, and 6,309 jobs in the area (see table below). All reported estimates are based on the total number of 149,916 recreational riders (or 101,984 spending parties; mean party size 1.47).
Model 1 Means Model 2 Medians
Total output $91,163,014 $51,965,317
Output multiplier 2.20 2.18
Total value added/ Income $56,356,910 $32,375,511
Income multiplier 2.08 2.07
Total employment/ Jobs 1,484 862
Employment multiplier 1.52 1.51

________________________________________________________________________________________________
The Economic and Health Benefits of Bicycling in Iowa www.uni.edu/step 23
Table 3 The economic impact of recreational riders (means and medians)*
*Model results have been deflated and aggregated
Model 1 Means Model 2 Medians
Total output $535,526,124 $364,864,202
Output multiplier 2.14 2.07
Total value added/ Income $331,130,587 $227,186,202
Income multiplier 2.01 1.95
Total employment/ Jobs 9,068 6,309
Employment multiplier 1.49 1.47
________________________________________________________________________________________________
The Economic and Health Benefits of Bicycling in Iowa www.uni.edu/step 24
BICYCLE RETAIL ESTABLISHMENTS
Bicycle retail establishments range in size from small family owned stores to large national chains, and represent a $5.9 billion industry in the United States (IBIS World, 2011). Bicycle and bicycling accessory manufacturing is not a prominent industry in Iowa, therefore the inventory costs associated with product sales generally are not seen returned directly to Iowa businesses. This project focused on bicycle specific retail, a term that refers to retail establishments that sell and repair bicycles, bicycle accessories, clothing related to bicycling and other bicycle specific goods. No mixed athletic retail or general retail stores that may sell bicycles and complementary products were included. Accordingly, the economic activity related to bicycle sales and repair reported in this study is conservative and does not reflect all bicycle sales and repair in Iowa. The purpose of this section was to determine the economic impact of bicycle specific retail establishments in Iowa.
Methodology
Data collected from bicycle specific retail establishments was used to determine the impacts of bicycle specific retailers on the Iowa economy. Data was collected using a questionnaire based survey to determine basic economic indicators from bicycle retail establishments, as well as market demographics. The questionnaires were completed by participants through Survey Monkey, an online survey tool. Questions asked total number of bicycles sold and total revenue, expenses and employment. SPSS and Microsoft Excel were used to analyze the results of this survey. A variety of tests including frequencies, mean, median, standard deviation, range and cross tabulations were used to determine trends and totals. Research Participants. Participants for this study include bicycle specific retailers in the State of Iowa. At the time of this survey, sixty-one known locations of this description were located in Iowa (Iowa Bicycle Coalition, 2011). Questionnaires were sent to thirty-eight out of sixty-one known bicycle retail establishments at the start of this survey, as these were locations with email addresses available through the Iowa Bicycle Coalition. Out of these thirty-eight businesses sent questionnaires, twenty partial to full responses (52% participation) were submitted.
Results
Customer Base. The survey of bicycle retail establishments asked retailers to estimate the makeup of their customer base. For the purpose of this survey, customer base was divided into four categories. These categories include bicyclists who are categorized in each of the following areas:
Weekenders: Bicyclists who ride specifically as a weekend/leisure activity

________________________________________________________________________________________________
The Economic and Health Benefits of Bicycling in Iowa www.uni.edu/step 25
Special Event Riders: Bicyclists who primarily ride as a part of special bicycling events such as RAGBRAI and other major bike rides
Avid Bikers: Bicyclists who cycle daily, including commuters Children
As Figure 11 reflects, weekend riders were rated as the top consumers at bicycle retail stores in Iowa, indicating that approximately 45% of the customer base consisted of this group. Special event riders, including participants in “RAGBRAI” and other local and regional events, made up 24.25% of customers. Commuters and daily cyclists, characterized as “avid cyclists,” closely follow special event riders with 21.5% of the customer population. Children as consumers were ranked lowest, providing 9.25% of business to bicycle retailers surveyed.
Figure 11 Types of customers served as a percentage of service
45%
24%22%
9%
0%
10%
20%
30%
40%
50%
Weekenders (Bicyclistswho ride as a
weekend/leisureactivity)
Special Event Riders(RAGBRAI and otherevents, only if not in
another category)
Avid Bikers(Commuters, Daily
Cyclists)
Children
Customer Categories Served, as a Percentage of Service (n=20)
Table 4 Bicycle store customers by percentage
Mean, Median and Range of Customers by Type (N=20)
Customer Type Weekenders Special Event Riders Avid Bikers Children
Mean 45% 24.25% 21.5% 9.25%
Median 45% 25% 15% 10%
Range 10%-60% 0%-45% 5%-60% 5%-20%

________________________________________________________________________________________________
The Economic and Health Benefits of Bicycling in Iowa www.uni.edu/step 26
Bicycles Sold. In determining the types of bicycles sold, direct uses for the cycles can be inferred. The industry has identified four general bicycle styles (IBIS World, 2011). These types include:
Road Bikes; Including race, touring, and time trial/triathlon bikes
Mountain Bikes; Including cross country, free-ride, downhill and trial bikes
Lifestyle Bikes; Including dirt jump, BMX and track bikes
Children’s Bikes
Given these descriptions, survey participants were asked to identify the quantity of each type sold in a given year at their establishment. Using the median sold for each type of bicycle, multiplied by the sixty-one bicycle-specific retail establishments in Iowa at the time of the survey, a number of bicycles sold in each classification was estimated for Iowa bicycle retail establishments (see Table 5). This number indicates that, in a typical year, bicycle specific retailers sell approximately 18,300 bicycles.
Table 5 Types of bicycles sold by retail establishment
Mean, Median and Range of Bicycles Sold by Type (N=18)
Bicycle Type Road Bikes Mountain Bikes Lifestyle Bikes Children’s Bikes
Total 2162 2369 5529 1274
Mean 120.111 131.611 307 70.78
Median 50 58.5 145.5 46
Range 0-2162 20-2369 11-5529 5-1274
Estimated Total
Sold in State*
3050 3568.5 8875.5 2806
*Estimated total sold in state uses the median sold at participant locations multiplied by 61, the number of
bicycle specific retail outlets in Iowa as of the beginning of the survey

________________________________________________________________________________________________
The Economic and Health Benefits of Bicycling in Iowa www.uni.edu/step 27
Figure 12 Bicycle sales percentages by category
Road Bikes20%
Mountain Bikes21%
Lifestyle Bikes48%
Childrens Bikes11%
Average Number of Bikes Sold By Type in percents (n=18)
Revenue and Expense Impact. The survey addressed the revenue and expenses of bicycle specific retail establishments in Iowa. This information is useful in determining the economic impact from the sales of bicycles and cycling accessories, as well as the secondary impacts provided by facilities, personnel, marketing and other expenses incurred by these establishments.
Table 6 Establishment revenue from sales and services
Establishment Revenue ($) by Sales/Service Category (N=8)
Revenue Type Bicycle
Sales
Clothing
Sales
Accessory
Sales
Repair
Revenue
Events
Revenue
Other
Revenue
Total 1,722,888 265,292 588,114 591,642 62,000 62,000
Percentage of Total 52.34% 8.06% 17.87% 17.97% 1.88% 1.88%
Mean 215,361 33,162 73,514 73,955 7,750 7,750
Median 132,194 31,500 69,000 59,971 0 5,000
Range 45,000-223,500 3,500-43,500 20000-81114 9000-155700 0-32000 0-30000
State Total 8,063,834 1,921,500 4,209,000 3,658,231 0 305,000
*State total uses the median from establishments surveyed multiplied by 61, the number of bicycle specific retail
establishments in the state of Iowa at the beginning of this survey.
________________________________________________________________________________________________
The Economic and Health Benefits of Bicycling in Iowa www.uni.edu/step 28
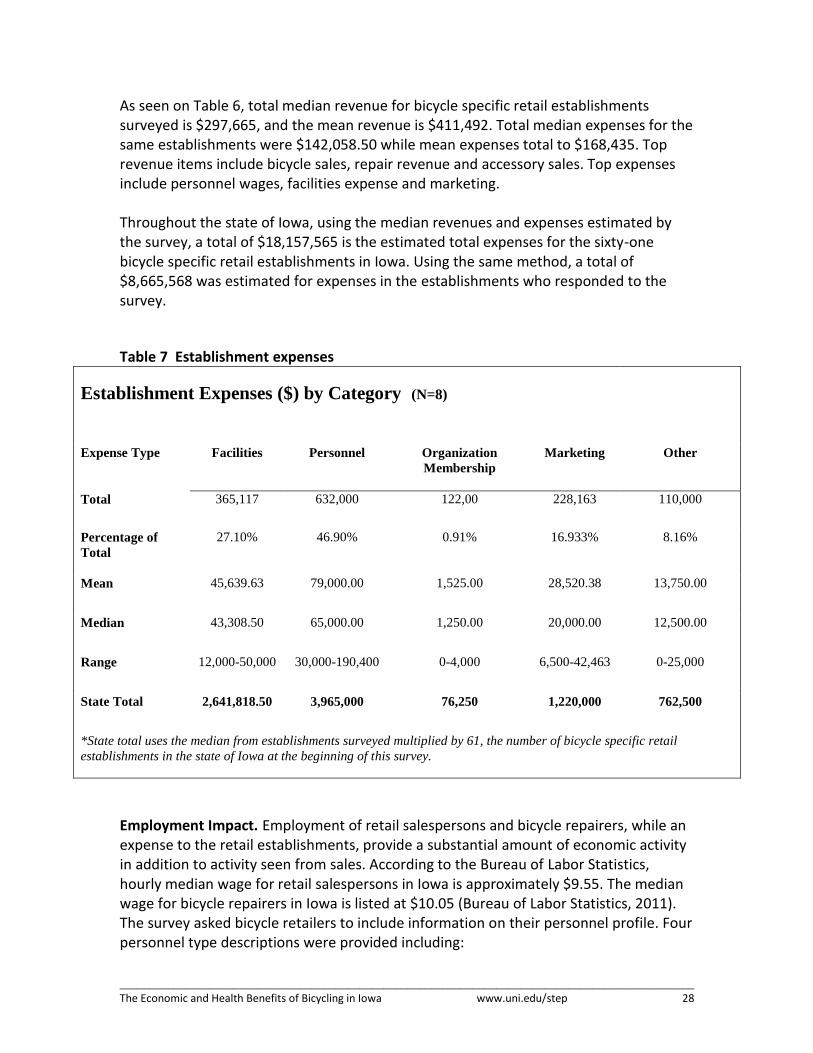
As seen on Table 6, total median revenue for bicycle specific retail establishments surveyed is $297,665, and the mean revenue is $411,492. Total median expenses for the same establishments were $142,058.50 while mean expenses total to $168,435. Top revenue items include bicycle sales, repair revenue and accessory sales. Top expenses include personnel wages, facilities expense and marketing. Throughout the state of Iowa, using the median revenues and expenses estimated by the survey, a total of $18,157,565 is the estimated total expenses for the sixty-one bicycle specific retail establishments in Iowa. Using the same method, a total of $8,665,568 was estimated for expenses in the establishments who responded to the survey.
Table 7 Establishment expenses
Establishment Expenses ($) by Category (N=8)
Expense Type Facilities Personnel Organization
Membership
Marketing Other
Total 365,117 632,000 122,00 228,163 110,000
Percentage of
Total
27.10% 46.90% 0.91% 16.933% 8.16%
Mean 45,639.63 79,000.00 1,525.00 28,520.38 13,750.00
Median 43,308.50 65,000.00 1,250.00 20,000.00 12,500.00
Range 12,000-50,000 30,000-190,400 0-4,000 6,500-42,463 0-25,000
State Total 2,641,818.50 3,965,000 76,250 1,220,000 762,500
*State total uses the median from establishments surveyed multiplied by 61, the number of bicycle specific retail
establishments in the state of Iowa at the beginning of this survey.
Employment Impact. Employment of retail salespersons and bicycle repairers, while an expense to the retail establishments, provide a substantial amount of economic activity in addition to activity seen from sales. According to the Bureau of Labor Statistics, hourly median wage for retail salespersons in Iowa is approximately $9.55. The median wage for bicycle repairers in Iowa is listed at $10.05 (Bureau of Labor Statistics, 2011). The survey asked bicycle retailers to include information on their personnel profile. Four personnel type descriptions were provided including:

________________________________________________________________________________________________
The Economic and Health Benefits of Bicycling in Iowa www.uni.edu/step 29
Full Time; Year round employees working 35 hours or more per week
Full Time Seasonal; Seasonal employees working 35 hours or more per week
Part Time; Year round employees working fewer than 35 hours per week
Part Time Seasonal; Seasonal employees working fewer than 35 hours per week
Given these four options, professionals surveyed stated the number of each employee type they employed as displayed in Table 8 . Table 8 Personnel employed by retail establishments
Personnel Type by Retail Establishment (N=19)
Employee Type Full Time Full Time Seasonal Part Time Part Time Seasonal
Total 78 45 54 28
Mean 4.33 2.50 3.00 1.56
Median 2 1.5 2 1
Range 1-30 0-10 0-5 0-6
Figure 13 Personnel percentage by category
31%
25%
31%
15%
Personnel Percentages by Categoryn=19
Full Time
Full Time Seasonal
Part Time
Part Time Seasonal
As Table 8 shows, a median employment of 6.5 employees per establishment and mean employment of 11.39 employees was found for the nineteen bicycle retail establishments surveyed.
________________________________________________________________________________________________
The Economic and Health Benefits of Bicycling in Iowa www.uni.edu/step 30
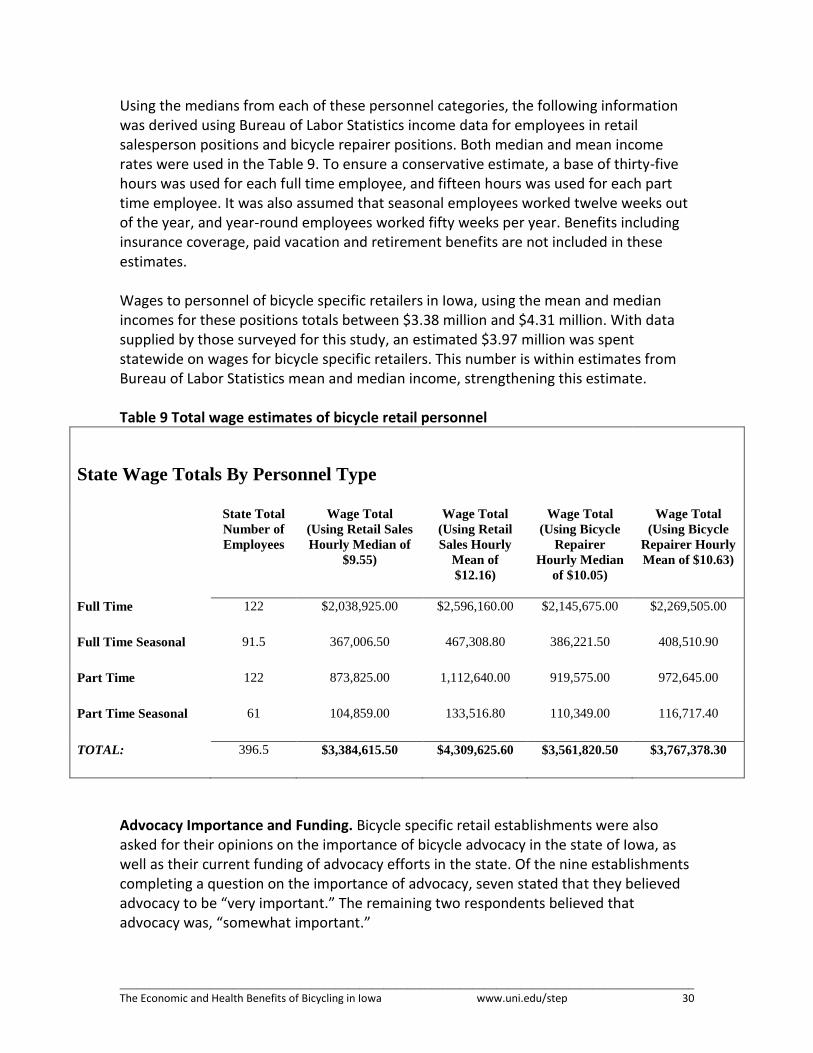
Using the medians from each of these personnel categories, the following information was derived using Bureau of Labor Statistics income data for employees in retail salesperson positions and bicycle repairer positions. Both median and mean income rates were used in the Table 9. To ensure a conservative estimate, a base of thirty-five hours was used for each full time employee, and fifteen hours was used for each part time employee. It was also assumed that seasonal employees worked twelve weeks out of the year, and year-round employees worked fifty weeks per year. Benefits including insurance coverage, paid vacation and retirement benefits are not included in these estimates. Wages to personnel of bicycle specific retailers in Iowa, using the mean and median incomes for these positions totals between $3.38 million and $4.31 million. With data supplied by those surveyed for this study, an estimated $3.97 million was spent statewide on wages for bicycle specific retailers. This number is within estimates from Bureau of Labor Statistics mean and median income, strengthening this estimate. Table 9 Total wage estimates of bicycle retail personnel
State Wage Totals By Personnel Type
State Total
Number of
Employees
Wage Total
(Using Retail Sales
Hourly Median of
$9.55)
Wage Total
(Using Retail
Sales Hourly
Mean of
$12.16)
Wage Total
(Using Bicycle
Repairer
Hourly Median
of $10.05)
Wage Total
(Using Bicycle
Repairer Hourly
Mean of $10.63)
Full Time 122 $2,038,925.00 $2,596,160.00 $2,145,675.00 $2,269,505.00
Full Time Seasonal 91.5 367,006.50 467,308.80 386,221.50 408,510.90
Part Time 122 873,825.00 1,112,640.00 919,575.00 972,645.00
Part Time Seasonal 61 104,859.00 133,516.80 110,349.00 116,717.40
TOTAL: 396.5 $3,384,615.50 $4,309,625.60 $3,561,820.50 $3,767,378.30
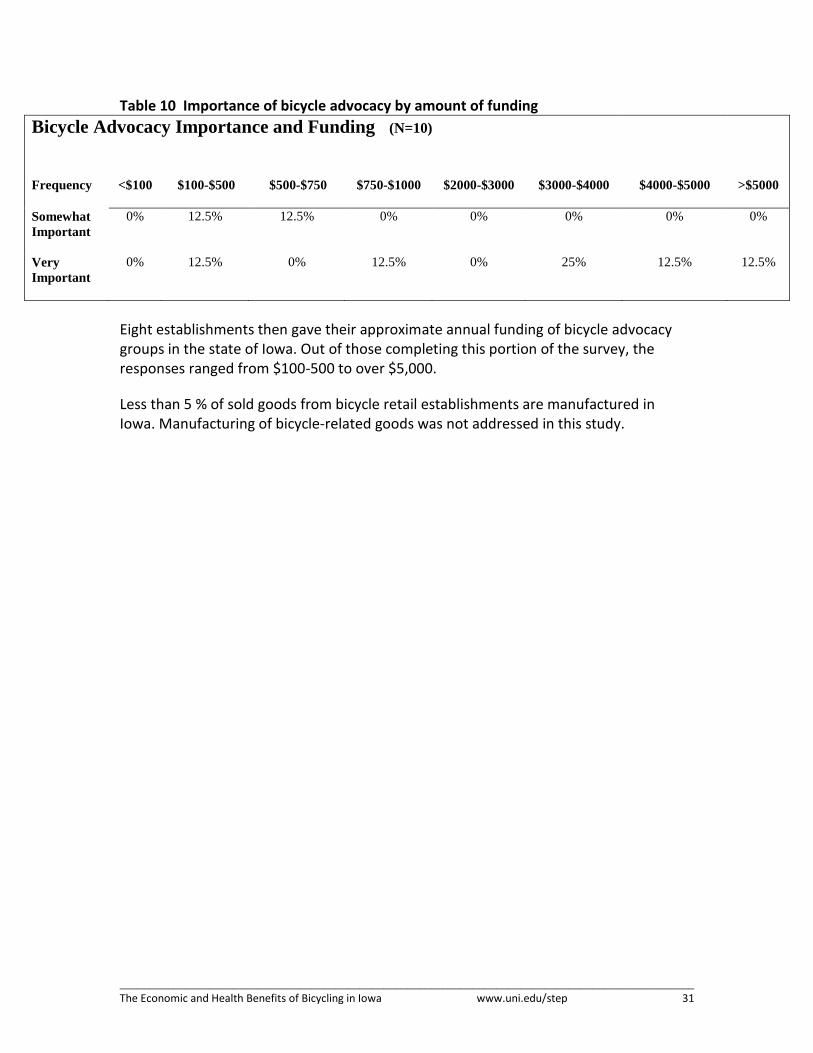
Advocacy Importance and Funding. Bicycle specific retail establishments were also asked for their opinions on the importance of bicycle advocacy in the state of Iowa, as well as their current funding of advocacy efforts in the state. Of the nine establishments completing a question on the importance of advocacy, seven stated that they believed advocacy to be “very important.” The remaining two respondents believed that advocacy was, “somewhat important.”
________________________________________________________________________________________________
The Economic and Health Benefits of Bicycling in Iowa www.uni.edu/step 31
Table 10 Importance of bicycle advocacy by amount of funding
Bicycle Advocacy Importance and Funding (N=10)
Frequency <$100 $100-$500 $500-$750 $750-$1000 $2000-$3000 $3000-$4000 $4000-$5000 >$5000
Somewhat
Important
0% 12.5% 12.5% 0% 0% 0% 0% 0%
Very
Important
0% 12.5% 0% 12.5% 0% 25% 12.5% 12.5%
Eight establishments then gave their approximate annual funding of bicycle advocacy groups in the state of Iowa. Out of those completing this portion of the survey, the responses ranged from $100-500 to over $5,000.
Less than 5 % of sold goods from bicycle retail establishments are manufactured in Iowa. Manufacturing of bicycle-related goods was not addressed in this study.

________________________________________________________________________________________________
The Economic and Health Benefits of Bicycling in Iowa www.uni.edu/step 32
BICYCLE ORGANIZATIONS
In Iowa there are approximately 800 bicycle organizations formed specifically for RAGBRAI. The majority of these organizations are not active throughout the year. However several do remain active and organize regional bicycle events. The Iowa Bicycle Coalition has identified 15 active organizations in Iowa who operate year round. The purpose of this section is to provide information about bicycle organizations in Iowa including membership size, number of events organized and level of financial and volunteer activity. The following figure indicates that the bicyclists who responded to the surveys participate in the events that these organizations sponsor. Figure 14 Participation in bicycling events
Methodology
The data for this portion of the study regarding bicycle organizations were collected using a questionnaire-based survey consisting of three parts. The first part of the questionnaire included questions about membership and events planned by the organization annually. The second part of the questionnaire included questions on financial information of the organization. Financial information included financial support, volunteer hours, and in kind donations. The third part of the questionnaire included questions on the bicycle organization’s location and contact information. Participants. The survey was distributed via a web based survey design using Survey Monkey, an on-line survey tool. The Iowa Bicycle Coalition distributed the survey link to 15 bicycling organization leaders in the state of Iowa. One email was sent to each

________________________________________________________________________________________________
The Economic and Health Benefits of Bicycling in Iowa www.uni.edu/step 33
organization during the first round of contacts. The initial email was distributed on 7 October 2011. A follow up email was then sent on 14 October. The survey was closed on 21 October. The bicycle organizations selected are located within the State of Iowa and are members of the Iowa Bicycling Coalition (IBC). Of the 15 questionnaires distributed, 13 questionnaires were returned, providing an 87% response rate.
Results
The average number of members for bicycle organizations in Iowa from 2008 -2011 ranged from 92 to 106. Total membership ranged from 15 to 250 members per organization and continued to rise over time. Table 11 Annual membership number
Annual Membership Number (N=13)
Year 2008 2009 2010 2011
Total 960 1012 1047 1384
Mean 96 92 96 106
Median 2 1.5 2 1
Range 15-200 16-225 25-240 28-250
The annual budget for bicycle organizations ranged from having no budget up to $200,000 in one year. However, from 2008 through 2010 the annual budget ranged from zero to $19,000. Organizational expenditures during this time frame totaled over $52,000. Table 12 Annual organizational budget from 2008 through 2011
Annual Organizational Budget (4) by Year (N=12)
Year 2008 2009 2010 2011
Total $52,450 $52,750 $52,300 $259,050
Mean 6,556 5,861 5,230 21,587
Median 3,250 1,500 1,000 1,500
Range 0-19,250 0-19,000 0-19,000 0-200,000

________________________________________________________________________________________________
The Economic and Health Benefits of Bicycling in Iowa www.uni.edu/step 34
Bicycle organizations receive support from corporate or private business, individual donations and sponsorships. They did not receive support from local, state or federal governments or national bicycle organizations. Figure 15 Source of financial support received
Corporate or Private
Businesses19%
Individual Donations
44%
Sponsorships37%
Type of Financial Supportn=9
Bicycle organizations in Iowa rely on volunteers. They have an average of 5.73 professional volunteers such as board members, and 1.67 administrative volunteers. The majority of volunteers were categorized as “other” with an average of 12.4 volunteers per organization. There were 202 volunteers for the eleven bicycle organizations responding. Figure 16 Volunteers in the organization
________________________________________________________________________________________________
The Economic and Health Benefits of Bicycling in Iowa www.uni.edu/step 35
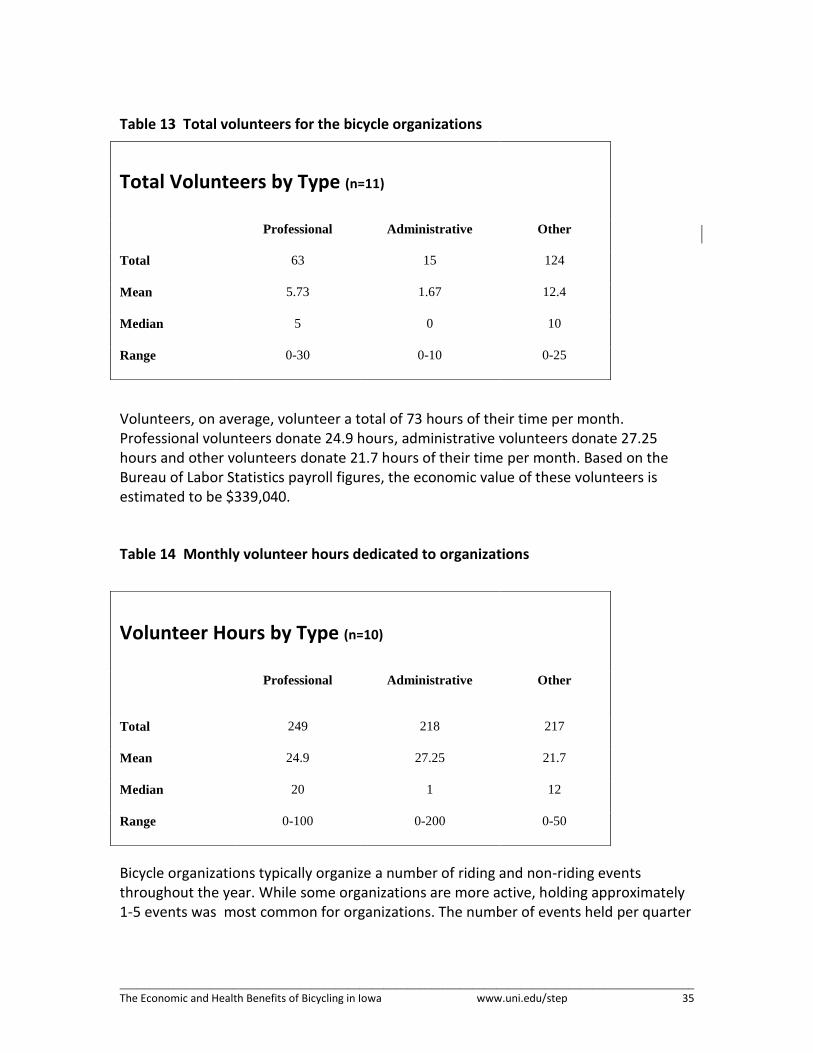
Table 13 Total volunteers for the bicycle organizations
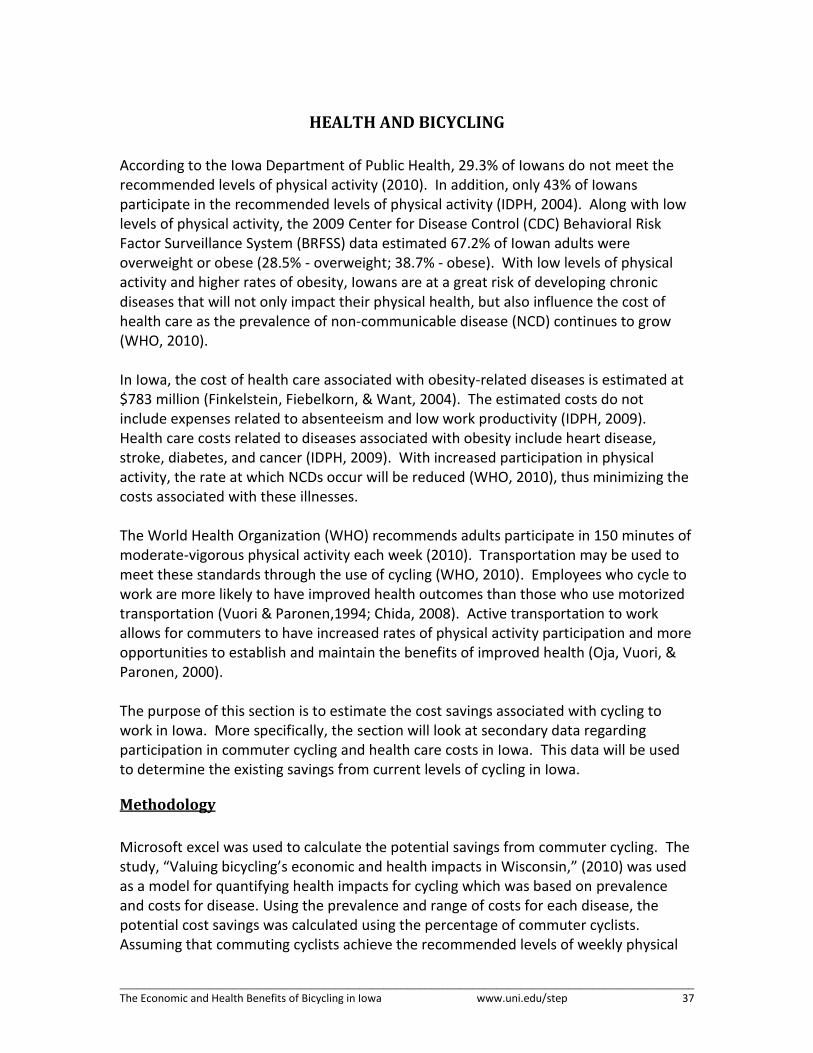
Volunteers, on average, volunteer a total of 73 hours of their time per month. Professional volunteers donate 24.9 hours, administrative volunteers donate 27.25 hours and other volunteers donate 21.7 hours of their time per month. Based on the Bureau of Labor Statistics payroll figures, the economic value of these volunteers is estimated to be $339,040.
Table 14 Monthly volunteer hours dedicated to organizations
Bicycle organizations typically organize a number of riding and non-riding events throughout the year. While some organizations are more active, holding approximately 1-5 events was most common for organizations. The number of events held per quarter
Total Volunteers by Type (n=11)
Professional Administrative Other
Total 63 15 124
Mean 5.73 1.67 12.4
Median 5 0 10
Range 0-30 0-10 0-25
Volunteer Hours by Type (n=10)
Professional Administrative Other
Total 249 218 217
Mean 24.9 27.25 21.7
Median 20 1 12
Range 0-100 0-200 0-50

________________________________________________________________________________________________
The Economic and Health Benefits of Bicycling in Iowa www.uni.edu/step 36
ranged from 0 to 11 and over. The number of non-riding events all fell within the 0-5 range. Most organizations did hold at least one non-riding event each quarter.
Table 15 Number of riding events planned each quarter
Number of Organizations that Hold Riding and Non-riding
Events by Quarter (N=11)
Number and
Type of Events
1-5 6-10 11 and Above
Riding
Events
Non-riding
Events
Riding
Events
Non-riding
Events
Riding
Events
Non-riding
Events
Jan - Mar 6 8 1 1
Apr - June
6 9 1 6
July - Sept 6 9 7
Oct - Dec 7 9 3 2
The majority of riding events were free. Events such as weeknight evening rides would fall into this category. Other events were listed as costing more than $25. A majority of the organizations (6) did charge $25 or more for events, particularly those held during the summer season. These events typically include large races and statewide events.
Fees for the events typically cover tangible items such as supplies and food and/or beverage. Insurance and park/facility rental were not common expenses to be covered by the fees for Iowa bicycle organization events.
________________________________________________________________________________________________
The Economic and Health Benefits of Bicycling in Iowa www.uni.edu/step 37
HEALTH AND BICYCLING
According to the Iowa Department of Public Health, 29.3% of Iowans do not meet the recommended levels of physical activity (2010). In addition, only 43% of Iowans participate in the recommended levels of physical activity (IDPH, 2004). Along with low levels of physical activity, the 2009 Center for Disease Control (CDC) Behavioral Risk Factor Surveillance System (BRFSS) data estimated 67.2% of Iowan adults were overweight or obese (28.5% - overweight; 38.7% - obese). With low levels of physical activity and higher rates of obesity, Iowans are at a great risk of developing chronic diseases that will not only impact their physical health, but also influence the cost of health care as the prevalence of non-communicable disease (NCD) continues to grow (WHO, 2010). In Iowa, the cost of health care associated with obesity-related diseases is estimated at $783 million (Finkelstein, Fiebelkorn, & Want, 2004). The estimated costs do not include expenses related to absenteeism and low work productivity (IDPH, 2009). Health care costs related to diseases associated with obesity include heart disease, stroke, diabetes, and cancer (IDPH, 2009). With increased participation in physical activity, the rate at which NCDs occur will be reduced (WHO, 2010), thus minimizing the costs associated with these illnesses.
The World Health Organization (WHO) recommends adults participate in 150 minutes of moderate-vigorous physical activity each week (2010). Transportation may be used to meet these standards through the use of cycling (WHO, 2010). Employees who cycle to work are more likely to have improved health outcomes than those who use motorized transportation (Vuori & Paronen,1994; Chida, 2008). Active transportation to work allows for commuters to have increased rates of physical activity participation and more opportunities to establish and maintain the benefits of improved health (Oja, Vuori, & Paronen, 2000). The purpose of this section is to estimate the cost savings associated with cycling to work in Iowa. More specifically, the section will look at secondary data regarding participation in commuter cycling and health care costs in Iowa. This data will be used to determine the existing savings from current levels of cycling in Iowa.
Methodology
Microsoft excel was used to calculate the potential savings from commuter cycling. The study, “Valuing bicycling’s economic and health impacts in Wisconsin,” (2010) was used as a model for quantifying health impacts for cycling which was based on prevalence and costs for disease. Using the prevalence and range of costs for each disease, the potential cost savings was calculated using the percentage of commuter cyclists. Assuming that commuting cyclists achieve the recommended levels of weekly physical

________________________________________________________________________________________________
The Economic and Health Benefits of Bicycling in Iowa www.uni.edu/step 38
activity (WHO, 2010), the data reports a projected current savings in health care costs for the State of Iowa. Population. Current data on the population and commuter cycling were retrieved from the U.S. Census Bureau American Community Survey (2010). Data obtained from this source included the population and percentage of commuter riders from Iowa City, Cedar Rapids, Des Moines, and Sioux City (2010). This data was used to calculate the savings from the number of people who are current commuter cyclists. Prevalence. Prevalence rates related to diabetes, breast cancer, colorectal cancer, heart disease, and stroke were obtained from several different health resources to represent the regional areas of the commuter cyclist data. The 2010 CDC BRFSS report helped to provide statewide prevalence related to diabetes, heart disease, and stroke in Cedar Rapids, Des Moines, and Sioux City. For Iowa City, prevalence data was collected from several sources. For cancer prevalence, data was gathered from the State Health Registry of Iowa (2011). Each county reported the number, per person, of breast and colon cancer cases. The 2010 BRFSS was used to obtain statewide, Metropolitan Statistical Area prevalence of diabetes, heart disease, and stroke for Linn (Cedar Rapids), Polk (Des Moines), and Woodbury (Sioux City) counties (CDC, 2010). Although the majority of data was gathered from the 2010 BRFSS report, the County Health Rankings were used to obtain diabetes information for Johnson County (2011). The Community Health Needs Assessment of Johnson County was used to obtain stroke prevalence (2010). Despite the use of multiple sources to determine prevalence of each disease, data related heart disease for Johnson County was not found. Estimations of possible prevalence were determined by skewing current data to fit health trends of Johnson County. This involved an estimate using statewide data. Cost of Care. Using the Wellmark Blue Cross, Blue Shield treatment cost estimator (2011), an estimated cost of treating diabetes, heart disease, stroke, breast, and colon cancer was established. The range of costs was calculated by using the lowest 20th percentile rank, and the highest 80th percentile rank. The 20th percentile determines that 20% of all cases were less than or equal to the low value of the range score. The 80th percentile determines that 80% of all cases were less than or equal to the highest value of the range score. These costs represent care from the start of diagnosis until the end of treatment (Wellmark, 2011). In order to accurately assess the cost of care for each disease in the population area, zip codes from each region were input into the treatment cost estimator. This allowed for differences in health care costs to be taken into consideration for each region. When selecting the range of costs, several items were taken into consideration for each disease. For diabetes, costs associated with multiple complications were used instead of diabetes with only ophthalmic, neurologic, circulatory, or renal issues. According to

________________________________________________________________________________________________
The Economic and Health Benefits of Bicycling in Iowa www.uni.edu/step 39
Morgan et al., one fifth of diabetic patients were diagnosed with multiple complications that may vary between specific complications (2000). Costs related to breast cancer, colon cancer, heart disease, and stroke consisted of treatment involving active forms of the disease without surgery. Costs used for each disease did not involve surgery in order to provide a more conservative estimate for disease treatment.
Results
With the use of statewide prevalence and Metropolitan Statistical Area (MSA) data for Linn, Polk, Johnson, and Woodbury County, the estimates provide a mean to calculate savings. These estimates are used with the assumption commuter cyclers are in good health, and absent of disease. Total savings based on the current MSA’s for Linn, Polk, Woodbury, and Johnson counties is estimated at $1,543,377. Using these assumptions, estimated savings from existing commuter cyclers for all of the State of Iowa are $13,266,020. The total savings for recreational riders in the State of Iowa are estimated at $73,942,511. Savings for each MSA’s commuter cycling population has also been accounted for using statewide prevalence data. These savings include an estimated cost savings in diabetes, breast cancer, colorectal cancer, heart disease, and stroke related treatment. In Linn County, cyclists are estimated to save $213,849 in health care costs. In Polk County, savings from commuter cyclists in Des Moines includes $254,797. Sioux City cyclists account for an estimated savings of $56,384 in health care costs. Johnson county cyclists are estimated to save $1,018,347 in health care costs. Increased participation in commuter cycling may help to reduce statewide health care costs and improve overall health of citizens living in Iowa.
Summary of Health Impacts
Through commuter cycling, Iowans are estimated to save millions of dollars in health care expenditures by leading more active lifestyles. With participation in regular physical activity, NCDs may be prevented to help people live healthier lives (WHO, 2010). Cycling is an accessible mode of physical activity that will not only impact each individual, but also the community (Chida & Hamer, 2008). The prevention of NCDs will help to establish healthier communities in the State of Iowa. In addition, cycling will not only provide opportunities for physical activity, but may also be used as a convenient and healthy mode of transportation (Oja et al., 2000). Based on the estimated savings in Iowa, commuter cycling needs to be considered by citizens and lawmakers. Cycling provides a convenient and accessible mode of transportation that will help reduce health care expenditures and enhance the lives of those living in Iowa. Although the current population of Iowan commuter cyclists is minimal, the impact of their projected cost savings is essential in order to avoid an increase in the cost of health care expenditures related to NCDs in the State of Iowa.

________________________________________________________________________________________________
The Economic and Health Benefits of Bicycling in Iowa www.uni.edu/step 40
Table 16. Projected cost savings of commuter cyclists in Iowa.
126498
LINN COUNTY
Prevalence
20th Percentile Cost per
Case
20th Percentile Total MSA
80th Percentile Cost per
case
80th Percentile Total MSA
Median Savings
Diabetes1 11005 $1,020 $11,225,100 $9,711 $106,869,555
Breast Cancer2 140 $11,703 $1,638,420 $66,300 $9,282,000
Colorectal Cancer2 64 $42,873 2743872 $143,266 $9,169,024
Heart Disease1 5186 $495 $2,567,070 $6,022 $31,230,092
Stroke1 2403 $5,150.00 12375450 $28,424 $68,302,872
TOTAL $30,549,912 $224,853,543
Commuters 5 0.007 0.007
TOTAL SAVINGS $213,849 $1,573,975 $893,912
204196
POLK COUNTY Prevalence
20th Percentile Cost per
Case
20th Percentile Total MSA
80th Percentile Cost per
case
80th Percentile Total MSA
Median Savings
Diabetes1 13272 $2,030 $26,942,160 $15,595 $206,976,840
Breast Cancer2 261 $21,144 $5,518,584 $90,251 $23,555,511
Colorectal Cancer2 64 $42,940 $2,748,160 $141,489 $9,055,296
Heart Disease1 6534 $659 $4,305,906 $6,126 $40,027,284
Stroke1 4696 $5,150 $24,184,400 $28,424 $133,479,104
TOTAL $63,699,210 $413,094,035
Commuters 5 0.004 0.004
TOTAL SAVINGS $254,797 $1,652,376 $953,586
82378
SIOUX CITY Prevalence
20th Percentile Cost per
Case
20th Percentile Total MSA
80th Percentile Cost per
case
80th Percentile Total MSA
Median Savings
Diabetes1 7743 $1,544 $11,955,192 $12,689 $98,250,927
Breast Cancer2 51 $15,796 $805,596 $85,655 $4,368,405
Colorectal Cancer2 27 $45,845 $1,237,815 $137,538 $3,713,526
Heart Disease1 2965 $495 $1,467,675 $6,295 $18,664,675
Stroke1 2471 $5,150 $12,725,650 $28,424 $70,235,704
TOTAL $28,191,928 $195,233,237
Commuters 5 0.002 0.002
TOTAL SAVINGS $56,384 $390,466 $223,425

________________________________________________________________________________________________
The Economic and Health Benefits of Bicycling in Iowa www.uni.edu/step 41
Table 16 continued. Projected cost savings of commuter cyclists in Iowa.
JOHNSON COUNTY
Prevalence
20th Percentile Cost per
Case
20th Percentile Total MSA
80th Percentile Cost per
case
80th Percentile Total MSA
Median Savings
Diabetes3 4081 $1,543 $6,296,983 $21,024 $85,798,944
Breast Cancer2 76 $18,766 $1,426,216 $87,321 $6,636,396
Colorectal Cancer2 23 $42,873 $986,079 $143,266 $3,295,118
Heart Disease 2163 $495 $1,070,685 $6,022 $13,025,586
Stroke4 1632 $5,150 $8,404,800 $28,424 $46,387,968
TOTAL $18,184,763 $155,144,012
Commuters 5 0.056 0.056
TOTAL SAVINGS $1,018,347 $8,688,065 $4,853,206
TOATAL MSA $1,543,377 $12,304,882 $6,924,129
3,046,355
STATE OF IOWA Prevalence
20th Percentile Cost per
Case
20th Percentile Total MSA
80th Percentile Cost per
case
80th Percentile Total MSA
Median Savings
Diabetes1 231523 $1,020 $236,153,460 $9,711 $2,248,319,853
Breast Cancer2 2183 $11,703 $25,547,649 $66,300 $144,732,900
Colorectal Cancer2 1358 $42,873 $58,221,534 $143,266 $194,555,228
Heart Disease1 115,761 $495 $57,301,695 $6,022 $697,112,742
Stroke1 73112 $5,150 $376,526,800 $28,424 $2,078,135,488
TOTAL $753,751,138 $5,362,856,211
Commuters 5 0.0176 0.0176
TOTAL SAVINGS $13,266,020 $94,386,269 $53,826,145
1. Center for Disease Control. (2010). SMART: Selected Metropolitan/Micropolitan Area Risk Trends. Retrieved from: http://apps.nccd.cdc.gov/brfsssmart/MMS ACty Risk Chart.asp ?MM SA=274&yr2=2010&qkey
2. State Health Registry of Iowa. (2011). Iowa Cancer Registry. Retrieved from: http://www.public-health.uiowa.edu/shri/
3. County Health Rankings. (2011). Johnson, Iowa. Retrieved from: http://www.countyhealthrankings.org/iowa/johnson/other-measures
4. Community Health Needs Assessment. (2010). Johnson County
5. U.S. Census Bureau, American Community Survey. (2010).
Table 17. Projected cost savings of recreational riders in Iowa.
STATE OF IOWA Prevalence
20th Percentile Cost per
Case
20th Percentile Total MSA
80th Percentile Cost per
case
80th Percentile Total MSA
Median Savings
Diabetes1 231523 $1,020 $236,153,460 $9,711 $2,248,319,853
Breast Cancer2 2183 $11,703 $25,547,649 $66,300 $144,732,900
Colorectal Cancer2 1358 $42,873 $58,221,534 $143,266 $194,555,228
Heart Disease1 115,761 $495 $57,301,695 $6,022 $697,112,742
Stroke1 73112 $5,150 $376,526,800 $28,424 $2,078,135,488
TOTAL $753,751,138 $5,362,856,211
Recreational 5 0.0981 0.0981
TOTAL SAVINGS $73,942,987 $526,096,194 $300,019,590

________________________________________________________________________________________________
The Economic and Health Benefits of Bicycling in Iowa www.uni.edu/step 42
REFERENCES
Alexander, L. (1994). The Effect of Greenways on Property Values and Public Safety. Denver, CO: Colorado State Trails Program. Alta Planning + Design. (2005). Mauna Loa Mauka Trail System: Trail Demand and Economic Analysis. San Rafael, CA: Author. Prepared for The Nature Conservancy. American Journal of Public Health. (April 2004). Cost Analysis of the Built Environment: The Case of Bike and Pedestrian Trails in Lincoln, Nebraska: Guijing Wang, Caroline Macera, Barbara Scudder-Sourcie, Tom Schmid, Michael Pratt, David Buchner, Gregory Heath. Analysis of Economic Impacts of the Northern Central Rail Trail. (1994). Washington DC: Rails-to-Trails Conservancy. Anton, Paul. (2005). The Economic Value of Open Space: Implications for Land Use Decisions. St. Paul, MN: Wilder Research. Antonakos, Cathy. (1993). Environmental and Travel Preferences of Cyclists. University of Michigan Doctoral Thesis. Campbell, R. and Wittgens, M. (2004). The Business Case for Active Transportation: The Economic Benefits of Walking and Cycling. Prepared for Better Environmentally Sound Transportation. Center for Community Economic Development. (1997). Mountain Biking in the
Chequamegon Area of Northern Wisconsin and Implications for Regional Development. University of Wisconsin Extension/Madison: Author. http://www.uwex.edu/ces/cced/publicat/bike.html. Center for International Public Management for the Florida Department of Environmental Protection, Office of Greenways and Trails. (1998). Thinking Green: A Guide to the Benefits and Costs of Greenways and Trails. Center for Research on Economic and Social Policy. (2000). Bicycling and Walking in
Colorado: Economic Impact and Household Survey Results. University of Colorado at Denver, CO: Author. Prepared for the Colorado Department of Transportation Bicycle/Pedestrian Program. Available at http://www.dot.state.co.us/BikePed/BikeWalk.htm.
Chakrabarty, G. (2002, October 28). Monon affecting realty prices. The Indianapolis
Star. Retrieved December, 2002, from http://www.indystar.com/article.php?mononreal28_p.html.
________________________________________________________________________________________________
The Economic and Health Benefits of Bicycling in Iowa www.uni.edu/step 43
Chenoweth, David. (2005). The Economic Costs of Physical Activity, Obesity and Overweight in California Adults During the Year 2000: A Technical Analysis. Prepared for the Cancer Section and Nutrition Section of the California Department of Health Services. The Conservation Fund and Colorado State Parks State Trails Program. (March 1995). The Effect of Greenways on Property Values and Public Safety. Available from the Colorado State Trails Program, (303) 866-3203 ext. 306. The Conservation Fund and Colorado State Parks State Trails Program.(February 1992).The Impacts of Rail-Trails, A Study of Users and Nearby Property Owners from Three Trails. Washington, DC: U.S. Department of the Interior, National Park Service, Rivers, Trails, and Conservation Assistance Program. For sale by the U.S. Government Printing Office, Superintendent of Documents, Mail Stop: SSOP, Washington, DC 20402-9328, ISBN 0-16- 041677-9. The Department of Natural Resources, State of Iowa. (2006). Outdoor Recreation in
Iowa: A Statewide Comprehensive Outdoor Recreation Plan. Retrieved from http://www.iowadnr.gov/portals/idnr/uploads/grants/06scorp.pdf?amp;tabid=1562
Eppli, Mark and Tu, Charles. (1999). Valuing The New Urbanism, The Impact of the New Urbanism on Prices of Single Family Homes. Prepared for the Urban Land Institute. Florida Department of Environmental Protection, Office of Greenways and Trails. (1998). Thinking Green: A Guide to the Benefits and Costs of Greenways and Trails. Tallahassee, FL: Author. Go for Green. (1998). Economic Benefits of Trails. Ottawa, Ontario. Greer, Donald L. (2000). Omaha Recreational Trails: Their Effects on Property Values and Public Safety Omaha. To obtain a copy contact Donald Greer at 402/554- 3693 or the River, Trails and Conservation Assistance Program in Omaha at 402/221-3350. Holmes Associates. (1994). Bicycle Master Plan for the Adirondack North Country Region of New York State. Saranac Lake, NY. http://www.adirondackresearch.com/bicycle/htoc.html. Howe, Jim, Ed McMahon and Luther Propst. (1997). Balancing Nature and Commerce in Gateway Communities. Washington, DC: Island Press. Available from The Conservation Fund, (703) 525-6300.

________________________________________________________________________________________________
The Economic and Health Benefits of Bicycling in Iowa www.uni.edu/step 44
Irvine, R. J. (1999). Trail Systems Planning, Public Policy Development and Initiation: Synthesis of the Literature and Identification of Best Practices. Victoria, BC: Recreation Planning Services. Prepared for the British Columbia Land Use Coordination Office. Joly, P. and Pronovost, J.F. (1998). Economic Impact of a National Bike Route; La Route Verte. Velo Quebec presentation. Krizek, Kevin. (date unkown) Estimating the Economic Benefits of Bicycling and Bicycle Facilities: An Interpretive Review and Proposed Methods. Minneapolis, MN: In “Essays on Transportation Economics,” Vicente Inglada, ed. Lerner, Steve and William Poole. (1999). The Economic Benefits of Parks and Open Space. San Francisco: The Trust for Public Land. www.tpl.org/newsroom/reports/econbenz/entry_econbenz.html Local Government Commission for the California Department of Health Services. (1999). The Economic Benefits of Walkable Communities. Maine Department of Transportation. (2001). Bicycle Tourism in Maine: Economic Impacts and Marketing Recommendations. http://www.state.me.us/mdot/opt/biketours/biketours.htm. Maryland Department of Transportation. (1994). Analysis of Economic Impacts of the Northern Central Rail-Trail. McLaren, G. (2002, October 27). Different takes on the Monon Trail. The Indianapolis Star. Retrieved December, 2002, from http://www.indystar.com/article.php?mononpeople27_p.html. McLaren, G. (2002, October 27). Trail touches all walks of life. The Indianapolis Star. Retrieved December, 2002, from http://www.indystar.com/article.php?monon27_p.html. McLaren, G. (2002, September 21). Happy trails: Whether on two feet or four wheels, recreation-path users mind manners. The Indianapolis Star. Retrieved
December, 2002, from http://www.indystar.com/article.php?trailrules_p.html.
Moore, R. L., & Barthlow, K. (1998). The Economic Impacts and Uses of Long- Distance Trails. Raleigh, NC: North Carolina State University, Department of Parks, Recreation and Tourism Management.. Prepared for United States Department of the Interior, National Park Service.

________________________________________________________________________________________________
The Economic and Health Benefits of Bicycling in Iowa www.uni.edu/step 45
Morris, H. (2002). Trails and Greenways: Advancing the Smart Growth Agenda. Washington, DC: Rails-to-Trails Conservancy. Murphy, M. (1992). The Impact of the Brush Creek Trail on Property Values and Crime. Rhonert Park, CA. National Bicycle and Pedestrian Clearinghouse. (1995). The Economic and Social Benefits of Off-Road Bicycle and Pedestrian Facilities. Retrieved December, 2002, from International Mountain Biking Association website: http://www.imba.com/resources/science/econsoc_benefits.html. National Park Service, Rivers Trails and Conservation Assistance. (1995). Economic Impacts of Protecting Rivers, Trails and Greenway Corridors. Washington, DC: Author. National Park Service, U.S. Department of Interior. (1998). The Economic Impacts
and Uses of long-Distance Trails: A Case Study of the Overmountain Victory National Historic(Walking) Trail.
http://www.whitman.edu/officesdepartments/penrose/govdocs/DOCS5.html. The Nelsion Institute for Environmental Studies, (2010). University of Wisconsin- Madison. Valuing Bicycling’s Economic and Health Impacts in Wisconsin. North Carolina Department of Transportation, Division of Bicycle and Pedestrian Transportation. (2004, July). Pathways to Prosperity: The Economic Impact of Investments in Bicycle Facilities, A Case Study of the North Carolina Northern Outer Banks. Office of Parks, Recreation, and Historic Preservation. (1999). Economic Impacts: Models to Reality. New York State. Olsen, T. (2002, November 25). Greenways get credit for pedestrian safety. The Indianapolis Star. Retrieved December, 2002, from http://www.indystar.com/print/articles/5/003406-7775-P.html. Outdoor Industry Foundation. (2006) Outdoor Recreation Participation Study, 8th ed., website: http://outdoorindustry foundation.org. Pennsylvania Economy League, Inc. and Stephen Farber, Ph.D. (January 1999). An Economic Impact Study for the Allegheny Trail Alliance. Available from the Pennsylvania Economy League, Inc., (412) 471-1477.

________________________________________________________________________________________________
The Economic and Health Benefits of Bicycling in Iowa www.uni.edu/step 46
Puncochar, B. & Lagerwey, P. (1987). Evaluation of the Burke-Gilman Trail’s Effect on Property Values and Crime. Seattle, WA: City of Seattle Engineering Department, Bicycle Program. Rails-to-Trails Conservancy. (1999) Economic Benefits of Trails and Greenways. Retrieved December, 2002, from Trails and Greenways Clearinghouse website: http://www.trailsandgreenways.org/TAG_Documents/FactSheets/pdf/11.pdf. Rails-to-Trails Conservancy. (1993). Economic Benefit of Rail-Trails: a Fact Sheet. Rivers Trails and Conservation Assistance National Park Service. (1995). Economic Impacts of Protecting Rivers, Trails, and Greenway Corridors: A Resource
Book, Fourth Edition, Revised. http://www.nps.gov/pwro/rtca/econ_index.htm Sælensminde, K. (2002). Walking- and cycling track networks in Norwegian cities: Cost-benefit analyses including health effects and external costs of road traffic. Olso: Institute of Transport Economics. South Carolina Department of Transportation, Bicycle and Pedestrian Program. (date unkown). South Carolina Bicycle Touring Guide. Spalding, T. & Kelly, F. (2002, October 28). Popularity of Monon keeping crime in check. The Indianapolis Star. Retrieved December, 2002, from http://www.indystar.com/article.php?mononcrime28_p.html. Sparks, D. (1998). Economic Impacts of Bike Tourism: A Case Study of South Carolina. The Citadel. Sustrans National Cycle Network. (1997). The Tourism Potential of National Cycle Network Routes: Background Facts and Figures. London: Tourism Society Seminar. Wall, J. K. (2002, October 28). Trail spurs businesses. The Indianapolis Star. Retrieved
December, 2002, from http://www.indystar.com/article.php?monon28_p.html.
Health References
Centers for Disease Control. (2010). SMART: Selected Metropolitan/Micropolitan Area
Risk Trends. Retrieved from: http://apps.nccd.cdc.gov/brfsssmart/MMS ACty Risk Chart.asp?MMSA=274&yr2=2010&qkey=1363&CtyCode=10773&cat=DB#DB
________________________________________________________________________________________________
The Economic and Health Benefits of Bicycling in Iowa www.uni.edu/step 47
Chida, H., & Hamer, M. (2008). Active commuting and cardiovascular risk: A mete- analytic review. Preventive Medicine, 46(1), 9-13. Community Health Needs Assessment (2010). Johnson County. County Health Rankings. (2011). Johnson, Iowa. Retrieved from: http://www.countyhealthrankings.org/iowa/johnson/other-measures Finkelstein EA, Fiebelkorn IC, Wang G. (2004). State-level estimates of annual medical
expenditures attributable to obesity. Obesity Research, Vol 12(1); 2004. 18–24. Grabow, M., Hahn, M., & Whited, M. (2010). Valuing bicycle’s economic and health impacts in Wisconsin. The Nelson Institute for Environmental Studies Center for Sustainability and the Global Enivronment. Ingram, D., & Franco, S. (2006). NCHS Urban-rural classification scheme for countries. Centers for Disease Control. Retrieved from: http://wonder.cdc.gov/wonder/help/cmf/urbanization-methodology.html Iowa Department of Public Health Center for Health Statistics. (2004). Iowa Health Risk
Behaviors: Final Report from the Behavioral Risk Factor Surveillance System, 2004 Retrieved from: www.idph.state.ia.us
Iowa Department of Public Health Center for Health Statistics. (2009). Iowa Health Risk
Behaviors: Final Report from the Behavioral Risk Factor Surveillance System, 2004 Retrieved from: www.idph.state.ia.us
Morgan, C., Currie, C, Ctott, H., Smithers, M., Butlert, C., & Peters, J. (2000). The prevalence of multiple diabetes-related complications. Diabetic Medicine, 17(1), 146-151. Oja, P., Vuori, I., & Paronen, O. (2000). Daily walking and cycling to work: their utility as health-enhancing physical activity. UKK Institute for Health Promotion Research, 33(1), S87-S94 State Health Registry of Iowa. (2011). Iowa Cancer Registry. Retrieved from: http://www.public-health.ui owa.edu/shri/ Vuori, I., Oja, P., & Paronen, O. (1994). Physically active commuting to work – testing its potential for exercise promotion. Medical Science Sports, 26(7), 844-850. Wellmark. (2010). Treatment cost estimator. Retrieved from: http://www.wellmark.com/HealthAndWellness/ChooseCare/TreatmentCosts.aspx.
________________________________________________________________________________________________
The Economic and Health Benefits of Bicycling in Iowa www.uni.edu/step 48
Bicycle Organizations/Cyclist Count References
Grabow, M., Hahn, M., & Whited, M. (2010). Valuing bicycle’s economic and health impacts in Wisconsin. The Nelson Institute for Environmental Studies Center for Sustainability and the Global Environment. Iowa Department of Transportation. (2008). Southwest Iowa bike count survey [Data file]. Available from Iowa Department of Transportation. Iowa Department of Transportation. (2009). Northeast Iowa bike count survey [Data file]. Available from Iowa Department of Transportation. Iowa Department of Transportation. (2010). Southeast Iowa bike count survey [Data file]. Available from Iowa Department of Transportation. Krizec, K. (2007). Estimating the economic benefits of bicycling and bicycle facilities: An interpretive review and proposed methods. Essays on Transport Economics. U.S. Census Bureau, American Community Survey. (2010). Bicycle Commuter Data.
Retrieved from http://www.bikeleague.org/news/acs2010.php.
Bicycle Retail Establishment Economic Impact References
Bashir, Z. “Partnering with Schools to Prevent Childhood Obesity.” Parks and
Recreation, 46(2), 45-46. EBSCOhost. Web. <http://web.ebscohost.com/ehost/pdfviewer/pdfviewer?sid=56d19104-1261-426a-9cec-d8ec87da45cc%40sessionmgr113&vid=2&hid=105>
Bureau of Labor Statistics. "Iowa - May 2010 OES State Occupational Employment
and Wage Estimates." U.S. Bureau of Labor Statistics. Web. 1 Sept. 2011. <http://www.bls.gov/oes/current/oes_ia.htm>.
Department of Transportation, Iowa. (2000) Connecting People and Trails: Local
Community Planning for Bicyclists and Pedestrians. Iowa Department of Transportation. Retrieved August 25, 2011 from: http://www.iowadot.gov/iowabikes/trails/web-pdf/Bike-Ped/connecting_people_trails_handbook.pdf
Department of Transportation, Iowa. (2000) Implementing Trail-Based Economic
Development Programs; A Handbook For Iowa communities. Iowa Department of Transportation. Retrieved August 25, 2011 from: http://www.iowadot.gov/iowabikes/trails/web-pdf/EconHandbook/HANDBOOK.pdf

________________________________________________________________________________________________
The Economic and Health Benefits of Bicycling in Iowa www.uni.edu/step 49
Frank, L. (2004, Sept.). Economic determinants of urban form: Resulting trade-offs between active and sedentary forms of travel. American Journal of Preventative Medicine, (Vol. 27, Issue 3, Supplement 1). Retrieved August 24, 2011, from SciVerse; ScienceDirect: http://www.sciencedirect.com/science/article/pii/S0749379704001813
Goswami, Joydeep. (2004) The Economic Impact of the Houston Bikeway Program
on Houston. University of Texas at Austin. Retrieved August 30, 2011 via Google Scholar: http://documents.publicworks.houstontx.gov/documents/divisions/ecd/research_paper_081304.pdf
Ilie, A., Rosca, E., Rusca, A., & Rusca, F. (2010, Nov. ) Non-motorized transportation—
an educational challenge for urban communities. Theoretical and Empirical Researches in Urban Management, (17), 5. Retrieved August 24, 2011, from Academic OneFile via Gale: http://go.galegroup.com/ps/start.do?p=AONE&u=uni_rodit
Iowa Bicycle Coalition. “Iowa Bicycle Shops and Retailers.” Iowa Bicycle Coalition.
Web. 1 Sept. 2011. <http://www.iowabicyclecoalition.org/bikeshops> Kim, Jeanhee. (2003, Sep) Ride Yourself Rich. Bicycling, (Vol. 44 Issue 8, p.42)
Retrieved August 30, 2011 from Ebscohost: http://web.ebscohost.com/ehost/detail?sid=cd11dff8-aec6-4646-b423-c5ef1712d660%40sessionmgr115&vid=1&hid=123&bdata=JnNpdGU9ZWhvc3QtbGl2ZQ%3d%3d#db=crh&AN=10464559
Krizek, Kevin J. (2007) Estimating the Economic Benefits of Bicycling and Bicycle
Facilities: An Interpretive Review and Proposed Methods. Essays on Transportation Economics, Retrieved August 25, 2011 via Google Scholar: http://www.peoplepoweredmovement.org/site/images/uploads/Economic_Benefits_of_Bicycling_and_Bicycle_Facilities.pdf
League of American Bicyclists. “Bicycle Friendly State.” League of American
Bicyclists. Web. Feb. 2011 < http://www.bikeleague.org/programs/bicyclefriendlyamerica/bicyclefriendlystate/>
Shim, Janet. "IBISWorld Industry Report 44122b; Bicycle Dealership and Repair in the US." IBISWorld. Web. 1 Sept. 2011. <http://clients.ibisworld.com.proxy.lib.uni.edu/industryus/ataglance.aspx?indid=1009>.
Winters, Meghan. (2010, Dec.) Built Environment Influences on Healthy

________________________________________________________________________________________________
The Economic and Health Benefits of Bicycling in Iowa www.uni.edu/step 50
Transportation Choices: Bicycling versus Driving. Journal of Urban Health, (Vol. 87, Issue 6). Pg.969 Retrieved August 25, 2011, from SpringerLink: http://www.springerlink.com/content/t3637g18m41kt466/export-citation/
Wykle, K. R. (1999,September-October) Pedaling into the 21st century. Public Roads,
(Vol. 63). (2), 30. Retrieved August 24, 2011, from Academic OneFile via Gale: http://go.galegroup.com/ps/start.do?p=AONE&u=uni_rodit

________________________________________________________________________________________________
The Economic and Health Benefits of Bicycling in Iowa www.uni.edu/step 51
Appendix 1: Number of Cyclists
Determining the number of cyclists in the state included identifying data for both commuter cyclists and recreational cyclists. The information below details the methods for calculating the number of commuter cyclists and recreational cyclists in Iowa. Methodology
To find the number of bicyclists in Iowa, data was collected from both trail use and commuter use. The commuter use data was found in the US Census Bureau, 2010 American Community Survey compiled by the League of American Bicyclists. The survey provided data for four cities in Iowa including Cedar Rapids, Des Moines, Iowa City, and Sioux City. The average percentage of bicycle commuters in those four cities is 1.73%. The median percentage is .55%. Because Iowa City was a large outlier in the data, the median percentage was used in calculating the estimated number of bicycle commuters in Iowa. By taking the median percentage and multiplying it by the population of commuters over the age of 16 years old in Iowa 1,440,541 (U.S. Census, 2010) the estimated number of bicycle commuters in Iowa is 7,923. Using the mean percentage to calculate, the estimated number of bicycle commuters in Iowa is 24,921. To calculate the number of trail cyclists, data was taken from the 2008, 2009, and 2010 Bike Count Program conducted by the Iowa Department of Transportation. ADR recorders (portable traffic counters) were located to count trail users from mid-May to mid-September covering the most active bike riding period of Memorial Day to Labor Day. The 2008, 2009, and 2010 programs measured the southwest, northeast and southeast quadrants of the state of Iowa respectively. Between nine and twelve locations were selected by various state agencies from each quadrant to be test sites. From the information gathered from the test strips, the average number of cyclists was calculated on the tested trails. Table 1 shows the calculated usage between May and September in each of the locations. As noted in the Iowa Department of Transportation trail user data report, there were fluctuations in the number of users due to malfunctions in the Adr strips, battery failure and severe weather. Considering all of these factors, the Iowa Department of Transportation still considers the collection of bicycle user data on trails a successful endeavor.
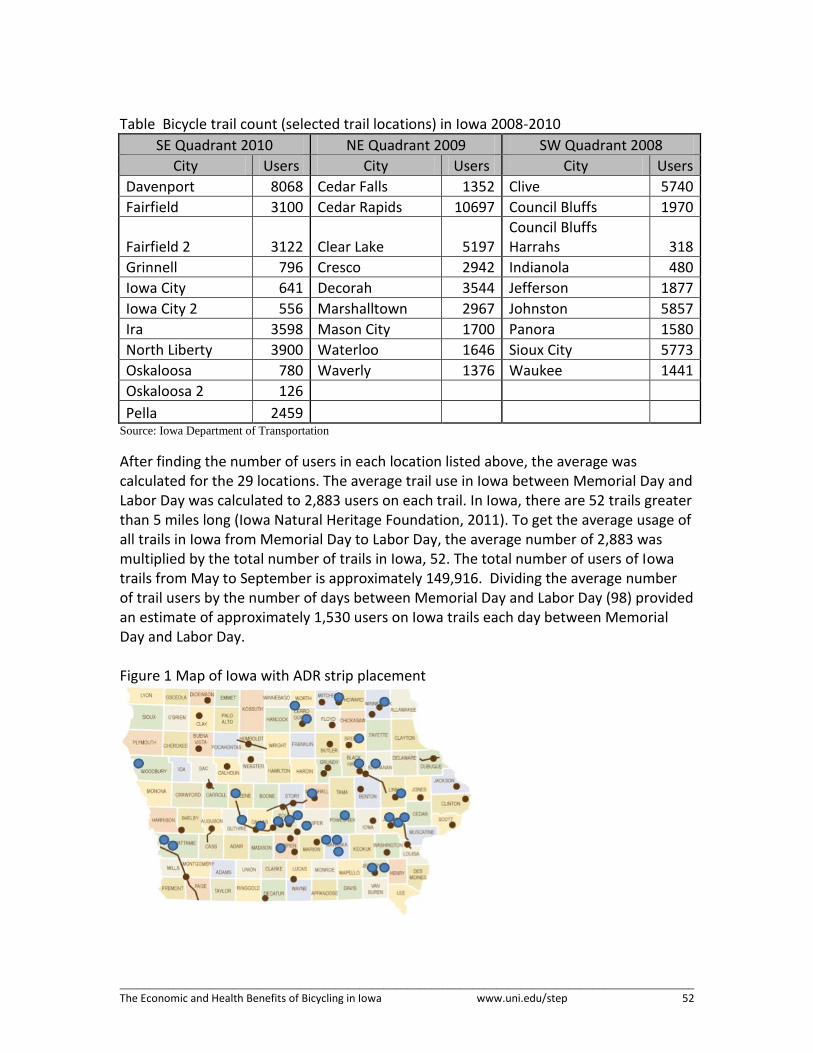
________________________________________________________________________________________________
The Economic and Health Benefits of Bicycling in Iowa www.uni.edu/step 52
Table Bicycle trail count (selected trail locations) in Iowa 2008-2010
SE Quadrant 2010 NE Quadrant 2009 SW Quadrant 2008
City Users City Users City Users
Davenport 8068 Cedar Falls 1352 Clive 5740
Fairfield 3100 Cedar Rapids 10697 Council Bluffs 1970
Fairfield 2 3122 Clear Lake 5197 Council Bluffs Harrahs 318
Grinnell 796 Cresco 2942 Indianola 480
Iowa City 641 Decorah 3544 Jefferson 1877
Iowa City 2 556 Marshalltown 2967 Johnston 5857
Ira 3598 Mason City 1700 Panora 1580
North Liberty 3900 Waterloo 1646 Sioux City 5773
Oskaloosa 780 Waverly 1376 Waukee 1441
Oskaloosa 2 126
Pella 2459 Source: Iowa Department of Transportation
After finding the number of users in each location listed above, the average was calculated for the 29 locations. The average trail use in Iowa between Memorial Day and Labor Day was calculated to 2,883 users on each trail. In Iowa, there are 52 trails greater than 5 miles long (Iowa Natural Heritage Foundation, 2011). To get the average usage of all trails in Iowa from Memorial Day to Labor Day, the average number of 2,883 was multiplied by the total number of trails in Iowa, 52. The total number of users of Iowa trails from May to September is approximately 149,916. Dividing the average number of trail users by the number of days between Memorial Day and Labor Day (98) provided an estimate of approximately 1,530 users on Iowa trails each day between Memorial Day and Labor Day. Figure 1 Map of Iowa with ADR strip placement

________________________________________________________________________________________________
The Economic and Health Benefits of Bicycling in Iowa www.uni.edu/step 53
Appendix 2: Model of Multiplier Concept
Source: Crompton, J.L., 1995.
Direct impact Indirect impact – round 1 Indirect impact – round 2