economic and social effects of el niño in ecuador, 1997-1998
TRANSCRIPT

Economic and Social Effectsof El Niño in Ecuador, 1997-1998
Rob VosMargarita VelascoEdgar de Labastida
Inter-American Development Bank
Washington, D. C.
Sustainable Development DepartmentTechnical Papers Series

Cataloging-in-Publication provided byInter-American Development BankFelipe Herrera Library
Rob Vos is Deputy Rector and Professor of Finance and Development at the Institute of Social Studies, The Hague,The Netherlands. He was a senior economist in the Integration Department of the IDB between 1994 and 1997. Mar-garita Velasco is a public health specialist and a consultant for the SIISE project (Sistema Integrado de IndicadoresSociales del Ecuador) in Quito, Ecuador, which is co-sponsored by the IDB. Edgar de Labastida is a private consult-ant based in Quito, Ecuador, specializing in rural and agricultural development, indigenous populations, health eco-nomics, and poverty analysis. The authors thank Wladymir Brborich, René Ramirez, Edwin Galindo, MercyBalarezo, Rene Ramirez and Carmen Lucía Sandoval for their research assistance. Helpful comments on a previousdraft by the Ecuadorian authorities, CEPAL, Nora Lustig, Steve Vosti, Michael Walton, Graham Pyatt, FrancesStewart and Valpy FitzGerald are gratefully acknowledged. Of course, the authors remain responsible for any re-maining errors. This paper is an abridged version of the study by the same authors entitled, Los efectos económicos ysociales del fenómeno de El Niño en Ecuador, 1997-1998 prepared for the Inter-American Development Bank. Itwas presented at the LACEA/IDB/ World Bank Network on Inequality and Poverty, First Annual Meeting, Torcuatodi Tella University, Buenos Aires, Argentina, October 21, 1998. It was also presented at the Conference of theLatina American and Caribbean Economic Association in Buenos Aires on October 22-24, 1998. Comments andsuggestions are welcome. Please send them to Rob Vos, Institute of Social Studies, P. O. Box 29776, 2502 LT, TheHague, Netherlands, telephone: +31-70-4260544, fax: +31-70-4260799, e-mail: [email protected].
The opinions discussed herein are those of the author and do not reflect the official position of the Inter-AmericanDevelopment Bank.
October 1999
This publication (Reference No. POV-107) can be obtained from:
Poverty and Inequality Advisory UnitMail Stop E-0421Inter-American Development Bank1300 New York Avenue, N.W.Washington, D.C. 20577
E-mail: [email protected]: 202-623-3299Web Site: http://www.iadb.org/sds/pov

Abstract
Natural disasters like the “El Niño” phenomenon often hit hardest on the poor. Yet, it is often difficult to separatethe effects on living conditions resulting from inclement weather from general inadequacies in infrastructure and lackof economic development. This study proposes methodologies to identify different types of risks associated withnatural disasters and to establish degrees of vulnerability to such risks by geographical areas and population groups.It finds that most economic costs in Ecuador relate to losses of agricultural production and damages to infrastructure.Increased health risks are also critical. Outcomes suggest that most of the agricultural income losses are borne bysmall farmers in the production of rice, corn, coffee and cocoa, and to a lesser extent by agricultural workers in thesugar cane industry and banana plantations. The overall impact on the already high poverty incidence in the affectedareas could be as large as 10 percentage points. For some, El Niño was not a disaster but a boon. Wealthy shrimpproducers, in particular, saw productivity increase by over 25%, while banana exporters can compensate for produc-tion losses through higher export quotas and prices. Health risks are greatest in areas with poor sanitary infrastructureand poor overall social conditions.

FOREWORD
As part of its mission, the Poverty and Inequality Advisory Unit encourages new research to assess theimpact of adverse covariant shocks on poverty and design appropriate policies to protect the poor againstthese shocks.
Meteorological and seismic phenomena of extreme magnitude, which are frequent in Latin America and the Carib-bean, can translate into a sharp increase of poverty and inequality when risks to productive, social and housing infra-structure are not properly addressed beforehand. In order to reduce the human, economic and social toll taken bynatural events, a careful analysis of the geographical location, type of occupation and level of income of human set-tlements is an essential step in correctly assessing and reducing the vulnerability of a country to natural hazards.
This case study assesses the economic and social impact of El Niño by estimating the increase in ruralpoverty in affected areas. It also proposes a methodology to analyze risks posed by El Niño-relatedweather patterns and evaluate the degree and nature of the vulnerability of different population groups tosuch risks. Finally, the study gives useful recommendations for designing effective preventive and reliefpolicies to reduce the economic and social negative impact of natural disasters.
Economic and Social Effects of El Niño in Ecuador, 1997-8 can provide a useful analytical foundationfor future IDB projects aiming at reducing the risks and costs associated with natural hazards in LatinAmerica and the Caribbean.
Nora C. LustigSenior Advisor and Chief
Poverty and Inequality Advisory Unit

Contents
I. Introduction 1II. Economic and Social Costs of El Niño 3
III. Estimates of Economic and Social Costs in the Rural SectorCaused by El Niño in 1997-98 10
IV. Impact of El Niño on Health Risks: Natural Disaster or FailedHealth Policies? 18
V. Action for Emergency Relief and Reconstruction 25
VI. Conclusions and Policy Recommendations 27
VII. Appendix Tables 30
VIII. Bibliography 38

1
I.Introduction
The natural phenomenon of “El Niño” is aregularly occurring change in Pacific Oceantemperatures provoking temporal climaticchange around the world.1 Along the coast ofSouth America, El Niño is felt in the form ofextremely heavy rainfall causing floods andlandslides, often with disastrous consequences.The poor are often the most affected by theseevents because they tend to live in more pre-carious dwellings and have limited access toprotective infrastructure.
The 1997-98 El Niño in Ecuador cost the livesof at least 286 people and left some 30,000 per-sons homeless. A much larger share of thepopulation was affected by income losses as ag-ricultural land flooded or lost their jobs becauseof the resulting stagnation in economic activity.We estimate that about a quarter of the total wasexposed to increased health risks in the form ofinfectious diseases such as malaria, diarrhea,and cholera, related to floods and damages tosanitary infrastructure.
In contrast to many other natural disasters, ElNiño came pre-announced. Early in 1997 it wasclear there was a large probability that the phe-nomenon would set in around November andcause extremely heavy rainfall (with all its re-lated consequences). The experience of 1982-83yielded some lessons, leading the government toprepare a Contingency Plan and declare a state 1 The phenomenon El Niño should not be confusedwith the El Niño ocean current, which each year aroundChristmas brings warmer seawater to the coasts of Ec-uador and Peru, to return to the coast of Mexico aroundApril. This period marks the rainy season. The phe-nomenon of El Niño originates in waters near Indone-sia. It returns with a regularity of about once everyseven years, but with a maximum delay of 15 years.The previous occurrence with heavy impact of the phe-nomenon in Ecuador was in 1982-3. When referring to“El Niño” in this study we indistinguishably refer to“the phenomenon.”
of emergency in July 1997. The Ecuadorianauthorities established a budget for emergencyrelief and reconstruction of US$318 million, ofwhich US$231 million was in the form of loansfrom multilateral agencies and related counter-part funds.
The paradox of the situation was that while theauthorities felt that this time around they werebetter prepared, preventive action and prepara-tions for rehabilitation and reconstruction wereunsatisfactory. In this study we argue that abetter assessment of the different types of risksassociated with the phenomenon, as well as theidentification of the vulnerability of differentpopulation groups could have greatly improvedthe response. Government approaches to therisks on the part of the authorities remained toogeneral and untargeted. The Contingency Planidentified a total of 6.5 million people at risk,that is 57% of the total population, but did notspecify the responses needed for the differenttypes of impacts such as destroyed dwellings,loss of income and production, increased healthrisks and so on.
The first objective of this study is to analyze the(potential) impact of El Niño in terms of eco-nomic losses and increased health risks, withparticular emphasis on the most vulnerablepopulation groups.2 A second objective of thestudy is to show how the methodology used todifferentiate between risks and vulnerability ofdifferent population groups may help to guidepolicies whose aim is preventive reconstructionof the affected areas and, at the same time, tar-get the benefits to those most vulnerable.
2 We refer to “potential” impact because the effects ofthe disaster were not fully measurable at the time thatthis study was completed (February-June 1998).Moreover, effects of the phenomenon were still beingfelt at the time.

2
Section 2 of this report offers a conceptualiza-tion of the types of risk and vulnerability associ-ated with El Niño and how to assess the costs ofthis type of natural disaster. Section 3 providesan estimation of the economic costs (and bene-fits) in terms of foregone earnings to farmersand agricultural workers, based on an analysisof the vulnerability to weather shocks by cropsand agroecological zones. This analysis is sub-sequently used to estimate the potential impacton rural poverty and to identify the rural popu-lation that is likely to have suffered most fromthe natural disaster. A study of the vulnerabilityto health risks and preventive actions required to
reduce it is presented in Section 4. Section 5summarizes the emergency relief and preventiveactions taken or programmed by the authoritiesand undertakes a general assessment of their ef-fectiveness. Policy conclusions are drawn inSection 6. The discussion there centers aroundthe question of whether disaster relief and in-come loss compensation programs should beemphasized, or if the disaster offers an opportu-nity to reconsider development plans and in-vestment priorities in order to reduce future vul-nerability to weather shocks in a more structuredway. The conclusions favor of the latter solu-tion.

3
II.Economic and Social Costs of El Niño
Methodological Considerations
“It’s because of El Niño.” This often-heard ex-pression is used in many parts of the world toexplain abnormal climatic conditions experi-enced during 1997 and 1998. While it is a well-known natural phenomenon, it is not alwaysclear to what extent heavy rainfalls and floodsor prolonged periods of drought observedaround the world can all be related to El Niño.Also, precise indications of the deviation fromnormal conditions are not always available.
In the case of Ecuador, the inclement weatherand subsequent floods and landslides that af-fected most of the country’s coastal region dur-ing 1997-8 were undoubtedly related to the ElNiño phenomenon. Yet roads, bridges, anddrinking water systems succumb to some degreeof damage every year during the rainy season. Inaddition, it is normal for agricultural producersnot to harvest a portion of their crops during pe-riods when rural roads are impassable. There isno reliable record of what these ‘normal’ dam-ages are, and hence it is difficult to measurehow much of the destruction in 1997-8 was ac-tually caused by El Niño. Further, some areashave been more heavily affected than others.This is not because rainfalls have been moreheavy, but because of greater deficiencies inexisting infrastructure. Similarly, certain areashave been less affected by increased health riskbecause of better coverage of immunizationsand sanitation systems. This raises the issue ofvulnerability: some areas and population groupsmay be more at risk than others. It also raisesthe issue of how to measure costs: should dam-ages be valued at the cost of rehabilitation, thatis, returning the assets to pre-El Niño condition,or should they be valued at reconstruction costs,that is, at what it would cost to upgrade them toprovide better protection in the future?
Studies of natural disasters are inherently com-plex and have to deal with important methodo-logical problems. The first is the uncertainty re-garding El Niño. Despite the general predict-ability of the phenomenon, there remains con-siderable uncertainty regarding how, when, andto what degree it will affect areas of potentialrisk. Based on an evaluation of past experience,we approach this issue by identifying differenttypes of risks attached to the phenomenon andthe different degrees of vulnerability of geo-graphical zones and population groups that arelikely to be affected. In particular, we deal withthe vulnerability to agricultural income lossesand increased health risks associated with theenvironmental damages caused by El Niño. Al-though this study was undertaken while theevent was still occuring, first indications of itsimpact are consistent with the predictions of thevulnerability analysis. Hence, the approachshould help to more easily identify the types ofemergency relief and preventive action thatshould be undertaken. It should also be useful inestablishing priorities among areas and popula-tion groups requiring specific attention to copewith losses and to target interventions that mightprevent even larger losses.
The second problem relates to the assessment ofcosts. Several issues are at stake here. One is thechoice of an appropriate benchmark as sug-gested above. To measure the cost associatedonly with the natural disaster, we must be ableto distinguish between the damage caused by thedisaster and the “normal” depreciation of thecapital stock (infrastructure), changes in pro-duction levels or the health risk to the popula-tion that are independent of it. In particular, the“normal” situation in areas subject to otherweather or exogenous shocks should be takeninto account. Comparison with the previous oran average year may not be adequate.

4
Another consideration of importance is how tovalue damage to natural and physical capitalstocks, output losses and foregone earnings.This is not just a technical issue, but one linkedto policy objectives. For instance, damage to in-frastructure could be valued at the cost of fullreconstruction, that is, making improvements inthe structure as well as rebuilding it and leavingit in a better shape than before. Although thiscan make good sense from a developmentalpoint of view, it may raise political economyproblems. For instance, if roads and bridgeswere already deteriorated or in need of repair,then the natural disaster, rather than poor in-vestments in the past, would be blamed. The re-sult would be exaggerated natural disaster costs(see Albala-Bertrand 1993; Noll 1996) and mayeasily lead to misguided disaster relief policiesand foreign assistance programs. However, ifthe main policy objective is developmental re-construction of the affected areas, such valua-tion of resource needs may well be justifiable.However, these costs must be clearly distin-guished from the damages caused solely by thenatural disaster.
Two other methodological problems associatedwith cost assessments should be considered.They are distinguishing between direct and indi-rect losers, and seperating losses from delay.Farmers may have lost a harvest as a direct con-sequence of El Niño, but consumers and agro-industries may suffer indirect effects in the formof increased food prices and/or reduced or stag-nant supply. The identification of direct and in-direct effects is further complicated by marketresponses to the natural disaster, e.g. farmersmay compensate for output losses by raisingfood prices and transporters affected by dam-aged roads may raise freight fees. Losses in ag-riculture may be associated with labor that wentunused crops that could not be harvested. How-ever, there could also be delays if sowing andharvesting have to be put off in response to ElNiño.
This study deals with the cost problem at twolevels: first, an estimation of the direct cost ofthe damages (in monetary terms); and second,estimates of possible costs of reconstruction and
improvements that would afford greater protec-tion from similar events in the future are madeas a function of the type of vulnerability.
On costs (section 3), we restrict ourselves to es-timates of direct costs, that is the economiccosts (in the form of foregone earnings and/orrehabilitation of damaged infrastructure to itsfunctional state prior to El Niño). Hence we donot try to estimate indirect costs which may re-sult through input-output links or through abso-lute and relative price effects by which produc-tion losses in one sector spill over to others. Todo this properly a general equilibrium modelwould be required, an exercise clearly beyondthe scope of this study.
Since no disaggregated data derived from directobservation are available, we need to identifyareas and population groups by their vulnerabil-ity to the (potential) impact of El Niño. We fo-cus in particular on two main types of vulner-ability: those affecting agricultural productionand incomes, and those raising health risks.
Identifying the Vulnerable Population inEcuador
Official policy in Ecuador has focused on theenvironmental risks linked to the phenomenonitself, that is, the risks associated with heavyrainfall, storms and spring tides. These mayprovoke floods, landslides, rupture of dikes, andso on which, in turn, will affect roads, sanitationsystems and other types of infrastructure, aswell endanger the lives and health of the popu-lation.
The effects of El Niño in 1982-3 served as a ba-sis to identify the areas of major potential riskby type of natural cause. The Defensa Civil(Civil Defense) was given the responsibility oforganizing preventive actions. By July 1997, ithad identified 93 cantones (municipalities), ofwhich 77 were in the provinces of the Costa (thetropical lowlands bordering the Pacific Ocean,see Table 1). Twelve more municipalities werelater added, reaching a total of 105 municipali-ties that could be potentially affected. The ag-gregate population of the area in question is 6.5

5
million. In other words, 57% of the country’spopulation was considered to be at risk (see Ta-ble 2).
This identification of vulnerable areas wasmeant to guide humanitarian emergency reliefand rehabilitate the affected infrastructure. The
main concern of the Defensa Civil was evacu-ating and assisting people in emergency situa-tions and keeping flooded areas accessible.Other agencies, such as the Ministry of Health,the Ministry of Social Works, and local authori-ties also relied on the same information.
Table 1Areas Potentially Affected by Environmental Risks as a result of El Niño, 1997-8
(number of potentially affected cantones in provinces of the Costa)
TYPE OFENVIRONMENTAL RISK
GUAYAS27 cantons
LOS RIOS11 cantons
EL ORO14 cantons
MANABI19 cantons
ESMERALDAS 6 cantons
Maximum risk of flooding 4 4 - -Very vulnerable to tamping ofdraining and sewerage systems
16 6 11 13 2
Only torrential rains 6 - 8 - 1Spring tides 6 - 3 7 4Overflowing of rivers 2 2 8 9 7AFFECTED HYDROGRAPHICBASINS
Río Guayasand micro-basins
Río GuayasBasin(delta)
Jubones, SantaRosa and Pagua.Lower parts ofriver basins
Chone andPortoviejo
Santiago-Cayapas,Ostiones, Mata andlower part ofMuisne
* Some cantons are affected by more than one type of risk at a time.Source: Defensa Civil del Ecuador, (July 1997); and Secretaría Técnica del Frente Social (SIISE),Cronología del fenómeno de El Niño en base al Periódico Hoy, 1982-1983 (February 1998).
Table 2

6
Potentially Affected Municipalities (Cantons) and Population, 1997-8
No. ofaffectedcantons
Totalpopulation(millions)
Defensa Civil Estimates 105 6.5
Breakdown proposed by this study Vulnerable to agricultural income losses 39 1.2 (of which: poor)1 39 0.9 Vulnerable to increased health risk 65 5.3 (of which: very vulnerable)2 52 2.5
Memo:Total population Ecuador (Nov. 1997) 11.2Total population Costa provinces 5.6Source: Defensa Civil (1997) and text.Notes:1. Population with consumption level below poverty line of US$61 per
person, per month in 1997.2. Population of cantons with an index of social and sanitation conditions (ICSS) below the national average. See text.3. Note that one cannot simply add the subtotals of the two categories
because there is substantial overlap.
By focusing primarily on the environmentalrisks, the authorities were unable to adequatelycategorize and distinguish between differenttypes of vulnerability: that is which areas andpopulation groups would be more affected bylosses in agricultural production, infrastructure,and increased prevalence of diseases and mor-tality.
In this paper we focus on two types of vulner-ability which are the most relevant in relation tothe consequences of El Niño:
• vulnerability to income losses, in particulardue to damages to agricultural productionand infrastructure for the poor populationonly, and
• vulnerability to increased health risk for thevery vulnerable population only.
As shown on Table 2, this more restricted focuson the risks for the poor and very vulnerable still
implies that a large part of the Ecuadorianpopulation has been exposed to severe incomelosses and increased health risks. We estimatethat among the poor and very vulnerable, thepopulation most at risk of experiencing incomelosses totals 900,000, while 2.5 million peopleare exposed to greater health risks. These twogroups overlap to a great extent.
By focusing on risk factors this analysis of vul-nerability is particularly useful for guiding pre-ventive action. At the same time, mid-waythrough 1998 when this study was completed,no adequate information was available to evalu-ate the precise impact of El Niño on the livingstandards of the population in the affected areas.Hence we also use the vulnerability analysis toproject the likely impact of El Niño on ruralpoverty and to locate priority areas for repairand reconstruction of sanitary infrastructure andhealth services.

7
To identify agricultural vulnerability we com-bine the following types of information on ar-able land: (i) the risk of floods; (ii) the locationof rivers and river basins and the vulnerability tooverflowing due to heavy rainfall; (iii) actualand potential land use by crop; and (iv) distri-bution of land by size of land holdings.
Map No. 1 provides an overview of the mostvulnerable areas, in particular of the cultivatedareas of the Guayas River basin. The inserts lo-cate the area and indicate those affected duringthe 1982-3 and 1997-8 episodes of El Niño.However, the map is not sufficiently detailed forthe agricultural vulnerability analysis. The iden-tified zones are heterogeneous in terms of alti-tude, water control systems and land use. For aproper analysis, geographic maps which canidentify land use and altitude levels at intervalsof 5 meters (at least for the lowlands) are re-
quired. Such maps have not been devised forEcuador’s risk zones, even though this would betechnically feasible using available aerial pho-tography. The development of these maps wouldbe an appropriate technique to monitor the areasaffected by El Niño. Due to the limited time andthe costs involved, we only used the source for asmall area. Available cartography and data onland use from various sources and fieldwork re-ports were used to map the total vulnerable area.The vulnerable areas were subdivided into largeagroecological zones (Vos, Velasco and De La-bastida 1998) as follows: (i) terraces and allu-vial levels (vulnerable to overflowing of rivers);(ii) the Guayas river basin (very sensitive toflooding); (iii) the lower slopes of the Westerncordillera (sensitive to torrential rains and over-flowing rivers); and (iv) coastal areas (sensitiveto sea water erosion and spring tides).

8
Map No. 1: Agricultural Vulnerability to El Niño (Guayas River Basin)

9
The most vulnerable areas for each of thesezones were established (also using altitude lev-els) and the information was combined with dataon agricultural production and land use at the(administrative) canto level. Although the po-litical-administrative boundaries of provincesand cantons does not precisely coincide with thefour agroecological zones defined above, it doesallow the combination of information on landuse and vulnerability to flooding with other so-cioeconomic data at the local level. For exam-ple, using the poverty map for Ecuador (Larreaand others 1996), we add information on pov-erty incidence in the (potentially) affected agri-cultural zones to identify the most vulnerablepopulation to agricultural income losses at thelevel of cantons. In this way, we obtain a totalrural population vulnerable to agricultural lossesfor 39 cantons of 1.2 million (Table 2). Of these,73% are estimated to have per capita consump-tion levels below the poverty line (US$61 perperson per month at 1997 prices).3
Structural risk factors are analyzed to ascertainthe impact on health. Based on an analysis ofthe
3 This poverty line is taken from the World Bank pov-erty study of Ecuador (World Bank 1996).
observable deterioration in health conditionsfollowing El Niño in 1982-3, a composite indexis constructed which defines the social andsanitary conditions (ICSS) of the population inthe potentially affected areas. Using a principalcomponents analysis, four determinants arefound to be strongly associated with the likeli-hood of increased health risk due to El Niño(Velasco and others 1998): (i) access to drinkingwater; (ii) access to adequate sewerage systems;(iii) overcrowding of housing; and (iv) adultfunctional illiteracy. The resulting index has arange of 0 to 100. The lower the ICSS thegreater the expected health risks. Applying theICSS to the 105 potentially affected cantons wefind that 2.5 million people are highly vulner-able to increased health risks (Table 2). Subse-quently, as explained in Section 4, we combinethis information with available data on actualdamages to social infrastructure and increases ininfectious diseases and deaths due to El Niño, aswell as with data on available health services, toidentify priority actions, both preventive and re-constructive.

10
III.Estimates of Economic and Social Costs in the Rural Sector
Caused by El Niño in 1997-8
Total Foregone Earnings in Agriculture
Agriculture, roads and transportation experi-enced most of the damages caused by El Niño(Table 3). Even though not all effects were evi-dent by June 1998, total expected net losses,valued in terms of foregone earnings are esti-mated at US$112.3 million (or 4.7% of agricul-tural GDP and 0.6% of total GDP).4
As indicated in Table 3, El Niño also hasbrought some important benefits to agricultureand fishing. Rainfall in normally dry areas hasyielded productivity increases for some agri-cultural crops. The most noticeable gains can beobserved in (on land) shrimp farming, wheredamage to the fishing pools was limited, whilethe warmer waters allowed for substantial pro-
4 While substantial, these losses are considerably lowerthan those estimated in an ECLAC study (1998) con-ducted around the same time as this one. ECLAC esti-mates damages in agriculture as high as US$966 mil-lion which would be the equivalent of 37.6% of agri-cultural GDP and 4.8% of total GDP. Differences in theidentification of the areas actually flooded and in thevaluation methodology explain the large discrepancy.Our lower estimate is in part due to greater precision inidentifying the areas actually flooded at an adequatelevel of topographic detail as proposed in Section 2.Foregone earnings in this study have been valued interms of value added, rather than by total productioncosts as was done in the ECLAC study. In the case ofmost annual crops, production (and harvesting) wasdelayed, thus not incurring much of the intermediateinput costs. Further, we used ‘pre-El Niño’ off-farmand market prices differentiated by the ‘normal’ marketorientation of the produce (domestic or external),whereas the ECLAC study used mostly export prices.These methodological differences are detailed furtherin an extended version of this study (Vos, Velasco andDe Labastida 1998: Annex 1).
ductivity gains due to increased natural larvaproduction. Shrimp production and exports roseby 26% between November 1997 and June 1998as compared to the same period in 1996-7 (seeVos, Velasco and De Labastida 1998: Table 8).The gains in shrimp production partly offsetlosses in agriculture; however, these gains ac-crue to wealthy large-scale shrimp farmers andexporters, while agricultural losses have fallenmainly on the poorer farmers and agriculturallaborers.

11
Table 3Estimation of the Overall Direct Cost of the Damages Caused by El Niño, 1997-8
(Millions of US dollars)
1997-8 (until June 1998)Costs Benefits Net Costs
Agriculture 182.3 15.3 167.0 Farmers-owners 50.8 6.7 44.1 Agricultural workers 73.9 73.9 Domestic traders 57.6 8.6 49.0Livestock 7.7 7.7 Livestock farmers-owners 2.4 2.4 Wage-earners in livestock 2.7 2.7Shrimp farming 7.5 75.5 -68.1Fishing 12.4 6.7 5.7 Traditional fishing 12.4 12.4 Industrial fishing boats 6.7 -6.7Total Agriculture, Livestock and Fishing 209.9 97.5 112.3 (% of agricultural GDP) 8.8% 4.1% 4.7% (% of total GDP) 1.1% 0.5% 0.6%Sources: Vos, Velasco and De Labastida (1998).
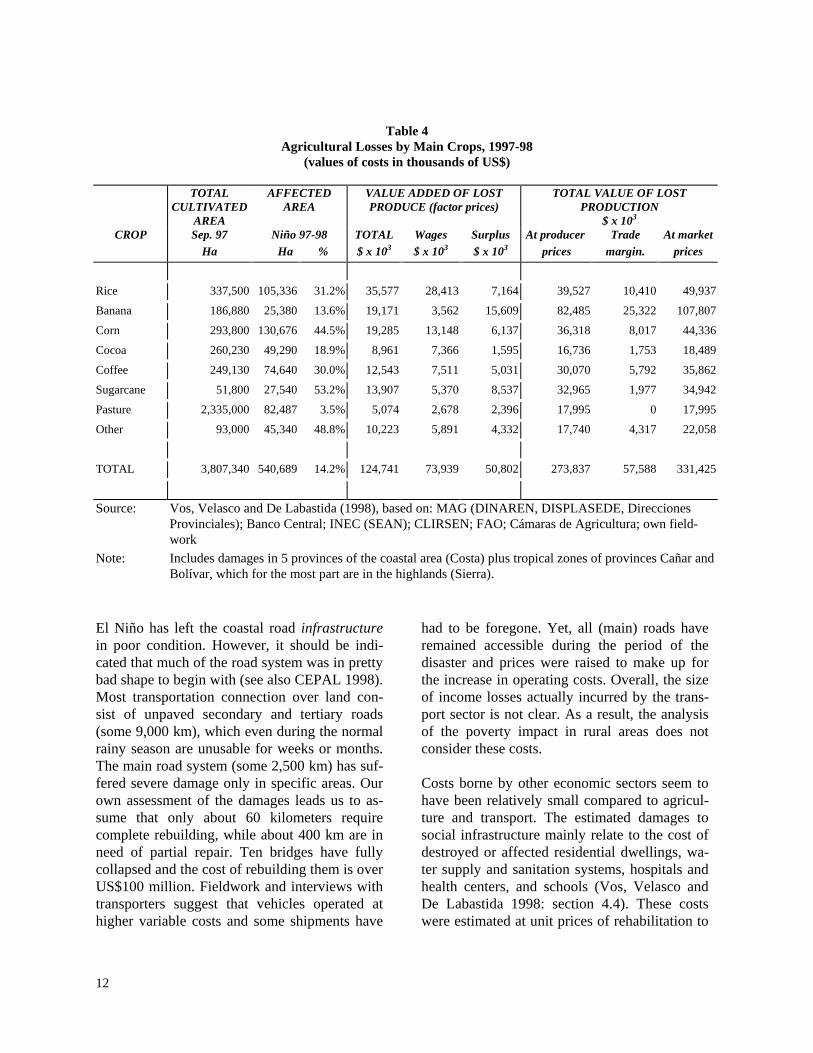
As the data shows, some groups of farmers havesuffered substantial agricultural income losses.The most heavily affected crops are rice, cornand sugarcane (which are mainly produced forthe domestic market) and the export crops ba-nanas and coffee (see Table 4). About 14% ofthe total area under cultivation in the affectedprovinces experienced damages and productionlosses. Rice, corn and coffee are grown mainlyin family-owned farms by small-scale producersand make relatively intensive use of family andhired labor. Self-employed farmers and workersin those sectors had to cope with important in-come losses. As will be shown in more detailbelow, this had an important impact on povertyrates in the affected regions.
Banana and sugarcane are mostly produced onlarge plantations in Ecuador’s lowlands. The1997-98 El Niño left some 12,000 workers tempo-
rarily out of work in these labor-intensive indus-tries. Although the owners of banana plantationsincurred production losses as a result, their losseswere partly offset as export prices rose and theEuropean Union raised its import quotas. Sugar-cane growers and laborers were similarly af-fected. About 90% of all sugarcane is produced atthree large industrial estates (ingenios) which op-erate with seasonal workers. As a result of ElNiño, 53% of the cultivated area could not beharvested leading to job losses for workers. Estateowners did not fare as badly, however. The gov-ernment gave them exclusive licenses to marketand distribute imported sugar.
Agricultural income losses due to El Niño thusseem to be severe. The impact on living condi-tions was compounded by damages to the trans-port infrastructure, housing and sanitation sys-tems, and the overall macroeconomic effects.
12
Table 4Agricultural Losses by Main Crops, 1997-98
(values of costs in thousands of US$)
TOTALCULTIVATED
AREA
AFFECTEDAREA
VALUE ADDED OF LOSTPRODUCE (factor prices)
TOTAL VALUE OF LOSTPRODUCTION
$ x 103
CROP Sep. 97 Niño 97-98 TOTAL Wages Surplus At producer Trade At marketHa Ha % $ x 103 $ x 103 $ x 103 prices margin. prices
Rice 337,500 105,336 31.2% 35,577 28,413 7,164 39,527 10,410 49,937
Banana 186,880 25,380 13.6% 19,171 3,562 15,609 82,485 25,322 107,807
Corn 293,800 130,676 44.5% 19,285 13,148 6,137 36,318 8,017 44,336
Cocoa 260,230 49,290 18.9% 8,961 7,366 1,595 16,736 1,753 18,489
Coffee 249,130 74,640 30.0% 12,543 7,511 5,031 30,070 5,792 35,862
Sugarcane 51,800 27,540 53.2% 13,907 5,370 8,537 32,965 1,977 34,942
Pasture 2,335,000 82,487 3.5% 5,074 2,678 2,396 17,995 0 17,995
Other 93,000 45,340 48.8% 10,223 5,891 4,332 17,740 4,317 22,058
TOTAL 3,807,340 540,689 14.2% 124,741 73,939 50,802 273,837 57,588 331,425
Source: Vos, Velasco and De Labastida (1998), based on: MAG (DINAREN, DISPLASEDE, DireccionesProvinciales); Banco Central; INEC (SEAN); CLIRSEN; FAO; Cámaras de Agricultura; own field-work
Note: Includes damages in 5 provinces of the coastal area (Costa) plus tropical zones of provinces Cañar andBolívar, which for the most part are in the highlands (Sierra).
El Niño has left the coastal road infrastructurein poor condition. However, it should be indi-cated that much of the road system was in prettybad shape to begin with (see also CEPAL 1998).Most transportation connection over land con-sist of unpaved secondary and tertiary roads(some 9,000 km), which even during the normalrainy season are unusable for weeks or months.The main road system (some 2,500 km) has suf-fered severe damage only in specific areas. Ourown assessment of the damages leads us to as-sume that only about 60 kilometers requirecomplete rebuilding, while about 400 km are inneed of partial repair. Ten bridges have fullycollapsed and the cost of rebuilding them is overUS$100 million. Fieldwork and interviews withtransporters suggest that vehicles operated athigher variable costs and some shipments have
had to be foregone. Yet, all (main) roads haveremained accessible during the period of thedisaster and prices were raised to make up forthe increase in operating costs. Overall, the sizeof income losses actually incurred by the trans-port sector is not clear. As a result, the analysisof the poverty impact in rural areas does notconsider these costs.
Costs borne by other economic sectors seem tohave been relatively small compared to agricul-ture and transport. The estimated damages tosocial infrastructure mainly relate to the cost ofdestroyed or affected residential dwellings, wa-ter supply and sanitation systems, hospitals andhealth centers, and schools (Vos, Velasco andDe Labastida 1998: section 4.4). These costswere estimated at unit prices of rehabilitation to

13
the State prior to El Niño. Some 14,000 homes,mostly those of the poorest, were fully or par-tially destroyed. The cost of rehabilitating thesehomes is estimated at about US$35 million.Probably more important than the damages tothe health infrastructure are the increased healthrisks associated with poor sanitary conditionsand ill-functioning health services. These in-creased health risks occur not just because ofdamaged social infrastructure, but in many re-gions because they are lacking. We deal with theconsequences of the losses in social infrastruc-ture in the section on health (section 4).
Direct economic costs of El Niño in agricultureand transportation infrastructure thus appear tobe substantial enough to affect the economy as awhole. Clearly, the natural disaster has come ata bad moment. The most serious attempts todate to stabilize Ecuador’s economy in the mid-1990s (see Jácome, Larrea and Vos 1998) werealready strained by the 1997 drop in oil prices,the country’s main export product. Estimates foreconomic growth in 1998 show a drop duringthe first two quarters to 0.6% from 2% in thefirst half of 1997. Overall growth for 1998 was2.2%, somewhat below the average of the 1990s(2.7%). Inflation reached an annual rate of 34%in July 1998, up from 30% for 1997.5
It is difficult to trace the impact of El Niño onreal economic growth due to the presence ofother external shocks. For instance, the fiscaldeficit increased in the first half of 1998 due toa further drop in oil prices and a loosening ofspending controls in the face of presidential andcongressional elections held in May. This, ratherthan the drop in the supply of agricultural prod-ucts, may well have caused the additional infla-tionary pressure. Central Bank data show thatagricultural GDP fell by 1.3% in the first twoquarters of 1998 compared to the first half of1997. Output also fell in the oil and constructionsectors. In contrast, growth in other sectors,such as transport and electricity, increased de-spite the El Niño, while the impact on othersectors seems to have been minor. 5 Estimates of Banco Central del Ecuador, Boletín deCoyuntura, http://www.bce.fin.ec, August 1998
A major consequence of the 1982-3 El Niño wasa steep rise in food prices. This did not occur in1997-8. Food price inflation went up from 35%at the end of 1997 to 43% in July 1998 (annualrates); far from the dramatic increase observedin the previous decade when food prices nearlydoubled. One should add though that timely in-creases in imports of basic food crops such asrice and sugar weakened the upward pressure onfood prices. Further, there was no apparent ma-jor impact on the urban economy. Fully compa-rable data on urban employment were not avail-able by June 1998. Yet two different labor forcesurveys undertaken in November 1997 and April1998 indicate that urban unemployment did notincrease in that period and may even havedropped slightly.6
In sum, the El Niño phenomenon caused sub-stantial economic damages. The exact macro-economic impact seems to have been limited, byand large, to the agricultural sector. The analysisalso suggests that the costs (and benefits) of ElNiño appear unequally distributed. To the extentthat there have been benefits, they mostly ac-crued to the more well off owners of large-scaleshrimp farms and banana and sugarcane planta-tions. The main losers in the process appear tobe the self-employed farmers and agriculturalworkers in rice, corn, banana, coffee, sugar caneand other crops for the domestic market. In theremainder of this section we will try to identifythe location of the most affected farmers and
6 Both the regular urban employment survey of INEC(November 1997) and a new urban labor force surveyconducted by the Universidad Católica of Quito (April1998) report an open unemployment rate in the majorcities of around 9%. The ECLAC study (ECLAC 1998)and official reports (e.g. COPEFEN 1998) also citethese surveys and report a steep increase in urban un-employment (to around 17%). This outcome was based,however, on the provisional, unpublished data from theApril 1998 survey, in which housewives not activelyseeking work were erroneously classified as unem-ployed. After correction of this error, the open em-ployment rate in the major cities is about 9% in April1998, somewhat below the rate observed in November1997.

14
estimate the likely impact of the income losseson rural poverty.
The Impact of El Niño on Rural Employmentand Poverty
Various analysts have documented a close rela-tionship between land distribution and rural pov-erty (Vos 1985; Barreiros and others 1987; WorldBank 1996). Less access to land is associated withless access to credit and modern agricultural in-puts, and also with lower agricultural income.Table 4 showed that, in absolute terms, the majoragricultural income losses due to El Niño oc-curred in the production of rice (US$36 million),followed at some distance by corn (maíz duro)(US$19 million), bananas for export (US$19 mil-lion), sugarcane (US$13 million) and coffee(US$12 million). Most sugarcane and bananaproduction for exports takes place at large scaleplantations of over 100 hectares. The other crops(rice, coffee and cocoa) are mainly produced atsmall- or medium-scale family farms, while cornis predominantly small-scale production in plotsof less than 5 hectares. In livestock production,the poorer farmers are also the most affected asthey lack the resources to move cattle to areassafe from floods.
There are no direct survey data to measure em-ployment losses in agriculture and the rural sectorat large. However, it is possible to estimate thelikely loss in full-time equivalent employmentfrom microeconomic information on labor use perhectare by crop and by technology level, and then
apply the derived parameters to the affected culti-vated areas. The results are shown in Table 5.Clearly, the data refer to direct employment lossesin agriculture due to the reduced area that wascultivated and/or harvested during November1997 and May 1998. Demand for agricultural la-bor likely has fallen by some 56,000 man-years,probably affecting about 112,000 agriculturalworkers or about 11% of the economically activepopulation in the rural areas of the Costa. Abouthalf of the affected workers are wage earners(mostly contract workers in sugarcane and bananaplantations), one-third are temporary workers(mostly in rice production) and the remainder arepaid family workers. Applying mean daily wagerates by area and crop, we estimate that the totalforegone earnings of affected workers is in theorder of US$73.9 million which amounts to aboutUS$650 per worker.
Table 5 gives the estimate of likely losses inwage income for agricultural workers based onour method to estimate of production losses us-ing the identification of areas vulnerable toflooding (section 2) and parameters regardinglabor use by crop and land size. Rural surveysare scarce in Ecuador and information systemson land use and agricultural production are in-complete or have been abandoned for lack of re-sources in recent years (such as the SEAN). Itmay be difficult to confirm the estimates of Ta-ble 5 through direct observation, and thereforeone has to rely on indirect measurement meth-ods as the one used here.

15
Table 5Employment Losses and Related Foregone Earnings in Agriculture
CROP AFFECTEDAREA
LOSS OF DIRECTEMPLOYMENT
FOREGONEWAGE
EARNINGS1
Has Affectedworkers
Increase in un-employment(man-years)
US$ million
Pasture 82,487 4,126 2,063 2.7Rice 105,336 43,716 21,858 28.4Corn (maíz duro) 130,676 20,228 10,114 13.1Banana 25,380 3,427 1,714 3.6Sugarcane 27,540 8,262 4,131 5.4Coffee 74,640 11,556 5,778 7.5Cocoa 49,290 11,332 5,666 7.4Other 45,340 9,071 4,536 5.9TOTAL 540,689 111,718 55,859 73.9Source: Table 4; Ministry of Agriculture (MAG); MAG-ORSTOM; and Vos, Velasco and De Labastida (1998).Note: 1. Refers to foregone earnings in terms of wages only. See Table 3 for total agricultural income losses.
Measurement of the (possible) impact on ruralpoverty has to rely, for the same reasons, on in-direct methods. To obtain an idea of the poten-tial impact on rural poverty the followingsources and procedures were used:
• Income and consumption data: The 1995Encuesta de Condiciones de Vida (LSMS)as well as projection of per capita con-sumption and poverty data at the level ofcantons produced for the Poverty Map forEcuador (see Larrea and others, 1996).7
• Poverty indices: Derived using consump-tion levels and a poverty line of US$61 per
7 The methodology applied in Larrea et al. (1996) issimilar to that applied in other countries of the region.It uses an econometric analysis to identify determinantsof urban and rural consumption levels and poverty ratesusing the LSMS survey data at the national and re-gional level (Costa, Sierra, Oriente). The results arethen used to project consumption and poverty at themunicipal level substituting data on the determinants,such as education and other socioeconomic character-istics, as derived from the population census into theestimated regression functions.
person, per month as established by theWorld Bank poverty study (1996).
• Consumption data for 1995: Updated forthe affected cantons to projected values atNovember 1997 prices using the overallconsumer price index and the averagegrowth rate of agricultural value addedbetween 1995 and 1997.
• Poverty-growth elasticity for the ruralpopulation: Assumed to be –1 (see Jácome,Larrea and Vos 1998, for a justification).
• Losses of value added accruing to owners(surplus) and traders (trade margins) arealso included in the estimate of the impacton poverty, except in the cases of bananaand sugarcane where large scale (non-poor)ownership dominates and trading is mostlycontrolled by the same large landowners orby wealthy trading firms. Moreover, mostof the landowners in export banana andsugarcane production typically do not re-side in rural areas.

16
Poverty already affected a major share of the ruralpopulation in the areas hit by El Niño. The ruralpoverty incidence in those areas was about 73%(Table 6). We estimate that, under the given as-sumptions, agricultural income losses due to ElNiño may have led to a rise in the incidence ofpoverty of about 11 percentage points. This im-plies that the living standard of an additional120,000 residents fell below the subsistence level.
The rural population of the province Los Ríos,where many farmers are engaged in the produc-tion of rice and corn, was hardest hit by El Niño.Foregone agricultural income amounts to 25% ofmean consumption of rural households in thisprovince. We estimate a rise in the incidence ofrural poverty of 18.6 percentage points, increasingthe number of poor by 53,000. Another severely affected area is the countrysidein the Guayas province where it is estimated thatthe rural population lost about 14% of the re-sources available to satisfy basic human needs.The number of people living below the povertyline likely increased by 10% (21,500 persons). InGuayas, self-employed farmers and workers in theproduction of rice, as well as wage earners in sug-arcane were the most affected. The third mostaffected province was Manabí where rural pov-erty is estimated to have increased by 35,000 peo-ple (8%). In Manabí, the most affected group wassmall producers of coffee and corn. Using more detailed information at the cantonlevel and combining it with the information on theexpected poverty impact and the cultivated areasmost vulnerable to flooding (see section 2), onemay obtain a ranking of most affected areas byagricultural income losses. These areas are notonly identifiable by degree of poverty, but also bymain type of agricultural production and zone ofagricultural vulnerability. A provisional rankingof cantons can be found in Table A.1.8 Clearly,
8 This is a provisional ranking for two reasons. First,some cantons could not be included in the analysis asthey are newly created (i.e. after 1990) and no informa-tion is available about land use and the structure ofagricultural production. Second, for the design of pol-
the cantons with the higher incidence of povertydepend on the production of the most affectedcrops i.e. rice and corn, and to a somewhat lesserdegree, coffee and cocoa production. In all of themost vulnerable regions, the family-based farm onsmall plots is the most common mode of produc-tion. Poverty rates tend to be lower in areas wherebanana and sugarcane production is most impor-tant, and where agricultural wage earners are themost affected socioeconomic group. Using thisranking we may identify the most vulnerablepopulation groups by cantons as follows (see Ta-ble A.2): • Self-employed farmers and families (rice,
corn, coffee, cocoa, livestock, other crops):cantons of Bolívar, Chone, Santa Ana, Jipi-japa, Tosagua, Sucre and Rocafuerte in theprovince of Manabí; Esmeraldas and Qui-nindé in the province of Esmeraldas; Vinces,Palenque, Quevedo, Ventanas, Baba and Ba-bahoyo in Los Ríos; La Trocal in Cañar; andPalestina, Samborondon and Urbina Jado inGuayas.
• Agricultural workers (wage earners) (sugar-cane and banana): cantons Quinindé (Esmer-aldas); Baba and Babahoyo (Los Ríos); LaTroncal (Cañar/Guayas); El Triunfo andNaranjito (Guayas); El Guabo, Pasaje andSanta Rosa (El Oro).
The government’s Contingency Plan containingthe guidelines as to how to respond to the impactof the disaster defined a much larger number ofpotentially affected cantons. However, the Plandid not differentiate their affected zones by thedegree of agricultural vulnerability. The aboveanalysis allows one to do so, thereby providing atool for targeting possible interventions to com-pensate for income losses and/or for targetingpreventive action to reduce vulnerability to futureweather shocks. We turn to the policy implica-tions in Section 5.
icy interventions one may wish to add other criteriathan those applied here.

Table 9 Typology of Cantons (Municipalities) Affected by El Niño. Case Studies.
TYPE
Canton (Province)
A Marcelino Maridueña (Guayas)
B Santa Rosa
(El Oro)
C Chone
(Manabí)
D Baba
(Los Ríos)
Poverty incidence (%) 23% 41% 60% 75% Functional illiteracy (% ofpopulation > 15 years)
15% 18% 35% 46%
Medical personnel (x 10.000inhabitants)
64 21.6 17 9.5
Deaths due to El Niño 1 25 7 3 Wounded due to El Niño 0 38 - 0 Damaged and destroyed houses 16 (1%) 1,838 (18%) 292 (1%) 60 (1%) Total dwellings in canton 1,633 10,096 20,634 5,682 Pupils unable to assist schooldue to El Niño
0 7,836 436 1,840
Severely affected population 0 1,106 (2%) 112 (0.1%) 269 (0.8%) Evacuated population 0 2,194 (4%) 87 (0.6%) 206 (0.6%) Total population 9,557 60,060 136,564 34,725
Sources: Tables A.2 and A.3, based on Vos, Velasco and De Labastida (1998) and SIISE
Table 8 Typology of Affected Provinces in the Costa
TYPES
PROVINCES
1 Priority action: affectedpersons and sanitation
infrastructure
2 Priority action: preven-
tive health care
3 Priority action: sanitaryand road infrastructure
El Oro X Esmeraldas X Manabí X Guayas1 (X) X Los Ríos1 (X) X
Source: Vos, Velasco and De Labastida (1998), based on: SIISE (STFS 1998) and Ministry of Public Works (May 1998). Note: 1. Priorities at provincial level biased by situation in main cities. Areas outside main cities fall un-
der Type 1. See text.

18
IV.Impact of El Niño on Health Risks:
Natural Disaster or Failed Health Policies?
El Niño is also a source of increased health risksin the form of increased disease prevalence andinfant mortality rates. Floods and standing waterare sources of malaria as well as other infectiousdiseases. Damages to drinking water and sanita-tion systems increase the risk of contracting diar-rhea, dengue fever and cholera. The agriculturalincome losses leading to increased rural poverty,in turn, result in increased malnutrition, which isan important cause of high infant mortality rates.
The experience with the 1982-3 El Niño con-firmed the association of these factors. This iscompounded by the fact that important parts ofthe affected areas suffer from great deficiencies insanitary infrastructure as well as from inadequatecoverage of immunizations, reduced access tohealth services, and low educational levels.
There is no timely and adequate statistical infor-mation available (as of June 1998) to study thechanges in the epidemiological profile and infantmortality rates resulting from the 1997-8 El Niño.Instead, the methodology applied is that of identi-fying areas of vulnerability to health risks as sug-gested in Section 2. Ex-post testing of this meth-odology to the changes in health conditions due toEl Niño of 1982-3, showed a high degree of con-sistency between areas vulnerable to health risksand the observed deterioration of health condi-tions and prevalence of diseases (Velasco andothers 1998; Vos, Velasco and De Labastida1998). This suggests that preventive health inter-ventions to counteract the effects of El Niño in1997-8 could well have benefited from this ap-proach. We will also argue that interventions in-volving rehabilitation and preventive action fornew occurrences may well be served by thismethodology.
Past experience and existing evidence indicatesthat:
• The El Niño event tends to enhance the inci-dence of malaria and other infectious dis-eases, which are strongly related to poorsanitary conditions. In 1982-3 the number ofcases of malaria increased steeply and it tookmore than a decade to bring the prevalence ofthe disease back to the levels of the early1980s (see Figure 1). In 1997 some 17,000cases were reported and in the first fivemonth of 1998, 5,935 cases were reported,representing a significant increase in the pre-ceding year. Also ‘new’ diseases9 such asleptospirosis, cholera and dengue havespread. The highest concentration of thesediseases was found in areas where sanitationsystems broke down due to El Niño, in par-ticular in the poorer neighborhoods of thecities of Guayaquil, Bahía, Chone andMachala.
• In 1982-3, infant mortality increased substan-tially in the regions hit by El Niño. The infantmortality rate births in the affected provincesincreased from 52 per thousand live beforethe disaster to 65 per thousand afterward(Vos, Velasco and De Labastida 1998). Adrop in the coverage of immunizations in1983 exacerbated the rise in child mortality.Vaccination campaigns in subsequent yearshelped reduce infant mortality.
9 That is diseases that were virtually eradicated before1990.

19
Figure 1: Trends in malaria prevalence, 1965-98(number of cases)
0
10000
20000
30000
40000
50000
60000
70000
80000
1960 1965 1970 1975 1980 1985 1990 1995 2000
Source: Aguilar (1994); Ministry of Health, SNEM.
Num
ber o
f cas
es
El Niño1982-1983
El Niño 1997-8
(projection)
• In November 1997, the Ministry of PublicHealth ordered the implementation of a num-ber of preventive measures. These includedan intensification of the vaccination programin the potentially affected areas and the appli-cation of insecticides to combat malaria. It isprobable that these measures helped to miti-gate some of the potential impact of El Niño.It remains yet to be seen to what extent infantmortality has been affected by these meas-ures. Nevertheless, the general impression isthat preventive action fell short because re-sources were limited and no instruments totarget actions to the more vulnerable popula-tion groups were in place (Velasco et al.1998). Furthermore, over time too little wasdone to improve other critical conditions toprevent the spread of infectious diseases andpremature child deaths, including adequatesanitary conditions, poverty reduction and re-ducing malnutrition.
To identify the population most vulnerable to in-creased health risks, we construct a compositeIndex of Social and Sanitary Conditions (ICSS).The ICSS was constructed applying a principalcomponent analysis to a range of determinantsfound to be strongly associated with the preva-lence of infectious diseases and infant mortality.10
10 Principal component analysis is a method to measuredifferent components of a variable (if they are of differ-ent dimensions) by giving weights to the different com-ponents according to their contribution to the “principalcomponent.” In order to do this, the analyst has tochoose a set of indicators which are considered to bedeterminants of – in this case – health conditions, butwhich because of their interdependence are not suitablefor OLS regression. The first component represents thedimension of maximum variability in the data. This isthe “unobservable index” that we want to construct ofwelfare (or in this case: health vulnerability). The prin-cipal components are new variables created as linearcombinations (weighted sums) of the original variables.The weights are generated as linear combinations of theco-variance structure of the variables and have a finite

20
On the basis of this analysis, the ICSS was com-posed of four variables: access to safe drinkingwater; access to sewerage systems; functional il-literacy among the adult population; and the de-gree of overcrowding in housing. The index has arange of 0 to 100. The higher the index, the betterthe social and sanitary conditions are to withstandthe health risks associated with El Niño. The ICSS was applied to data from the 1982population census and was found to predict withfairly great accuracy which cantons suffered froman increase in infant mortality and the prevalenceof infectious diseases during the 1982-83 El Niño(see Velasco et al. 1998). We then applied theinstrument to the 1990 population census data, themost recent data set to repeat the analysis at thelevel of cantons, in order to obtain the closestpossible identification of health vulnerability toEl Niño of 1997-8. Table A.2 provides the results.It shows that the ten cantons with the highest vul-nerability include Eloy Alfaro, Muisne and SanLorenzo in the province of Esmeraldas, Palenqueand Baba in Los Ríos, Colimes, Pedro Carbo, Pal-estina and Urbina Jado in Guayas, and Flavio Al-faro and Paján in Manabí. The ICSS helps provide a first indication of vul-nerability. The (geographical) targeting of healthinterventions may start with a ranking of munici-palities by their score on the index. To decide onpriority policy actions clearly would require amore complete health sector analysis of the
variance (for each set of weights the sum of the squaresis constrained to be one). Redundancy or interdepend-ence of the indicators is not considered to be a problemin this method. Rather, it is seen as an advantage: theoptimization process links the data subsets and in-creases the number of constraints on the algorithm toconverge to a “true composite measure.” Limitations ofthis approach are of course in the assumptions. Themethod assumes that the main source of variability inthe data is indeed related to differences in welfare di-mensions (i.e. the chosen health factors) and not, forinstance by different preferences and factors other thanthose taken into account. Further, outcomes are sensi-tive to the initial choice and grouping of the data. Wedo not see this as a major problem in this case becausewe begin from a subset of indicators that we believe apriori determine health conditions simultaneously.
causes of mortality and morbidity, and the cost-effectiveness of both preventive and curativehealth interventions. Such diagnoses are hard tocome by in Ecuador. Nevertheless, to take theanalysis one step further, we apply a factor analy-sis to identify the factors that seem most associ-ated with improving (or compensating for) thesocial and sanitary conditions of the population(through the ICSS) including overall economicconditions (proxied by the poverty index), educa-tion, and the availability of health services. Thefactor analysis also considers a number of knownfacts about the consequences of El Niño of 1997-8, including:11
• Direct effects on the population, distin-
guishing: (i) the increase in disease preva-lence (cholera, dengue fever and malaria);(ii) the number of deaths, as well as thewounded and evacuated population; (iii) thechildren that could not attend school due todamages to education infrastructure; (iv)damage to houses; and (v) damage to sanita-tion systems.
• Impact on health services (hospitals andhealth centers): (i) number of health unitsthat suffered damages and (ii) health unitsrequiring additional investment in equip-ment, medication and personnel.
• Damages to road infrastructure: (i) damagesto main roads (in kilometers) and (ii) numberof bridges that have collapsed due to ElNiño.
We use this method to come to a typology of re-quired policy interventions at the provincial andcanton levels. Table 7 lists some of the indicatorsmeasuring the impact of El Niño by province. Ta-ble A.2 gives additional data by municipalities(cantons).
11 We apply a fixed-effects design factor analysis. Thefactor analysis examines the effect of several independ-ent variables (the mentioned indicators of the impact ofEl Niño) on a dependent variable (the ICSS index, i.e.the vulnerability to health risks).

21
At the provincial level we arrive at the followingtypology (Table 8): • Type 1: Impact on Persons and Infrastruc-
ture. Areas (provinces) that require priorityaction to mitigate health impact (preventionof spread of malaria, cholera, dengue andleptospirosis), and restore and constructsanitation infrastructure (health centers, sew-erage and drinking water systems) and roadsand bridges.
• Type 2: Impact on Persons. Priority action isto mitigate the risk of infectious diseases viavaccination programs and other preventivehealth care.
• Type 3: Impact on Infrastructure. Areasthat require priority action to rehabilitatesanitary infrastructure and roads.
To target interventions at the municipal level, wecombine the factors determining the degree ofvulnerability to health risks and the degree ofdamages to health infrastructure. This methodol-ogy leads to four types of cantons (see Tables 9and A.3): • Type A: Low Vulnerability and Low Impact.
These cantons show relatively good socio-economic conditions and access to healthservices. Moreover, the measured impact of
El Niño has been small, requiring low prior-ity in policy action. Example: MarcelinoMaridueña in the province of Guayas.
• Type B: Moderate Vulnerability, but Rela-tively Strong Impact from El Niño (in termsof damaged housing, size of evacuatedpopulation, and increased prevalence of in-fectious diseases). Temporary support to re-establish homes, etc. in these cantons may bea relatively high priority, but investments insanitary infrastructure may be a lower prior-ity. Example: Santa Rosa in El Oro.
• Type C: High Vulnerability, but ModerateImpact of El Niño. Emphasis in these casesshould be on medium-run investment insanitary infrastructure and improvement insocioeconomic conditions in general. Exam-ple: Chone in Manabí.
• Type D: High Vulnerability and Strong Im-pact from El Niño. These are the poorest ar-eas that also suffered the heaviest impactfrom El Niño, requiring both short-termemergency assistance and substantial invest-ment in preventive and curative health to re-duce vulnerability to health risks. Example:Baba in Los Ríos.
Table 7 Situation Variables that Form Part of Typology by Provinces
PROVINCIAS EL ORO ESMERALDAS GUAYAS MANABI LOS RIOS Affected health centers 7 6 17 8 6 Damaged and destroyedhouses
2,305 1,125 1,623 4,337 805
Cases of malaria 298 1,578 2,077 160 95 Cases of cholera 44 170 1 26 0 Cases of dengue fever 205 713 77 1,049 110 Affected sanitation systems 3 2 3 3 1 Damaged roads and bridges 5 16 19 14 7 Source: Vos, Velasco and De Labastida (1998), based on: SIISE (STFS 1998) and Ministry of Public Works (May 1998).

22
Table 9 Typology of Cantons (Municipalities) Affected by El Niño. Case Studies.
TYPE
Canton (Province)
A Marcelino Maridueña (Guayas)
B Santa Rosa
(El Oro)
C Chone
(Manabí)
D Baba
(Los Ríos)
Poverty incidence (%) 23% 41% 60% 75% Functional illiteracy (% ofpopulation > 15 years)
15% 18% 35% 46%
Medical personnel (x 10.000inhabitants)
64 21.6 17 9.5
Deaths due to El Niño 1 25 7 3 Wounded due to El Niño 0 38 - 0 Damaged and destroyed houses 16 (1%) 1,838 (18%) 292 (1%) 60 (1%) Total dwellings in canton 1,633 10,096 20,634 5,682 Pupils unable to assist schooldue to El Niño
0 7,836 436 1,840
Severely affected population 0 1,106 (2%) 112 (0.1%) 269 (0.8%) Evacuated population 0 2,194 (4%) 87 (0.6%) 206 (0.6%) Total population 9,557 60,060 136,564 34,725
Sources: Tables A.2 and A.3, based on Vos, Velasco and De Labastida (1998) and SIISE (STFS 1998) and Defensa Civil (May 1998).
Table 8 Typology of Affected Provinces in the Costa
TYPES
PROVINCES
1 Priority action: affectedpersons and sanitation
infrastructure
2 Priority action: preven-
tive health care
3 Priority action: sanitaryand road infrastructure
El Oro X Esmeraldas X Manabí X Guayas1 (X) X Los Ríos1 (X) X
Source: Vos, Velasco and De Labastida (1998), based on: SIISE (STFS 1998) and Ministry of Public Works (May 1998). Note: 1. Priorities at provincial level biased by situation in main cities. Areas outside main cities fall un-
der Type 1. See text.

23
Priority action are interpreted in two ways: First,short run emergency assistance to mitigate ElNiño’s impact through health assistance and re-pairs to infrastructure; and second, medium runactions should have improved the coverage andquality of preventive and curative health infra-structure to help reduce the vulnerability of healthrisks and provide better protection against ElNiño in the future and improve health conditionsin general. Analysis leads us to conclude that: • Esmeraldas and Manabí are the most affected
provinces. Measures are needed to improvethe sanitation infrastructure, repair healthcenters, and rehabilitate roads and bridges.Most cantons in these provinces show highvulnerability and high impact of El Niño (typeD). On average, Esmeraldas shows the high-est vulnerability to health risks (poorest socialand sanitary conditions), but Manabí suffereda much larger impact of El Niño as measuredby the prevalence of infectious diseases,deaths, and evacuees. While emergency as-sistance and sanitation infrastructure are re-quired in both provinces, Manabí would ini-tially require more emphasis on the formerand Esmeraldas on the latter.
• Los Ríos and Guayas suffered heavy damagesto sanitary and road infrastructure, hence thepolicy priority is Type 3 (see Table 8). How-ever, this outcome is biased due to the situa-tion in the larger cities (Guayaquil, Durán,Salinas, Milagro, Babahoyo, and Quevedo).Most other municipalities in these two prov-inces show high vulnerability to health risksand have been substantially affected by ElNiño (Type D; Table A.3), hence Type 1 in-terventions should be emphasized there.
• Social and sanitary conditions in El Oro arerelatively better, but there was some increasein malaria, dengue, and cholera in 1998. Inthis case, priority should be given to preven-tive health care (Type 2). However, in somecantons a broader range of interventions(Type 1) is needed (such as in Guabo; see Ta-ble A.2).
The Ministry of Public Health established a con-tingency action plan in anticipation of the 1997-98 El Niño and authorized a budget for it fromunused project funds (to a total of US$8 million).However, preventive health policies prior andduring El Niño of 1998 were not targeted as de-scribed above. Most of the budget could be used(88% by May 1998) on the repair of damagedhealth centers and sanitation systems, as well asfor the purchase and distribution of medicines inthe affected areas, for health education cam-paigns, and to combat the outbreak of malaria. Asindicated, prior to the contingency plan the Min-istry had already launched an immunization cam-paign for children under five years of age, andalso provided health centers with additional sup-plies of medicines to cure infectious diseases(MSP 1997). Resources to prevent the outbreakand to combat malaria proved insufficient, how-ever (Velasco et al. 1998). By the end of El Niño,the Ministry had shifted emphasis to the rehabili-tation of damaged drinking water systems as apreventive measure to contain parasitic diseases.
Despite these efforts, they were generally in reac-tion to the threats posed by El Niño and mighthave been more effective if more had beenlearned from the experience of 1982-3. Preventivemeasures, such as investment in flood-resistantsanitation systems and ongoing vaccination cam-paigns in the vulnerable areas were not imple-mented beyond some isolated cases. One suchexception is Babahoyo in Los Ríos where an im-proved sanitation system and related infrastruc-ture were built with external funding followingthe El Niño of 1982-83. The project took sevenyears to complete and cost US$300 per benefici-ary. The result was no more flooding during thenormal rainy seasons, nor during the El Niñoevent of 1997-8. The prevalence of infectiousdiseases also declined markedly. However, therefew other positive examples of this sort to buildon. In preparing for future episodes of El Niño,the Ministry of Public Health could greatly im-prove its response if it uses a systematic method-ology of vulnerability to health risks which couldserve as a tool for an early warning system, andalso as a way to set priorities for preventive andcurative action.

24
V.Action for Emergency Relief and Reconstruction
The 1997-8 El Niño disaster did not take theauthorities by surprise. The Ecuadorian authori-ties declared a state of emergency on July 2, 1997and formulated a contingency plan prior to theevent. In November 1997, when El Niño first be-gan to be felt, a total budget of US$333 millionhad been put together for emergency relief, pre-ventive action, and humanitarian aid (Table 10).The World Bank, the IDB, and the CAF providedmost of the funding (US$208 million) in the formof loans. The contingency plan proved useful inpreparing the population for the event. In October1997, a special unit (COPEFEN) was created toimplement the contingency plan and coordinateprevention, emergency relief, and repairs to beundertaken by a wide range of public entities.
Despite these preparations, a main conclusion ofthis study is that the authorities could have takenspecific preventative steps to mitigate the impactof the disaster, especially for the more vulnerablegroups of the population. This is apparent fromthe following:
• The Defensa Civil was prepared to provideemergency humanitarian aid, but was unableto establish effective coordination with localgovernments and communities. In effect, inthe course of events the Army had to becalled in to overcome problems of transporta-tion and logistics.
• The COPEFEN was initially not as effective
Table 10Available Financing for Emergency Aid and Rehabilitation
(August 1998)(Millions of US$)
Total amountGovernment Resources Funds reserved by central government (569 rehabilitation projects) Emergency military assistance Counterpart funds for foreign loans
67.2 41.0 5.2 21.0
International Humanitarian Aid Humanitarian aid of governments and government agencies Humanitarian aid of NGOs and private donations Cooperation of international organizations Transport costs for international humanitarian aid
35.8 23.4 9.5 0.8 2.1
Foreign Loans for El Niño World Bank (reallocation of existing social sector loans) World Bank (new loans) Inter-American Development Bank (reallocation of existing social sectorloans) Inter-American Development Bank (new loans) Corporación Andina de Fomento (CAF) United States (PL 480 for reactivation of agriculture)
215.0 20.0 60.0 34.2 70.8 25.0 5.0
Total 318.0 Source: CEPAL (1998: p. 14); COPEFEN (1998).

25
as it should have been. Its director was ac-cused of fraud in February 1998 and was re-placed. Over 90% of the government budgetfor emergency aid (US$41 million) was trans-ferred to provincial authorities, but only 55%could be justified with proper accounting(COPEFEN 1998: 3).
• It was not until April 1998 that COPEFENmanaged to improve its operative capacityand was placed under the political responsi-bility of the Vice-President of the Republic.The World Bank and the IDB conditionedtheir funding on the establishment of a Tech-nical Committee with representatives of pro-vincial authorities and a committee withbroader participation from civil society. InAugust 1998, COPEFEN reported that the in-puts of the Provincial Technical Committeehave been of little to plan activities and allo-cate resources, while the civil society com-mittee was never formed (COPEFEN 1998:8).
• The Contingency Plan identified 105 contonsthat would be potentially affected with a totalpopulation of 6.5 million, which representsmore than half of the Ecuadorian population
(see Table 2). These cantons were classifiedby climatic risk (Table 1), but this classifica-tion was not appropriate for targeting preven-tion and rehabilitation measures. The authori-ties did not have the methodologies as pro-posed here to distinguish between types ofrisk and vulnerability of different areas andpopulation groups that could target action toprevention and post-disaster support in health,improvement of sanitary infrastructure, andcoverage of agricultural production losses.
The allocation of resources by COPEFEN isguided by (i) ECLAC (1998) estimates of dam-ages by sector and (ii) advice from the ProvincialTechnical Committee (COPEFEN 1998). Onemay have doubts about the effectiveness of theprocess. The ECLAC report seems to overesti-mate the economic damages, but more important,only specifies costs by sector. It does not providea basis to differentiate risks and needs by popula-tion groups. Hence the report may prove to be apoor guide for targeting actions to vulnerablepopulation groups and areas. Furthermore,COPEFEN itself is doubtful about the functioningof the Provincial Technical Committee(COPEFEN 1998).
VI.

26
Conclusions and Policy Recommendations
El Niño of 1997-98 has caused substantial dam-age in Ecuador and took the lives of at least 286persons. The most affected population groupswere the poorer self-employed farmers and agri-cultural workers who suffered production andemployment losses. We estimate that poverty inthe affected rural areas may have increased by asmuch as ten percentage points in 1998. In the so-cial area, increased health risks are the most im-portant danger presented by El Niño. Contagiousdiseases such as malaria, cholera, and dengue in-creased. No information was available to measuredirect health impacts in 1998, but based on riskfactors we estimate that some 2.5 million Ecua-dorians in the coastal regions are most vulnerableto diseases and worsening health conditionscaused by El Niño.
The population most vulnerable to the effects ofEl Niño typically has lower initial incomes, lowereducational levels, and less access to economicand social infrastructure. Their vulnerability isincreased by the poor quality of available infra-structure. In this sense, the consequences of ElNiño are a problem of development rather than anobstacle to development.
How can one respond to natural disasters like ElNiño? What objectives should be pursued in dis-aster relief actions? During and immediately afterthe disaster there is the need for emergency actionto save lives, evacuate people from flooded areas,and provide them with shelter and food, as well ashealth interventions to prevent outbreaks of epi-demics. After the event, what can and should bedone to compensate those who suffered most andwhat type of preventive action should be taken?Despite the uncertainty surrounding when andwhere El Niño will strike and how much damageit will cause, it remains a recurring event.
How can one compensate for losses and what typeof preventive action can be used? These policyquestions refer to the methodological issuesraised in Section 2 regarding how to assess the
costs of a natural disaster, and will have to beframed with a clear view of the objectives to beachieved. Finally, given the recurring nature of ElNiño, the question of insurance schemes to pro-tect families and workers in the future is alsorelevant.
Insurance and financial markets in Ecuador areunderdeveloped and imperfect. Only a fraction ofthe population has auto or home insurance poli-cies, while income risk insurance is nonexistent.In addition, the risks of natural disasters are diffi-cult to insure as experience with insurance fordamages resulting from hurricanes in the Carib-bean and U.S. states like Florida proves. Moreo-ver, the U.S. experience shows that even whensome kind of insurance exists, the pressure ongovernments to declare a state of emergency isheavy and insurance companies are able passcosts on to taxpayers. In sum, it is difficult tovisualize a private insurance scheme which wouldprovide protection to the rural poor in Ecuador’svulnerable coastal areas.
The more pressing strategic policy question iswhether to concentrate on disaster relief (beyondemergency assistance) or development invest-ment. How much should be spent on repair andrehabilitation (of roads, houses and agriculturallands) to restore disaster areas to their state priorto the disaster? Should the focus be on recon-struction investment to reduce the vulnerability tonatural disasters and enhance development ingeneral? In the latter case, relocation of residentsout of vulnerable areas and shifts in economicactivities to less vulnerable options should beconsidered. Time and cost enter into considera-tion in this case because development investmenttakes time and resources may be limited to meetstructural needs in all affected areas.
The policy approach suggested here considerscompensatory relief and developmental invest-ment, but emphasizes the latter. The policy rec-ommendations fall in three main areas: targeting

27
and monitoring instruments, agriculture and ruraldevelopment, and health.12
Targeting and Monitoring Instuments
Policy actions should be targeted to the more vul-nerable and most affected population groups. Acomparison of the 1982-3 and 1997-8 experiencesshows that, with a few exceptions, El Niño, tendsto affect the same geographical areas every timeand that in addition to damages to infrastructure,living conditions are affected by agricultural in-come losses and increased health risks. For tar-geting, the methodologies applied in this study toidentify vulnerable agricultural zones, and to clas-sify the population by social and sanitary risks tohealth may provide useful starting points, to de-velop more effective contingency plans for futureevents, and to target investments in response tothe 1997-8 event. Agriculture and Rural Development in the Affected Areas
A possible first option is the implementation of anincome transfer program to compensate poorfarmers and agricultural workers for productionand employment losses. However, this raises twoquestions: What should be the size of the trans-fer? And, is this still an optimal policy after theevent? To start with the first question, if compen-sated for the foregone earnings as estimated inthis study, a perfectly targeted transfer schemewould require total funding of US$130 million.However, as shown, over 70% of the populationin the affected areas was poor prior to the El Niñoand would remain poor after the transfer. Duringthe event, as a means of immediate assistance, itcould have made sense to target food aid or directincome transfers to the most vulnerable popula-tion using the methodology proposed in Section 3.This could be considered for a future event and isnot a meaningful choice long after El Niño.13 If,
12 See Vos, Velasco and De Labastida (1998) for addi-tional details.13 The Ecuadorian government permitted increases inimports of basic food items such as rice and sugar. This
however, this option is implemented, it shouldtypically be of a short-term nature and last untilagricultural production and rural employmenthave returned to normal levels. In the currentsituation, available resources might be better usedfor targeted interventions to assist the affectedrural population through increased income earn-ing opportunities and improved infrastructure.One option could be a self-targeted employmentprogram.
After the event it seems to make sense to focus inthe short run on the reactivation of agriculturalproduction for the following four reasons. First,most agricultural production in the vulnerableareas is viable, albeit in need of improvements inproductivity and rural infrastructure. Second, therelocation of some farmers to less vulnerable ar-eas seems necessary in a few specific areas (inparticular, in the delta of the Guayas River), but isnot a viable option for the larger affected popula-tion as the land frontier in Ecuador has beenreached. Third, much of the lost employment willbe regained as soon as agricultural production isrehabilitated. In the present context, possiblefunds for an income transfer scheme might bebest used to provide affected small-scale farmerswith affordable credits to restore their land andprepare for a new harvest. The credit may containa subsidy to compensate for the income losses(foregone savings) in the period of lost harvestdue to El Niño. Fourth, employment is likely toincrease in the short run as repair work on dam-aged rural infrastructure (rural roads, bridges, ir-rigation systems) gets underway.
Medium-term measures should also focus on im-proving rural infrastructure and credit for small-scale farmers. Improvements to rural infrastruc-ture would involve continuing and finalizing in-vestment projects to improve water control andirrigation in the areas vulnerable to flooding, inparticular the delta of the Guayas River. Manysuch projects were begun in the early 1980s, but
helped to contain food inflation and limited the spill-over effects of El Niño on the incomes of the urbanpopulation, but was untargeted and hence did little toassist the affected rural poor.

28
were subsequently halted. The network of tertiaryroads should be improved in the affected areasand made accessible for year-round transporta-tion. Other medium-term, preventive action inrural areas should aim at improving agriculturalproductivity and employment opportunities, andinclude technical assistance to promote a greaterdiversification of production to crops with a shortcycle and higher profitability (such as soya,mango and others). Improvements are also neededto distribution networks, storage systems andpackaging. All these measures can be expected tocontribute to reducing the vulnerability to pro-duction losses due to disasters such as El Niño,but also to those normally incurred during theregular rainy season.
Rural poverty is closely associated with the une-qual distribution of land (World Bank 1996 andJácome, Larrea and Vos 1998). Thus, if the policyobjective is to simultaneously reduce the vulner-ability to weather shocks and raise overall livingconditions in the rural areas of Ecuador’s Costaregion, then land reform policies should be con-sidered as a part of the medium-term measures. Health Policies In the health sector, immediate action is requiredto eradicate malaria, cholera and dengue fever.14
Critical for preventive action to reduce healthvulnerability is the improvement of sanitary infra-structure resistant to the types of problems posedduring the regular rainy season and exacerbatedduring episodes of El Niño. The ICSS may serveas a guide to target investments in sanitary infra-structure. With reference to a successful project inBabahoyo, the unit cost of such a durable solutioncould be in the order of a magnitude of US$300per beneficiary. A rough estimate for the severelyvulnerable population in the provinces of theCosta would imply a total required budget ofUS$750 million, that is, 0.5% of GDP if spread
14 The Ministry of Health did start a promising andnovel anti-malaria campaign in the post-El Niño period.Once re-emerged, the prevalence of malaria can stayhigh for years after. The new campaign involves secon-dary school students who are trained to act as healthagents to detect, prevent and monitor malaria cases.
out over a period of seven years. Further cost-effectiveness analysis of this option may beneeded before projecting it to the entire popula-tion, but the indications are that this could be inthe range of feasible policy solutions. These in-vestments in sanitary infrastructure should besupplemented by a permanent campaign of immu-nizations aiming at 100% coverage.
The findings and policy recommendations in thisstudy depend, to a considerable extent, on ananalysis of the probability of an El Niño impactthrough the study of risk factors and the identifi-cation of vulnerable areas and population groups.Ecuador needs more adequate and timely moni-toring systems to capture the actual impact onincomes and health status during and shortly afterthe main effects of the disaster have disappeared.A complete evaluation of the full impact of thedisaster has yet to be made. It is important thatthis evaluation be done. The main study of theeffects of the 1982-83 El Niño of was a report byCEPAL (1983), which was produced in February1983 when the natural phenomenon was still infull effect. No serious ex-post evaluation was un-dertaken and the country probably will again beill-prepared for the next El Niño if this study isnot taken this time around.
Such a study could also test the adequacy of thevulnerability analysis presented here as a tool forpreventive action in the face of expected newnatural disasters. More importantly, it may serveas a guide for setting priorities and targeting de-velopment policies in agriculture, health and in-frastructure in Ecuador’s vulnerable coastal re-gion.

29
Table A.1:Affected Cantons (Municipalities) Most Vulnerable to Agricultural Income Losses
(Ranking by Level of Poverty Incidence)Province Canton Poverty
before ElNiño
Total ruralpopulation
Poor ruralpopulation
No. of Agri-cultural
zones
Main crops (by share ofcultivated area)
Main affected socio-economic group
MANABI Bolívar 80.4% 29,445 23,685 24 Cocoa (32%), Coffee (14%) Farmer-owner
LOS RIOS Vinces 80.3% 42,472 34,125 32 Rice (17%), Corn (5%) Farmer-owner
ESMERALDAS Quinindé 79.6% 65,793 52,362 28 Corn (43,2%), Banana(14,5%)
Farmer-owner, Agri-cultural worker
LOS RIOS Palenque 79.4% 21,099 16,751 32 Rice, Corn (22%) Farmer-owner
MANABI Chone 78.4% 85,830 67,311 7,27 Rice (46%), Cotton (43%) Farmer-owner
MANABI Santa Ana 78.2% 49,838 38,972 20 Corn (62%), Cotton (19%) Farmer-owner
ESMERALDAS Esmeraldas 77.7% 51,585 40,095 25 Corn (52%) Farmer-owner
MANABI Jipijapa 77.6% 41,709 32,378 21 Corn (60%), Peanuts (15%) Farmer-owner
CAÑAR La Trocal 77.0% 11,346 8,733 1 Rice (49%), Livestock (20%) Farmer-owner
GUAYAS Palestina 76.6% 6,804 5,213 6 Rice (65%), Livestock (22%) Farmer-owner
LOS RIOS Quevedo 76.6% 64,932 49,736 29 Coffee, Cocoa (35%), Corn,Soya, Rice
Farmer-owner
MANABI Tosagua 76.2% 28,182 21,469 23 Livestock (30%), Corn (17%) Farmer-owner
MANABI Sucre 76.2% 43,631 33,227 7 Rice (46%), Cotton (43%) Farmer-owner
MANABI Rocafuerte 76.0% 19,867 15,100 18 Rice (31%), Corn (22%) Farmer-owner
GUAYAS Samboron-dón
75.8% 19,077 14,451 8 Rice (16%), Other (84%) Farmer-owner
GUAYAS Urbina Jado 75.6% 42,338 32,008 9 Rice (44%), Other (56%) Farmer-owner
MANABI 24 de Mayo 75.5% 39,354 29,732 21 Corn (60%), Peanuts (15%) Farmer-owner
LOS RIOS Ventanas 74.8% 40,801 30,530 30 Cocoa (25%), Coffee (18%) Farmer-owner
LOS RIOS Baba 74.7% 34,011 25,403 33 Rice, Corn (70%), Sugar cane(10%)
Farmer-owner, Agri-cultural worker
LOS RIOS Babahoyo 74.7% 56,372 42,104 33 Rice, Corn (70%), Sugar cane(10%)
Farmer-owner, Agri-cultural worker
MANABI Junín 72.7% 20,809 15,131 7 Rice (46%), Cotton (43%) Farmer-owner
ESMERALDAS Eloy Alfaro 72.3% 29,365 21,239 26 Cocoa (18%), Livestock (10%) Farmer-owner, Agri-cultural worker
GUAYAS AlfredoBaquerizo
72.2% 11,883 8,576 33 Rice, Corn (70%), Sugar cane(10%)
Farmer-owner, Agri-cultural worker
ESMERALDAS Muisne 70.0% 26,066 18,258 27 Banana (14,5%), Coffee(14,9%)
Agricultural worker,Farmer-owner
GUAYAS Naranjito 69.0% 7,558 5,217 3/4 Sugar cane (85%) Agricultural worker
EL ORO Arenillas 68.1% 7,782 5,296 14 Livestock (60%) Agricultural worker
MANABI Portoviejo 67.0% 72,425 48,556 7 Rice (46%), Cotton (43%) Farmer-owner
GUAYAS Durán 66.5% 3,281 2,183 1 y 5 Rice, Banana Farmer-owner, Agri-cultural worker
GUAYAS Santa Lucía 66.3% 24,071 15,966 6 Rice (65%), Livestock (22%) Farmer-owner, Agri-cultural worker
GUAYAS El Triunfo 65.0% 9,222 5,995 3/4 Sugar cane (85%) Agricultural worker
LOS RIOS Puebloviejo 65.0% 26,211 17,024 32 Rice, Corn Farmer-owner
GUAYAS Yaguachi 64.3% 26,692 17,165 10 Rice Farmer-owner
GUAYAS Naranjal 61.6% 27,143 16,724 1 y 5 Rice, Banana Farmer-owner, Agri-cultural worker
EL ORO El Guabo 61.5% 19,610 12,063 11/12/13 Banana (60%), Coffee, Cocoa(20%)
Agricultural worker,Farmer-owner
EL ORO Pasaje 58.9% 19,150 11,289 11/12/13 Banana (60%), Coffee, Cocoa(20%)
Agricultural worker,Farmer-owner

30
Province Canton Povertybefore El
Niño
Total ruralpopulation
Poor ruralpopulation
No. of Agri-cultural
zones
Main crops (by share ofcultivated area)
Main affected socio-economic group
GUAYAS Milagro 58.1% 26,324 15,284 2 Sugar cane (27%), Banana(15%)
Agricultural worker
EL ORO Santa Rosa 53.2% 16,739 8,907 14 Livestock (60%) Agricultural worker
EL ORO Machala 49.6% 15,510 7,687 11/12/13 Banana (60%), Coffee, Cocoa(20%)
Agricultural worker,Farmer-owner
EL ORO Huaquillas 29.8% 201 60 16 Livestock (60%) Agricultural worker
Total (listed) affected cantons 73.1% 1,184,526 866,006
Source: SIISE; Ministry of Agriculture (MAG); own fieldwork.

31
Table A.2Vulnerability to Health Risks - Affected Cantons in the Costa1
Province Canton Ranking byICSS
ICSS Functionalilliteracy rate
(%)
Populationwith accessto drinkingwater (%)
Populationwith accessto sewerage
(%)
Populationnot affected
by over-crowded
housing (%)
Prevalence ofchronic malnu-
trition (%)
Popula-tion1990
Population1997
ESMERALDAS Eloy Alfaro 1 19.3 53.0% 6.5% 2.2% 68.7% 45.2 2,736 29,365GUAYAS Colimes 2 25.2 49.0% 8.9% 2.3% 66.4% 44.0 13,475 22,244LOS RIOS Palenque 3 25.5 52.6% 6.3% 4.0% 69.4% 43.5 13,117 21,099ESMERALDAS Muisne 4 25.6 51.2% 12.3% 10.0% 67.8% 45.5 3,086 26,066LOS RIOS Baba 5 26.5 46.2% 7.1% 4.3% 72.8% 42.9 8,761 34,011GUAYAS Pedro Carbo 6 27.8 45.5% 0.7% 0.4% 59.5% 44.8 16,075 36,581GUAYAS Palestina 7 29.7 47.1% 14.0% 5.7% 64.8% 43.9 5,610 12,943GUAYAS Urbina Jado 8 29.9 38.2% 7.0% 0.9% 64.9% 42.5 13,166 50,673MANABI Flavio Alfaro 9 30.7 44.4% 10.3% 1.6% 86.5% 42.9 17,509 27,311ESMERALDAS San Lorenzo 10 32.3 44.7% 16.8% 15.6% 69.3% 44.0 6,136 26,083MANABI Paján 11 32.4 50.4% 9.8% 7.5% 65.1% 43.8 7,815 49,093EL ORO Las Ladies 12 32.6 29.9% 8.1% 5.5% 73.4% 43.0 1,106 5,628EL ORO Chill 13 33.2 40.3% 12.2% 12.0% 84.7% 42.9 1,420 3,200ESMERALDAS Quinindé 14 33.5 43.0% 13.8% 14.3% 72.0% 42.6 15,026 87,360GUAYAS Santa Lucía 15 34.0 44.6% 11.4% 2.8% 61.4% 43.3 18,853 31,624LOS RIOS Montalvo 16 37.0 34.1% 4.1% 0.7% 83.0% 40.2 10,113 22,002MANABI Pichincha 17 38.3 50.5% 7.9% 3.0% 75.7% 44.1 8,861 33,341GUAYAS Santa Elena 18 38.4 27.0% 5.5% 1.8% 68.0% 41.4 15,799 97,165GUAYAS Daule 19 39.8 37.0% 20.3% 8.9% 67.3% 41.8 13,915 82,231LOS RIOS Vinces 20 40.3 36.9% 18.8% 17.0% 71.8% 40.3 18,616 62,727GUAYAS Balao 21 40.5 35.4% 22.3% 5.0% 73.7% 43.3 6,460 14,474GUAYAS El Triunfo 22 42.3 30.0% 1.7% 2.1% 75.8% 41.5 13,759 29,243GUAYAS Balzar 23 44.0 42.6% 23.4% 22.8% 67.9% 42.2 22,572 52,145GUAYAS El Empalme 24 44.1 37.7% 17.6% 7.1% 77.4% 42.0 19,759 46,226GUAYAS Playas 25 44.3 25.6% 3.0% 1.9% 78.5% 41.0 13,925 24,855MANABI Junín 26 45.2 38.5% 13.9% 11.2% 89.0% 40.4 11,917 20,809GUAYAS Samborondón 27 45.6 32.3% 30.9% 18.9% 74.7% 39.8 15,623 39,284MANABI Sucre 28 45.7 41.2% 16.9% 10.7% 79.5% 41.9 11,404 87,162LOS RIOS Puebloviejo 29 46.6 39.0% 21.7% 9.4% 72.1% 41.4 6,693 26,211GUAYAS Salinas 30 46.7 21.0% 2.1% 1.6% 75.5% 40.1 38,389 37,513GUAYAS Alfredo Baquerizo 31 46.7 38.1% 19.3% 7.7% 75.4% 40.8 9,469 18,798MANABI Montecristi 32 47.4 41.9% 19.6% 7.5% 73.2% 42.8 14,793 43,557MANABI Jipijapa 33 48.5 39.6% 22.3% 17.5% 68.9% 41.3 16,811 80,010MANABI Santa Ana 34 48.9 48.7% 9.3% 1.5% 82.0% 43.1 9,612 57,203MANABI Tosagua 35 49.2 38.4% 17.1% 2.3% 77.3% 40.7 10,752 36,754MANABI 24 de Mayo 36 49.8 49.4% 8.2% 1.8% 81.0% 43.4 9,605 39,354LOS RIOS Babahoyo 37 49.9 28.3% 23.4% 23.9% 76.9% 37.0 29,887 121,987MANABI El Carmen 38 50.0 36.0% 22.1% 6.6% 83.8% 41.0 22,469 62,537MANABI Rocafuerte 39 50.5 32.5% 14.6% 5.0% 80.1% 38.5 15,826 30,096LOS RIOS Urdaneta 40 50.5 37.6% 24.4% 22.3% 78.7% 40.9 13,493 27,132LOS RIOS Ventanas 41 52.1 33.2% 21.5% 17.7% 75.4% 41.1 17,326 67,654

32
Province Canton Ranking byICSS
ICSS Functionalilliteracy rate
(%)
Populationwith accessto drinkingwater (%)
Populationwith accessto sewerage
(%)
Populationnot affected
by over-crowded
housing (%)
Prevalence ofchronic malnu-
trition (%)
Popula-tion1990
Population1997
GUAYAS Naranjal 42 52.8 32.3% 30.0% 22.2% 75.7% 41.2 8,680 45,646GUAYAS Yaguachi 43 52.9 29.2% 29.0% 19.2% 80.0% 40.0 9,878 45,481LOS RIOS Quevedo 44 54.1 30.7% 25.6% 17.8% 79.5% 39.4 53,809 195,809MANABI Chone 45 54.8 36.1% 31.4% 22.4% 84.6% 38.7 22,643 133,755ESMERALDAS Esmeraldas 46 54.9 26.9% 28.5% 32.0% 75.9% 38.0 58,801 200,634EL ORO El Guabo 47 55.8 23.7% 27.5% 16.6% 76.6% 40.6 7,433 32,452EL ORO Zaruma 48 56.2 28.0% 37.9% 35.9% 85.0% 38.1 4,154 27,410GUAYAS Naranjito 49 57.7 31.1% 29.8% 20.8% 81.8% 40.8 13,393 27,360MANABI Bolívar 50 57.8 38.4% 22.9% 20.1% 84.7% 40.2 13,194 43,465EL ORO Arenillas 51 59.8 20.6% 34.1% 35.4% 78.9% 38.0 7,687 21,182EL ORO Piñas 52 61.1 22.6% 42.6% 40.1% 90.4% 35.5 5,856 25,263EL ORO Marcabelí 53 62.1 24.5% 43.2% 32.2% 83.7% 39.9 2,191 5,655EL ORO Atahualpa 54 63.6 21.0% 37.1% 27.0% 94.8% 38.4 1,142 7,095EL ORO Portovelo 55 63.9 21.1% 39.4% 48.9% 85.5% 37.1 3,751 11,863EL ORO Balsas 56 65.1 18.7% 43.6% 40.1% 83.6% 37.4 2,040 4,703EL ORO Huaquillas 57 69.5 18.9% 41.0% 7.8% 78.7% 39.1 26,944 32,160GUAYAS Durán 58 71.0 14.6% 34.1% 41.8% 84.0% 32.3 79,711 98,537EL ORO Santa Rosa 59 71.4 18.3% 46.4% 53.0% 80.8% 36.1 22,463 58,824GUAYAS Milagro 60 72.2 20.7% 47.7% 27.7% 83.5% 35.8 72,807 134,624MANABI Portoviejo 61 73.0 25.1% 49.4% 45.1% 84.2% 34.2 91,715 233,761EL ORO Pasaje 62 73.3 19.4% 50.2% 46.0% 82.5% 36.0 22,256 59,456EL ORO Machala 63 75.2 12.8% 38.8% 50.8% 82.4% 33.8 132,474 182,287MANABI Manta 64 76.0 25.4% 55.7% 49.4% 83.6% 36.1 118,802 153,614GUAYAS Guayaquil 65 79.4 11.9% 46.4% 53.3% 81.3% 2.2 1,449,306 1,816,307Source: Vos, Velasco and De Labastida (1998) based on Secretaría Técnica del Frente Social, SIISE (1998); INEC, Population Census 1982, 1990.Note: 1. Only includes cantons established in1990 or earlier. New cantons created after 1990 are excluded for lack of complete data.

33
Table A.3Typology of 105 (Potentially) Affected Cantons Classified by Priority Type of Intervention
Province Canton 1997population(projection)
Povertyincidence
Illiteracyrate
Medicalpersonnel(x 10,000)
Deaths dueto El Niño
Woundeddue to El
Niño
Damagedhouses (%
of total)
No. ofaffectedfamilies
No. ofaffectedpersons
Evacuatedpopulation(% of total)
Severelyaffected
population(% total)
Pupils notassisting
schools dueto El Niño
Type (pol-icy prior-
ity)
EL ORO Machala 186,115 29.9% 12.8% 51.3 0 0 0.1% 116 531 0.1% 0.0% 4625 BArenillas 21,627 50.9% 20.4% 19.4 0 0 1.6% 58 326 1.6% 0.0% 2252 AAtahualpa 7,244 42.8% 21.0% 12.4 1 0 0.0% 0 0 0.0% 0.0% 0 AEl Guabo 33,133 53.7% 23.5% 7.8 0 0 1.8% 87 440 0.5% 0.1% 0 DHuaquillas 32,836 38.9% 18.8% 5.8 2 0 5.0% 260 1160 5.8% 0.1% 7965 BPasaje 60,704 38.3% 19.2% 14.8 1 0 0.0% 1 5 0.3% 0.0% 610 APortovelo 12,112 37.3% 20.6% 16.5 0 0 0.1% 0 0 0.0% 0.0% 0 ASanta Rosa 60,060 40.9% 18.0% 21.6 3 0 18.2% 914 3069 4.4% 1.8% 7836 B
ESMERALDAS Esmeraldas 185,908 46.3% 24.9% 24.5 25 38 2.6% 629 1095 1.2% 1.1% 8565 AEloy Alfaro 29,981 72.3% 52.7% 19.0 0 0 0.0% 0 0 0.0% 0.0% 0 DMuisne 26,614 70.0% 51.2% 12.4 2 0 2.8% 101 510 0.0% 0.3% 0 DQuinindé 89,194 72.1% 40.8% 10.0 0 0 1.5% 10 60 0.3% 0.4% 2041 DSan Lorenzo 26,631 64.6% 44.2% 23.7 0 2 0.1% 0 0 0.0% 0.1% 0 DAtacames 18,939 69.5% 37.5% 7.9 0 0 0.0% 1 6 0.0% 0.0% 0 D
GUAYAS Guayaquil 1,854,450 51.6% 11.8% 45.8 18 5 0.2% 712 2704 0.1% 0.1% 2621 AAlfredoBaquerizoMoreno
19,193 62.9% 37.7% 3.1 0 0 1.6% 21 106 0.0% 0.0% 0 A
Colimes 22,711 72.1% 48.7% 1.3 1 0 0.3% 315 50 0.0% 0.0% 0 DDaule 83,958 59.0% 36.2% 10.5 3 0 0.0% 2 10 0.0% 0.0% 0 DDurán 100,606 24.4% 14.6% 13.0 2 3 0.1% 307 38 0.0% 0.1% 0 AEl Empalme 47,196 58.1% 35.0% 12.5 0 0 1.1% 50 190 0.1% 0.0% 0 DEl Triunfo 29,857 54.4% 30.0% 9.0 2 0 3.3% 208 646 0.5% 0.1% 0 DMilagro 137,451 34.5% 20.3% 22.5 3 0 0.4% 243 1075 0.1% 0.5% 492 ANaranjal 46,605 54.2% 32.2% 13.5 0 0 1.0% 557 2007 0.1% 7.3% 250 BNaranjito 27,935 50.5% 31.2% 11.5 0 0 0.0% 0 0 0.1% 0.0% 65 DPalestina 13,215 66.6% 46.8% 1.5 1 0 3.1% 335 467 4.8% 0.6% 727 CPedro Carbo 37,349 69.7% 44.7% 6.4 0 0 0.0% 0 0 0.0% 0.0% 0 DSalinas 38,301 51.2% 22.5% 20.1 0 0 0.0% 140 0 0.0% 0.0% 0 ASamborondón 40,109 57.8% 32.2% 4.5 2 0 1.2% 44 207 0.5% 0.0% 1696 DSanta Elena 99,206 63.1% 26.7% 16.6 1 0 0.2% 864 1620 0.2% 6.0% 513 B

34
Province Canton 1997population(projection)
Povertyincidence
Illiteracyrate
Medicalpersonnel(x 10,000)
Deaths dueto El Niño
Woundeddue to El
Niño
Damagedhouses (%
of total)
No. ofaffectedfamilies
No. ofaffectedpersons
Evacuatedpopulation(% of total)
Severelyaffected
population(% total)
Pupils notassisting
schools dueto El Niño
Type (pol-icy prior-
ity)
Santa Lucía 32,288 63.2% 44.4% 3.7 0 0 0.3% 282 50 0.2% 0.0% 1283 DUrbina Jado 51,737 71.6% 38.2% 3.7 1 0 3.9% 549 94 2.1% 0.0% 301 CYaguachi 46,436 56.5% 29.0% 10.6 0 0 0.1% 16 118 0.3% 0.0% 38 DPlayas 25,377 48.7% 25.6% 9.1 0 0 0.0% 15 251 0.1% 0.0% 1019 ACoronelMarcelinoMaridueña
9,557 23.2% 15.2% 63.8 1 0 1.0% 16 20 0.0% 0.0% 0 A
Lomas deSargentillo
12,568 67.3% 44.1% 6.4 0 0 0.0% 0 0 0.0% 0.1% 0 D
Nobol 11,973 56.9% 34.4% 5.0 0 0 0.3% 167 0 0.0% 0.0% 0 DLa Libertad 62,714 45.2% 20.0% 14.7 1 0 0.0% 0 0 0.1% 0.0% 0 A
LOS RIOS Babahoyo 124,549 52.9% 27.8% 29.8 7 2 1.0% 184 821 0.9% 0.1% 4351 ABaba 34,725 74.7% 46.2% 9.5 3 0 1.1% 53 269 0.6% 0.1% 1840 DMontalvo 22,464 64.8% 33.9% 6.7 1 0 1.5% 36 114 0.1% 0.2% 723 DPuebloviejo 26,761 65.0% 38.7% 3.7 1 0 0.2% 8 39 0.1% 0.0% 282 DQuevedo 199,921 54.0% 29.3% 11.5 3 2 0.5% 144 648 0.1% 0.0% 974 BUrdaneta 27,702 61.0% 37.4% 14.1 0 0 0.2% 0 0 0.0% 0.1% 0 DVentanas 69,074 64.1% 33.1% 7.1 1 0 0.2% 14 79 0.1% 0.0% 2368 DVinces 64,044 66.6% 36.5% 9.5 1 0 2.3% 230 1179 0.5% 0.0% 4648 DPalenque 21,542 79.4% 52.3% 0.9 0 1 1.3% 69 244 0.0% 0.3% 0 DBuena Fé 20,387 79.7% 42.7% 7.4 0 0 0.1% 2 9 0.0% 0.0% 0 D
MANABI Portoviejo 238,670 40.2% 24.7% 27.6 17 8 4.8% 1061 6842 0.6% 1.3% 10027 BBolívar 44,377 66.3% 37.6% 13.1 2 0 1.6% 96 480 0.2% 0.1% 0 DChone 136,564 60.1% 35.3% 17.0 7 0 1.3% 244 1060 0.1% 0.1% 436 CEl Carmen 63,850 65.6% 35.8% 8.3 1 0 0.2% 10 50 0.0% 0.0% 0 DFlavio Alfaro 27,884 75.9% 43.8% 4.7 3 0 0.2% 4 29 0.0% 0.0% 0 DJipijapa 81,690 60.3% 37.7% 15.1 1 1 0.7% 67 437 0.1% 0.2% 200 CJunín 21,246 72.7% 38.1% 8.9 1 0 5.9% 91 461 1.2% 1.9% 122 DManta 156,840 33.8% 25.1% 37.9 2 5 0.7% 122 603 0.0% 0.2% 133 AMontecristi 44,472 59.2% 41.6% 8.3 5 8 1.7% 94 387 0.4% 0.2% 1565 DPaján 50,124 73.8% 50.3% 8.8 5 0 0.9% 31 188 0.3% 0.4% 689 DPichincha 34,041 78.3% 50.2% 4.1 0 0 0.8% 25 125 0.0% 0.2% 0 DRocafuerte 30,728 64.3% 32.0% 13.0 0 0 2.1% 56 258 0.4% 0.7% 902 DSanta Ana 58,404 72.4% 46.4% 8.0 24 16 2.4% 163 852 0.5% 0.4% 1115 D

35
Province Canton 1997population(projection)
Povertyincidence
Illiteracyrate
Medicalpersonnel(x 10,000)
Deaths dueto El Niño
Woundeddue to El
Niño
Damagedhouses (%
of total)
No. ofaffectedfamilies
No. ofaffectedpersons
Evacuatedpopulation(% of total)
Severelyaffected
population(% total)
Pupils notassisting
schools dueto El Niño
Type (pol-icy prior-
ity)
Sucre 88,992 59.4% 36.3% 27.4 22 32 5.3% 429 2247 7.5% 1.5% 2895 CTosagua 37,526 67.9% 37.9% 2.9 0 0 0.6% 22 144 0.2% 0.1% 182 D24 de Mayo 40,181 75.5% 48.6% 6.7 1 0 1.2% 26 132 0.0% 0.7% 0 DPedernales 35,240 77.5% 52.4% 3.7 6 0 0.4% 4 21 0.0% 0.3% 0 DOlmedo 11,658 77.4% 55.5% 10.3 0 0 12.9% 214 50 0.0% 1.3% 0 DPuerto López 16,095 67.7% 45.7% 5.0 3 0 2.4% 34 168 0.1% 0.7% 286 D
AZUAY Cuenca 390,904 36.6% 22.9% 53.2 6 3 0.2% 83 418 0.0% 0.0% 84 ASanta Isabel 20,264 76.8% 35.9% 18.8 0 0 0.6% 53 285 1.4% 0.1% 0 D
BOLIVAR Guaranda 78,223 69.1% 47.5% 30.7 12 0 0.0% 7 35 0.0% 0.0% 0 DChillanes 24,181 82.1% 43.9% 15.7 1 0 0.0% 0 0 0.0% 0.0% 0 DEcheandía 11,597 65.9% 34.8% 13.8 0 0 2.0% 0 0 0.0% 0.0% 0 DSan Miguel 33,117 70.2% 35.1% 16.9 0 0 0.1% 3 12 0.0% 0.0% 0 DCaluma 11,606 63.1% 31.7% 12.9 0 0 0.2% 5 25 0.0% 0.0% 0 D
CAÑAR La Trocal 38,426 65.0% 30.2% 13.3 2 0 0.4% 8 147 0.3% 0.5% 403 D COTOPAXI La Maná 24,483 75.5% 33.5% 9.8 5 0 2.1% 65 268 0.5% 0.4% 549 D
Pujilí 52,364 78.4% 51.2% 15.5 0 0 0.0% 3 8 0.0% 0.0% 0 D CHIMBORAZO Riobamba 193,403 48.0% 28.2% 28.2 3 2 0.0% 11 60 0.0% 0.0% 0 A
Alausí 47,378 82.4% 59.4% 12.0 2 1 0.5% 64 309 0.0% 0.2% 0 DChunchi 15,930 75.6% 48.6% 19.5 7 4 1.0% 10 43 0.0% 0.5% 0 DPallatanga 11,197 83.9% 50.5% 7.1 0 0 0.3% 4 18 0.0% 0.0% 0 DCumandá 10,081 78.1% 38.0% 8.9 0 0 4.9% 74 440 0.0% 1.3% 0 C
IMBABURA Ibarra 141,107 47.2% 23.0% 28.2 0 0 0.0% 4 20 0.0% 0.0% 0 A TUNGURAHUA Ambato 268,993 42.2% 24.2% 29.2 0 0 0.0% 0 0 0.0% 0.0% 0 B LOJA Calvas 34,716 77.2% 26.9% 13.3 3 1 0.0% 0 0 0.0% 0.0% 0 D
Celica 16,921 75.0% 29.9% 11.8 4 0 0.4% 0 0 0.0% 0.0% 0 DEspíndola 21,481 92.2% 44.3% 14.4 9 11 0.3% 3 15 0.0% 0.1% 0 DGonzanamá 20,401 83.6% 35.2% 8.3 1 0 0.0% 0 0 0.0% 0.0% 0 DMacará 21,588 68.7% 21.9% 17.6 3 0 0.0% 0 0 0.0% 0.0% 0 DPaltas 39,856 83.8% 33.6% 10.8 1 0 0.0% 0 0 0.0% 0.0% 0 DPuyango 19,844 78.8% 34.3% 17.6 2 0 2.6% 85 425 1.0% 0.0% 50 DZapotillo 12,085 86.1% 41.1% 13.2 3 0 3.1% 61 305 0.0% 0.2% 0 D
B MORONA Santiago 10,000 78.1% 25.9% 69.0 0 0 0.9% 0 0 0.0% 0.0% 0

36
Province Canton 1997population(projection)
Povertyincidence
Illiteracyrate
Medicalpersonnel(x 10,000)
Deaths dueto El Niño
Woundeddue to El
Niño
Damagedhouses (%
of total)
No. ofaffectedfamilies
No. ofaffectedpersons
Evacuatedpopulation(% of total)
Severelyaffected
population(% total)
Pupils notassisting
schools dueto El Niño
Type (pol-icy prior-
ity)
NAPO Tena 42,213 80.3% 28.5% 29.1 1 0 0.1% 0 0 0.0% 0.2% 0 DLa Joya de losSachas
19,122 93.1% 35.9% 6.8 0 0 0.6% 0 0 0.0% 0.7% 0 D
Orellana 23,233 78.3% 24.0% 22.4 1 0 0.9% 5 36 0.0% 4.5% 0 DLoreto 9,533 98.2% 39.8% 12.6 1 2 1.0% 10 8 0.0% 0.1% 0 D
PASTAZA Pastaza 39,411 63.5% 29.9% 44.4 0 1 2.2% 12 58 0.0% 0.8% 0 CMera 7,023 47.2% 16.1% 61.2 2 2 0.2% 0 0 0.0% 0.2% 0 A
ZAMORACHINCHIPE
Zamora 27,404 65.0% 22.0% 32.1 10 0 0.7% 0 0 0.0% 0.2% 0
Chinchipe 14,665 89.1% 27.1% 29.3 0 0 0.1% 0 0 0.0% 0.1% 0 CNangaritza 5,097 84.7% 24.3% 13.7 0 0 0.1% 0 0 0.0% 0.1% 0 DYantzaza 14,468 78.2% 26.8% 25.6 0 0 1.1% 85 196 0.0% 0.8% 0 CEl Pangui 6,681 87.6% 36.8% 16.5 0 1 3.7% 23 137 0.0% 3.0% 0 DEl Cóndor 5,749 84.8% 31.4% 0.0 0 0 1.0% 9 54 0.0% 0.0% 0
GALAPAGOS San Cristóbal 4,255 23.9% 8.7% 0.0 0 0 0.8% 4 30 0.0% 0.3% 0
Source: Vos, Velasco and De Labastida (1998); SIISE.

37
Bibliography
Aguilar, Marcelo (1994) La malaria es más que una picadura, Quito: Fundación Juan César Garcia
Alballa-Bertrand, J.-M. (1993) Political Economy of Large Natural Disasters: With Special Reference toDeveloping Countries, Oxford, New York: Oxford University Press.
Barreiros, Lidia; Arend Kouwenaar, Rudolf Teekens and Rob Vos (1987) Ecuador: Teoría y diseño depolíticas para la satisfacción de necesidades básicas, Santiago: PREALC and Institute of SocialStudies.
COPEFEN (1998) Séptimo Informe del Programa de Emergencia para Afrontar el Fenómeno de El Niño,Quito: Unidad Coordinadora del Programa de Emergencia para Afrontar el Fenómeno El Niño(August).
Defensa Civil (1997) Plan de Contingencia para enfrentar el Fenómeno de El Niño, Quito, July (mimeo).
ECLAC (1998) Ecuador: Evaluación de los efectos socio-económicos del fenómeno de El Niño en 1997-8, Santiago: Economic Commission for Latin America and the Caribean (22 June).
ECLAC (1983) Ecuador: evaluación de los efectos de las inundaciones de 1982-1983 sobre el desarrolloeconómico y social, E/ECLAC/G.1240, Santiago: ECLAC (9 May).
FAO (1983) Documento sobre las inundaciones del litoral ecuatoriano: octubre 1982 – junio 1983,Quito: Banco Nacional de Fomento and Food and Agricultural Organization (UN) (mimeo).
Gómez Dantés, Héctor (1991) El dengue en las Américas: un problema de salud regional, Revista deSalud Pública de México, vol. 33 no. 4 (July-August).
Government of Ecuador (1983) Requerimientos de asistencia internacional para atender las necesidadesde plazo inmediato como resultado de las inundaciones en el Ecuador, Quito (mimeo).
Instituto Nacional de Pesca (1997) Informe sobre el evento “El Niño 1997-1998” y su relación con lapesca y acuacultura, Guayaquil (mimeo).
Jácome, Luis, Carlos Larrea and Rob Vos (1998) Políticas macroeconómicas, distribución y pobreza enel Ecuador, CORDES Working Paper No. 7, Quito: Cordes.
Larrea, Carlos et al. (1996) La geografía de la pobreza en el Ecuador, Quito: Secretaría Técnica delFrente Social and UNDP.
Ministerio de Salud Pública (1997) Informe de las actividades realizadas a propósito del Fenómeno de ElNiño, Dirección General de Salud, Quito, November (mimeo).
Ministerio de Salud Pública (several years). Tasas de dengue clásico, malaria, fiebre amarilla, (1990 to1997), Dirección de Epidemiología, Quito.

38
Noll, Roger (1996) The Complex Politics of Catastrophe Economics”, Journal of Risk and Uncertainty,12 (2-3): 141-146.
Secretaría Técnica del Frente Social (1997) Pobreza y Capital Humano en el Ecuador, SIISE, Quito:STFS.
Secretaría Técnica del Frente Social (1998) Cronología del fenómeno de El Niño en base al PeriódicoHoy, 1982-1983’, SIISE, Quito (February 1998).
Secretaría Técnica del Frente Social. (1998) Sistema Integrado de Indicadores Sociales, SIISE. Quito.Electronic data base.
Velasco, Margarita. (1998) El fenómeno de El Niño y sus efectos en la salud. Síntesis Social (Quito.SIISE-STFS). No. 2, Quito (February).
Velasco, Margarita, et al. (1998) El fenómeno de El Niño. Una visión desde la salud’, Quito: SistemaIntegrado de Indicadores Sociales, STFS (mimeo).
Vos, Rob (1985) El modelo de desarrollo y el sector agrícola en Ecuador, 1965-82, El TrimestreEconómico, LII(208):1097-1140.
Vos, Rob, Margarita Velasco and Edgar de Labastida (1998) Efectos económicos y sociales delfenómeno de “El Niño” in Ecuador, 1997-8, Document prepared for the Inter-AmericanDevelopment Bank (SOC/POV), Washington D.C.: IDB (mimeo).
World Bank (1996) Ecuador Poverty Report, Washington D.C.: The World Bank.