economic assessment of ipm programs deana sexson university of wisconsin, npm program
TRANSCRIPT

Economic Assessment Of IPM Economic Assessment Of IPM ProgramsPrograms
Deana SexsonUniversity of Wisconsin, NPM Program

Economics Assessment of IPM Economics Assessment of IPM ProgramsPrograms
What is economic viability to the What is economic viability to the farm?farm?– Cash flow?Cash flow?– Enterprise budget?Enterprise budget?– Fair grower returns?Fair grower returns?

What is economic viability to What is economic viability to the farm?the farm?
Potatoes, a high value/high input Potatoes, a high value/high input crop costs about $2200 per acre to crop costs about $2200 per acre to produce (includes fixed and variable produce (includes fixed and variable costs)costs)– Economic viability should be that growers Economic viability should be that growers
receive more for their cropreceive more for their crop– Assuming an average 360 cwt marketable Assuming an average 360 cwt marketable
yield per acre, growers need to return $6.10 yield per acre, growers need to return $6.10 on average to break evenon average to break even
ALL IPM Programs Need To Have An ALL IPM Programs Need To Have An Economic Component!!Economic Component!!

Economics of IPM Programs: Outline Economics of IPM Programs: Outline of Discussionof Discussion
Can IPM programs save growers money?Can IPM programs save growers money?– Yes – early IPM adoptionYes – early IPM adoption– No – increased cost of reduced risk No – increased cost of reduced risk
materialsmaterials Cost of environmental impacts, who Cost of environmental impacts, who
should pay?should pay?– WI value added exampleWI value added example
Can Economic Benefits Be Aggravated to Can Economic Benefits Be Aggravated to Reflect Economic Benefits on a National Reflect Economic Benefits on a National Scale?Scale?

Can IPM Programs Be Can IPM Programs Be Profitable to Growers?Profitable to Growers?
Yes!Yes!– Early adoption of IPM techniques, utilizing Early adoption of IPM techniques, utilizing
economic thresholds and reducing the economic thresholds and reducing the number of sprays pays the grower money. number of sprays pays the grower money.
» Scouting $15.00 per acre if equals 1-2 spray Scouting $15.00 per acre if equals 1-2 spray reduction you have made moneyreduction you have made money
Example of WI potatoes (Stevenson and Example of WI potatoes (Stevenson and Wyman, 1996)Wyman, 1996)
» By utilizing scouting, disease forecasting models, By utilizing scouting, disease forecasting models, reduced herbicide inputs, proper irrigations reduced herbicide inputs, proper irrigations scheduling and timely and efficient fertility inputs scheduling and timely and efficient fertility inputs growers saved about $170 per hectare (about $70 growers saved about $170 per hectare (about $70 per acre)per acre)
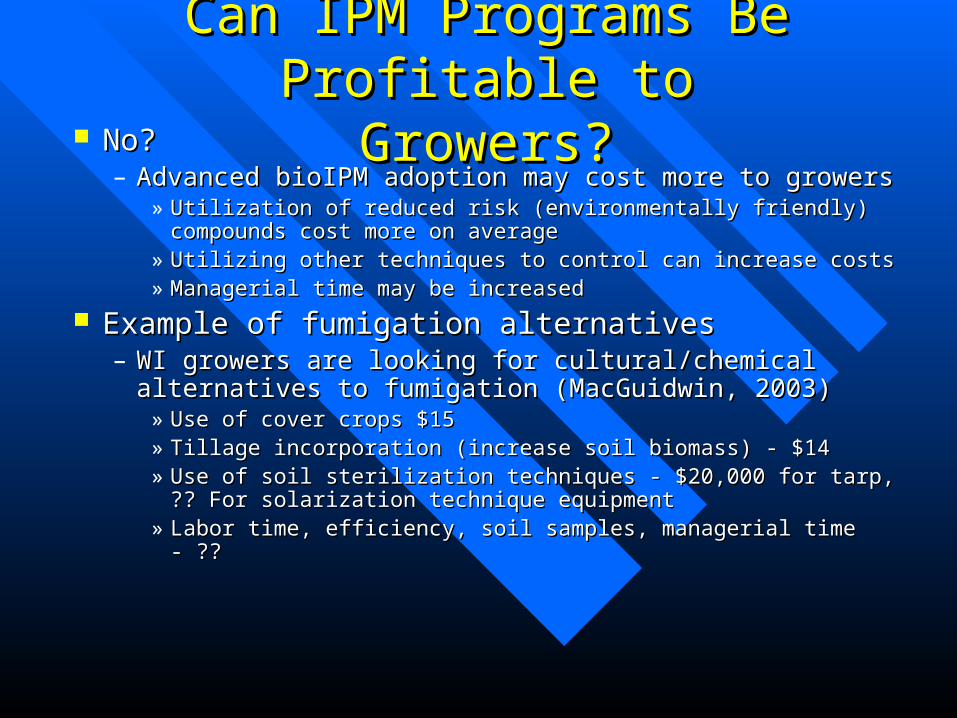
Can IPM Programs Be Can IPM Programs Be Profitable to Growers?Profitable to Growers?
No?No?– Advanced bioIPM adoption may cost more to growersAdvanced bioIPM adoption may cost more to growers
» Utilization of reduced risk (environmentally friendly) compounds Utilization of reduced risk (environmentally friendly) compounds cost more on averagecost more on average
» Utilizing other techniques to control can increase costsUtilizing other techniques to control can increase costs» Managerial time may be increased Managerial time may be increased
Example of fumigation alternativesExample of fumigation alternatives– WI growers are looking for cultural/chemical alternatives WI growers are looking for cultural/chemical alternatives
to fumigation (MacGuidwin, 2003)to fumigation (MacGuidwin, 2003)» Use of cover crops $15Use of cover crops $15» Tillage incorporation (increase soil biomass) - $14Tillage incorporation (increase soil biomass) - $14» Use of soil sterilization techniques - $20,000 for tarp, ?? For Use of soil sterilization techniques - $20,000 for tarp, ?? For
solarization technique equipmentsolarization technique equipment» Labor time, efficiency, soil samples, managerial time - ??Labor time, efficiency, soil samples, managerial time - ??

Increased ProductivityIncreased ProductivityHolds Production Costs DownHolds Production Costs Down
Cost cutting innovations started more than a hundred Cost cutting innovations started more than a hundred years agoyears ago
Equipment improvements reduce costsEquipment improvements reduce costs Improved varieties add to both yields and qualityImproved varieties add to both yields and quality Enhanced cultural practices boost yieldsEnhanced cultural practices boost yields
° Seed potato certificationSeed potato certification° Chemical pest and disease controlChemical pest and disease control° Irrigation water managementIrrigation water management° Rotation ManagementRotation Management° Plant spacing for optimum size and tuber setPlant spacing for optimum size and tuber set

New Technology Reduces Potato Production Costs
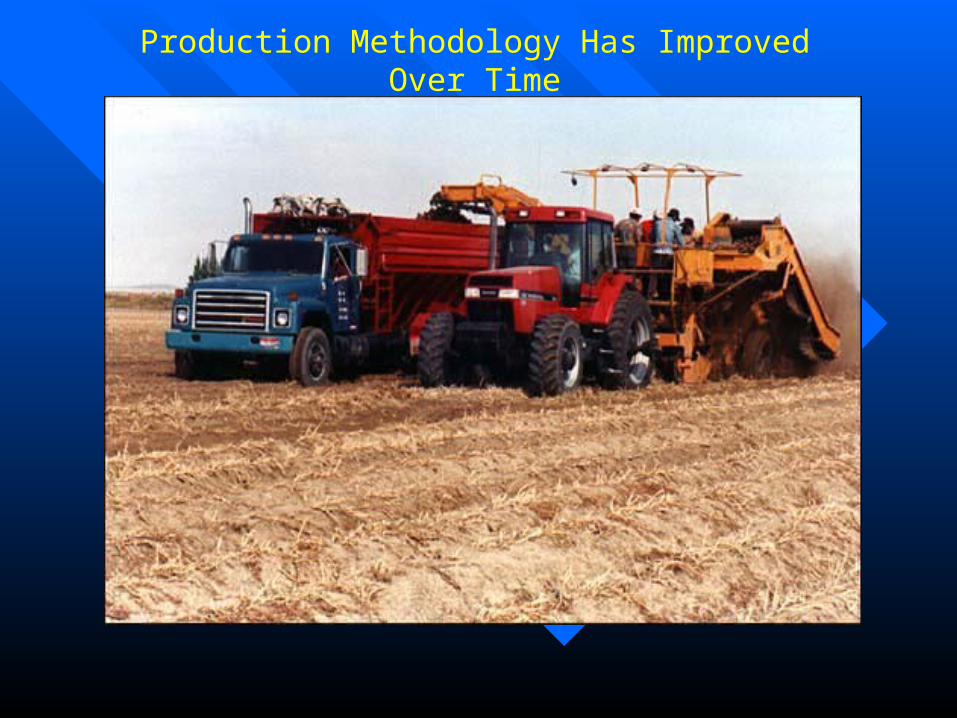
Production Methodology Has Improved Over Time

Lets Look At The Cost Of Lets Look At The Cost Of Actual “BioIPM Programs” Actual “BioIPM Programs”
1)1) On farm field trials (Wyman and On farm field trials (Wyman and
Stevenson)Stevenson)
2)2) Individual grower tracking of IPM Individual grower tracking of IPM
score, toxicity, and cost (Sexson score, toxicity, and cost (Sexson
and Day)and Day)

Comparison of season-long, reduced-risk Comparison of season-long, reduced-risk programs with conventional programs for programs with conventional programs for insect and disease controlinsect and disease control
On commercial farms with growersOn commercial farms with growers
Large (3-5 A) replicated blocksLarge (3-5 A) replicated blocks
Weekly scouting for efficacy of insect/disease Weekly scouting for efficacy of insect/disease
controlcontrol
Impacts of programs on natural enemiesImpacts of programs on natural enemies
Yield and gradeYield and grade
Overall toxicityOverall toxicity
CostCost
DEVELOPING REDUCED RISK ALTERNATIVESDEVELOPING REDUCED RISK ALTERNATIVES

Toxicity unit and cost per acre comparisons of insecticides on Toxicity unit and cost per acre comparisons of insecticides on Russet Burbank potatoes, Coloma (Lyons) 2000.Russet Burbank potatoes, Coloma (Lyons) 2000.
Management Management regimeregime Insecticides appliedInsecticides applied
ToxicityToxicity
unitsunits
Cost perCost per
acreacre
Conventional Conventional systemicsystemic Admire 16 oz./AAdmire 16 oz./A 3232 $60.00$60.00
Low-risk Low-risk systemicsystemic
Admire 10 oz./A, SpinTor 4 oz./A,Admire 10 oz./A, SpinTor 4 oz./A,
Pounce 4 oz./APounce 4 oz./A5959 $64.00$64.00
ConventionalConventional
foliarfoliar
Asana/PBO 4/4 oz./A, Baythroid/PBO 2.8/4.0 Asana/PBO 4/4 oz./A, Baythroid/PBO 2.8/4.0 oz./A, Provado 3.75 oz./A, Dimethoate 1 pt./A,oz./A, Provado 3.75 oz./A, Dimethoate 1 pt./A,
Monitor 1.5 pts./AMonitor 1.5 pts./A730730 $76.00$76.00
Low-riskLow-risk
foliarfoliarNovodor 3 qts./A, SpinTor 4 oz./A, Pounce 4 Novodor 3 qts./A, SpinTor 4 oz./A, Pounce 4
oz./A, Fulfill 2.75 oz./Aoz./A, Fulfill 2.75 oz./A 1010 $56.00$56.00
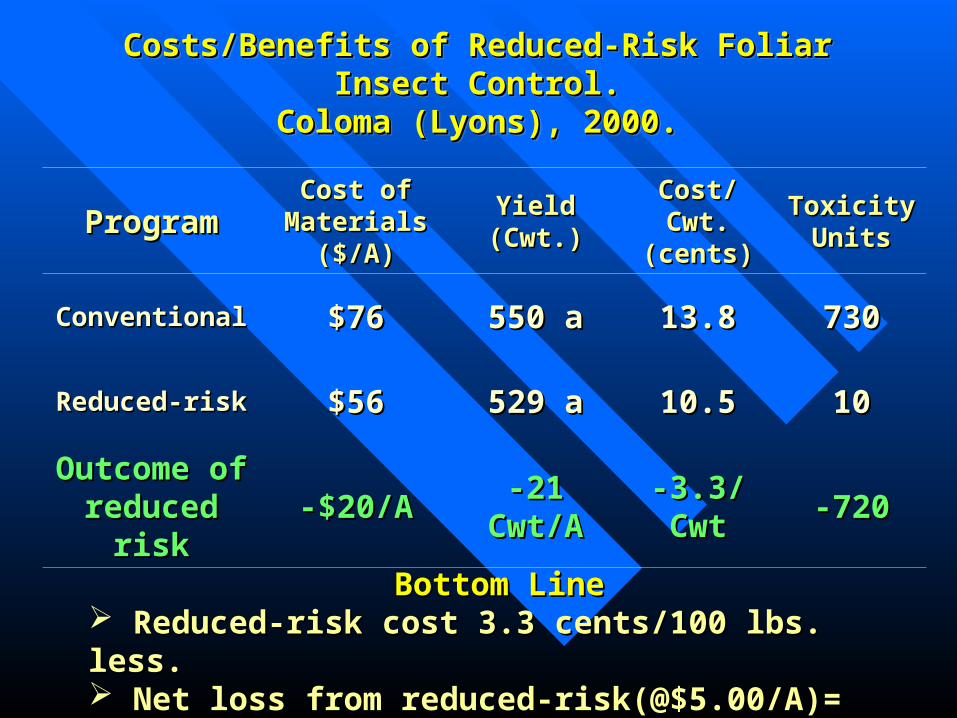
Costs/Benefits of Reduced-Risk Foliar Insect Control.Costs/Benefits of Reduced-Risk Foliar Insect Control.Coloma (Lyons), 2000.Coloma (Lyons), 2000.
Costs/Benefits of Reduced-Risk Foliar Insect Control.Costs/Benefits of Reduced-Risk Foliar Insect Control.Coloma (Lyons), 2000.Coloma (Lyons), 2000.
ProgramProgramCost of Cost of
Materials Materials ($/A)($/A)
Yield (Cwt.)Yield (Cwt.) Cost/Cwt. Cost/Cwt. (cents)(cents)
Toxicity Toxicity UnitsUnits
ConventionalConventional $76$76 550 a550 a 13.813.8 730730
Reduced-riskReduced-risk $56$56 529 a529 a 10.510.5 1010
Outcome of Outcome of reduced riskreduced risk -$20/A-$20/A -21 Cwt/A-21 Cwt/A -3.3/Cwt-3.3/Cwt -720-720
Bottom LineBottom Line Reduced-risk cost 3.3 cents/100 lbs. less.Reduced-risk cost 3.3 cents/100 lbs. less. Net loss from reduced-risk(@$5.00/A)= $85/A.Net loss from reduced-risk(@$5.00/A)= $85/A.

Toxicity and Cost/A Comparisons of Fungicide Toxicity and Cost/A Comparisons of Fungicide Programs on Snowden Potatoes. Coloma 2000.Programs on Snowden Potatoes. Coloma 2000.Toxicity and Cost/A Comparisons of Fungicide Toxicity and Cost/A Comparisons of Fungicide Programs on Snowden Potatoes. Coloma 2000.Programs on Snowden Potatoes. Coloma 2000.
ProgramProgram Fungicide AppliedFungicide AppliedMaterials Materials Cost per Cost per
AA
Toxicity Toxicity UnitsUnits
ConventionalConventional Manzate 7, Bravo 6, Tin 3, Manzate 7, Bravo 6, Tin 3, Curzate 1Curzate 1 $120$120 27322732
Reduced-Risk-Reduced-Risk-Q/BQ/B
Quadris 3, Bravo 11, Quadris 3, Bravo 11, Curzate 2Curzate 2 $158$158 11441144
Reduced-Risk -Reduced-Risk -Q/B/BQ/B/B
Quadris 3, Bravo 11, Quadris 3, Bravo 11, Curzate 2Curzate 2 $157$157 11291129
Reduced-Risk -Reduced-Risk -Q/MQ/M
Quadris 3, Manzate 11, Quadris 3, Manzate 11, Curzate 2Curzate 2 $88$88 28842884

Costs/Benefits of Reduced-Risk Fungicide Programs Costs/Benefits of Reduced-Risk Fungicide Programs on Snowden Potatoes. Coloma 2000.on Snowden Potatoes. Coloma 2000.
Costs/Benefits of Reduced-Risk Fungicide Programs Costs/Benefits of Reduced-Risk Fungicide Programs on Snowden Potatoes. Coloma 2000.on Snowden Potatoes. Coloma 2000.
ProgramProgram Cost of Cost of Materials ($/A)Materials ($/A)
Yield Yield (Cwt.)(Cwt.)
Cost/Cwt. Cost/Cwt. (cents)(cents)
Toxicity Toxicity UnitsUnits
ConventionalConventional $120$120 432432 27.827.8 27322732
Reduced-risk Reduced-risk (QBB)(QBB) $157$157 433433 36.336.3 11291129
Outcome of Outcome of reduced riskreduced risk +$37/A+$37/A +1/Cwt.+1/Cwt. +8.5/Cwt+8.5/Cwt -1603-1603
Bottom LineBottom Line Reduced-risk costs 8.5 cents/100 lbs. more.Reduced-risk costs 8.5 cents/100 lbs. more.
Net loss from reduced-risk(@$5.00/A)= $32/A.Net loss from reduced-risk(@$5.00/A)= $32/A.

Conclusions Conclusions
Reduced-Risk insecticide programs provided equivalent Reduced-Risk insecticide programs provided equivalent
efficacy and yield to conventional programs.efficacy and yield to conventional programs.
Beneficial insect populations were significantly higher Beneficial insect populations were significantly higher
in Reduced-Risk insecticide programs and may provide in Reduced-Risk insecticide programs and may provide
aphid control.aphid control.
Reduced-Risk fungicide programs improved efficacy Reduced-Risk fungicide programs improved efficacy
and and may increase yieldmay increase yield..
Costs of Reduced-Risk programs were generally higher Costs of Reduced-Risk programs were generally higher
but but may be offset by increased yieldmay be offset by increased yield (fungicides). (fungicides).
Total toxicity units from Reduced-Risk programs were Total toxicity units from Reduced-Risk programs were
reduced by over 50%.reduced by over 50%.

AFT/EPA Funded effort to determine AFT/EPA Funded effort to determine economics of bioIPM pesticide programs*economics of bioIPM pesticide programs*
We collected pesticide application data We collected pesticide application data for the years 2000-2003 from 15 for the years 2000-2003 from 15 growers. growers.
We then compared pesticide cost with We then compared pesticide cost with toxicity units for the 15 growers.toxicity units for the 15 growers.
We collected average prices for all WI We collected average prices for all WI potato chemicals.potato chemicals.
We designed a tool for farmers to track We designed a tool for farmers to track their own cost and toxicity units.their own cost and toxicity units.
*with Esther Day

Toxicity/Cost Analysis CalculatorToxicity/Cost Analysis Calculator
We developed an Excel spreadsheet to track We developed an Excel spreadsheet to track the performance of the growers in terms low the performance of the growers in terms low vs. high toxicity chemical programs, using:vs. high toxicity chemical programs, using:– Toxicity Units (Multiattribute Toxicity Units (Multiattribute Toxicity Factor Toxicity Factor
ModelModel: calculates human and environmental : calculates human and environmental effect in WI potato system, Benbrook)effect in WI potato system, Benbrook)
– Pesticide application dataPesticide application data
– Average prices of chemicals used by WI potato Average prices of chemicals used by WI potato growersgrowers
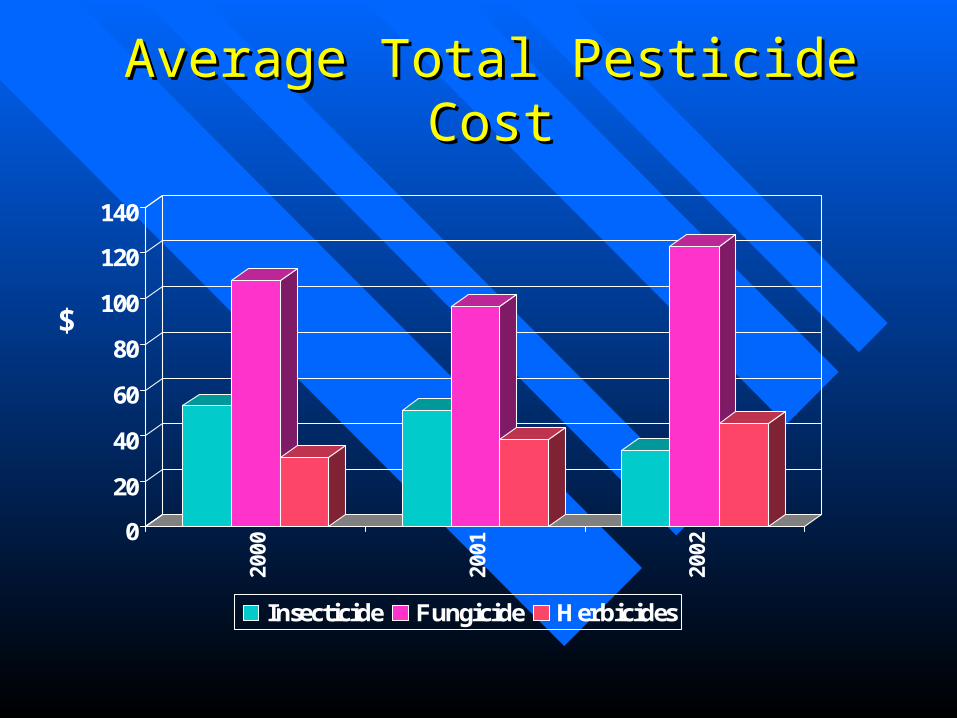
Average Total Pesticide CostAverage Total Pesticide Cost
0
20
40
60
80
100
120
140
2000
2001
2002
Insecticide Fungicide Herbicides
$

Average Total Tox UnitsAverage Total Tox Units
0
200
400
600
800
1000
1200
1400
2000
2001
2002
Insecticide Fungicide Herbicides
TU

Total Pesticide Tox Units for Short vs. Total Pesticide Tox Units for Short vs. Long Season FieldsLong Season Fields (2002)(2002)
0
500
1000
1500
2000
2500
Far
m 4
Far
m 5
Far
m 1
4F
arm
2F
arm
11
Far
m 8
Far
m 3
Far
m 1
3F
arm
1F
arm
15
Far
m 1
0F
arm
9F
arm
7F
arm
12
Far
m 6
1,445
1020

Total Pesticide Cost for Short vs. Long Total Pesticide Cost for Short vs. Long Season Fields (2002)Season Fields (2002)
0
50
100
150
200
250
300
350
$
Far
m 1
1F
arm
2F
arm
5F
arm
14
Far
m 4
Far
m 1
5F
arm
12
Far
m 1
Far
m 3
Far
m 1
0F
arm
13
Far
m 9
Far
m 7
Far
m 8
Far
m 6
174
215
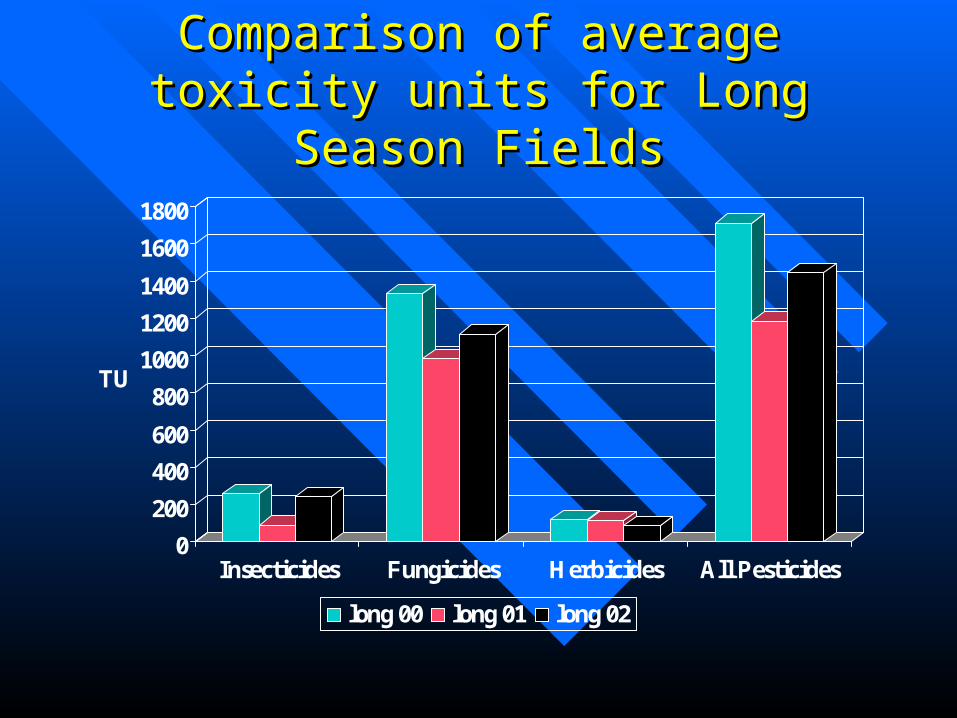
Comparison of average toxicity units for Comparison of average toxicity units for Long Season FieldsLong Season Fields
0
200
400
600
800
1000
1200
1400
1600
1800
TU
Insecticides Fungicides Herbicides All Pesticides
long 00 long 01 long 02

Cost Comparison of costs of pesticides Cost Comparison of costs of pesticides for Long Season Fieldsfor Long Season Fields
0
50
100
150
200
250
$
Insecticides Fungicides Herbicides All Pesticides
long 00 long 01 long 02
Comparisons of Short vs. Long Comparisons of Short vs. Long Season Fields - DiscussionSeason Fields - Discussion
As expected, the average cost and toxicity units As expected, the average cost and toxicity units among all fields are higher in long season fields among all fields are higher in long season fields than short season fields.than short season fields.
However, the trend is not necessarily seen on a However, the trend is not necessarily seen on a field by field basis as many other factors field by field basis as many other factors contribute to pesticide applications (such as soil contribute to pesticide applications (such as soil type, weather conditions, pest pressures, etc.) type, weather conditions, pest pressures, etc.) which are not accounted for in this comparison.which are not accounted for in this comparison.
Therefore, once again, we need to look at the Therefore, once again, we need to look at the situations on a field by field basis.situations on a field by field basis.

Comparisons of Pesticide Toxicity, Comparisons of Pesticide Toxicity,
Cost, and IPM AdoptionCost, and IPM Adoption
The BioIPM Score (from eco-potato The BioIPM Score (from eco-potato standards) number which signifies IPM standards) number which signifies IPM adoption for each field was further adoption for each field was further compared to the pesticide toxicity and compared to the pesticide toxicity and cost analysis.cost analysis.
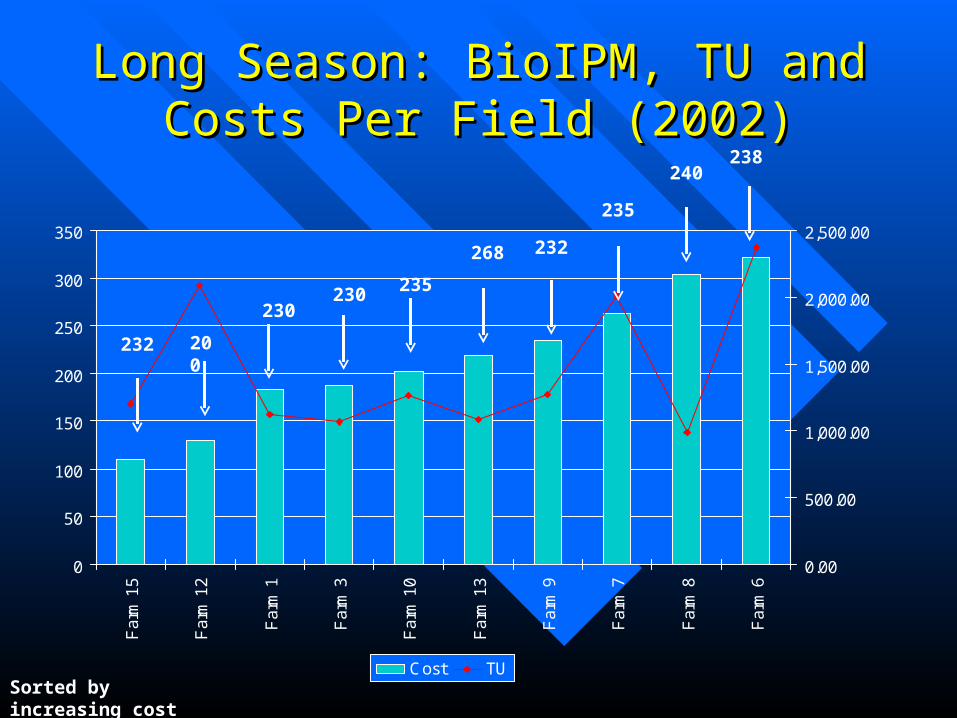
Long Season: BioIPM, TU and Costs Long Season: BioIPM, TU and Costs Per Field (2002)Per Field (2002)
Sorted by increasing cost
0
50
100
150
200
250
300
350
Fa
rm 1
5
Fa
rm 1
2
Fa
rm 1
Fa
rm 3
Fa
rm 1
0
Fa
rm 1
3
Fa
rm 9
Fa
rm 7
Fa
rm 8
Fa
rm 6
0.00
500.00
1,000.00
1,500.00
2,000.00
2,500.00
Cost TU
232 200
230230 235
268 232
235
240238

Comparisons of Pesticide Toxicity, Cost, Comparisons of Pesticide Toxicity, Cost, and IPM Adoption - Discussionand IPM Adoption - Discussion
No clear trends were seen in the 15 fields No clear trends were seen in the 15 fields surveyed between IPM adoption, toxicity and surveyed between IPM adoption, toxicity and costs.costs.
More analysis needs to be done to look at other More analysis needs to be done to look at other factors (such as pest pressures) which may factors (such as pest pressures) which may have a greater influence on pesticide. have a greater influence on pesticide. applications than IPM adoption among growers:applications than IPM adoption among growers:– For example, even if many IPM practices are For example, even if many IPM practices are
implemented and pest populations reach threshold implemented and pest populations reach threshold levels, a pesticide application is necessary.levels, a pesticide application is necessary.

Cost Of Environmental Impacts: Cost Of Environmental Impacts: Who Should Pay?Who Should Pay?
WI value added WI value added exampleexample
WWF/WPVGA/UW Collaboration - Ecological Potato Standards (Draft 12/15/00)
Farm:Variety:Acres:
Please answer the following for the field which you are certifying.
Scouting Section
1A Whose scouting data did you use to make management decisions on this field?(check only one)
Farm Dealer/Co-op = 1 pointIndependent Crop Consultant = 5 points point total for question 1A
IPM Trained Farm Employee = 4 points possible range 1-5
Farm Owner/Manager = 4 pointsFarm Employee = 2 points
1B Bonus: If additional scouting data was taken, who provided this data?(check only one)
Farm Dealer/Co-op = 1 pointIndependent Crop Consultant = 5 pointsIPM Trained Farm Employee = 4 pointsFarm Owner/Manager = 4 pointsFarm Employee = 2 pointsNo One = 0 points
point total for bonus question IB possible range 0 - 5
Variety Designation:Short season (SS) = less than 90 days
from emergence to final vinekillLong season (LS) = more than 90 days
from emergence to final vinekill
Difference in Cost:-Approx $0.50 per cwt-Would like to return $1.00 per cwt

SIGNAGE


Can Economic Benefits Be Aggravated to Reflect Economic Benefits on a National
Scale?• Good Question?• WI Farm Management
Information System: Industry Database Program– Implemented initially in 2002– Will be used to track pesticide
use , toxicity programs, costs, etc. for WI potato and vegetable systems
– Data maintained in a confidential manner at the grower association level

For more information
Visit http://ipcm.wisc.edu/bioIPM
Or contact:
Deana Sexson, BioIPM Field Coordinator for the WWF/WPVGA/UW Collaboration, University of
Wisconsin, NPM Program
(608) 265-9798