economic consequences of trade-feenstra · 2018-09-10 · caliendo, feenstra, taylor and romalis...
TRANSCRIPT

Economic Consequences ofTrade
Robert FeenstraUC Davis and NBER
NBERJuly 10, 2018

Economic Consequences ofTrade and Trade Policy
Robert FeenstraUC Davis and NBER
NBERJuly 10, 2018

Background
• All recent U.S. Presidents have used tariffs• President Obama – tariffs on tires (safeguard) and solar panels (antidumping) from China
• President Bush – tariff on steel imports. He exempted Canada, Mexico, Jordan & Israel, and 100 developing countries. But not the EU, which won a complaint in the WTO and targeted U.S. goods (e.g. oranges) for tariffs
• President Bush withdrew tariff in 19 months

What is different now?
• President Trump – applied tariffs on solar panels and washing machines (safeguard)
• President Trump – also applied tariffs to steel & aluminum (national defense)
• Neither Canada, Mexico or the EU were exempted from the steel/aluminum tariffs, and they have retaliated (on whiskey, Harley‐Davidson, orange juice etc.)
• No sign that the U.S. tariffs will be removed

What is different now?
• President Trump – applied 25% tariff on $34 billion in Chinese imports ($16 billion to come)
• China has retaliated with tariffs on the U.S.• President Trump – also investigating a tariff on automobile imports (national security)
• That would especially hit Canada and Europe, who plan to retaliate
• So there is a difference in the magnitude of tariff actions, and in the retaliation
What are the costs of a tariff war?Compare Canada and China

Canada
• Prime example of the gains from intra‐industry trade!– Canada‐US Auto pact of 1965– Canada‐US Free Trade Agreement of 1989– North American Free Trade Agreement of 1994
• Several alternative sources of gains from trade– Product variety gains– Pro‐competitive gains– Gains from ‘creative destruction’

Alternative Sources of Gains
• Arkolakis, Costinot, Donaldson and Rodriguez‐Clare“The Elusive Pro‐competitive Effects of Trade” – With homothetic preferences, the gains from trade are identical to those in Arkolakis, Costinot, Rodriguez‐Clare, and are due entirely to ‘creative destruction’, i.e. there are no variety gains or pro‐competitive gains
• WHY? This is an aggregation effect due to using a Pareto distribution with unbounded support– Such an aggregation effect is also referred to in Amiti, Itskhoki and Konings, “International shocks, Variable Markups and Domestic Prices” (NBER, 2016)

Alternative Sources of Gains
• Once we abandon unbounded Pareto, then all three sources of gains can operate
• For example: Truncated Pareto (Feenstra, JIE, 2018)• For the United States, the sources of gains are:
– Creative destruction – 25%– Product variety and Pro‐competitive – 75%
(Feenstra and Weinstein, JPE, 2017)
• But the upper‐bound to the total gains from trade is still the formula in ACR/ACDR!

Alternative Sources of Gains
• Can any of the sources of gains be negative?– Hsieh, Li, Ossa, Yang, “Accounting for the New Gains
from Trade Liberalization“ (NBER, 2016)– They find negative gains from product variety for Canada (due to domestic exit) in the Canada‐US Free Trade Agreement, as can occur for non‐Pareto distributions
– The total gains from trade are still positive, and Trefler finds strong evidence of creative destruction gains
• QUESTION: Is Canada particularly vulnerable to losses from U.S. tariffs due to intra‐industry trade?

What are the costs of a U.S. (uniform) optimal tariff?
Speculate that this might hurt Canada especiallyCaliendo, Feenstra, Taylor and Romalis (2017)
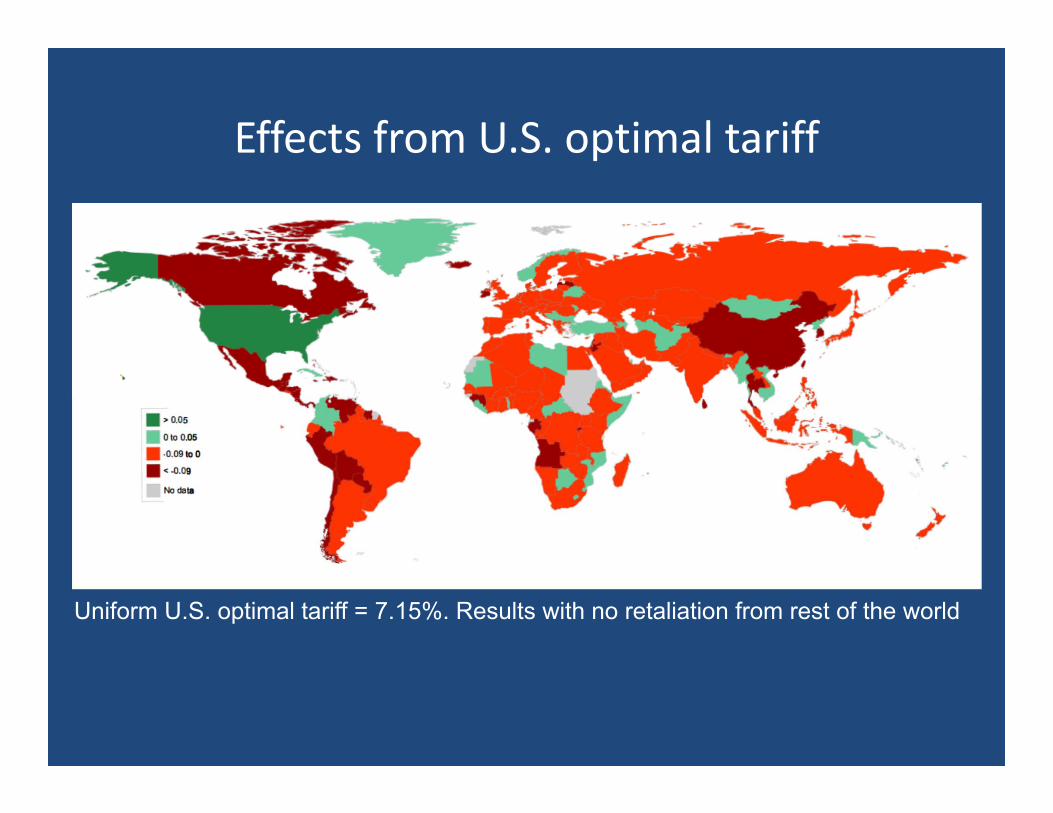
Effects from U.S. optimal tariff
Uniform U.S. optimal tariff = 7.15%. Results with no retaliation from rest of the world

China
• Gains from trade are more in accordance with conventional comparative advantage– Though that theory has been extended to allow for the supply chains that are widespread in China
• The Trump administration is targeting industrial goods imported from China for tariffs– That may have particularly high costs on U.S. firms
• Do supply chains make countries more vulnerable?
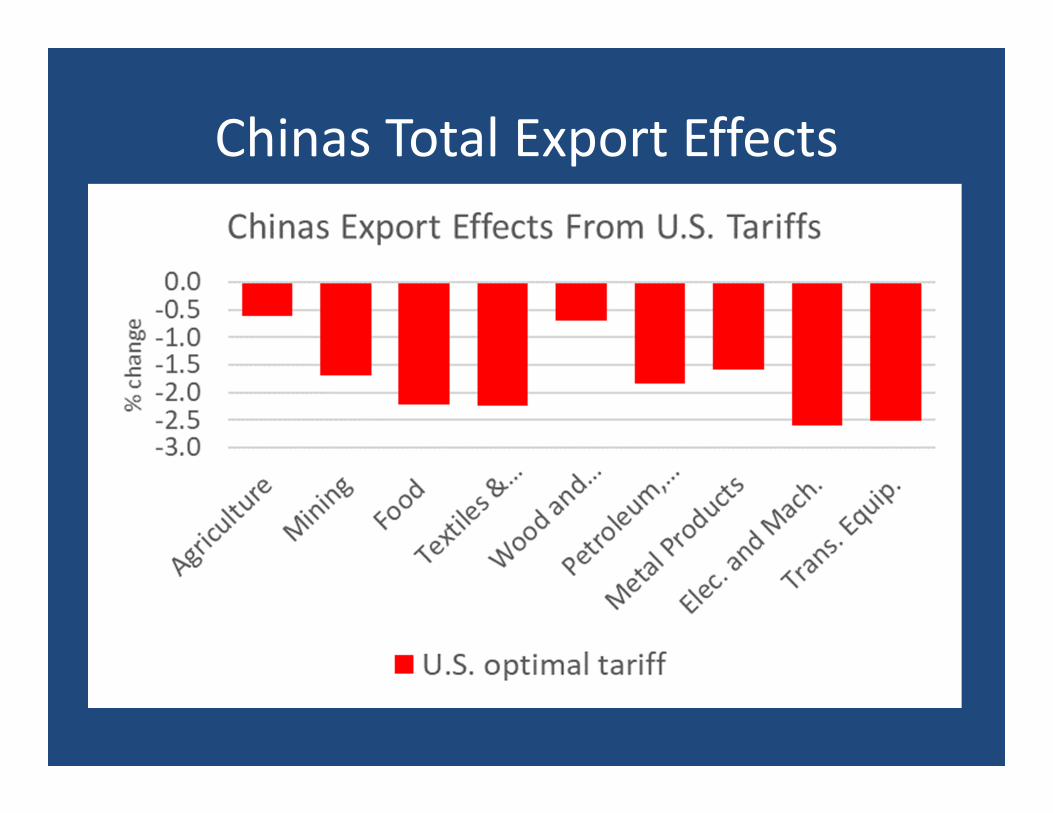
Chinas Total Export Effects

Chinas Total Export Effects

What are the costs of China’s (uniform) optimal tariff?
Speculate that this might hurt all countries that rely on China’s exports of intermediate inputs
(from Lerner symmetry)

Effects from China’s optimal tariff
Uniform China’s optimal tariff = 6.61%. Results with no retaliation from rest of the world

What are the costs of a global trade war?

Trade War
Uniform 5% import tariff imposed by all countries
• World trade “collapses” by 20% (same as in 2008/9)

Conclusion
• Tariffs used by the Trump administration are more widespread that other administrations
• And they have led to actual retaliation• Theory allows for alternative sources of gains from trade than comparative advantage, butcan this make countries more vulnerable?
• Global trade war with 5% tariffs leads to the same fall in trade as the Great Recession
Globalization and Labor Market Adjustment
Gordon Hanson
UC San Diego and NBER
NBER International Trade & Investment Summer Institute
July 2018

Winners and Losers from Freer Trade
While we've long known that trade creates losers along with
aggregate gains, conventional wisdom circa 2005 was that:
1 Trade had not been a major contributor to declining manufacturing
employment or rising wage inequality in high-income countries
2 Workers employed in regions specializing in import-competing
sectors could readily reallocate to other regions if displaced by trade
3 Any labor market impacts of trade would be felt by low-skill workers
generally, not by trade-exposed workers speci�cally

The China Trade Shock to Global Manufacturing
0
5
10
15
20
Per
cent
1985 1990 1995 2000 2005 2010 2015Time
China USA
Share of World Manufacturing Exports

Labor-Market Consequences of Greater Import Competition
Economic Impacts of Import Competition from China
• Closure of manufacturing plants (Bernard Jensen & Schott),
declines in employment (Acemoglu Autor Dorn Hanson & Price;
Handley & Limão; Pierce & Schott) in trade-exposed industries
• Lower employment, higher labor-force exit, higher long-run
unemployment, greater bene�ts uptake in more trade-exposed local
labor markets (Autor Dorn & Hanson)
• Lower lifetime incomes, greater job churning for more trade-exposed
workers (Autor Dorn Hanson & Song)

Adjustment to Trade in Local Labor Markets
Active margins of adjustment to greater import competition
• Reductions in manufacturing employment
• Increases in non-participation in the labor force
• Increases in long-run unemployment
Inactive margins of adjustment to greater import competition
• Weak average response of interregional migration to trade shocks
• Movement of labor across areas due to labor-demand shocks is slow
and incomplete (Blanchard Katz, Glaeser Gyourko, Yagan), though
commuting ∆es are heterogeneous (Monte Redding Rossi-Hansberg)

Impacts of Trade Exposure on Long-Run Earnings
Bottom vs. top tercile workers, 1991-2007
!35.0&
!30.0&
!25.0&
!20.0&
!15.0&
!10.0&
!5.0&
0.0&
5.0&
10.0&
15.0&
20.0&
Total&Effect& Ini5al&Firm& Different&Firm,&Same&Sector&
Other&Sector&
Cumula5ve&Earnings&Rela5ve&to&Baseline&
Impact&of&Trade&Exposure&on&Cumula5ve&Earnings&by&Sector:&&Workers&Ini5ally&in&Lowest&and&Highest&Earnings&Tercile&&
BoQom&Tercile& Top&Tercile&
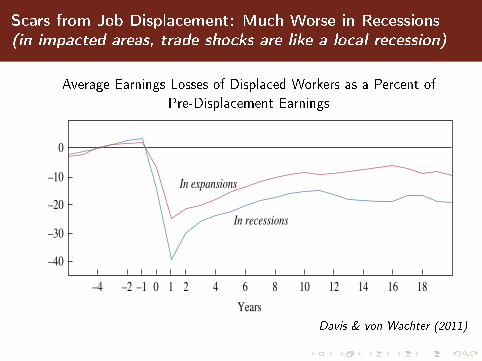
Scars from Job Displacement: Much Worse in Recessions
(in impacted areas, trade shocks are like a local recession)
Average Earnings Losses of Displaced Workers as a Percent of
Pre-Displacement Earnings
18 Brookings Papers on Economic Activity, Fall 2011
0
–5
–10
–15
Average earnings loss relative to control group earningsc
Thousands of 2000 dollars
Thousands of 2000 dollars
45
40
35
30
–2 –1–4 0 1 2 4 6 8 10 12 14 16 18
–2 –1–4 0 1 2 4 6 8 10 12 14 16 18
Average annual earningsb
In expansions
In recessions
In expansions
In recessions
Years
Years
Displacement year
0
–30
–40
–10
Average earnings loss as a percent of predisplacement earningsd
–2 –1–4 0 1 2 4 6 8 10 12 14 16 18
In expansions
In recessions
Percent
–20
Years
Figure 4. Earnings of Displaced Male Workers before and after Displacementa
(continued)Davis & von Wachter (2011)
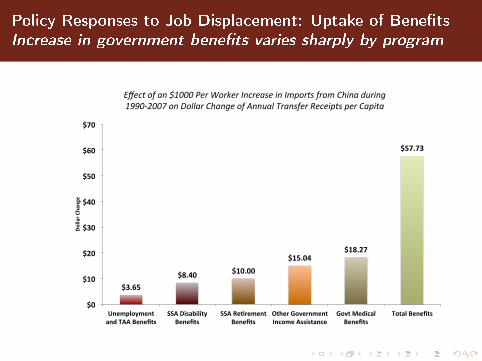
Policy Responses to Job Displacement: Uptake of Bene�ts
Increase in government bene�ts varies sharply by program
$3.65&$8.40& $10.00&
$15.04&$18.27&
$57.73&
$0&
$10&
$20&
$30&
$40&
$50&
$60&
$70&
Unemployment&and&TAA&Benefits&
SSA&Disability&Benefits&
SSA&ReRrement&Benefits&
Other&Government&Income&Assistance&
Govt&Medical&Benefits&
Total&Benefits&
Dollar&C
hange&&
Imports&from&China&and&Change&of&Government&Transfer&Receipts&in&CommuRng&Zones&(1990L2007)&&
&Effect&of&an&$1000&Per&Worker&Increase&in&Imports&from&China&during&1990=2007&on&Dollar&Change&of&Annual&Transfer&Receipts&per&Capita&

Adjustment Versus Steady State
The Short and Medium Run: Job Displacement
• Manufacturing pays less-educated males relatively high wages
• Job loss lowers marriage rates, raises fraction of kids in poverty,
increases drug-related mortality (Autor Dorn Hanson, Pierce Schott)
The Long Run: Gradual Adjustment
• In GE, gains from China Shock for US are positive but uneven
• Hsieh & Ossa, Caliendo Dvorkin & Parro, Galle Rodriguez-Clare Yi
• Possibly large reductions in goods price indexes (Jaravel & Sager)
• Unknown LR impacts on housing values, bene�ts uptake, social K

Advances in Empirical Methodology
Learning how to use Bartik shocks responsibly
• Validate orthogonality conditions, cluster SEs appropriately
• Borusyak Hull & Jaravel, Adão Kolesár & Morales,
Goldsmith-Pinkham Sorkin Swift
• Use RF and GE approaches iteratively
• (a) use RF model to identify adjustment margins; (b) build &
validate GE model, run counterfactuals; (c) re-evaluate RF results
• Are �relative� impacts of RF Bartik ∝ �absolute� GE impacts?
• Similar RF and GE employment impacts of trade shocks (Caliendo
Dvorkin Parro, Galle Rodriguez-Clare Yi, Adão Arkolakis Esposito)
• Updated prior: CZs are SOEs with limited labor mobility

Economic Consequences of Trade Policy
Douglas IrwinDartmouth College and NBER


US trade to GDP ratio, 1790‐2017

US trade to GDP ratio, 1790‐2017


Average US tariff on imports, 1790‐2017

Average US tariff on imports, 1790‐2017

Average US tariff on imports, 1790‐2017
80% due to inflation


Commerce Secretary Wilbur Ross


Research implications
• Global supply chains & downstream user effects
• Trade policy uncertainty
• When does retaliation work?
• Political economy models

US trade “shocks”

Number of antidumping cases filed
0
10
20
30
40
50
60
70
80
90
1970 1975 1980 1985 1990 1995 2000 2005 2010 2015 2020
Japan Shock China Shock


US Fair and Reciprocal Tariff Act
