economic contribution of the agricultural sector to the
TRANSCRIPT

Economic Contribution of the Agricultural Sector to the
Arkansas Economy in 2019
A R K A N S A S A G R I C U L T U R A L E X P E R I M E N T S T A T I O NAugust 2021 Research Report 1004
Leah English, Jennie Popp, and Wayne Miller

This publication is available on the internet at: https://aaes.uada.edu/communications/publications/
Technical editing and cover design by Gail Halleck.Photo Credit: An upland hardwood forest near the Livestock & Forestry Research Station in Batesville, Arkansas. Photo taken by Kerry Rodtnick, University of Arkansas System Division of Agriculture.
Arkansas Agricultural Experiment Station, University of Arkansas System Division of Agriculture, Fayetteville. Mark J. Cochran, Vice President for Agriculture; Jean-François Meullenet, AAES Director and Senior Associate Vice-President for Agriculture–Research. WWW/CC2021.The University of Arkansas System Division of Agriculture offers all its Extension and Research programs and services without regard to race, color, sex, gender identity, sexual orientation, national origin, religion, age, disability, marital or veteran status, genetic information, or any other legally protected status, and is an Affirmative Action/Equal Opportunity Employer.ISSN: 1539-5944 CODEN: AKABA7

Economic Contribution of the Agricultural Sector to the Arkansas
Economy in 2019
Leah English* Jennie Popp
Wayne Miller
University of Arkansas SystemDivision of Agriculture
Arkansas Agricultural Experiment StationFayetteville, Arkansas 72704
* Leah English is a Program Associate for the University of Arkansas System Division of Agriculture, Center for Agricultural and Rural Sustainability in Fayetteville; Jennie Popp is a Professor in the Department of Agricultural Economics and Agribusiness and Associate Dean in the Honors College in Fayetteville; and Wayne Miller is a Professor of Economic and Community Development with the University of Arkansas System Division of Agriculture, Cooperative Extension Service in Little Rock, Arkansas.
Contents
List of Tables, Boxes, and Appendices ....................................................................................................................................................... 3 Acknowledgments ........................................................................................................................................................................................ 3 Executive Summary ..................................................................................................................................................................................... 4 Definitions and Styles .................................................................................................................................................................................. 5
Agricultural Sectors ...................................................................................................................................................................... 5 Economic Contribution ............................................................................................................................................................... 5 Style Notes ..................................................................................................................................................................................... 6
1: Direct, Indirect, and Induced Contributions of the Aggregate Agriculture Sector ........................................................................ 7 1.1: Introduction .................................................................................................................................................................................. 7 1.2: Methods ......................................................................................................................................................................................... 7
1.2.1: General Procedures ........................................................................................................................................................... 8 1.2.2: Measures of Economic Contribution ............................................................................................................................. 9
1.3: The Aggregate Agriculture Sector ............................................................................................................................................ 10 1.4: Summary of the Contribution of Agriculture in 2019 .......................................................................................................... 12
Literature Cited ........................................................................................................................................................................................... 13 Appendix A: Description of IMPLAN Sectors and Aggregation Schemes......................................................................................... 15
AcknowledgmentsWe, the authors, would like to thank the Arkansas Division of Agriculture for funding this initiative. We also extend our
appreciation to several individuals in the University of Arkansas, Fayetteville, Departments of Horticulture and Poultry Science, as well as the Arkansas Forestry Commission, who offered their expertise for data collection and interpretation. We would like to thank our reviewers for their insightful input and suggestions. Finally, we sincerely appreciate Gail Halleck’s publishing skills and attention to detail.
- 3 -
Tables
T1. The Aggregate Agriculture Sector’s Contribution to Arkansas’ Economy, 2019 ...................................................................12
Boxes
B1. Total Contribution of Arkansas Agriculture, 2019 ....................................................................................................................11 B2. Employment Generated by Agriculture, 2019—Top Five NAICS Industries ........................................................................11 B3. Value Added Generated by Agriculture, 2019—Top Five NAICS Industries ........................................................................11 B4. Labor Income Generated by Agriculture, 2019—Top Five NAICS Industries ......................................................................11
Appendices
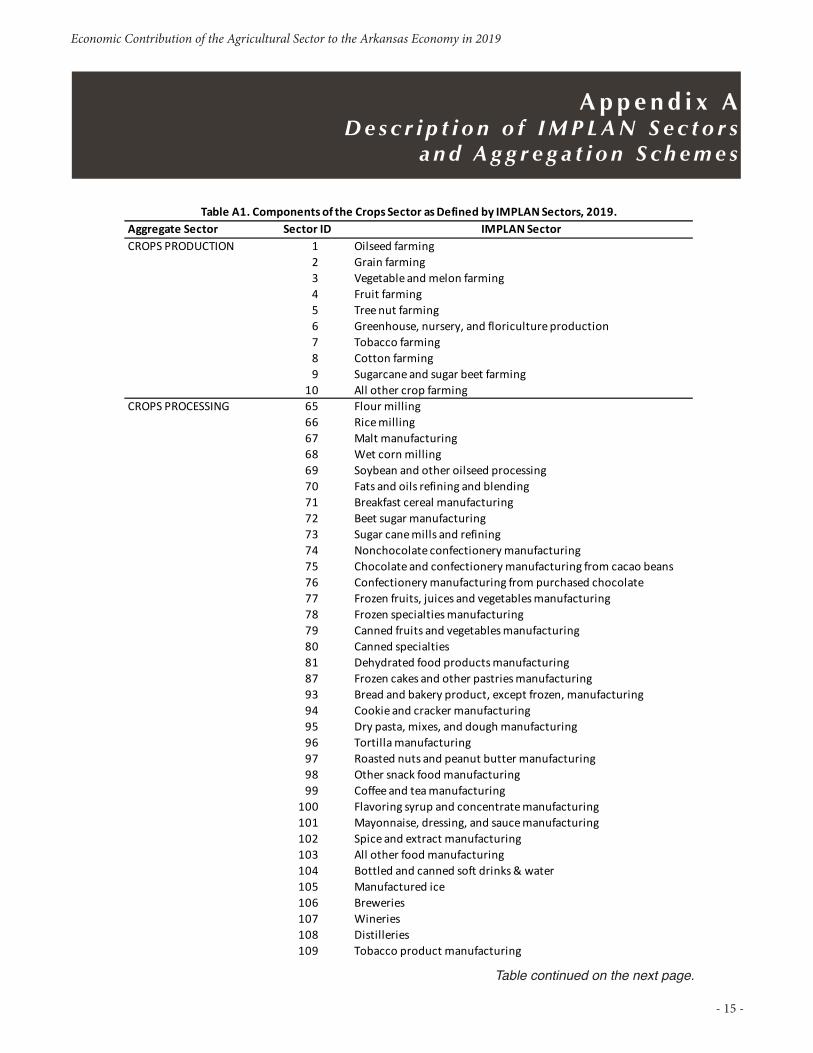
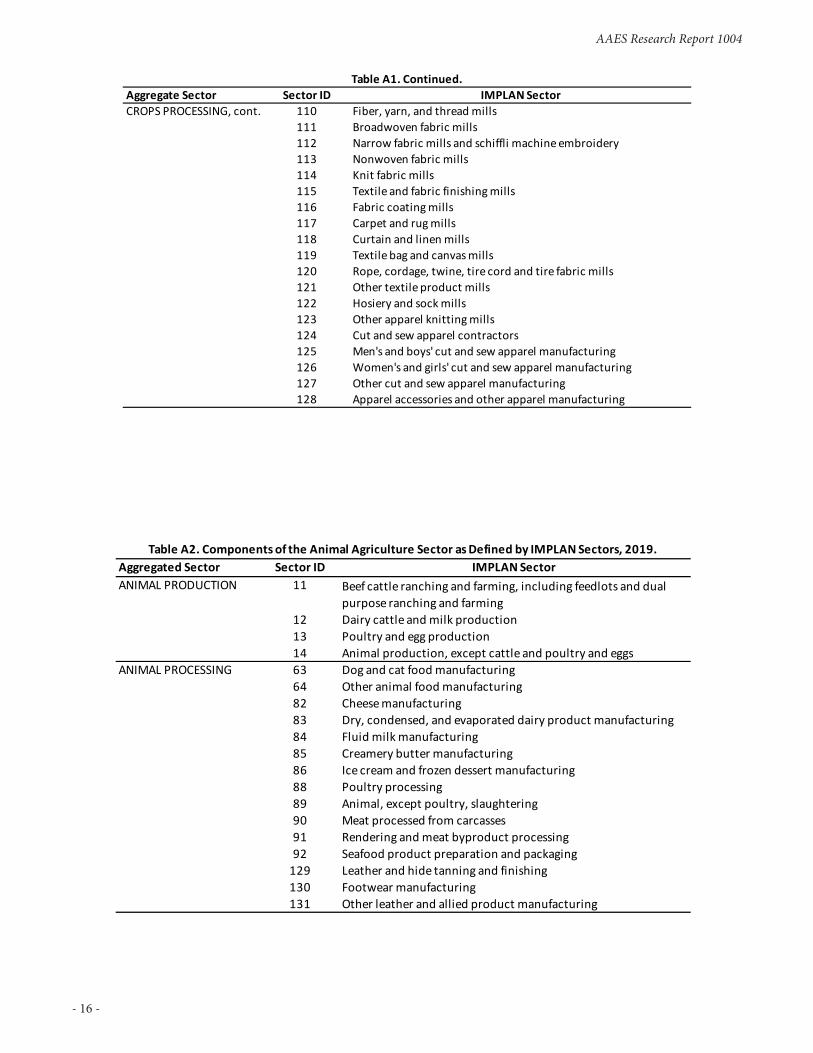
A1. Components of the Crops Sector as Defined by IMPLAN Sectors, 2019 ...............................................................................15 A2. Components of the Animal Agriculture Sector as Defined by IMPLAN Sectors, 2019 .......................................................16 A3. Components of the Forestry Sector as Defined by IMPLAN Sectors, 2019 ...........................................................................17 A4. Components of the Agriculture-Related Sector as Defined by IMPLAN Sectors, 2019 ......................................................17

AAES Research Report 1004
- 4 -
E x e c u t i v e S u m m a r y
Agriculture and associated agricultural activities are major contributors to the Arkansas economy. Agriculture is defined as the sum of agricultural production and processing activities, unless otherwise specified, and includes crop and animal produc-tion and processing, agricultural support industries, forestry and forest products, and textile goods. Agriculture contributes to the economy through direct agricultural production and value-added processing, leading to economic activity in other parts of the economy.
This report is the fourteenth in a series that examines agriculture’s economic contribution to the Arkansas economy. The total economic contribution of agriculture (direct, indirect, and induced effects) on value added, employment, and labor income was estimated with the Impact Analysis for Planning System (IMPLAN) for the most recent year available, 2019. Key findings of the IMPLAN analysis are as follows:
• Aggregate Agriculture contributed $19.4B in total value added to the state economy; this is $0.15 of every $1 in value generated in the state.
• Aggregate Agriculture accounted for 254,476 jobs, which is over 15.3% of all jobs in the state. Over one-half of these (144,928), or 8.9% of all state employment, are in the agriculture production, processing and agriculture-related industries.
• Aggregate Agriculture contributed $12.2B in labor income, or 15.0% of the state’s total labor income, including agriculture payrolls, which totaled $10.1B, or 13.9% of total state wages.
• Aggregate Agriculture generates value added, employment, and income in all 20 of the 2-digit NAICS aggregat-ed industries in the state. Almost half of agriculture’s contribution to value added occurs in industries closely tied to agriculture but not defined as part of the agriculture sector, such as Real Estate and Rental, Wholesale Trade, and Manufacturing.
Including direct, indirect, and induced effects, agriculture generates over one in seven jobs and almost 15% of value added in the state. The diversity of the state’s agriculture helps mitigate the effects of low world market prices or trade embargoes on commodities. Crops, animal agriculture, and forestry production and processing are all major contributors to agriculture and to the state’s economy. The large and diverse natural resource base of the state provides the opportunity for agriculture to change and develop new value added and bio-energy industries. The size and diversity of the state’s agriculture contribute greatly to the well-being of Arkansans and to the stability of the state’s economy.
Note: In some cases, numbers reported in this research report may be different than numbers reported in its companion document, the booklet Arkansas Agriculture Profile: Pocket Facts 2021 (English, Popp and Miller, 2021) due to rounding.

Economic Contribution of the Agricultural Sector to the Arkansas Economy in 2019
- 5 -
D e f i n i t i o n s a n d S t y l e s
Agricultural Sectors
Aggregate Agriculture consists of the Crops, Animal Agriculture, and Forestry Sectors’ production and processing industries, plus the Agriculture-Related Sector. See Appendix A, Tables A1–A4 for a complete listing of the sectors included.
The Crops Sector comprises those industries directly involved in crop production and processing. See Appendix A, Table A1 for a complete listing of the industries included.
The Animal Agriculture Sector comprises those industries directly involved in livestock production and processing. See Appendix A, Table A2 for a complete listing of the industries included.
The Forestry Sector comprises those industries directly involved in forestry production and processing. See Appendix A, Table A3, for a complete listing of the industries included.
The Agriculture-Related Sector comprises those industries that support the Crops, Animal Agriculture, and Forestry Sectors. See Appendix A, Table A4 for a complete listing of the industries included.
Note: No input providers (fertilizer, pesticide, and equipment manufacturers) or retail locations (restaurants, grocery stores, lawn and garden centers, etc.) are considered as direct contributors to the Aggregate Agriculture Sector in the contribution analysis. However, much or some of the economic activity in these firms is picked up as indirect and induced effects and reported as part of the total economic contribution.
Economic Contribution
The total economic contribution of the Aggregate Agriculture Sector includes three areas of wealth and job generation:
1. Direct Contributions are the sum of the contributions of farm production and processing of farm and forestry products.
2. Indirect Contributions result when agricultural firms purchase raw materials and services from other Arkansas businesses to produce their products.
3. Induced Contributions result when employees of agricultural firms and employees of the raw material and service firms spend a portion of their income on local purchases.
These contributions are reported in terms of Employment, Labor Income, and Value Added:
1. Employment includes all wage and salaried employees, as well as self-employed workers (owner-operators) in a given sector.
2. Labor Income consists of two parts: proprietary income and wages. Proprietary income includes all income re-ceived by self-employed individuals, such as private business owners, doctors, lawyers, or other professionals. Wages include all worker salaries, payments, and fringe benefits paid by employers.
3. Value Added includes labor income plus indirect taxes and other property-type income such as payments for rents, royalties, and dividends. Value added and Gross Domestic Product (GDP) are equivalent measures in theory but are estimated using different methods and data sources.
AAES Research Report 1004
- 6 -
Style Notes
Agricultural Sectors. These comprise the areas of focus in our study. Previous reports break down the Aggregate Agri-culture Sector into three areas of analysis: Crops Sector, Animal Agriculture Sector, and the Forestry Sector. However, due to inconsistencies in available data, these areas are no longer analyzed individually. In order to maintain the highest level of ac-curacy possible, only results for the Aggregate Agriculture Sector are presented in this report. These terms are capitalized and underlined throughout the text.
NAICS Sectors. The North American Industry Classification Scheme (NAICS) is “…the standard for use by Federal statisti-cal agencies in classifying business establishments for the collection, tabulation, presentation, and analysis of statistical data de-scribing the U.S. economy….For statistical purposes, a business establishment is assigned one NAICS code, based on its primary business activity” (USCB, 2017). This report uses the 2012 NAICS sectoring scheme (IMPLAN, 2017a). Agricultural activities are classified under, or can impact, multiple sectors. Throughout the document, capitalization of sectors is used when referring to NAICS sectors. Examples include Food Manufacturing, Paper Manufacturing, and Wood Product Manufacturing.
Industries. These are defined as individual IMPLAN industries that are defined by aggregating NAICS sectors into the larger IMPLAN industries used in our analysis. These industries are capitalized and italicized. Examples include Poultry and Egg Production and Paperboard Mills.
General Descriptive Terms. These are terms used throughout the text to describe agriculture areas that are not related to established industry classification schemes or specific agricultural sector titles used in this analysis. These terms are presented in lowercase. Examples include agricultural production and agricultural processing.

Economic Contribution of the Agricultural Sector to the Arkansas Economy in 2019
- 7 -
The total economic contribution of Arkansas’ Aggregate Agriculture Sector is much more than the direct contribution of agricultural production and processing. To measure agricul-ture’s total economic contribution, the indirect and induced contributions of agriculture must also be taken into considera- tion. Indirect contributions occur when the Aggregate Agri-culture Sector purchases goods and services from local busi-nesses. The production of fertilizers and certain farm machin-ery and equipment, for example, are indirect contributions of agricultural production. Agriculture’s induced contributions
1: Direct, Indirect, and Induced Contributions of the Aggregate
Agriculture Sector
1.1: I n t r o d u c t i o n
1.2: M e t h o d s
are measured by increases in economic activity due to personal consumption by employees of the Aggregate Agriculture Sec-tor and by employees of firms that provide inputs to the Ag-gregate Agriculture Sector. The sum of direct, indirect, and induced agricultural effects provides a measure for the total economic contribution of agriculture. This report discusses the overall economic contribution of agriculture to Arkansas’ economy, considering the direct, indirect, and induced effects of the Aggregate Agriculture Sector in 2019.
This report builds upon previous reports (Goodwin et al., 2002; Popp, Vickery, and Miller, 2005; Popp, Kemper, and Miller, 2007; Kemper, Popp, and Miller, 2009; Popp et al., 2010; McGraw, Popp, and Miller, 2011; McGraw, Popp, and Miller, 2012; English, Popp, and Miller, 2013, 2014, 2017, 2019, and 2020) and utilizes data for 2019, the most recent year that rel-evant IMPLAN data were available.
As in our previous reports, the economic contribution of Arkansas’ Aggregate Agriculture Sector was computed us-ing data and input-output (I-O) modeling software (IMPLAN version 3.1) from IMPLAN Group, LLC; formerly Minnesota IMPLAN Group, Inc. (MIG). Data here are reported for 2019 (IMPLAN, 2021). Contributions are reported in terms of em-ployment, labor income, and value added (introduced previous-ly and described in depth in section 1.3). The only sectors in-cluded as part of the Aggregate Agriculture Sector in the analysis are those directly producing agricultural products, processing raw agricultural products, or providing agricultural services to producers. Any sector less than 100% tied to agriculture (e.g., restaurants, grocery stores, fertilizer manufacturers, or distribu-tors) is not included as part of the Aggregate Agriculture Sector.
Aggregate Agriculture is broadly defined as the sum of Crops, Animal Agriculture, Forestry, and the Agriculture-Related Sectors. Aggregate Agriculture includes all of the IM-PLAN industries listed in Appendix A, Tables A1–A4. While
previous reports present individual contribution results for the Crops, Animal Agriculture, and Forestry sectors, inconsis-tencies in available data have limited the possibilities for accu-rately separating out these sectors. Therefore, the results of this study are presented only for the Aggregate Agriculture Sector.
The Aggregate Agriculture Sector, as defined in this study, is made up of three types of industries: agricultural produc-tion industries, agricultural processing industries, and agricul-ture-related industries. These industries are further defined in Appendix A. “Contribution analysis” typically describes that portion of a region’s economy that can be attributed to an existing industry, event, or policy by identifying all the di-rect and backward linkages in the study area (Alward, 2012). This contribution includes the direct, indirect, and induced effects of agricultural production, processing, and agriculture-related activities, excluding the direct effect of the food ser-vices and drinking industry. Although these and other non- agricultural industries are excluded from direct analysis, the in-direct and induced contributions of such sectors are included in the total contribution of agriculture results. These results are generally presented in terms of the Aggregate Agriculture Sector as a whole, but in some cases, may also be presented as individual production and processing contributions.
State-level IMPLAN data for Arkansas for 2019 (the most recent data available) were used to calculate all contributions

AAES Research Report 1004
- 8 -
1 Researchers are currently working to address these and other issues related to the contribution of agriculture analysis. For more information about this ongoing research, please email [email protected].
(IMPLAN, 2021). The relevant employment, labor income, and value added contributions of agriculture are summarized be-low. All labor income and value added figures are reported in current (nominal) 2019 dollars unless otherwise noted.
1.2.1 General Procedures
For the economic contribution analysis of the agriculture sector, the entire measure of economic activity in the industries that make up the Aggregate Agriculture Sector (crop, livestock, and forestry production and processing industries, and ag-relat-ed activities) are considered to be 100% agriculture. There are several key considerations in the construction of the IMPLAN I-O models used to measure the economic contribution of the Aggregate Agriculture Sector. For each step of the analysis, care- ful consideration is taken to ensure that the analysis accurate- ly reflects the Arkansas Aggregate Agriculture Sector. The main steps for constructing the model are baseline data analysis, set-ting up the model through the selection of a trade flows meth-od, multiplier specification, modifying commodity production and trade flows, setting up activities, and analyzing the scenario (IMPLAN, 2017b).
The Aggregate Agriculture Sector is made up of three broad categories: agricultural production, agricultural process-ing, and agricultural-related industries. The IMPLAN 2019 Ar-kansas state data package is used as the basis for this analysis. While IMPLAN is widely regarded as the industry standard for contribution and impact analysis, agricultural production data in IMPLAN are sometimes unreliable for three reasons. First, output data for all industries outside of agriculture are estimated from a large number of sources, but data for agricultural pro-duction are derived entirely from the U.S. Department of Ag-riculture’s National Agricultural Statistics Service (NASS), the U.S. Department of Agriculture’s Economic Research Service (ERS), and the most recent U.S. Census of Agriculture. Due to publication lags between sources, IMPLAN values may be based on preliminary estimates for a given year or otherwise derived from values published from previous years. A second data issue specific to agriculture is non-disclosure problems, particularly at the county level, which makes data reconcili- ation difficult. A third issue arises from the fact that employment and income data for the agriculture sectors are difficult to esti-mate. Employment and earnings data are currently only collected at an aggregate level, not on a commodity basis. Therefore, IM- PLAN must employ methods to extrapolate these values from
the aggregate state-level figures. In addition to these ongoing challenges, occasional updates to IMPLAN’s dataset develop-ment methodologies have been shown to cause large, unex-plainable shifts in sector values between individual data years. While IMPLAN maintains that their datasets are developed through methods generating the highest accuracy possible, they do encourage analysts with access to better agricultural data to update the baseline dataset, where applicable.
In previous reports, IMPLAN values were adjusted using available USDA NASS and ERS data. However, the discontinu-ation of reporting of some values by NASS and ERS has made this task increasingly difficult. For example, prior to 2013, ERS reported an annual cash receipt value for the Arkansas greenhouse and nursery industry. This value could be directly compared to IMPLAN’s greenhouse, nursery, and floriculture production industry (sector 6). As ERS has discontinued re-porting of this value, there is no longer a means of comparison for sector 6. The same can be seen with other specialty crop industries as NASS’s reporting for several commodities was discontinued beginning in 2016.
Upon analysis, it was concluded that, although there were unexplainable value shifts within IMPLAN’s individual agri-cultural production sectors, changes found in the Aggregate Agriculture Sector appeared reasonable. This makes sense as some calculation methods used by IMPLAN involve the distri-bution of an aggregate value to the various agricultural produc-tion sectors. This is especially true for employment. For the sake of accuracy, only values for the Aggregate Agriculture Sector are presented in this report, with no adjustments made to IM-PLAN’s provided dataset.1
Outside of baseline data issues, estimating trade flows across regional boundaries is possibly the largest source of error in non-survey I-O models (Stevens and Trainor, 1980). In previ-ous years, the Econometric RPC method was used to eliminate some of the errors. For this report, methods were updated to replace the Econometric RPC method with IMPLAN’s National Trade Flows Model. The National Trade Flows Model is a dou-bly constrained gravity model that’s balanced so that domestic imports and exports effectively “cancel out.” In other words, all sources of supply and demand are accounted for in the analysis.
Multipliers describe the response of an economy to a change in economic activity and estimate changes in output, em-ployment, income, and value added. When analyzing the eco-nomic contributions of the Aggregate Agriculture Sector, Type SAM (Social Accounting Matrix) multipliers are used to incor-

Economic Contribution of the Agricultural Sector to the Arkansas Economy in 2019
- 9 -
porate household expenditures into the models and to calculate the indirect and induced contributions. Type SAM multipliers are the direct, indirect, and induced effects, where the induced effect is based on both study area data and additional information in the social account matrix. The SAM framework tracks both mar-ket and non-market flows. Non-market flows are transactions between non-industrial institutions such as households to gov-ernment, government to households, and so on. These flows are called “inter-institutional transfers” (Alward and Lindall, 1996). The SAM multiplier approach enables the model to account for commuting, social security tax payments, household income tax payments, and savings; it accounts for income that is not nor-mally re-spent immediately within the region, such as commut-ing workers who live outside the region and retirement benefits. I-O models built with Type SAM multipliers usually have results that are lower than an I-O model built with Type II multipliers (also available in IMPLAN). However, the Type SAM is viewed as the most appropriate choice for analyzing contributions of the agriculture sector.
Within Type SAM analysis, institutions such as households, state and local government, federal government, enterprises, capital, and inventory additions/deletions may be chosen for in-ternalization within the model. In some previous reports, only the default “household” institutions were selected for analysis. Beginning in 2012, however, it was determined that state and local government should also be included. This addition serves to more accurately account for induced effects brought about through state and local government spending.
When conducting contribution analysis, IMPLAN allows the user to edit commodities produced by industries for the change in final demand. In this study, any byproduct com-modity produced in an industry included in the Aggregate Ag-riculture Sector was set to zero so the industry production of the primary commodity is 100%. Therefore, the industry is solely responsible for the entire value of the product being sold (e.g., the Oilseed Farming industry is solely responsible for the entire value of soybeans produced; soybeans are not produced in any other sector). By specifying that each agricultural industry only produces its primary commodity, no byproducts exist and there- fore no indirect or induced effects are calculated in the defined agricultural industries. In order to ensure that industry purchas-es do not exceed the amount specified, trade flows also must be modified. This is done by adjusting the Local Use Ratios (RSCs) for each agriculture sector to zero.
In order to measure the contribution of the Aggregate Agri-culture Sector, an industry change activity must first be created. Within this activity, events for each agriculture industry within
the Aggregate Agriculture Sector should be set. The year of each event is equal to the data year, and output values for each event should equal those provided for each sector by IMPLAN. When setting up events, it’s possible to change the portion of activity that accrues to the local (in this case, the state) economy by ed-iting the Local Purchase Percentages (LPPs) for each industry. Only the portion of an industry’s value that is produced locally should accrue to the local economy. For instance, output in the Oilseed Farming industry (sector 1) involves the LPP being set to 100%, which means the entire output value of that industry is accrued to the region because the goods in the industry are produced within the study region. Alternately, an activity mea-suring spending by tourists on gasoline and oil would involve setting the LPPs to the SAM value, an estimate of the actual percent of expenditures made in the study area. Estimating the economic contribution of the Aggregate Agriculture Sector to the state involves ensuring that the LPPs for each industry con-sidered part of the Aggregate Agriculture Sector are set to 100%.
1.2.2 Measures of Economic Contribution
Total economic contributions are made up of three sepa-rate components: 1) direct contributions: generated by farm production and processing of crops, poultry, livestock, and forest products; 2) indirect contributions: generated when agricultural firms purchase materials and services from other Arkansas businesses; and 3) induced contributions: result when employees of agricultural firms and their suppliers spend a portion of their income within Arkansas. Each of these contri-butions makes up an important part of the total economic contribution of the Arkansas agriculture sector. The overall definition of the Aggregate Agriculture Sector in this study is limited to only those sectors considered to be 100% tied to agriculture, as defined in Appendix A. However, the indi-rect and induced contributions measure the contributions of those industries that are linked to agriculture but may not be entirely defined as agriculture. These industries represent im-portant economic bases of many communities across the state and contribute to the jobs, income, and value added in these communities due to their relationships with agriculture. Be-cause sectors are interlinked throughout the state, expansion in activities in one sector may result in expansion in other sec- tors. Therefore, the contributions accruing in other sectors as a result of agricultural production and processing are included in the total economic contribution.
Economic contributions are often measured in terms of 1) total industry output, 2) wages and labor income (wages,

AAES Research Report 1004
- 10 -
1.3: Th e A g g r e g a t e A g r i c u l t u r e S e c t o r
In 2019, agriculture made substantial contributions to the Arkansas economy in terms of employment, labor income, wages, and value added (see Box 1). The Aggregate Agriculture Sector pro- vided 254,476 jobs, accounting for 15.3% of state employment. That is, more than one in seven Arkansas jobs can be attributed to agriculture. In that same year, agriculture paid $12.2B, or over 15.0% of state labor income. Wages accounted for $10.1B, or over 83% of total labor income generated by agriculture. Additionally, the Aggregate Agriculture Sector added $19.4B of value to the state economy, or 14.6% of state value added. That is, more than $1 out of every $7 in value added can be attributed to agriculture (Table 1).
Agriculture generates employment in all 20 of the 2-digit NAICS sectors. Over 71% of all agriculture-generated jobs are in five sectors: Manufacturing; Agriculture, Forestry, Fishing, and Hunting; Transportation and Warehousing; Healthcare and Social Assistance; and Wholesale Trade (Box 2).
The far-reaching contributions of agriculture are seen in the distribution of agriculture-generated value added through-out the economy. Box 3 shows the five sectors that benefit most from value added generated by agriculture. Note that three of those sectors (Wholesale Trade, Real Estate and Rental and Leas-ing, and Transportation and Warehousing) lie outside of the ag-riculture sector as defined in this study. Although half of all agriculture-generated value added accrues outside agricultural sectors, these sectors are closely tied to agriculture. For instance, Wholesale Trade contains businesses such as grain and livestock wholesalers as well as farm supply wholesalers.
As with value added, much of the income attributable to agricultural activity is generated outside of agricultural sectors. Box 4 shows the five sectors that generate the most income as the result of agricultural activity in Arkansas. In 2019, $5.5B, or 45% of all labor income, went to workers in non-agricultural sectors.
salaries, and proprietor income), 3) total value added, and 4) employment. I-O analysis can be used to assess the economic contribution of an existing sector. These measures are thought of as a sector’s gross contribution to the regional economy. This is accomplished by “removing” the sector of choice from the I-O model and examining how this removal affects the economic activity in the region. This provides an estimate of the contribution of the sector by looking at the losses experi-enced (or activity generated) by the sector of interest.
Employment includes all wage and salaried employees, as well as self-employed jobs in a given sector. All jobs are not equal; they pay different wages, require different skills and different work hours, etc., which makes aggregate estimates or comparisons across regions and industries problematic. How-ever, jobs as a measure of economic contribution are easily un-derstood and an important component of economic activity. Labor income consists of two parts: first is proprietary income, which includes all income received by self-employed individ-uals, including private business owners, owner-operators, etc.; second is wages, which includes all worker salaries, payments, and fringe benefits paid by employers. Value added represents all payments to workers (labor income) plus indirect taxes and other property-type income, such as payments for rents, roy-alties, and dividends. Value added is comparable to GDP by State but is measured using different data sources and methods,
so the data may not be precisely equal. Value added is the in-come and indirect business taxes generated by the activity and offers a more complete examination of the total economic con-tribution of an activity in a region; therefore, economists gen-erally prefer value added to output as the measure for assessing the contribution of a given industry or activity to a region’s economy (Olson and Lindall, 2009). Income and value added are also relatively clear measures of economic contribution that can be directly compared across industries and regions that contain a range of different economic activities.
Measuring the economic importance of an industry using output can be misleading. Output represents the dollar value of an industry’s total production but also can be thought of as the sum of the goods and services used to provide a product. Economic contribution analyses estimate the contribution of production (output) by including purchases from other indus-tries to produce the inputs required to create this output; there-fore, output includes the production of intermediate goods, which are included in another industry’s output. Summing the output of all industries would include multiple counting of some goods and services. Gross sales receipts overestimate the economic size of an industry because the values of inputs are recounted at each succeeding stage of production. As a result, output should not be used as a measure of economic contribu-tion and is not reported in this study.

Economic Contribution of the Agricultural Sector to the Arkansas Economy in 2019
- 11 -
Box 3. Value Added Generated by Agriculture, 2019 Top Five NAICS Industriesa
Manufacturing $7,882M
(98.38% of value added is in agricultural processing) Agriculture, Forestry, Fishing and Hunting
$1,994M (81.03% of the value added is in agricultural production)
Wholesale Trade $1,844M
Real Estate and Rental and Leasing $1,398M
Transportation and Warehousing $924M
Top Five Total $14,042M
(72.45% of all value added generated by Agriculture)aBased on 2-Digit NAICS aggregation (USCB, 2006). Source: IMPLAN (2021).Note: Presented in current dollars.
Box 1. Total Contribution of Arkansas Agriculture, 2019
Employment 254,476 jobs
(1 out of 7 Arkansas jobs) Wages
$10,098M (13.88% of Arkansas wages)
Labor Income $12,156M
(14.98% of Arkansas labor income) Value-Added $19,381M
($1 out of $7 Arkansas value added)
Source: IMPLAN (2021).NOTE: Presented in current dollars.
Box 2. Employment Generated by Agriculture, 2019 Top Five NAICS Industriesa
Manufacturing 82,394 jobs
(98.9% of the jobs are in agricultural processing) Agriculture, Forestry, Fishing and Hunting
63,437 jobs (83.27% of the jobs are in agricultural production)
Transportation and Warehousing 12,440 jobs
Health Care and Social Assistance 12,241 jobs
Wholesale Trade 10,962 jobs
Top Five Total 181,474 jobs
(71.31% of all jobs generated by Agriculture)aBased on 2-Digit NAICS aggregation (USCB, 2006).Source: IMPLAN (2021).Note: presented in current dollars.
Box 4. Labor Income Generated by Agriculture, 2019 Top Five NAICS Industriesa
Manufacturing $4,530M
(98.7% of labor income is in agricultural processing) Agriculture, Forestry, Fishing and Hunting
$2,187M (83.32% of labor income is in agricultural production)
Wholesale Trade $872M
Transportation and Warehousing $694M
Health Care and Social Assistance $692M
Top Five Total $8,974M
(73.83% of all labor income generated by Agriculture)aBased on 2-Digit NAICS aggregation (USCB, 2006).Source: IMPLAN (2021).Note: Presented in current dollars.
AAES Research Report 1004
- 12 -
Number of Jobs % Total
% Total Arkansas
Jobs Million $ % Total
% Total Arkansas Labor
Income Million $ % Total
% Total Arkansas Value
Added52,825 20.8 3.2 1,822 15.0 2.2 1,616 8.3 1.281,491 32.0
% 4.9%
4,471 36.8%
5.5%
7,754 40.0%
5.8%10,613 4.2
% 0.6%
365 3.0%
0.4%
378 2.0%
0.3%144,928 57.0 8.7 6,658 54.8 8.2 9,748 50.3 7.3
49,873 19.6 3.0 2,928 24.1 3.6 5,037 26.0 3.8194,801 76.6 11.7 9,586 78.9 11.8 14,785 76.3 11.1
59,674 23.4 3.6 2,570 21.1 3.2 4,597 23.7 3.5254,476 100.0 15.3 12,156 100.0 15.0 19,381 100.0 14.6
a
b
c
d
e
f
Contribution
Appendix A, Tables A1–A3 list sectors of direct agricultural production in terms of IMPLAN sectors.Appendix A, Tables A1–A3 list sectors of direct agricultural processing in terms of IMPLAN sectors.Ag-related sectors include agricultural sectors not categorized as agricultural production or processing. Appendix A, Table A4 lists sectors of direct ag-related activity in terms of IMPLAN sectors.
Induced EffectsTotal Contribution
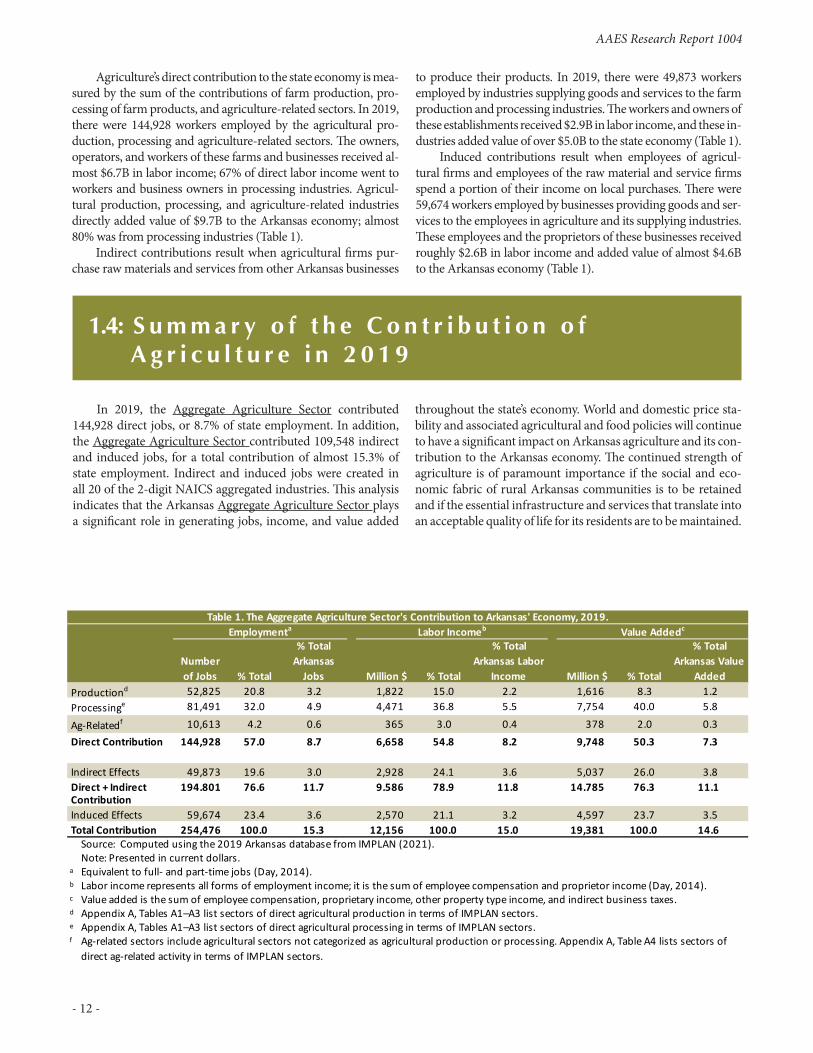
Table 1. The Aggregate Agriculture Sector's Contribution to Arkansas' Economy, 2019.
Equivalent to full- and part-time jobs (Day, 2014).Labor income represents all forms of employment income; it is the sum of employee compensation and proprietor income (Day, 2014).Value added is the sum of employee compensation, proprietary income, other property type income, and indirect business taxes.
Employmenta Labor Incomeb Value Addedc
Source: Computed using the 2019 Arkansas database from IMPLAN (2021).
Productiond
Processinge
Ag-Relatedf
Direct Contribution
Indirect EffectsDirect + Indirect
Note: Presented in current dollars.
Agriculture’s direct contribution to the state economy is mea-sured by the sum of the contributions of farm production, pro-cessing of farm products, and agriculture-related sectors. In 2019, there were 144,928 workers employed by the agricultural pro- duction, processing and agriculture-related sectors. The owners, operators, and workers of these farms and businesses received al-most $6.7B in labor income; 67% of direct labor income went to workers and business owners in processing industries. Agricul-tural production, processing, and agriculture-related industries directly added value of $9.7B to the Arkansas economy; almost 80% was from processing industries (Table 1).
Indirect contributions result when agricultural firms pur-chase raw materials and services from other Arkansas businesses
to produce their products. In 2019, there were 49,873 workers employed by industries supplying goods and services to the farm production and processing industries. The workers and owners of these establishments received $2.9B in labor income, and these in- dustries added value of over $5.0B to the state economy (Table 1).
Induced contributions result when employees of agricul-tural firms and employees of the raw material and service firms spend a portion of their income on local purchases. There were 59,674 workers employed by businesses providing goods and ser-vices to the employees in agriculture and its supplying industries. These employees and the proprietors of these businesses received roughly $2.6B in labor income and added value of almost $4.6B to the Arkansas economy (Table 1).
In 2019, the Aggregate Agriculture Sector contributed 144,928 direct jobs, or 8.7% of state employment. In addition, the Aggregate Agriculture Sector contributed 109,548 indirect and induced jobs, for a total contribution of almost 15.3% of state employment. Indirect and induced jobs were created in all 20 of the 2-digit NAICS aggregated industries. This analysis indicates that the Arkansas Aggregate Agriculture Sector plays a significant role in generating jobs, income, and value added
throughout the state’s economy. World and domestic price sta- bility and associated agricultural and food policies will continue to have a significant impact on Arkansas agriculture and its con-tribution to the Arkansas economy. The continued strength of agriculture is of paramount importance if the social and eco-nomic fabric of rural Arkansas communities is to be retained and if the essential infrastructure and services that translate into an acceptable quality of life for its residents are to be maintained.
1.4: S u m m a r y o f t h e C o n t r i b u t i o n o f A g r i c u l t u r e i n 2 0 1 9

Economic Contribution of the Agricultural Sector to the Arkansas Economy in 2019
- 13 -
Alward, A. 2012. “Estimating the contribution of a current in-dustry using IMPLAN version 3.0.” MIG (Minnesota IM-PLAN Group, Inc.).
Alward, G. and Lindall, S. 1996. “Deriving SAM multiplier models using IMPLAN.” Paper presented at 1996 IMPLAN user conference.
Day, F. 2014. “Principles of Impact Analysis and IMPLAN Ap-plications”; IMPLAN Group, LLC, 16740 Birkdale Com-mons Parkway, Suite 206, Huntersville, N.C.
English, L., J. Popp, and W. Miller. 2013. Economic contribu-tion of the agricultural sector to the Arkansas economy in 2011. Research Report 992. Arkansas Agricultural Experi-ment Station University of Arkansas System Division of Agriculture; Fayetteville, Arkansas. Accessed: 10 July 2021. https://agcomm.uark.edu/economic-impact/992.pdf
English, L., J. Popp, and W. Miller. 2014. Economic contribu-tion of the agricultural sector to the Arkansas economy in 2012 Research Report 994. Arkansas Agricultural Experi-ment Station. University of Arkansas System Division of Agriculture; Fayetteville, Arkansas. Accessed: 10 July 2021. https://agcomm.uark.edu/economic-impact/994.pdf
English, L., J. Popp, and W. Miller. 2017. Economic contri-bution of the agricultural sector to the Arkansas economy in 2015. Research Report 998. Arkansas Agricultural Ex-periment Station University of Arkansas System Division of Agriculture; Fayetteville, Arkansas. Accessed: 10 July 2021. https://agcomm.uark.edu/economic-impact/998.pdf
English, L., J. Popp, and W. Miller. 2019. Economic contri-bution of the agricultural sector to the Arkansas economy in 2017. Research Report 999. Arkansas Agricultural Ex-periment Station University of Arkansas System Division of Agriculture; Fayetteville, Arkansas. Accessed: 10 July 2021. https://agcomm.uark.edu/economic-impact/999.pdf
English, L., J. Popp, and W. Miller. 2020. Economic contri-bution of the agricultural sector to the Arkansas economy in 2018. Research Report 1000. Arkansas Agricultural Ex-periment Station University of Arkansas System Division of Agriculture; Fayetteville, Arkansas. Accessed: 10 July 2021. https://agcomm.uark.edu/economic-impact/1000.pdf
English, L., J. Popp, and W. Miller. 2021. Arkansas Agriculture Profile: Pocket Facts 2021. Arkansas Agricultural Experi-ment Station University of Arkansas System Division of Agriculture; Fayetteville, Arkansas. https://economic-im-pact-of-ag.uark.edu/arkansas/
Goodwin, H.L., J. Popp, W. Miller, G. Vickery, and Z. Clayton–Neiderman. 2002. Impact of the agricultural sector on the Arkansas economy. Research Report 969. Arkansas Agri-cultural Experiment Station University of Arkansas Sys-tem Division of Agriculture, Fayetteville. Accessed: 10 July 2021. https://agcomm.uark.edu/economic-impact/969.pdf
IMPLAN (IMPLAN Group, LLC). 2017a. “IMPLAN Industry Sectoring.” Accessed: 10 July 2021. https://implanhelp.zendesk .com/hc/en-us/articles/115009674668-Sectoring-Schemes
IMPLAN (IMPLAN Group, LLC). 2017b. IMPLAN Analysis—Frequently Asked Questions: Estimating the Contribution of a Current Industry. Accessed: 10 July 2021. https://implan-
help.zendesk.com/hc/en-us/articles/115009542247-Multi-Industry-Contribution-Analysis
IMPLAN (IMPLAN Group, LLC). 2021. IMPLAN System data and software): 2019 data for the state of Arkansas. 16740 Birkdale Commons Parkway, Suite 206, Huntersville, N.C. www.IMPLAN.com
Kemper, N., J. Popp, and W. Miller. 2009. Economic contribu-tion of the agriculture sector to the Arkansas economy in 2007 and revised estimates for 2006. Research Report 987. Arkan-sas Agricultural Experiment Station Division of Agriculture, Fayetteville. Accessed: 10 July 2021. https://agcomm.uark.edu/economic-impact/987.pdf
McGraw, K., J. Popp, and W. Miller. 2011. Economic contribution of the agriculture sector to the Arkansas economy in 2009. Research Report 990. Arkansas Agricultural Experiment Station University of Arkansas System Division of Agricul-ture, Fayetteville. Accessed: 10 July 2021. https://agcomm.uark.edu/economic-impact/990.pdf
McGraw, K., J. Popp, and W. Miller. 2012. Economic contribution of the agriculture sector to the Arkansas economy in 2010. Research Report 991. Arkansas Agricultural Experiment Station University of Arkansas System Division of Agricul-ture, Fayetteville. Accessed: 10 July 2021. https://agcomm.uark.edu/economic-impact/991.pdf
Miller, W. and Y Soto. 1999. Contribution of Agriculture to the Arkansas Economy. Special Report 196. Arkansas Ag-ricultural Experiment Station University of Arkansas Sys-tem Division of Agriculture, Fayetteville, Arkansas. http://economic-impact-of-ag.com/AR//1999-Report-Contribu-tion_of_Agriculture_to_the_Arkansas_Economy.pdf
Olson, D. and S. Lindall. 2009. IMPLAN Professional Ver-sion 2.0 Software, Analysis, and Data Guide. Minnesota IMPLAN Group, Inc. Stillwater, Minn.
Popp, J., N. Kemper, and W. Miller. 2007. Impact of the agri-cultural sector on the Arkansas economy in 2003. Research Report 981. Arkansas Agricultural Experiment Station Uni-versity of Arkansas System Division of Agriculture, Fayette-ville, Arkansas. Accessed: 10 July 2021. https://agcomm.uark.edu/economic-impact/981.pdf
Popp, J., N. Kemper, W. Miller, K. McGraw, and K. Karr. 2010. The economic contribution of the agricultural sector to the Arkansas economy in 2008. Research Report 989. Arkan-sas Agricultural Experiment Station University of Arkansas System Division of Agriculture, Fayetteville, Arkansas. Ac-cessed: 10 July 2021. https://agcomm.uark.edu/economic-impact/989.pdf
Popp, J., G. Vickery, and W. Miller. 2005. Impact of the agri-cultural sector on the Arkansas economy in 2001. Research Report 975. Arkansas Agricultural Experiment Station Uni-versity of Arkansas System Division of Agriculture, Fayette-ville, Arkansas. Accessed: 10 July 2021. https://agcomm.uark.edu/economic-impact/975.pdf.
Stevens, B. and G. Trainor. 1980. “Error generation on regional input-output analysis and its implications for non-survey models.” In: Economic impact analysis: Methodology and applications, ed. S. Pleeter, 68-79. Amsterdam: Marinus Ni-
L i t e r a t u r e C i t e d

AAES Research Report 1004
- 14 -
jhoff. Accessed 10 July 2021. http://link.springer.com/chapter /10.1007/978-94-011- 7405-3_5
USCB (U.S. Census Bureau). 2014. 2012. North American Clas-sification System (NAICS). Accessed 10 July 2021. https://www.census.gov/naics/
USCB (U.S. Census Bureau). 2017. “North American Industry Classification System Frequently asked questions (FAQs).” Accessed 10 July 2021. http://www.census.gov/eos/www/na-ics/faqs/faqs.html#q1
Economic Contribution of the Agricultural Sector to the Arkansas Economy in 2019
- 15 -
A p p e n d i x A D e s c r i p t i o n o f I M P L A N S e c t o r s
a n d A g g r e g a t i o n S c h e m e s
Table continued on the next page.
Aggregate Sector Sector ID IMPLAN SectorCROPS PRODUCTION 1 Oilseed farming
2 Grain farming 3 Vegetable and melon farming 4 Fruit farming 5 Tree nut farming 6 Greenhouse, nursery, and floriculture production7 Tobacco farming 8 Cotton farming9 Sugarcane and sugar beet farming
10 All other crop farming CROPS PROCESSING 65 Flour milling
66 Rice milling67 Malt manufacturing68 Wet corn milling69 Soybean and other oilseed processing70 Fats and oils refining and blending71 Breakfast cereal manufacturing72 Beet sugar manufacturing73 Sugar cane mills and refining74 Nonchocolate confectionery manufacturing75 Chocolate and confectionery manufacturing from cacao beans76 Confectionery manufacturing from purchased chocolate77 Frozen fruits, juices and vegetables manufacturing78 Frozen specialties manufacturing79 Canned fruits and vegetables manufacturing80 Canned specialties81 Dehydrated food products manufacturing87 Frozen cakes and other pastries manufacturing93 Bread and bakery product, except frozen, manufacturing94 Cookie and cracker manufacturing95 Dry pasta, mixes, and dough manufacturing96 Tortilla manufacturing97 Roasted nuts and peanut butter manufacturing98 Other snack food manufacturing99 Coffee and tea manufacturing
100 Flavoring syrup and concentrate manufacturing101 Mayonnaise, dressing, and sauce manufacturing102 Spice and extract manufacturing103 All other food manufacturing104 Bottled and canned soft drinks & water105 Manufactured ice106 Breweries107 Wineries108 Distilleries109 Tobacco product manufacturing
Table A1. Components of the Crops Sector as Defined by IMPLAN Sectors, 2019.
AAES Research Report 1004
- 16 -
Aggregate Sector Sector ID IMPLAN SectorCROPS PROCESSING, cont. 110 Fiber, yarn, and thread mills
111 Broadwoven fabric mills112 Narrow fabric mills and schiffli machine embroidery113 Nonwoven fabric mills114 Knit fabric mills115 Textile and fabric finishing mills116 Fabric coating mills117 Carpet and rug mills118 Curtain and linen mills119 Textile bag and canvas mills120 Rope, cordage, twine, tire cord and tire fabric mills121 Other textile product mills122 Hosiery and sock mills123 Other apparel knitting mills124 Cut and sew apparel contractors125 Men's and boys' cut and sew apparel manufacturing126 Women's and girls' cut and sew apparel manufacturing127 Other cut and sew apparel manufacturing128 Apparel accessories and other apparel manufacturing
Table A1. Continued.
Aggregated Sector Sector ID IMPLAN Sector11 Beef cattle ranching and farming, including feedlots and dual
purpose ranching and farming 12 Dairy cattle and milk production13 Poultry and egg production14 Animal production, except cattle and poultry and eggs63 Dog and cat food manufacturing64 Other animal food manufacturing82 Cheese manufacturing83 Dry, condensed, and evaporated dairy product manufacturing84 Fluid milk manufacturing85 Creamery butter manufacturing86 Ice cream and frozen dessert manufacturing88 Poultry processing89 Animal, except poultry, slaughtering90 Meat processed from carcasses91 Rendering and meat byproduct processing92 Seafood product preparation and packaging
129 Leather and hide tanning and finishing130 Footwear manufacturing131 Other leather and allied product manufacturing
ANIMAL PRODUCTION
ANIMAL PROCESSING
Table A2. Components of the Animal Agriculture Sector as Defined by IMPLAN Sectors, 2019.

Economic Contribution of the Agricultural Sector to the Arkansas Economy in 2019
- 17 -
Aggregated Sector Sector ID IMPLAN Sector15 Forestry, forest products, and timber tract production 16 Commercial logging
132 Sawmills133 Wood preservation134 Veneer and plywood manufacturing135 Engineered wood member and truss manufacturing136 Reconstituted wood product manufacturing137 Wood windows and door manufacturing138 Cut stock, resawing lumber, and planing139 Other millwork, including flooring140 Wood container and pallet manufacturing141 Manufactured home (mobile home) manufacturing142 Prefabricated wood building manufacturing143 All other miscellaneous wood product manufacturing144 Pulp mills145 Paper mills146 Paperboard mills147 Paperboard container manufacturing148 Paper bag and coated and treated paper manufacturing149 Stationery product manufacturing150 Sanitary paper product manufacturing151 All other converted paper product manufacturing365 Wood kitchen cabinet and countertop manufacturing366 Upholstered household furniture manufacturing367 Nonupholstered wood household furniture manufacturing369 Institutional furniture manufacturing370 Wood office furniture manufacturing371 Custom architectural woodwork and millwork373 Showcase, partition, shelving, and locker manufacturing
FORESTRY PRODUCTION
FORESTRY PROCESSING
Table A3. Components of the Forestry Sector as Defined by IMPLAN Sectors, 2019.
Aggregated Sector Sector ID IMPLAN Sector17 Commercial fishing 18 Commercial hunting and trapping 19 Support activities for agriculture and forestry
AGRICULTURE-RELATED
Table A4. Components of the Agriculture-Related Sector as Defined by IMPLAN Sectors, 2019.
