economic costs and benefits of the trans mountain
TRANSCRIPT
Economic Costs and Benefits of the Trans Mountain Expansion Project (TMX)
for BC and Metro Vancouver
Ian Goodman and Brigid Rowan, The Goodman Group, Ltd., in Collaboration with
The Centre for Public Policy Research, Simon Fraser University
SCHOOL OF PUBLIC POLICY www.sfu.ca/mpp www.thegoodman.com
November 10, 2014
Rereleased February 4, 2015
SCHOOL OF PUBLIC POLICY
Economic Costs and Benefits of the Trans Mountain Expansion Project (TMX)
for BC and Metro Vancouver ii
Table of Contents
1 Executive Summary ........................................................................................................ 1
1.1 Figures ...............................................................................................................................4
2 Methodology: Economic Cost-Benefit Analysis ............................................................. 10
3 Economic Benefits of TMX for BC and Metro Vancouver ............................................... 13
3.1 Introduction .................................................................................................................... 13
3.2 Building TMX: Short-term employment benefits for BC ..................................................... 14
3.2.1 Jobs including Spin-offs: KM/TMP Estimate ......................................................................... 14
3.2.2 Jobs with Spin-offs vs. Direct Construction Workforce ......................................................... 15
3.2.3 Jobs including Spin-offs: SFU-TGG Initial Estimate................................................................ 16
3.2.4 Jobs including Spin-offs: SFU-TGG Final Estimate ................................................................. 18
3.3 Building TMX: Short-term employment benefits for Metro Vancouver .............................. 20
3.3.1 Jobs including Spin-offs: KM/TMP Estimate ......................................................................... 20
3.3.2 Jobs with Spin-offs vs. Direct Construction Workforce: KM/TMP Estimate ......................... 21
3.3.3 Jobs including Spin-offs: SFU-TGG Initial Estimate................................................................ 21
3.3.4 Jobs including Spin-offs: SFU-TGG Final Estimate ................................................................. 22
3.4 Operating TMX: Long-term employment benefits for BC and Metro Vancouver ................. 22
3.4.1 Jobs Including Spin-offs: KM/TMP Estimate ......................................................................... 23
3.4.2 Jobs with Spin-offs vs. Direct Operating Workforce ............................................................. 24
3.4.3 Jobs including Spin-offs: SFU-TGG Estimate ......................................................................... 26
3.5 Operating TMX: Long-term Municipal Tax Benefits for BC and Metro Vancouver ............... 28
3.6 Fiscal benefits for governments ........................................................................................ 30
3.6.1 Building TMX ......................................................................................................................... 31
3.6.2 Operating TMX ...................................................................................................................... 33
3.6.3 Increased Revenues for Crude Producers ............................................................................. 34
3.7 BC Share of TMX Benefits ................................................................................................. 38
3.7.1 Building TMX ......................................................................................................................... 39
3.7.2 Operating TMX ...................................................................................................................... 41
3.7.3 Increased Revenues for Crude Producers ............................................................................. 43
3.7.4 Conclusions ........................................................................................................................... 44
4 Economic Costs/Risks of TMX for BC and Metro Vancouver .......................................... 46
4.1 Range of Bad-to-Worst-Case Scenario Costs for an Onshore Spill ....................................... 46
4.2 Concentration of Current and Future Risks in Metro Vancouver ........................................ 54
4.3 Costs for a Marine Spill .................................................................................................... 56
4.4 KM/TMP's C$170-$316 Million Estimate for Worst-Case Scenario is Far Too Low ............... 58
SCHOOL OF PUBLIC POLICY
Economic Costs and Benefits of the Trans Mountain Expansion Project (TMX)
for BC and Metro Vancouver iii
4.5 Concerns about KM/TMP's Capability to Cover Damages in a Worst-Case Scenario ............ 63
5 Comparisons of Costs and Benefits: A Summary ........................................................... 66
5.1 Results of Sections 3 (Benefits) and 4 (Costs) .................................................................... 66
5.2 Under a Range of Bad to Worst-Case Scenarios, Costs Will Exceed Benefits ....................... 68
5.3 Highly Uneven Allocation of Costs and Benefits ................................................................ 69
5.4 Key Questions to Guide Decision-Making .......................................................................... 70
5.5 Recommendation ............................................................................................................ 71
SCHOOL OF PUBLIC POLICY
Economic Costs and Benefits of the Trans Mountain Expansion Project (TMX)
for BC and Metro Vancouver iv
Economic Costs and Benefits of the Trans Mountain Expansion Project (TMX) for BC and
Metro Vancouver
Ian Goodman and Brigid Rowan, The Goodman Group, Ltd., in collaboration with The Centre for Public
Policy Research, Simon Fraser University, February 2015
© 2015 The Centre for Public Policy Research, Simon Fraser University and The Goodman Group, Ltd.
All rights reserved. This document may be reproduced or quoted freely, in whole or in part for non-
commercial purposes, provided the source is mentioned.
How to cite this report:
Goodman, Ian and Rowan, Brigid, The Goodman Group, Ltd., in collaboration with The Centre for Public
Policy Research, Simon Fraser University. Economic Costs and Benefits of the Trans Mountain
Expansion Project (TMX) for BC and Metro Vancouver.
You can download this document from the SFU School of Public Policy website:
http://www.sfu.ca/mpp.html
This report was originally released in November 2014. The February 2015 rerelease includes corrections
of typographical errors and some additional citations.
About Simon Fraser University, Centre for Public Policy Research (CPPR)
The Centre for Public Policy Research (CPPR) is the research arm of the Simon Fraser University School
of Public Policy. The CPPR promotes interdisciplinary research, education, and dialogue on a broad
range of public policy issues in Canada.
Doug McArthur is Professor and Director of Graduate School of Public Policy at Simon Fraser University.
Prior to joining SFU’s Public Policy Program in 2003, McArthur was Senior Fellow in Public Policy at the
University of British Columbia. His public service career has included senior roles with the British
Columbia, Saskatchewan and Yukon Governments. Doug has served as Deputy Minister to the Premier
and Cabinet Secretary in BC, Deputy Minister of Aboriginal Affairs in BC, Chief Land Claims Negotiator in
the Yukon, as well as two posts in Saskatchewan as Deputy Minister of Agriculture and Deputy Minister
of Northern Saskatchewan. He was Minister of Education in Saskatchewan from 1978 to 1982 and Chair
of the Canadian Council of Ministers of Education.
About The Goodman Group, Ltd. (TGG)
The Goodman Group, Ltd. is a consulting firm specializing in energy and regulatory economics. Since
1989, TGG has consulted and conducted economic research across a broad range of issues. Their North
American-wide client base includes energy sector companies, regulators, government, customer groups,
and environmental and indigenous groups. One of TGG's key areas of expertise is economic
development analysis (including employment impacts) of energy projects. In recent years, TGG has
published several influential and widely publicized studies on the economic costs and benefits of various
crude oil pipelines in North America. California-based Ian Goodman, the President and founder of The
Goodman Group Ltd., and Ottawa-based Brigid Rowan have over 55 years of experience in the areas of
energy and regulatory economics.
SCHOOL OF PUBLIC POLICY
Economic Costs and Benefits of the Trans Mountain Expansion Project (TMX)
for BC and Metro Vancouver v
Preface
The mandate of the Centre for Public Policy Research, the research centre of the School of Public Policy of Simon Fraser University in Vancouver, is to support and encourage research based analysis and public dialogue on important public policy issues. Collaboration with experts from outside Simon Fraser University and widespread dissemination of results, in keeping with the University's stated mission of collaborative research, knowledge mobilization and community engagement on policy, play an important role in the Centre's work. Perhaps no contemporary public policy issue is of greater importance to SFU's local and regional communities, as well as the people of the province generally, than that of pipelines proposed to carry resource products across the breadth and length of the province. This report and the associated public debate, which it stimulates, will make an important contribution to further understanding the actual benefits and costs of Kinder Morgan's Trans Mountain Expansion Project now being assessed by citizens, communities and government agencies, including the National Energy Board (NEB). Assessments of energy and pipeline projects are methodologically complicated. Further accessing and analyzing data is often a challenge requiring highly specialized experts in the field. Given this, and consistent with the University's commitment to collaboration, the School of Public Policy is very fortunate to be able to undertake this study as a collaboration with two experts from The Goodman Group, Ltd. (TGG) of Berkeley California. TGG is a leader in carrying out facts-based economic analyses of energy projects (including major pipeline projects) and is well known for providing expert testimony to energy regulatory bodies throughout North America. I thank them for the time and dedication they have given to this study, which I have observed first hand. Their incredible commitment to objectivity, their care and attention to methodology and factual data, and their dedication as reflected in long hours beyond the call - all have impressed me and given me great confidence in our findings as detailed in the SFU-TGG Report. The report carefully and objectively reviews the facts and evidence provided by the company publicly and to the NEB. The findings and conclusions are quite different from those of the company. These results are an important input to a thorough and informed decision on the Kinder Morgan pipeline. The report is thus being widely distributed as a contribution to that complex task. It is my hope that this report will contribute to an informed, community-engaged process of debate and dialogue on this important policy issue. Doug McArthur, Professor, School of Public Policy, Simon Fraser University,
Vancouver, British Columbia
SCHOOL OF PUBLIC POLICY
Economic Costs and Benefits of the Trans Mountain Expansion Project (TMX) for BC and Metro Vancouver 1
1 Executive Summary
The SFU-TGG Report ("the Report") on the economic costs and benefits of the Trans
Mountain Expansion Project (TMX) for BC and Metro Vancouver estimates the
economic benefits of the proposed project and then compares these benefits to a range
of potential costs of bad to worst-case scenarios. The purpose of this Report is to
provide an independent assessment for decision-makers and the citizens of BC and
Metro Vancouver. Particularly, the Report provides guidance as to whether TMX is in
the public and economic interest of BC and Metro Vancouver. The key findings of the
SFU-TGG Report are the following:
1. Benefits: The employment, property tax and fiscal benefits of TMX are very
small in the context of the overall provincial economy and significantly
overstated by KM/TMP (Kinder Morgan/Trans Mountain Pipeline).1 (See
Figures 1 to 4 and Section 3.)
KM/TMP has exaggerated the short-term jobs associated with building the
pipeline by a factor of three. Kinder Morgan maintains that building TMX will
create 36,000 person-years of employment in BC (including a wide range of spin-
offs). But the Report has determined that TMX will only create 12,000 person-
years or less over the three-year period for construction and related activity -
equivalent to 4000 jobs/year (or less). This is less than 0.2% of the total
provincial employment. Similarly, for Metro Vancouver, the Report has
determined that building TMX will only create 6,000 person-years or less over
this period - equivalent to 2000 jobs/year (or less). This is substantially less than
0.2% of the total regional employment.
In terms of long-term jobs, Kinder Morgan estimates that operating TMX will
create only 50 direct full-time jobs in BC, but also claims that a wide range of
spin-offs could push the total up to almost 2000 jobs. Once again, these claims
are exaggerated: even with a wide range of spin-offs TMX will only create 800
long-term jobs. This is approximately 0.03% of total BC employment.
TMX would provide only small property tax benefits for BC communities along its
1 Trans Mountain Pipeline (TMP), a wholly-owned subsidiary of Kinder Morgan, operates the existing
Trans Mountain Pipeline and is the entity that is seeking to expand the existing pipeline by building TMX. In the media, TMX is typically referred to as a pipeline being developed by Kinder Morgan. To avoid confusion, we refer to the Company as KM/TMP in this Report.
SCHOOL OF PUBLIC POLICY
Economic Costs and Benefits of the Trans Mountain Expansion Project (TMX) for BC and Metro Vancouver 2
route. And these benefits (averaging less than 1% of current total municipal
revenues) will be even smaller in the context of projected growth for these
communities.
A review of the fiscal benefits also demonstrates the tiny returns to BC from
TMX. KM/TMP's flawed analysis, which overstates employment benefits, also
overstates tax benefits from building and operating TMX.
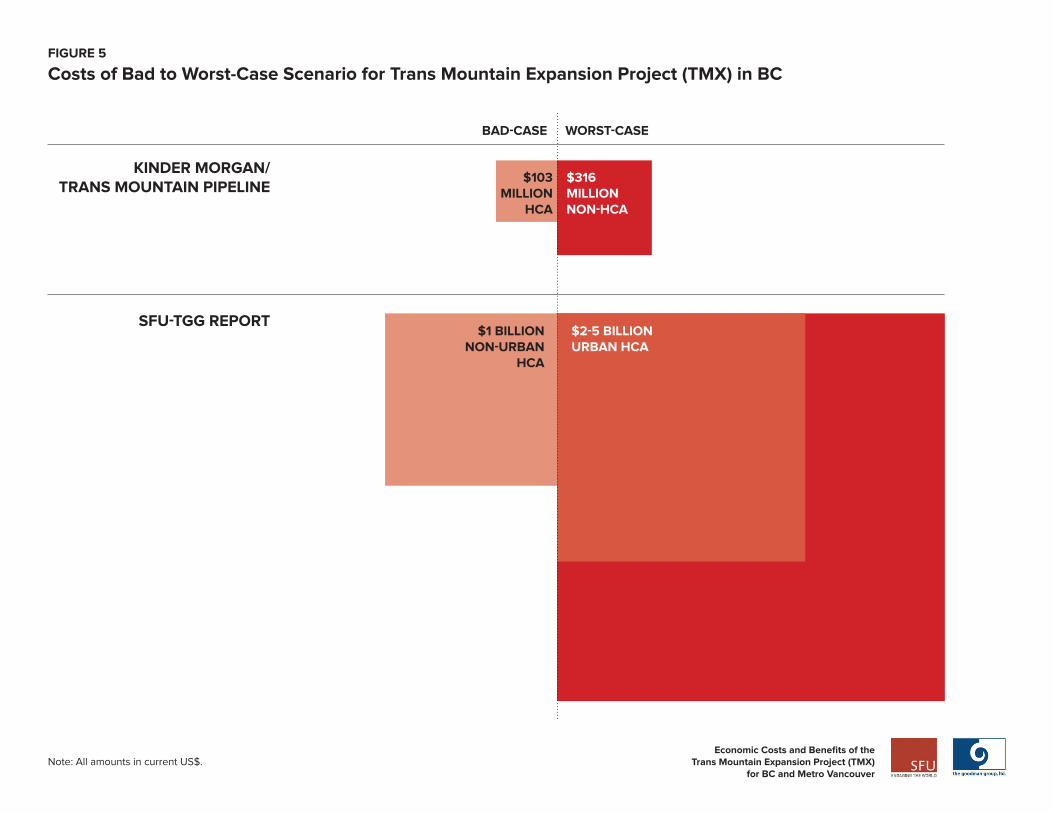
2. Costs: Under a range of bad to worst-case scenarios, the costs of a major
rupture can vary from US$1 billion to as high as US$5 billion. With its high
damage cost scenario estimate of C$100-300 million, KM/TMP has vastly
understated the costs of a bad to worst-case scenario. (See Figure 5 and
Section 4.)
The potential costs for a major rupture in a High Consequence Area (HCA),2 but
not an urban setting (similar to Marshall, MI, site of the Enbridge spill to the
Kalamazoo River) could start at $1 billion (bad scenario). Contrary to KM/TMP's
findings, damage and cleanup costs for major accidents are highly correlated
with population density. Therefore, if a major accident occurred in a more
densely populated area (i.e. Metro Vancouver), damaging and disrupting key
infrastructure, and possibly resulting in a spill to water, these costs could
escalate to multi-billion dollar damages (potentially as high as $2-5 billion) (worst-
case scenario). Given the hazardous characteristics (notably flammability) of
dilbit (with sizable amounts of diluent such as condensate), an accident involving
this pipeline could also involve loss of human life.
3. Liability: Further exacerbating our concerns about the fact that KM/TMP has
significantly overstated the benefits while vastly understating the costs, are
concerns about liability in the event of a catastrophic spill. There are
uncertainties regarding KM/TMP's capacity and willingness to pay for all of the
cleanup and damages; and what portion of these costs could be borne by
governments, municipalities and taxpayers. (See Section 4.5.)
4. Cost-Benefit Analysis: The benefits of the pipeline are very small, whereas the
worst-case costs of a catastrophic spill are very large. Even with a narrow
economic definition of costs and benefits, which excludes many broader
2 HCAs include highly populated areas, other populated areas, drinking water resources, environmentally
sensitive areas, and commercially navigable waterways.
SCHOOL OF PUBLIC POLICY
Economic Costs and Benefits of the Trans Mountain Expansion Project (TMX) for BC and Metro Vancouver 3
environmental and human health impacts (notably GHGs), the potential costs of
TMX under a bad to worst-case scenario are very high. Based on our
evaluation of the economic costs and benefits in Sections 3 and 4, the SFU-
TGG Report concludes that under a range of bad to worst-case scenarios,
the costs will exceed, or greatly exceed, the benefits for BC and Metro
Vancouver. (See Section 5.)
5. Uneven Allocation of the Costs and Benefits: The costs and benefits are
very unevenly allocated across stakeholders and regions. (See Section
5.3.)
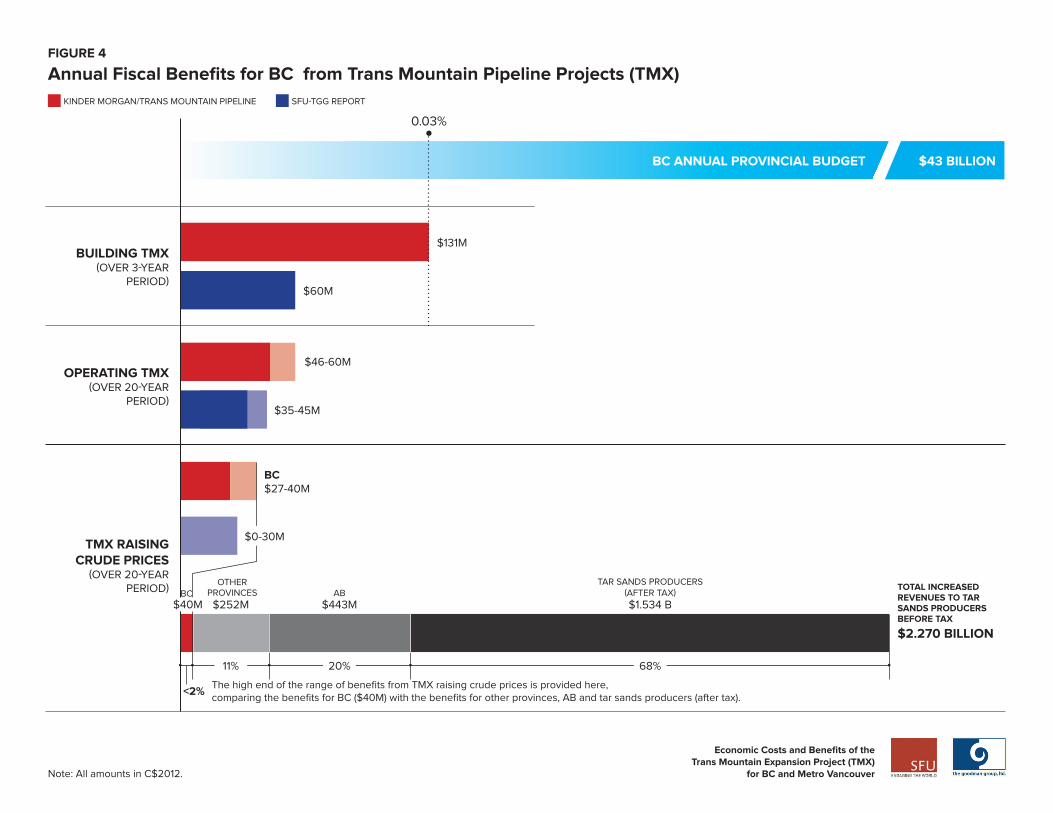
Based on the Company’s own estimates regarding the increased revenues to tar
sand producers from TMX, BC will receive less than 2% of these revenues; tar
sands producers retain 68%, and 31% goes to Alberta and other provinces in
royalties and corporate income taxes (paid directly to the provinces, or paid to
the federal government and then flowed back to the provinces). The lion's share
of the benefits flows to KM/TMP, the Alberta tar sands producers and Alberta,
whereas the citizens of BC, and Metro Vancouver in particular, will bear the lion's
share of the risks and receive very small benefits.
In light of the above findings regarding the evaluation of the costs and benefits of TMX,
we conclude that the pipeline project is not in the economic or public interest of the
citizens of BC and, in particular, the citizens of Metro Vancouver. Moreover, TMX
completely fails to satisfy BC's fifth condition for the consideration of construction and
operation of heavy-oil pipelines within its borders.3 The SFU-TGG Report therefore
strongly recommends that the citizens and decision-makers of BC and Metro
Vancouver reject this pipeline, which is neither in the economic nor public
interest of BC and Metro Vancouver.
3 The fifth condition pertains to BC receiving its fair share of the benefits commensurate with the risks.
See footnote 8.
SCHOOL OF PUBLIC POLICY
Economic Costs and Benefits of the Trans Mountain Expansion Project (TMX) for BC and Metro Vancouver 4
1.1 Figures
For the convenience of the reader, the complete group of infographs (Figures 1-5) is
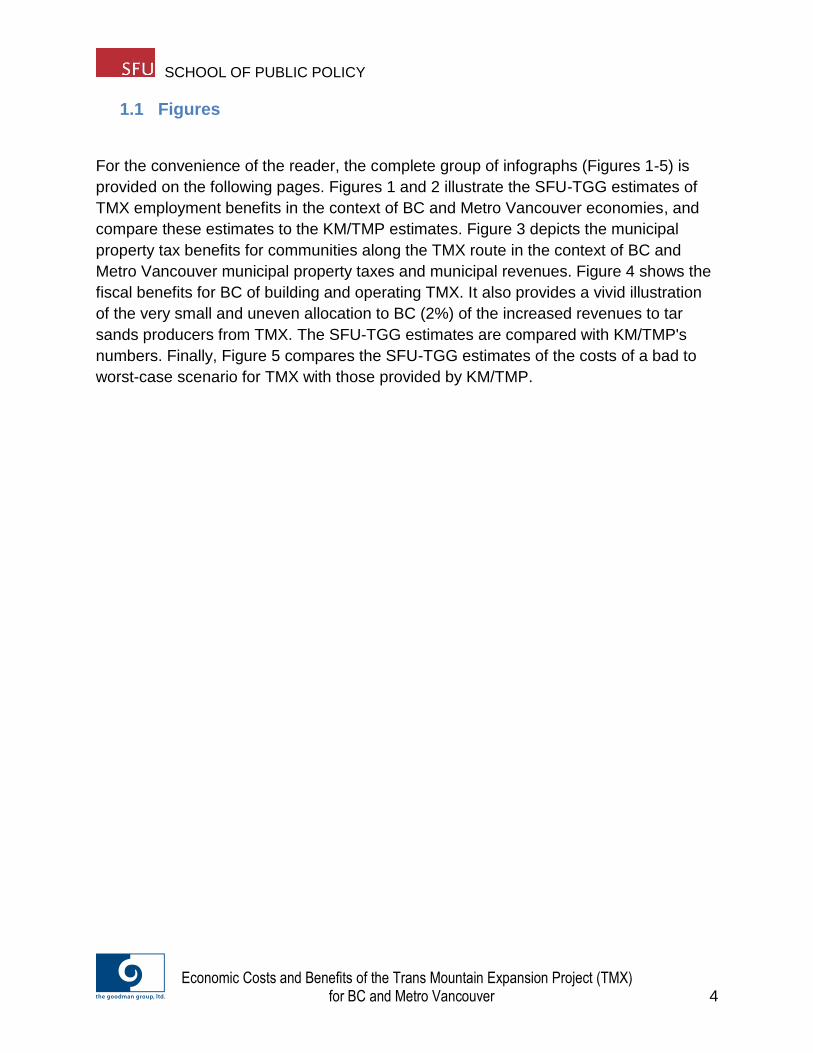
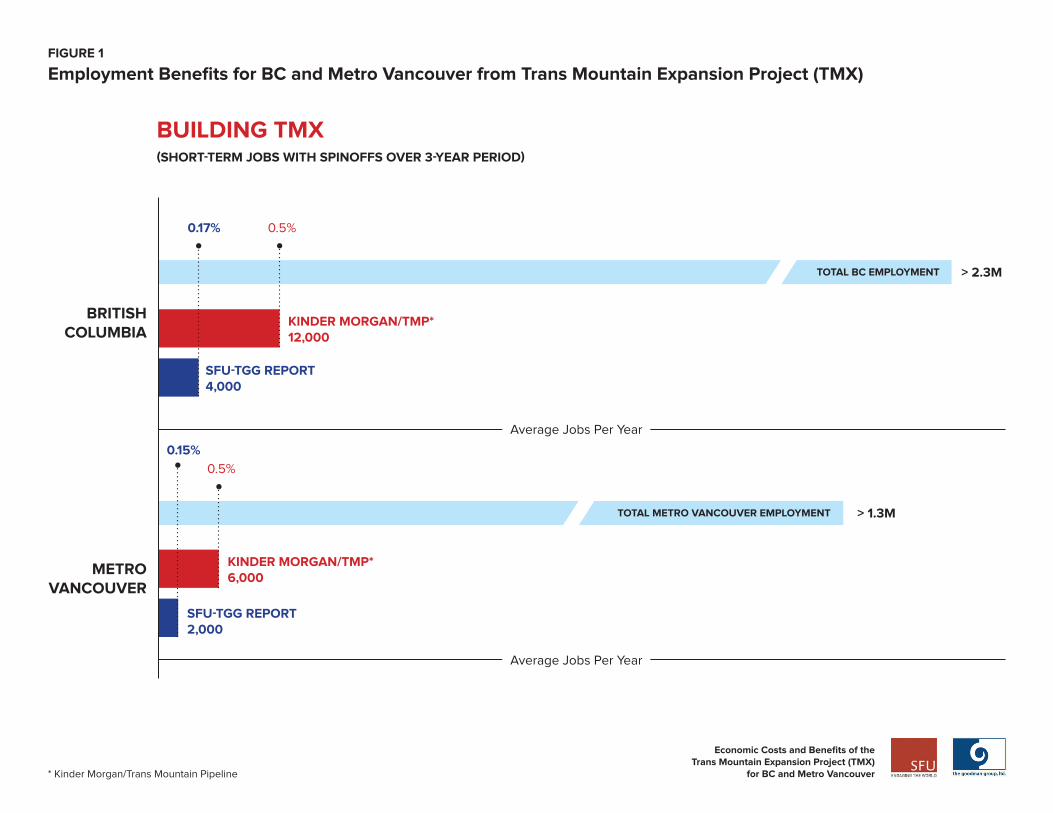
provided on the following pages. Figures 1 and 2 illustrate the SFU-TGG estimates of
TMX employment benefits in the context of BC and Metro Vancouver economies, and
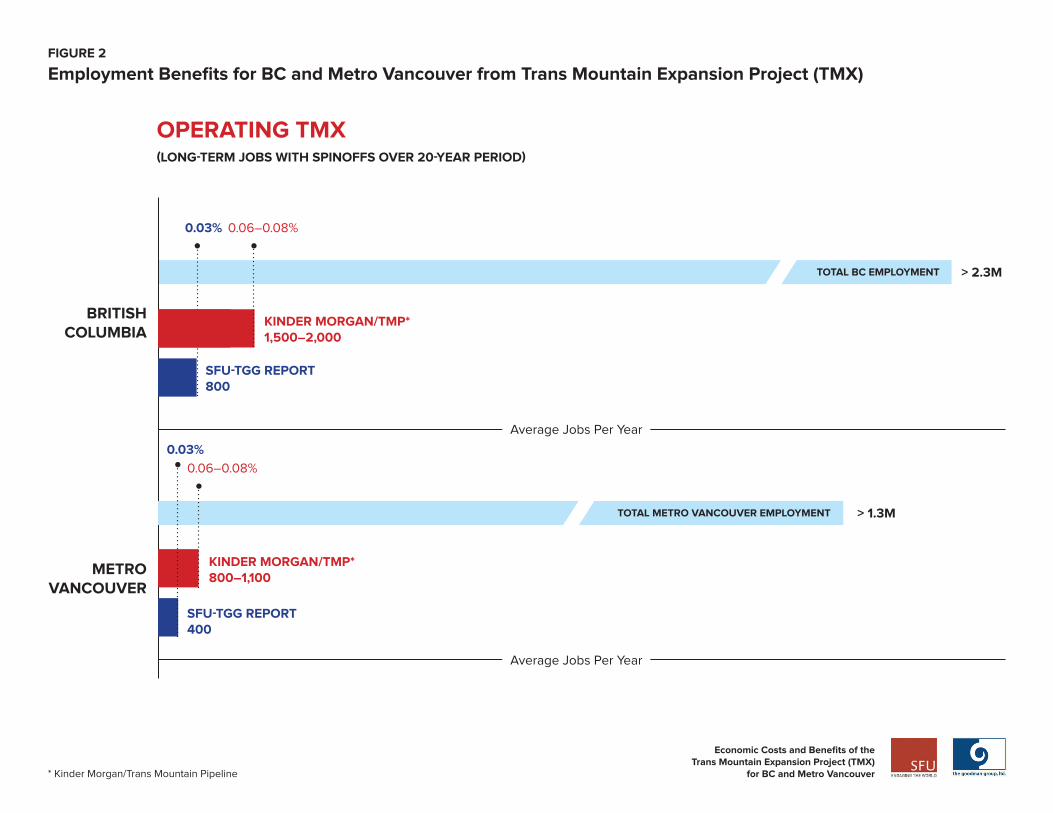
compare these estimates to the KM/TMP estimates. Figure 3 depicts the municipal
property tax benefits for communities along the TMX route in the context of BC and
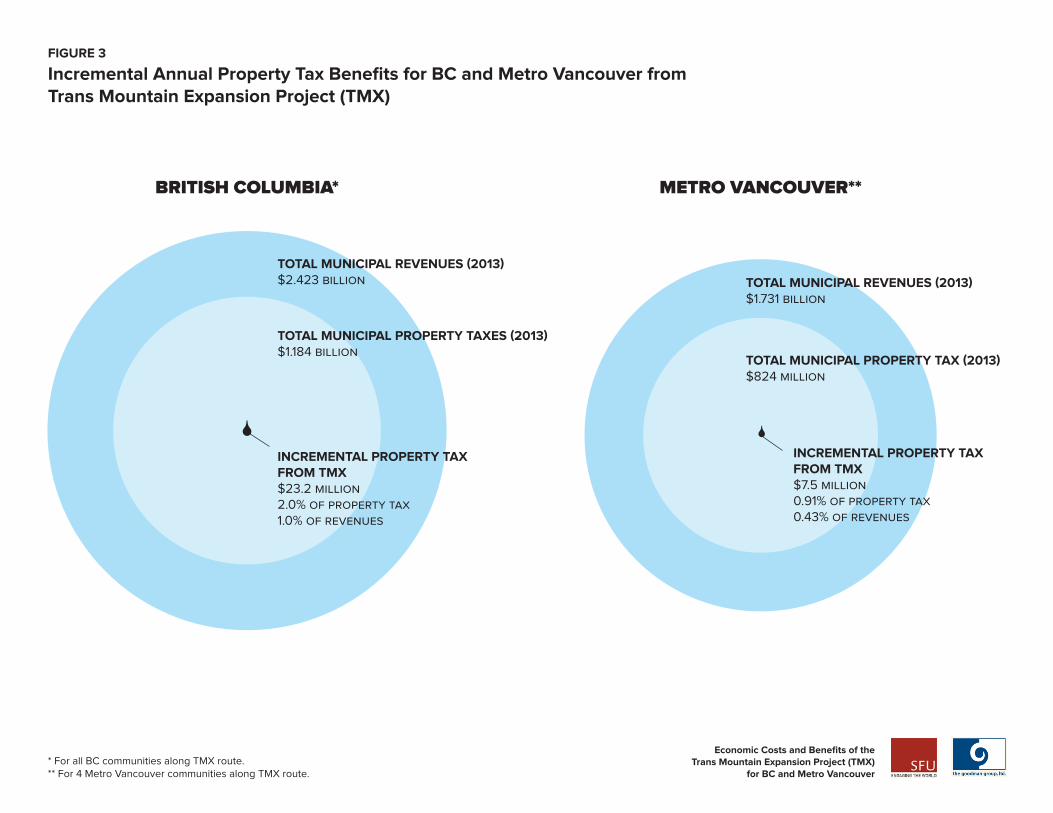
Metro Vancouver municipal property taxes and municipal revenues. Figure 4 shows the
fiscal benefits for BC of building and operating TMX. It also provides a vivid illustration
of the very small and uneven allocation to BC (2%) of the increased revenues to tar
sands producers from TMX. The SFU-TGG estimates are compared with KM/TMP's
numbers. Finally, Figure 5 compares the SFU-TGG estimates of the costs of a bad to
worst-case scenario for TMX with those provided by KM/TMP.
Economic Costs and Benefits of the Trans Mountain Expansion Project (TMX)
for BC and Metro Vancouver
FIGURE 1
Employment Benefits for BC and Metro Vancouver from Trans Mountain Expansion Project (TMX)
> 2.3M
0.17% 0.5%
TOTAL BC EMPLOYMENT
BRITISHCOLUMBIA
METRO VANCOUVER
BUILDING TMX(SHORT-TERM JOBS WITH SPINOFFS OVER 3-YEAR PERIOD)
KINDER MORGAN/TMP*12,000
SFU-TGG REPORT 4,000
> 1.3MTOTAL METRO VANCOUVER EMPLOYMENT
0.15%
0.5%
Average Jobs Per Year
Average Jobs Per Year
KINDER MORGAN/TMP*6,000
SFU-TGG REPORT 2,000
* Kinder Morgan/Trans Mountain Pipeline
Economic Costs and Benefits of the Trans Mountain Expansion Project (TMX)
for BC and Metro Vancouver
> 2.3M
FIGURE 2
Employment Benefits for BC and Metro Vancouver from Trans Mountain Expansion Project (TMX)
OPERATING TMX(LONG-TERM JOBS WITH SPINOFFS OVER 20-YEAR PERIOD)
TOTAL BC EMPLOYMENT
BRITISHCOLUMBIA
METRO VANCOUVER
> 1.3MTOTAL METRO VANCOUVER EMPLOYMENT
Average Jobs Per Year
Average Jobs Per Year
0.03% 0.06–0.08%
0.03%
0.06–0.08%
KINDER MORGAN/TMP*1,500–2,000
SFU-TGG REPORT 800
KINDER MORGAN/TMP*800–1,100
SFU-TGG REPORT 400
* Kinder Morgan/Trans Mountain Pipeline
Economic Costs and Benefits of the Trans Mountain Expansion Project (TMX)
for BC and Metro Vancouver
BRITISH COLUMBIA* METRO VANCOUVER**
TOTAL MUNICIPAL REVENUES (2013)$2.423 billion TOTAL MUNICIPAL REVENUES (2013)
$1.731 billion
TOTAL MUNICIPAL PROPERTY TAXES (2013)$1.184 billion
TOTAL MUNICIPAL PROPERTY TAX (2013)$824 million
INCREMENTAL PROPERTY TAX FROM TMX$23.2 million2.0% of property tax1.0% of revenues
INCREMENTAL PROPERTY TAX FROM TMX$7.5 million0.91% of property tax0.43% of revenues
* For all BC communities along TMX route.** For 4 Metro Vancouver communities along TMX route.
FIGURE 3
Incremental Annual Property Tax Benefits for BC and Metro Vancouver from Trans Mountain Expansion Project (TMX)
Economic Costs and Benefits of the Trans Mountain Expansion Project (TMX)
for BC and Metro Vancouver
11%
$46-60M
$35-45M
$131M
$60M
FIGURE 4
Annual Fiscal Benefits for BC from Trans Mountain Pipeline Projects (TMX)
BC ANNUAL PROVINCIAL BUDGET $43 BILLION
BC$27-40M
OTHER PROVINCES
$252M
TAR SANDS PRODUCERS (AFTER TAX)
$1.534 B
BUILDING TMX (OVER 3-YEAR
PERIOD)
TOTAL INCREASED REVENUES TO TAR SANDS PRODUCERS BEFORE TAX
$2.270 BILLION
KINDER MORGAN/TRANS MOUNTAIN PIPELINE SFU-TGG REPORT
OPERATING TMX (OVER 20-YEAR
PERIOD)
0.03%
TMX RAISING CRUDE PRICES
(OVER 20-YEAR PERIOD) AB
$443M
20% 68%
$0-30M
Note: All amounts in C$2012.
<2%The high end of the range of benefits from TMX raising crude prices is provided here, comparing the benefits for BC ($40M) with the benefits for other provinces, AB and tar sands producers (after tax).
$40MBC
Economic Costs and Benefits of the Trans Mountain Expansion Project (TMX)
for BC and Metro Vancouver
FIGURE 5
Costs of Bad to Worst-Case Scenario for Trans Mountain Expansion Project (TMX) in BC
WORST-CASE
$103MILLION
HCA
$1 BILLIONNON-URBAN
HCA
$316 MILLIONNON-HCA
$2-5 BILLIONURBAN HCA
BAD-CASE
KINDER MORGAN/ TRANS MOUNTAIN PIPELINE
SFU-TGG REPORT
Note: All amounts in current US$.
SCHOOL OF PUBLIC POLICY
Economic Costs and Benefits of the Trans Mountain Expansion Project (TMX) for BC and Metro Vancouver 10
2 Methodology: Economic Cost-Benefit Analysis
This Report uses an economic cost-benefit analysis to evaluate the costs and benefits
of the TMX project. Economic costs and benefits are defined as costs and benefits that
directly affect economic activity and can be somewhat readily (albeit approximately)
quantified using market economics. The Report uses economic costs and benefits for
the following reasons: (i) these are the elements that can be most readily be estimated
and compared; (ii) TGG has a well-developed expertise in the evaluation of economic
development benefits (including employment) from various energy options; (iii) the
evaluation of the environmental and social costs and benefits is subject to major
controversy; (iv) the NEB does not consider increased GHG costs as part of its
evaluation of TMX and therefore this information is not available in the NEB filing in the
current case.4
Resources and time5 did not allow us to conduct a comprehensive cost-benefit analysis,
nor to determine the probability of a bad to worst-case scenario for a major pipeline
rupture. In comparing economic costs and benefits of TMX, we further narrowed the
scope to a comparison of an estimate of the economic benefits of TMX with a range of
bad to worst-scenario costs. While we are able to provide estimates of the economic
benefits of TMX, there is a high degree of uncertainty and a broad range of potential
costs. Despite the impossibility of making a precise determination of the costs (or the
risks)6 associated with the proposed pipeline, this Report offers useful guidance by
comparing an estimate of economic benefits against a range of bad to worst-case
scenario costs.
The Report does not attempt to quantify the probability of a bad to worst-case spill.
Attempts to quantify such probabilities are controversial at best. Moreover, in the current
4 We note that the narrow economic definition of costs excludes many environmental impacts such as
upstream GHGs, compromised ecosystem services, damage to plant and animal habitat, harm to plant and animal species, and broader human health impacts beyond injuries and death related to an accident. If a more comprehensive definition of costs were taken into account, the costs of the project would be even higher. However, even using this narrow economic definition of the costs, we will show that under bad to worst-case scenarios, the cost of a major pipeline rupture can escalate into the multi-billion dollar range. 5 There is a high and increasing level of public interest and debate in BC and Metro Vancouver regarding
the costs and benefits of this pipeline. Moreover, there are growing concerns about the fairness of the current NEB review process for TMX, as well as the adequacy of the information provided by KM/TMP to assess the project (see footnote 7). Consequently, there is now some urgency to release an independent assessment of the costs and benefits of this project, in order to facilitate informed public debate and provide guidance to citizens and decision-makers. 6 It is also impossible to make a precise determination of the broader environmental and human health
impacts (notably from increased GHGs) that do not fit into a narrow economic definition of costs.
SCHOOL OF PUBLIC POLICY
Economic Costs and Benefits of the Trans Mountain Expansion Project (TMX) for BC and Metro Vancouver 11
NEB case, there appears to be significant controversy as to whether KM/TMP has been
sufficiently transparent in providing intervenors and the Board with the information
needed to fully understand the risks of the project.7 Experience has taught us that bad
to worst-case scenarios do occur and have been occurring with alarming frequency
since 2010, starting with the US$1.1 billion plus rupture of Enbridge's Line 6B in
Marshall, MI. While the Report has not quantified the probability of a bad to worst-case
scenario, we have focused on quantifying the costs for a credible range of bad to worst-
case scenarios, based on relevant and recent real-world cases.
We have also focused on bad to worst-case scenario costs because this is our core
area of disagreement with KM/TMP in regard to spill costs. Our main concern is not the
costs of smaller (or even average) spills. Instead, we are most concerned about the
costs of bad to worst-case scenarios that are possible given that TMX runs through
Metro Vancouver (proximate to people, water and economic activity), with the potential
of a spill to sea (as will be discussed in Section 4).
Cost benefit analyses typically have limitations on the scope of the costs and benefits
that are analyzed. This Report's analysis is narrower than we would prefer. However, a
comparison of economic benefits estimates against a range of bad to worst-case
scenario costs is sufficient to inform decision-making about the following:
1. Are there serious problems with TMX? And more specifically, under a range of
bad to worst-case scenarios, do the costs of TMX exceed the benefits?
2. Can the KM/TMP evaluation of the costs and benefits (which concludes that the
overall costs are moderate and acceptable compared to the benefits) be relied
upon?
3. Is TMX in the public interest of the citizens of BC and Metro Vancouver? More
specifically, is BC's fifth condition being fulfilled - i.e. that "British Columbia
receives a fair share of the fiscal and economic benefits of a proposed heavy-oil
7 See Province of BC - Notice of Motion on Trans Mountain Inadequacy of IR No. 1 Responses (A61531),
para 22, p. 4. https://docs.neb-one.gc.ca/ll-eng/llisapi.dll/fetch/2000/90464/90552/548311/956726/2392873/2449925/2451398/2485159/C289%2D3%2D2_%2D_Province_of_BC_Notice_of_Motion_%231_%2D_A3Y8R3.pdf?nodeid=2484869&vernum=-2 See also Marc Eliesen - Letter of Withdrawal (A64000). https://docs.neb-one.gc.ca/ll-eng/llisapi.dll/fetch/2000/90464/90552/548311/956726/2392873/2449925/2451033/2543157/C118%2D6%2D1_%2D_Marc_Eliesen_Letter_of_Withdrawal_%2D_A4E1Q6.pdf?nodeid=2543843&vernum=-2
SCHOOL OF PUBLIC POLICY
Economic Costs and Benefits of the Trans Mountain Expansion Project (TMX) for BC and Metro Vancouver 12
project that reflects the level, degree and nature of the risk borne by the
government, the environment and taxpayers?"8
There is increasing evidence that the current NEB hearings may not ensure that
KM/TMP provides all the necessary information on the costs and benefits of TMX. In
fact, the Province of British Columbia stated that “Trans Mountain’s failure to file the
evidence requested by the Province in Information Request No. 1 denies the Board, the
Province and other Intervenors access to the information required to fully understand
the risk posed by the Project, how Trans Mountain proposes to mitigate such risk and
Trans Mountain’s ability to effectively respond to a spill related to the Project.”9
In this context in particular, the independent assessment of costs and benefits provided
in this Report can offer useful guidance to inform decision-making, and can help British
Columbians evaluate if TMX is indeed in the public interest.
Section 3 provides estimates of the benefits from TMX, including the employment
benefits of building and operating TMX, fiscal benefits, and property tax benefits. It also
analyzes how these benefits are distributed. Section 4 determines a range of bad to
worst-case scenario costs for a TMX rupture using relevant real-world examples of
major oil and gas transport accidents. Finally, Section 5 summarizes comparisons of the
costs and benefits and answers the three questions posed in this section.
8 In 2012, BC set out five minimum requirements that must be met for the B.C. government to consider
the construction and operation of heavy-oil pipelines within its borders, the fifth of which pertains to BC receiving its fair share of the benefits commensurate with the risks. See http://www2.news.gov.bc.ca/news_releases_2009-2013/2012ENV0060-001422.htm and http://www.env.gov.bc.ca/main/docs/2012/TechnicalAnalysis-HeavyOilPipeline_120723.pdf. In November 2014, Christy Clark has reiterated that these conditions "remain in place." http://www.vancouversun.com/news/Christy+Clark+looks+warm+relations+with+Alberta+after+frosty/10350317/story.html 9 See footnote 7.
SCHOOL OF PUBLIC POLICY
Economic Costs and Benefits of the Trans Mountain Expansion Project (TMX) for BC and Metro Vancouver 13
3 Economic Benefits of TMX for BC and Metro Vancouver
3.1 Introduction
KM/TMP (Kinder Morgan/Trans Mountain Pipeline) claims that TMX (Trans Mountain
Expansion Project) will result in significant employment, municipal property tax, and
fiscal benefits for BC and Metro Vancouver.10 But these claimed benefits are small
when evaluated in the relevant provincial and regional contexts. Moreover, the benefits
estimated by KM/TMP are very high relative to likely actual benefits for BC and Metro
Vancouver. In addition, BC will receive only a small share of benefits from TMX.
Section 3 provides estimates of the economic benefits of TMX for BC (and Metro
Vancouver if applicable), including the employment, property tax, and fiscal benefits.
Specifically, KM/TMP and SFU-TGG have evaluated the following benefits from various
components: employment benefits from building and operating TMX; property tax
benefits from operating TMX; and fiscal benefits from building and operating TMX, as
well as increased revenues to crude producers (resulting from TMX). In this section,
KM/TMP's estimates of these respective benefits are contrasted with the SFU-TGG
estimates. Figures 1 to 4 summarize and compare the respective benefits estimates
from KM/TMP and SFU-TGG.
Sections 3.2 through 3.4 analyze the employment benefits for BC and Metro Vancouver
from TMX. Sections 3.2 and 3.3 estimate the short-term employment benefits for BC
and Metro Vancouver, respectively. Section 3.4 estimates the long-term employment
10
The KM/TMP employment, property tax and fiscal estimates reviewed in this Report are provided in KM/TMP’s December 16, 2013 TMX Project Application to the NEB (National Energy Board) and based on the TMX Project as then defined. See https://docs.neb-one.gc.ca/ll-eng/llisapi.dll/fetch/2000/90464/90552/548311/956726/2392873/2451003/2392699/B5-26_-_V5B_ESA_01of16_SOCIOEC_-_A3S1R5.pdf?nodeid=2392986&vernum=-2 pp. 2-14-2-18 https://docs.neb-one.gc.ca/ll-eng/llisapi.dll/2393468/B5-38_-_V5B_ESA_13of16_SOCIOEC_-_A3S1S7.pdf?func=doc.Fetch&nodeid=2393468 pp. 7-167 – 7-189. Conference Board Report (2013), https://docs.neb-one.gc.ca/ll-eng/llisapi.dll/fetch/2000/90464/90552/548311/956726/2392873/2451003/2385938/B1-5_-_V2_4of4_PROJ_OVERVIEW_-_A3S0R1.pdf?nodeid=2392869&vernum=-2 App. B, (PDF pp.69-127). The NEB Application assumes that most project expenditures and construction activity would take place over a two-year period in 2016-17, for a planned in-service date of late 2017. KM/TMP has subsequently proposed modifications to the pipeline corridor in Burnaby, and the schedule for the NEB process has been extended by nearly 7 months. http://www.neb-one.gc.ca/bts/nws/nr/2014/nr25-eng.html Project expenditures, construction activity, and job impacts may thus now occur somewhat later in time (and over a longer period), compared with what was assumed in the NEB Application.
SCHOOL OF PUBLIC POLICY
Economic Costs and Benefits of the Trans Mountain Expansion Project (TMX) for BC and Metro Vancouver 14
benefits for BC and Metro Vancouver, respectively. The SFU-TGG estimates are
evaluated in context of the broader economies and contrasted with the KM/TMP
estimates.
Sections 3.5 through 3.7 estimate the non-employment benefits of TMX. Sections 3.5
analyzes the long-term municipal tax benefits for communities along the pipeline route
in the context of BC and Metro Vancouver municipal tax revenues. Section 3.6 analyzes
the fiscal benefits for BC from building and operating TMX, as well as the fiscal benefits
for BC from TMX raising revenues for crude producers. Finally, Section 3.7 examines
the important issue of BC's share of the fiscal benefits from building and operating TMX,
as well as BC's share of the benefits to tar sands producers from increased revenues
resulting from building TMX.
3.2 Building TMX: Short-term employment benefits for BC
KM/TMP claims that building TMX will result in significant employment benefits. But the
benefits from building TMX are very short-term and concentrated into a 2-3 year period
of construction and related activity.11 Moreover, the benefits estimated by KM/TMP are
very high relative to likely actual benefits for BC from building TMX. See Figure 1.
3.2.1 Jobs including Spin-offs: KM/TMP Estimate
Including a very wide range of spin-offs throughout the supply chain and economy,
KM/TMP estimates that developing and constructing TMX would result in about 36,000
person-years of employment in BC (one person-year is defined as one full-time job for
one person for one year).12 Averaged over a 3-year period for construction and related
activity,13 the BC employment estimated by KM/TMP is about 12,000 jobs/year.
Total employment in BC now exceeds 2.3 million. With all the spin-offs estimated by
KM/TMP, the jobs from building TMX would be about 0.5% of the provincial total. This
would be a somewhat significant impact, albeit short-term. But as will be explained
11
See footnote 13. 12
Section 3.2.2 will provide an explanation of how these estimates were generated and the spin-offs included. 13
KM/TMP assumes that the timing of employment impacts will coincide with annual expenditures on the project. KM/TMP estimates project expenditures would be spread over a 7-year period 2012-2018, but most will be concentrated into a 2-year construction period 2016-2017, with some follow-up work (such as final cleanup and reclamation) in 2018 after project in-service. In reality, there will be some time lags for employment impacts to ripple through the economy. Much of the total employment impacts being estimated are for these ripple effects, as opposed to the direct on-site construction labor whose timing is tied to the actual construction. So associated employment impacts will be spread over at least 2 years of actual construction, and it is realistic to assume that they would actually be spread over at least 3 years.
SCHOOL OF PUBLIC POLICY
Economic Costs and Benefits of the Trans Mountain Expansion Project (TMX) for BC and Metro Vancouver 15
below, KM/TMP’s employment estimates are very high relative to likely actual impacts
for developing and constructing TMX.
3.2.2 Jobs with Spin-offs vs. Direct Construction Workforce
The KM/TMP job estimates (discussed in Section 3.2.1) include a very wide range of
spin-offs throughout the supply chain and economy. Put simply, in addition to the jobs
on-site (construction workforce), these employment estimates include jobs off-site
(design, engineering, permitting, support); upstream (in the supply chain); and
downstream (as workers spend income from jobs upstream, off-site and on-site).
Jobs with spin-offs are widely dispersed in sectors throughout the economy, as well as
geographically.14 So it is not feasible to directly count the jobs for spin-offs, especially
for a project that has not yet been built. Instead, jobs with spin-offs are estimated with
an economic model, which is a highly simplified representation of how the economy
actually operates.15
Separate from its job estimates with spin-offs, KM/TMP has also estimated the jobs on-
site (direct construction workforce). KM/TMP estimates that building TMX in BC would
require a direct construction workforce averaging about 1900/year workers over a two-
year period, or about 3800 person-year of employment. Only about one-third of this
workforce (averaging about 600 workers/year, or less than 1300 person-years of
employment) would be in Metro Vancouver.
Thus, for all of BC, the direct construction workforce for TMX (about 3800 person-years)
is less than 11% of total jobs with spin-offs estimated by KM/TMP for building TMX
14
On-site jobs are tied to project locations; jobs elsewhere (off-site, upstream, and downstream) can be located in other provinces and countries. And even if jobs are located in-province, the labour supply for these jobs (especially for on-site construction) may be workers from other provinces and countries. 15
The KM/TMP job estimates including spin-offs were generated using an Input-Output (I-O) model. To estimate employment and other economic spin-off effects, I-O models generate regional economic impact estimates by tracing the industries involved in a study region throughout successive rounds of supply linkages. At each step, they trace the portion of the inputs required from each industry, which are supplied locally (within the regional economy being modeled). Input-Output analyses consider a wide range of job impacts and include the following categories of effects:
Direct Effects — first round impacts of a set of expenditures, i.e. those occurring before the involvement of supporting supply linkages; Indirect Effects — impacts generated through subsequent purchases by suppliers of materials and services to sustain the original activities; Induced Effects — impacts generated by workers spending incomes earned through direct and indirect employment activities; Total Effects — the sum of the direct, indirect, and induced effects.
The KM/TMP job estimates including spin-offs were generated with the Statistics Canada I-O Model, which allows for detailed analysis of nearly 300 industries by province. In this Report, we consider job estimates specifically for BC, but it should be understood that the KM/TMP jobs analysis also provides job estimates for Alberta and other provinces.
SCHOOL OF PUBLIC POLICY
Economic Costs and Benefits of the Trans Mountain Expansion Project (TMX) for BC and Metro Vancouver 16
(about 36,000 person-years). As shown by this comparison, almost 90% of the jobs
estimated by KM/TMP for building TMX would be off-site, up-stream, and downstream.
Job estimates including spin-offs can be useful for understanding how a project may
affect total economic activity and employment in various sectors and locations. But
these estimates can be inaccurate, or even misleading, especially as a measure of net
benefits for a province (BC) or region (Metro Vancouver).16 As opposed to jobs on-site,
jobs elsewhere (off-site, upstream, and downstream) are difficult to measure and
estimates thereof are based on various data, assumptions, and methodology. Put very
simply, job estimates with spin-offs should be very carefully reviewed and interpreted.
Careful review and interpretation are especially warranted in the case of TMX, where
almost 90% of jobs estimated by KM/TMP would be off-site, upstream, and
downstream. Moreover, most of the workers on-site building TMX will not be local.
Construction projects like TMX are short-term and highly specialized, and there will be
relatively few BC workers available to build TMX.
KM/TMP estimates that 30% of the workers in Metro Vancouver will be local and only 5-
10% elsewhere in BC. Labour from inside the regions along TMX will be only 16%17 of
the total BC direct construction workforce. The direct construction workforce building
TMX would average about 300 local workers over a two year period for all of BC,
including 200 workers in Metro Vancouver and 100 elsewhere in BC.
KM/TMP estimates that building TMX would provide 300 on-site construction jobs for
local workers over a two year period for all of BC. This is a negligible amount of
employment in the context of the BC economy with employment now exceeding 2.3
million.
3.2.3 Jobs including Spin-offs: SFU-TGG Initial Estimate
Given our concerns about the accuracy and meaningfulness of KM/TMP’s job
estimates, we have developed a SFU-TGG Estimate of jobs including spin-offs for
building TMX.
As a starting point, we reviewed the KM/TMP job estimates and comparing them with
job estimates for other major crude pipeline projects. As explained in Section 3.2.2, jobs
with spin-offs are estimated with an economic model, which is a highly simplified
16
http://www.hydro.mb.ca/projects/development_plan/bc_documents/nfat_business_case_chapter_13_integrated_comparisons_of_development_plans_multiple_account_analysis.pdf 17
Calculated as a weighted average.
SCHOOL OF PUBLIC POLICY
Economic Costs and Benefits of the Trans Mountain Expansion Project (TMX) for BC and Metro Vancouver 17
representation of how the economy actually operates.18 This economic model estimates
employment based on project expenditures.
In analyses of employment impacts, it is standard practice to provide results in terms of
multipliers. In particular, a useful summary metric is jobs per dollar (person-years of
employment per $1 million of project-related spending). Multipliers facilitate comparison
of results within and across studies. With results expressed in terms of multipliers,
projects (and other activities) with differing levels of spending can be compared to
determine relative intensity of impacts.
KM/TMP estimates that developing and constructing TMX in BC would cost $3.2 billion
(2012 $ excluding financing cost), resulting in 36,000 person-years of employment in
BC (including a very wide range of economic spin-offs). KM/TMP thus estimates that
TMX would result in 11.3 person-years of BC employment per $1 million project costs.
The KM/TMP TMX jobs multipliers are substantially higher than those estimated in
studies for other crude pipeline projects. Enbridge estimates that developing and
constructing the Northern Gateway project would result in only 5.5 person-years of BC
employment per $1 million project costs.19 The BC jobs multiplier estimated by Enbridge
for Northern Gateway is less than half the multiplier estimated by KM/TMP for TMX (5.5
vs. 11.3 person-years of BC employment per $1 million project costs).
It is notable (and surprising) that there could be such a big difference in multipliers. TMX
and Northern Gateway are broadly similar projects,20 and Enbridge and KM/TMP
reportedly used similar methodology to estimate job impacts (including a very wide
range of economic spin-offs).21
Based on the limited information now available, it is not possible to fully resolve why the
KM/TMP TMX job estimates are so high relative to the Enbridge Northern Gateway
estimates. But from what we do know, the Enbridge Northern Gateway BC jobs
18
See footnote 15 for an explanation of how these estimates were generated and the spin-offs included. 19
https://docs.neb-one.gc.ca/ll-eng/llisapi.dll/832978/B83-4_-_Attachment_2_-_Public_Interest_Benefit_Evaluation_-_Update_and_Reply_Evidence_-_A2V1R8.pdf?func=doc.Fetch&nodeid=832978 20
TMX and Northern Gateway both include a large expenditure component for facilities in BC (including pipeline and marine and storage terminals), as well as a smaller expenditure component for pipeline and other facilities in Alberta. 21
Projects costs and multipliers for both TMX and Northern Gateway are in terms of 2012 $ excluding financing cost. KM/TMP and Enbridge both used the Statistics Canada I-O Model. See footnote 12 for more details on I-O models.
SCHOOL OF PUBLIC POLICY
Economic Costs and Benefits of the Trans Mountain Expansion Project (TMX) for BC and Metro Vancouver 18
multiplier appears to be a much more reasonable starting point for assessing likely
actual job impacts for BC pipeline projects, including TMX.22
We have thus developed the SFU-TGG Initial TMX jobs estimate based on a jobs
multiplier of 5.5 person-years of BC employment per $1 million project costs (matching
the Enbridge Northern Gateway BC multiplier) and a cost to build TMX of $3.0 billion in
BC (matching the KM/TMP assumptions for expenditures in 2016-2018).23 On this
basis, building TMX results in an estimated 16,000 person-years of employment in BC
(including a very wide range of spin-offs throughout the supply chain and economy).
Averaged over a 3-year period for construction and related activity, this is about 5000
jobs/year (about 0.2% of the provincial total).
The SFU-TGG Initial TMX jobs estimate is much lower (less than half) of the KM/TMP
jobs estimate (16,000 vs. 36,000 person-years of BC employment, including a very wide
range of economic spin-offs).
3.2.4 Jobs including Spin-offs: SFU-TGG Final Estimate
When adjusted as indicated, our SFU-TGG Initial TMX jobs estimate may still
substantially overstate likely actual job impacts. Labour demand is expected to grow
faster than labour supply in BC, resulting in tight labour market conditions.24 As shown
in Section 3.2.2, much of the labour for building TMX would not be local. So if TMX is
built, it could significantly displace other economic activity (and particularly jobs) in BC;
some of the job impacts being estimated for BC may not actually occur and/or would
provide jobs for workers from outside of BC (instead of local workers).25
22
The Enbridge Northern Gateway jobs multipliers (for individual provinces and for all of Canada) are broadly similar to those estimated in studies for other pipeline projects, while the KM/TMP TMX jobs multipliers are substantially higher. See for example, studies by TransCanada for Energy East and Enbridge for Line 9, which used the Statistic Canada I-O Model (as did the KM/TMP TMX and Enbridge Northern Gateway studies) http://www.energyeastpipeline.com/wpcontent/uploads/2013/09/Energy-East-Deloitte-Economic-Benefits-Report.pdf https://www.neb-one.gc.ca/ll-eng/livelink.exe?func=ll&objId=965026&objAction=Open 23
As indicated in footnote 13, KM/TMP analyzes job impacts for building TMX based on BC project expenditures of $3.2 billion (2012 $ excluding financing cost), over a 7-year period (2012-2018). KM/TMP estimates that these expenditures will be concentrated into a 2-year construction period (2016-2017), with some in 2018 following project in-service. But approximately 9% of the total ($0.2 billion) would be expended in 2012-2015. The TMX project expenditures in 2012-2015 (and any associated job impacts) are prior to construction and have already occurred or will soon occur regardless of whether TMX is permitted and constructed. Thus, our alternative estimates of job impacts are based on TMX project expenditures for construction and follow-up (estimated by KM/TMP as $3.0 billion in 2016-2018), since these are the expenditures (and associated job impacts), which are contingent upon whether TMX is permitted and constructed. 24
http://www.workbc.ca/WorkBC/media/WorkBC/Documents/Docs/BCLMOutlook.pdf 25
The job impacts estimated by KM/TMP for TMX (as well as by Enbridge for Northern Gateway and TransCanada for Energy East) include a very wide range of economic spin-offs. Job impacts were (footnote continued on next page)
SCHOOL OF PUBLIC POLICY
Economic Costs and Benefits of the Trans Mountain Expansion Project (TMX) for BC and Metro Vancouver 19
As discussed in Section 3.2.2, KM/TMP estimates that most of the on-site workers
building TMX will not be local. Labour from inside the regions along TMX will be only
16%26 of the total BC direct construction workforce. It is possible that some of these
non-local workers will come from other parts of BC, but most will probably come from
outside the province.
From a BC perspective, it is most relevant to consider employment benefits in terms of
jobs for BC residents, who would not be otherwise employed, and exclude jobs for
residents of other provinces and countries.27 If the job estimate for building TMX is
adjusted to net out employment for non-local workers, the result is a substantially lower
and more relevant estimate of employment benefits for BC.28
Based on the limited information now available, it is difficult to quantify how much the
SFU-TGG Initial TMX jobs estimate could overstate likely actual job impacts. But
especially given the expected tight labour market conditions, developing and
constructing TMX might actually result in only 12,000 (or less) person-years of
employment in BC (including a very wide range of economic spin-offs). Averaged over a
3-year period for construction and related activity, this is 4000 jobs/year (or less), which
is less than 0.2% of the provincial total.
Given expected labour market conditions and other constraints on BC economic activity
for the period when TMX might be constructed, it is unlikely that there will actually be a
large increase in overall BC employment and economic activity due to TMX. To the
(footnote continued from previous page) estimated using an Input-Output (I-O) model, which is a highly simplified representation of how the economy actually operates. In particular, I-O models assume that there will be no supply constraints for labour and other resources and that people employed as a result of the proposed project would otherwise be unemployed. Job estimates generated with I-O models will tend to overstate actual net job impacts, especially in a context of tight labour market conditions. For more details on I-O models, see footnotes 15 and 22 and Conference Board Report (2013), p. 57 (PDF p.125). 26
Calculated as a weighted average. 27
Thus, from a BC perspective, employment may not be a benefit if the workers are not BC residents (and taxpayers, see footnote 65); however, in determining benefits from a provincial perspective, it is relevant to consider spending by these non-resident workers, especially while on-site/in-province. In some economic cost-benefit analysis, employment is also not a benefit if the workers are migrants who did not reside in-province prior to the project; these migrants might become provincial taxpayers, but they will also require provincial services, such that revenues and costs are offsetting. http://www.hydro.mb.ca/projects/development_plan/bc_documents/nfat_business_case_chapter_13_integrated_comparisons_of_development_plans_multiple_account_analysis.pdf 28
KM/TMP estimates that building TMX in BC will require 3800 person-years of direct construction workforce, and that 84% of these workers will be non-local. Thus, the direct construction workforces includes about 3200 person-years of employment for non-local workers. Netting out these non-local workers would reduce KM/TMP’s employment estimate for building TMX (36,000 person years) by about 9%. And netting out these non-local workers would reduce the SFU-TGG Initial Estimate (16,000 person years) by about 20%.
SCHOOL OF PUBLIC POLICY
Economic Costs and Benefits of the Trans Mountain Expansion Project (TMX) for BC and Metro Vancouver 20
extent that building TMX has benefits for BC jobs and workers, these benefits are likely
to be relatively small (less than 0.2% of the provincial total), as well as short-term (over
a 2-3 year period).
This SFU-TGG Final Estimate demonstrates that developing and constructing TMX
might actually result in only one-third (or less) of the BC jobs estimated by KM/TMP for
TMX (12,000 or less vs. 36,000 person-years of BC employment, including a very wide
range of economic spin-offs).
Averaged over a 3-year period for construction and related activity, actual results
(including a very wide range of economic spin-offs) will be 4000 jobs/year (or less) of
BC employment, compared to the 12,000 jobs/year based on KM/TMP’s estimates. The
short-term employment benefits for BC of building TMX are illustrated in Figure 1.
3.3 Building TMX: Short-term employment benefits for Metro Vancouver
3.3.1 Jobs including Spin-offs: KM/TMP Estimate
On the basis of KM/TMP’s estimates including a wide range of economic spin-offs,
developing and constructing TMX would result in 19,000 person-years of employment in
Metro Vancouver.29 Averaged over a 3-year period for construction and related activity,
this is about 6000 jobs/year.
Total employment in Metro Vancouver now exceeds 1.3 million. So with all the spin-offs
estimated by KM/TMP, the jobs from building TMX operations would be about 0.5% of
the regional total. This would be a somewhat significant impact, albeit short-term. But as
will be explained below, KM/TMP’s employment estimates are very high relative to likely
actual impacts for developing and constructing TMX. See Figure 1.
29
This estimate of Metro Vancouver jobs (19,000 person-years) is based on BC jobs (KM/TMP jobs estimate of 36,000 person-years for building TMX) and assumes that slightly over half of BC jobs will be in Metro Vancouver. KM/TMP estimates jobs including spin-offs at the provincial level and does not split out jobs in Metro Vancouver, vs. elsewhere in BC. As explained by KM/TMP, regional job impacts can be approximated by allocating provincial jobs to the regions along the TMX routing based on regional share of provincial labour force. Metro Vancouver has slightly over half of the provincial labour force (and employment). https://docs.neb-one.gc.ca/ll-eng/llisapi.dll/2393468/B5-38_-_V5B_ESA_13of16_SOCIOEC_-_A3S1S7.pdf?func=doc.Fetch&nodeid=2393468 p. 7-177.
To the extent that a smaller share of the provincial job impacts are located in Metro Vancouver, there will be fewer jobs in the region relating to TMX. Metro Vancouver might actually have only half (and perhaps substantially less) of the provincial job impacts relating to TMX. KM/TMP estimates that only about one-third of the BC direct construction workforce would be located inside Metro Vancouver. The TMX routing through BC traverses the province, from the Alberta border near Jasper to Burnaby, and less than 10% of this routing is located in Metro Vancouver. But pipeline construction within highly urbanized areas such as Metro Vancouver tends to be more complex, costly, and labor-intensive. And the TMX Project also includes major expansions of existing Trans Mountain Pipeline facilities in Metro Vancouver, at both the Westridge Marine Terminal on Burrard Inlet and crude storage on Burnaby Mountain.
SCHOOL OF PUBLIC POLICY
Economic Costs and Benefits of the Trans Mountain Expansion Project (TMX) for BC and Metro Vancouver 21
3.3.2 Jobs with Spin-offs vs. Direct Construction Workforce: KM/TMP Estimate
Separate from its job estimates with spin-offs, KM/TMP has also estimated the jobs on-
site (direct construction workforce). As discussed in Section 3.2.2, KM/TMP estimates
that building TMX would require a direct construction workforce averaging about 600
workers/year over a two-year period in Metro Vancouver.
Thus, for Metro Vancouver, the direct construction workforce for TMX (about 1300
person-years) is less than 7% of total jobs with spin-offs estimated by KM/TMP for
building TMX (about 19,000 person-years). As shown by this comparison, 93% of the
jobs estimated by KM/TMP for building TMX would be off-site, up-stream, and
downstream.
Job estimates with spin-offs should be very carefully reviewed and interpreted,
especially in the case of TMX, where 93% of jobs estimated by KM/TMP would be off-
site, upstream, and downstream. Moreover, most of the workers on-site building TMX
will not be local. KM/TMP estimates that local workers will provide only 30% of the direct
construction workforce in Metro Vancouver. The direct construction workforce building
TMX period in Metro Vancouver would average about 200 local workers/year over a
two-year period. This is a negligible amount of employment in the context of the Metro
Vancouver economy with employment now exceeding 1.3 million.
3.3.3 Jobs including Spin-offs: SFU-TGG Initial Estimate
Given our concerns about the accuracy and meaningfulness of KM/TMP’s job
estimates, we have developed a SFU-TGG Estimate of jobs including spin-offs for
building TMX.
As shown in Section 3.2.3, the KM/TMP job estimates are very high relative to job
estimates for other pipeline projects and likely actual impacts. On the basis of our SFU-
TGG Initial Estimate for BC, building TMX would result in less than 9000 person-years
of employment in Metro Vancouver.30 Averaged over a 3-year period for construction
and related activity, this is about 3000 jobs/year (about 0.2% of the regional total).
This SFU-TGG Initial TMX jobs estimate is much lower (less than half) of the Metro
Vancouver jobs based on KM/TMP’s estimates for TMX (9000 vs. 19,000 person-years
of Metro Vancouver employment, including a very wide range of economic spin-offs).
30
This estimate of Metro Vancouver jobs (less than 9000 person-years) is based on BC jobs (SFU-TGG Initial Estimate of 16,000 person-years for building TMX) and assumes that slightly over half of provincial jobs will be in Metro Vancouver. See footnote 29 for more details on assumption that slightly over half of provincial jobs will be in Metro Vancouver.
SCHOOL OF PUBLIC POLICY
Economic Costs and Benefits of the Trans Mountain Expansion Project (TMX) for BC and Metro Vancouver 22
3.3.4 Jobs including Spin-offs: SFU-TGG Final Estimate
As shown in Section 3.2.4, The SFU-TGG Initial Estimate may still overstate likely
actual job impacts. Especially given the tight labour market conditions expected for the
period when TMX might be constructed, building TMX might actually result in only 6000
(or less) person-years of employment in Metro Vancouver (including a very wide range
of economic spin-offs).31 Averaged over a 3-year period for construction and related
activity, this is 2000 jobs/year (or less), which is substantially less than 0.2% of the
regional total.
Given expected labour market conditions and other constraints on Metro Vancouver
economic activity for the period when TMX might be constructed, it is unlikely that there
will actually be a large increase in overall Metro Vancouver employment and economic
activity due to TMX. To the extent that building TMX has benefits for BC jobs and
workers, these benefits are short-term (over a 2-3 year period) and likely to be relatively
small (substantially less than 0.2% of the regional total).
This SFU-TGG Final Estimate demonstrates that developing and constructing TMX
might actually result in only one-third (or less) of the Metro Vancouver jobs based on
KM/TMP’s estimates for TMX. Actual results (including a very wide range of economic
spin-offs) will be 6000 or less person-years of Metro Vancouver employment, compared
to the 19,000 person-years based on KM/TMP’s estimates.
Averaged over a 3-year period for construction and related activity, actual results
(including a very wide range of economic spin-offs) will be 2000 jobs/year (or less) of
Metro Vancouver employment, compared to the 6000 jobs/year based on KM/TMP’s
estimates. The short-term employment benefits of building TMX for Metro Vancouver
are illustrated in Figure 1.
3.4 Operating TMX: Long-term employment benefits for BC and Metro
Vancouver
The long-term employment benefits of operating TMX are minimal for BC and Metro
Vancouver. Moreover, KM/TMP’s employment estimates are very high relative to likely
actual impacts for operating TMX. See Figure 2.
31
This estimate of Metro Vancouver jobs (6000 or less person-years) is based on BC jobs (SFU-TGG final estimate of 12,000 or less person-years for building TMX) and assumes that slightly over half of provincial jobs will be in Metro Vancouver. See footnote 29 for more details on assumption that slightly over half of provincial jobs will be in Metro Vancouver.
SCHOOL OF PUBLIC POLICY
Economic Costs and Benefits of the Trans Mountain Expansion Project (TMX) for BC and Metro Vancouver 23
3.4.1 Jobs Including Spin-offs: KM/TMP Estimate
Including a very wide range of spin-offs throughout the supply chain and economy,
KM/TMP estimates that operating TMX would result in 1500-2000 jobs/year in all of
BC,32 over a 20-year period.33
KM/TMP estimates a range of employment impacts for operating TMX. The low end of
the range (1500 jobs/year including spin-offs) assumes that TMX only transports the
volume of crude specified in the firm contracts in place for shippers to use TMX.34 In this
scenario, TMX is estimated to generate annual revenues of $644 million.35
The high end of the range (2000 jobs/year including spin-offs) assumes that TMX is also
used for non-firm/spot transactions in addition to the firm contracts, such that TMX
capacity is fully utilized.36 In this scenario, TMX is estimated to generate annual
revenues of $835 million.37
The KM/TMP employment analysis characterizes these two scenarios as minimum and
maximum effects, with reality likely to fall somewhere in between.38
In the context of the BC economy, the long-term employment benefits of TMX are
minimal. Total employment in BC now exceeds 2.3 million. Even with all the spin-offs
and the maximum effects estimated by KM/TMP, operating TMX would result in only
2000 jobs/year, which is less than 0.1% of the current provincial total. And with the
minimum effects estimated by KM/TMP, operating TMX would result in only 1500
jobs/year, which is substantially less than 0.1% of the current provincial total.
The long-term employment benefits of TMX are also minimal in the context of the Metro
Vancouver economy. Total employment in Metro Vancouver now exceeds 1.3 million.
32
See footnote 15 for an explanation of how these estimates were generated and the spin-offs included. 33
The KM/TMP estimates are based on the 20-year period for which KM/TMP has firm contracts in place for shippers to use TMX. But TMX might actually operate for far more than 20 years and thus have job impacts over a longer period. The existing Trans Mountain Pipeline has been in operation for more than 60 years. 34
TMX has a nominal total capacity of 590,000 barrels/day, with firm contracts in place for about 410,000 barrels/day (about 70% of total capacity), leaving nominal capacity of about 180,000 barrels/day (about 30% of total capacity) available for non-firm/spot transactions. 35
These annual revenues for TMX are in addition to $300 million in annual revenues for the existing KM/TMP system. These annual revenues for TMX ($644 million) are for the entire project in both BC and Alberta. The costs to build TMX are mainly incurred for the BC component (69.5% of the total project costs), so it is reasonable to assume that a similar portion of the project revenues are attributable to the BC component of TMX. On this basis, TMX in BC will generate annual revenues of about $448 million. 36
See footnote 34. 37
As explained in footnote 35, these annual revenues for TMX are for the entire project in both BC and Alberta. Based on the portion of TMX costs in BC, TMX in BC will generate annual revenues of $580 million if the project capacity is fully utilized. 38
Conference Board Report (2013), p. 39.
SCHOOL OF PUBLIC POLICY
Economic Costs and Benefits of the Trans Mountain Expansion Project (TMX) for BC and Metro Vancouver 24
Meanwhile, only a portion of total BC jobs relating to TMX would be in Metro Vancouver
(vs. elsewhere in the province).39 So even with all the spin-offs estimated by KM/TMP,
TMX operations would result in about 800-1100 jobs in Metro Vancouver, which is less
than 0.1% of the regional total.
The BC and Metro Vancouver economies are growing. Even if TMX is not built, BC and
Vancouver will in the future have substantially more population, labour force,
employment, and other economic activity. TMX’s minimal long-term employment
benefits are even less significant in the context of this growth
Provincial growth will be concentrated in Metro Vancouver, which is expected to add
another 400,000 jobs by 2041.40 TMX would not significantly add to this growth.
But as the BC and Metro Vancouver economies continue to grow, the costs and risks
associated with TMX will increase. In the future, there will be even more people, jobs,
and other economic activity that are proximate to TMX and could be negatively
impacted by TMX.
Moreover, as will be explained below, KM/TMP’s employment estimates are very high
relative to likely actual impacts for operating TMX.
3.4.2 Jobs with Spin-offs vs. Direct Operating Workforce
The KM/TMP job estimates (discussed in Section 3.4.1) include a very wide range of
spin-offs throughout the supply chain and economy. Put simply, in addition to the
KM/TMP staffing (direct operating workforce), these employment estimates include
other jobs on-site and off-site (contractors providing construction, engineering,
technical, and support services); upstream (in the supply chain); and downstream (as
workers spend income from jobs upstream, off-site and on-site).
Jobs with spin-offs are estimated with an economic model, which is a highly simplified
representation of how the economy actually operates.41
39
KM/TMP estimates jobs including spin-offs at the provincial level and does not split out jobs in Metro Vancouver, vs. elsewhere in BC. Slightly over half of BC labour supply (and employment) is in Metro Vancouver, and on this basis the region might have a similarly large share of provincial job impacts relating to TMX. But only a relatively small portion of the TMX project is located within Metro Vancouver, so the region might actually have less (and perhaps substantially less) than half of provincial job impacts relating to TMX. See footnote 29 for more details. 40
http://www.metrovancouver.org/about/publications/Publications/20110729RegionalGrowthStrategyProjections20062041_TH.pdf 41
See footnote 15 for an explanation of how these estimates were generated and the spin-offs included.
SCHOOL OF PUBLIC POLICY
Economic Costs and Benefits of the Trans Mountain Expansion Project (TMX) for BC and Metro Vancouver 25
Separate from its job estimates with spin-offs, KM/TMP has also estimated the KM/TMP
staffing (direct operating workforce). KM/TMP estimates that operating TMX will create
only 50 direct full time jobs in BC (plus another 40 jobs in Alberta).
Thus, for all of BC, the direct operating workforce for TMX (40 jobs/year) is 2-3% of total
jobs with spin-offs estimated by KM/TMP for operating TMX (1500-2000 jobs/year
person-years). As shown by this comparison, virtually all (97-98%) of the jobs estimated
by KM/TMP for operating TMX would be contractors (on-site and off-site), up-stream,
and downstream.
Job estimates including spin-offs can be useful for understanding how a project may
affect total economic activity and employment in various sectors and locations. But
these estimates can be inaccurate, or even misleading, especially as a measure of net
benefits for a province (BC) or region (Metro Vancouver).42 As opposed to KM/TMP
staffing, jobs elsewhere (contractors, upstream, and downstream) are difficult to
measure and based on various data, assumptions, and methodology. Put very simply,
job estimates with spin-offs should be very carefully reviewed and interpreted.
Careful review and interpretation are especially warranted in the case of TMX, where
virtually all (97-98%) of jobs estimated by KM/TMP would be contractors, upstream, and
downstream.
We are particularly concerned about KM/TMP’s jobs analysis, in light of the range of
employment impacts that KM/TMP has estimated for jobs with spin-offs from operating
TMX. As explained in Section 3.4.1, the low end of KM/TMP’s range (1500 jobs/year
including spin-offs) assumes that TMX only transports the volume of crude specified in
the firm contracts with shippers. The high end of the range (2000 jobs/year including
spin-offs) assumes that TMX is also used for non-firm/spot transactions in addition to
the firm contracts, such that TMX capacity is fully utilized.
At the high end of the range, with TMX fully utilized, it is estimated to generate 30%
more revenue than at the low end of the range, with TMX only partially utilized.43 And on
that basis, KM/TMP estimates that there will 30% more jobs with spin-offs if KM/TMP is
fully utilized. Put more simply, KM/TMP assumes that jobs with spin-offs for operating
TMX are directly proportional to TMX revenues.
42
http://www.hydro.mb.ca/projects/development_plan/bc_documents/nfat_business_case_chapter_13_integrated_comparisons_of_development_plans_multiple_account_analysis.pdf 43
See footnotes 35 and 37 for more details on the revenues generated by TMX.
SCHOOL OF PUBLIC POLICY
Economic Costs and Benefits of the Trans Mountain Expansion Project (TMX) for BC and Metro Vancouver 26
But it is unlikely that there would actually be sizable additional jobs as a result of higher
TMX utilization and revenues. Pipelines (and associated facilities) are very capital
intensive and highly automated, such that operating costs are largely fixed, rather than
variable with utilization.44 As a result, higher utilization may increase revenues much
more than it increases operating costs (and jobs). Thus, KM/TMP may have
substantially higher profits if TMX is more fully utilized, but there may be little or no
added employment benefits for BC.
More generally, we are skeptical that operating TMX will result in the number of jobs
with spin-offs estimated by KM/TMP, given that TMX is an expansion of the existing
KM/TMP system. The resulting operating efficiencies will result in lower costs for
KM/TMP, as well as lower job impacts for BC.45
3.4.3 Jobs including Spin-offs: SFU-TGG Estimate
Given our concerns about the accuracy and meaningfulness of KM/TMP’s job
estimates, we have developed a SFU-TGG Estimate of jobs including spin-offs for
operating TMX.
As a starting point, we reviewed the KM/TMP job estimates and compared them with job
estimates for other major crude pipeline projects. In particular, we focused on the
Enbridge Northern Gateway and Energy East projects, since they each have
components that are broadly similar to the BC component of TMX. In particular, we
reviewed the job estimates with spin-offs for operating the BC component of Enbridge
Northern Gateway and the Quebec component of Energy East.46
Enbridge estimates that operating Northern Gateway would result in 2103 jobs/year
(including spin-offs) in BC.
TransCanada estimates that operating Energy East would result in 539 jobs/year
(including spin-offs) in Quebec.
44
Moreover, to the extent there are some additional operating costs with higher pipeline utilization, these type of incremental expenditures (notably additional electricity for pumping) may have small job impacts. 45
TMX will be remotely controlled from KM/TMP’s existing control centre in Edmonton, Alberta. Likewise, TMX will be maintained from existing KM/TMP bases in BC and Alberta, and operations and maintenance activities for KM/TMP will scheduled to coincide with activities on the existing KM/TMP system. The TMX staffing estimated by KM/TMP (50 jobs in BC and 40 jobs in Alberta) is in addition to the existing staff that operates the existing KM/TMP system. 46
As discussed in footnote 20, TMX and Northern Gateway both include a large expenditure component for facilities in BC (including pipeline and marine and storage terminals), as well as a smaller expenditure component for pipeline and other facilities in Alberta. The total Energy East project is much larger than TMX or Northern Gateway, but the Quebec component has facilities similar to the BC projects (including pipeline and marine and storage terminals). See footnote 22 for more details on Energy East.
SCHOOL OF PUBLIC POLICY
Economic Costs and Benefits of the Trans Mountain Expansion Project (TMX) for BC and Metro Vancouver 27
Compared with Northern Gateway, the Energy East Quebec component is more similar
to TMX. Energy East (Quebec) and TMX (BC) have similar capital costs (and thus scale
of facilities being operated). Moreover, they both involve adding a new crude pipeline
and other facilities largely paralleling an existing pipeline system operated by the same
company.47
By comparison, Northern Gateway (BC) has numerous factors that will increase
operating costs and associated employment. Northern Gateway is a much larger and
more complex project, as indicated by capital costs that are substantially higher (about
50%). Northern Gateway would involve operations on a new right-of-way in remote
areas, as well as a new, very large marine terminal.
Consistent with the factors above indicating higher operating costs and associated
employment for Northern Gateway (BC), this project would require a much larger direct
operating workforce than the 50-full time workers required for TMX (BC). Enbridge
estimates that operating Northern Gateway (BC) will require 78 workers, plus another
113 workers supplying services associated with operations of the Kitimat Terminal
(including tug operators, pilots, emergency response staff and various other service
providers).
Thus, compared with the jobs estimate for operating Northern Gateway, the jobs
estimate for operating Energy East (539 jobs/year) is more indicative of likely job
impacts for TMX. But it is possible that TMX in BC will have somewhat higher operating
costs and associated employment than would Energy East in Quebec. Notably, portions
to the TMX BC routing are mountainous and remote, while the Energy East routing in
Quebec is mostly in broad, relatively flat terrain proximate to the St. Lawrence River.
On this basis, it is reasonable to estimate that operating TMX might actually result in
only 800 (or less) jobs/year in BC (including a very wide range of economic spin-offs).
This is substantially less than 0.1% of the provincial total.
Operating TMX might actually result in only 400 (or less) jobs/year in Metro Vancouver
(including a very wide range of economic spin-offs).48 This is substantially less than
0.1% of the regional total.
47
In Quebec, Energy East would be an all new crude pipeline largely paralleling existing gas pipelines operated by TransCanada; in other provinces such as Ontario, Energy East would convert existing gas pipeline to crude service. 48
This estimate of Metro Vancouver jobs (400 or less jobs/year) is based on BC jobs (SFU-TGG estimate of 800 or less jobs/years for operating TMX) and assumes that slightly over half of provincial jobs will be in Metro Vancouver. See footnote 29 for more details on assumption that slightly over half of provincial jobs will be in Metro Vancouver.
SCHOOL OF PUBLIC POLICY
Economic Costs and Benefits of the Trans Mountain Expansion Project (TMX) for BC and Metro Vancouver 28
Labour demand is expected to grow faster than labour supply in BC, resulting in tight
labour market conditions (where the demand for workers surpasses the supply of
workers).49 Especially in a context of tight labour market conditions, actual job impacts
will be substantially lower than estimated by KM/TMP and possibly lower than the high
end of the range estimated by SFU-TGG (800 jobs/year in BC and 400 jobs/year in
Metro Vancouver).50 Thus, TMX’s minimal long-term employment benefits may be even
less significant.
The long-term employment benefits of operating TMX for BC and Metro Vancouver are
illustrated in Figure 2.
3.5 Operating TMX: Long-term Municipal Tax Benefits for BC and Metro
Vancouver
The long-term municipal tax benefits of operating TMX are small for BC and Metro
Vancouver. See Figure 3.
KM/TMP estimates that operating TMX will result in additional annual property tax
revenues of $23.2 million for BC communities along the TMX routing, including $7.5
million for the four Metro Vancouver communities ($6.2 million for Burnaby and a total of
$1.3 million for Coquitlam, Langley Township, and Surrey).51
BC property taxes are a relatively small expenditure for KM/TMP, equivalent to about 4-
5% of the revenues generated by the TMX project.52 Benefits from KM/TMP
expenditures (including property taxes) have already been taken into account as part of
the employment benefits from operating TMX.53 Thus, the TMX benefits in terms of
municipal property taxes (dollars) are not in addition to the TMX benefits in terms of
employment (jobs). Rather, tax revenues are another way of valuing the overall set of
benefits for TMX.
49
http://www.workbc.ca/WorkBC/media/WorkBC/Documents/Docs/BCLMOutlook.pdf 50
See footnote 25. 51
https://docs.neb-one.gc.ca/ll-eng/llisapi.dll/2393468/B5-38_-_V5B_ESA_13of16_SOCIOEC_-_A3S1S7.pdf?func=doc.Fetch&nodeid=2393468 pp. 7-185 – 7-185. KM/TMP elsewhere provides a lower estimate ($22.1 million) of additional property tax revenues for BC communities. https://docs.neb-one.gc.ca/ll-eng/llisapi.dll/2392679/B1-4_-_V2_3of4_PROJ_OVERVIEW_-_A3S0R0.pdf?func=doc.Fetch&nodeid=2392679 p. 2-42 52
As explained in footnotes 35 and 37, the BC component of TMX is estimated to generate annual revenues of at least $448 million, and could be as high as $580 million if TMX capacity is fully utilized. 53
Property taxes are a component of overall operating costs for TMX. The estimates of long-term jobs with spin-offs from operating TMX (see Section 3.4) are based on total operating costs for TMX or total revenues (which are higher than operating costs). So TMX property taxes have already been considered in terms of the jobs with spin-offs from operating TMX.
SCHOOL OF PUBLIC POLICY
Economic Costs and Benefits of the Trans Mountain Expansion Project (TMX) for BC and Metro Vancouver 29
TMX will result in some increased tax revenues for communities along the TMX routing,
and in turn this could result in some employment benefits (notably from increased
municipal spending). The employment benefits associated with increased property tax
revenues are included in the long-term jobs with spin-offs estimated by KM/TMP and
SFU-TGG.
That said, it is useful and informative to consider TMX benefits from a variety of
perspectives; this helps us to evaluate how TMX will affect BC and Metro Vancouver
and to place these benefits in the relevant provincial and regional contexts.
BC property taxes are a cost for KM/TMP, and a benefit for BC municipalities. For
KM/TMP, BC property taxes are a small cost, equivalent to about 4-5% of the revenues
generated by TMX. For BC municipalities, additional property tax revenues from TMX
are a very small source of revenue in the context of overall municipal revenues.54 In
2013, the BC communities that would receive tax revenues from TMX had over $2.4
billion ($2400 million) in total municipal revenues (from taxes and other sources).55
Additional property tax revenues from TMX are an average of only 0.9% of 2013 total
municipal revenues in these communities.56
Property tax revenues from TMX are especially small in the context of the four Metro
Vancouver communities along the TMX routing. In 2013, these four communities had
over $1.7 billion ($1700 million) in total municipal revenues (over $450 million in
Burnaby and a total of almost $1.3 billion ($1300 million) in Coquitlam, Langley
Township, and Surrey). Additional property tax revenues from TMX are thus only 0.4%
of 2013 total municipal revenues (from taxes and other sources) for these communities
(1.4% in Burnaby and an average of 0.1% in the other three).57
As shown in Section 3.4, the BC and Metro Vancouver economies are growing. Even if
TMX is not built, BC and Metro Vancouver will in the future have substantially more
population, labour force, employment, other economic activity, and municipal tax
54
The BC communities that would receive property tax revenues from TMX are mostly municipalities, but also include 3 Regional Districts outside of Metro Vancouver. Thus, it should be understood that “municipal” in this section of Report in some cases can refer (in part) to Regional Districts. 55
http://www.cscd.gov.bc.ca/lgd/infra/library/Schedule401_2013.xls http://www.cscd.gov.bc.ca/lgd/infra/library/Schedule901_2013.xls 56
Additional property tax revenues from TMX are an average of 1.9% of 2013 revenues specifically from taxes and grants in lieu of taxes (so excluding revenue from other sources) in these communities. While property tax revenues from TMX are typically small in the context of total tax and overall revenues for each community, revenues from TMX would be more significant in a few communities (notably Clearwater and Thompson-Nicola Regional District). 57
Incremental tax revenues from TMX are 0.9% of 2013 revenues specifically from taxes and grants in lieu of taxes (so excluding revenue from other sources) for the four Metro Vancouver communities (2.2% in Burnaby and an average of 0.2% in the other three).
SCHOOL OF PUBLIC POLICY
Economic Costs and Benefits of the Trans Mountain Expansion Project (TMX) for BC and Metro Vancouver 30
revenues.58 TMX’s small municipal tax benefits are even less significant in the context
of this growth.
Also, in evaluating the municipal property tax benefits from TMX, it is relevant to
consider that TMX may result in sizeable costs for these municipalities (and other BC
communities). In Section 4, we will consider economic costs/risk of TMX for BC and
Metro Vancouver, focusing on major spills that could have very high costs, notably for
the communities along the TMX routing. But even prior to consideration of spill costs, it
should be noted that that increased revenues from property taxes can be accompanied
by increased costs to provide services (including infrastructure such as roads) that will
be impacted by the proposed project.59
Moreover, as the BC and Metro Vancouver economies continue to grow, the costs and
risks associated with TMX will increase. In the future, there will be even more people,
jobs, other economic activity, and municipal tax revenues that are proximate to TMX
and could be negatively impacted by TMX.
TMX will only provide additional property tax revenues to the communities directly along
the routing, but TMX could negatively impact communities in a broader area. Notably
TMX will provide only a small amount of incremental tax revenue ($7.5 million as
estimated by KM/TMP) for the four Metro Vancouver communities directly along the
TMX routing, but it could negatively impact the City of Vancouver and the entire Metro
Vancouver region. The incremental tax revenues from TMX are even smaller in the
context of overall municipal revenues in the broader area that could be negatively
impacted by TMX. The long-term municipal tax benefits for BC and Metro Vancouver
are illustrated in Figure 3.
3.6 Fiscal benefits for governments
KM/TMP also estimates that TMX will have fiscal benefits for BC in terms of increased
tax revenues for the provincial and federal governments. These fiscal benefits include
58
See for example Financial Plans for the four Metro Vancouver communities along the TMX routing: http://www.burnaby.ca/Assets/our+city+hall/financial+reports/2014+Provisional+Financial+Plan.pdf http://www.coquitlam.ca/Libraries/City_Hall_Files/City_of_Coquitlam_Financial_Plan_2014.sflb.ashx http://www.tol.ca/Portals/0/township%20of%20langley/mayor%20and%20council/bylaws/Bylaw%204988%20-%202013%20-%202017%20Five%20Year%20Financial%20Plan.pdf?timestamp=1414865889288 http://www.surrey.ca/files/2014-2018_Financial_Plan_for_web(4).pdf 59
Put another way, property taxes can be viewed as a fee for services, albeit a fee that may not be closely matched to the cost of services for individual taxpayers.
SCHOOL OF PUBLIC POLICY
Economic Costs and Benefits of the Trans Mountain Expansion Project (TMX) for BC and Metro Vancouver 31
the three following components, which will be considered in the sections below: building
TMX, operating TMX, and increased revenues for crude producers. See Figure 4.
3.6.1 Building TMX
The fiscal benefits of building TMX are small for BC and Metro Vancouver, as well as
very short-term (concentrated into a 2-3 year period of construction and related
activity).60 Moreover, the benefits estimated by KM/TMP are very high relative to likely
actual benefits from building TMX.
KM/TMP estimates that building TMX will result in increased tax revenues for the BC
provincial government of $309 million/year (2012 $).
Averaged over a 3-year period for construction and related activity, this is about $100
million/year. BC provincial government total revenues are now in the order of $43
billion/year ($43,000 million/year (2012 $)).61 Thus, the increase in BC government
revenues estimated by KM/TMP for building TMX ($100 million/year for 3 years) is
equivalent to about 0.02% of current provincial government revenues ($43 billion/year).
KM/TMP also estimates that building TMX will result in increased tax revenues to the
federal government, and that BC will receive $86 million of fiscal benefits via federal
spending.62 Averaged over a 3-year period for construction and related activity, this is
about $30 million/year.
Including both increased tax revenues for the provincial government and increased
federal tax revenues spent in BC, KM/TMP estimates that building TMX will result in
total fiscal benefits for BC of $394 million. Averaged over a 3-year period for
construction and related activity, this is about $130 million/year, which is equivalent to
about 0.03% of current annual provincial government revenues.
The fiscal benefits estimated by KM/TMP substantially overstate likely actual fiscal
benefits for BC. As shown in Section 3.2, building TMX might actually result in only one-
third (or less) of the BC jobs estimated by KM/TMP. And to the extent that jobs are
60
See footnote 13. 61
http://www.bcbudget.gov.bc.ca/2013_June_Update/default.htm http://www.bcbudget.gov.bc.ca/2014/default.htm 62
KM/TMP analyzes a scenario where increased federal tax revenues filter down to the provinces through transfers and other program expenditures, which are assumed to be distributed on a straight per capita basis. BC has about 13% of the total Canadian population, and thus it is assumed that BC will receive 13% of the total federal tax revenues estimated for TMX.
SCHOOL OF PUBLIC POLICY
Economic Costs and Benefits of the Trans Mountain Expansion Project (TMX) for BC and Metro Vancouver 32
overestimated, other measures of economic activity (including fiscal benefits) will also
be overstated.63
The BC employment estimated by KM/TMP includes temporary workers that reside
outside of BC.64 As a result, fiscal benefits related to these jobs may flow to the home
provinces of these temporary workers, rather than to BC.65
Also, the fiscal benefits estimated by KM/TMP assume that any federal tax revenues
from TMX flow back to the provinces, including BC.66 But federal revenues could be
used for deficit reduction, rather than spending. Likewise, if they are spent, they might
be distributed on a different basis than that assumed by KM/TMP, such that BC
receives a smaller share.
Within the limited resources and time available for preparation of this Report, we cannot
readily quantify the likely fiscal benefits for BC from building TMX. But our preliminary
SFU-TGG Estimate is that they are likely less than $180 million, or $60 million/year
averaged over a 3-year period for construction and related activity. These fiscal benefits
for BC from building TMX are equivalent to about 0.01% of current annual provincial
government revenues.
63
KM/TMP’s analysis of fiscal benefits includes the following types of taxes: personal income, corporate profits, indirect (notably GST/PST), and other (notably contributions to social security programs). These taxes are tightly linked to jobs (and spending of income from jobs), although somewhat less so for corporate income taxes (which also has strong linkages to economic activity that is capital intensive). So compared with building TMX, operating TMX will not have as strong a relationship between jobs and fiscal benefits. KM/TMP’s estimated fiscal benefits from operating TMX are heavily weighted towards corporate taxes, as compared with the fiscal benefits from building TMX which have a larger component of personal income taxes and other taxes linked to jobs. See Conference Board Report (2013), pp. 25-27, 36-37. 64
As discussed in Sections 3.1.1 and 3.1.4, KM/TMP estimates that most of the workers building TMX will not be local. Labour from inside the regions along TMX will be only 16% (calculated as a weighted average) of the total BC direct construction workforce. It is possible that some of these non-local workers will come from other parts of BC, but most will probably come from outside the province. 65
Within the limited resources and time available for this project, we have not been able to more fully investigate this issue. But based on preliminary research, it is our understanding that personal income taxes are typically based on location of permanent residence, rather than location of work. A person files a tax return for the province in which they are residing on December 31 of the taxation year. A person will be determined to be resident in the province in which they have the most significant residential ties. See http://www.cra-arc.gc.ca/tx/tchncl/ncmtx/fls/s5/f1/s5-f1-c1-eng.html. 66
See footnote 62 for more details on the scenario assumed by KM/TMP. The KM/TMP analysis points out that transfer of fiscal benefits from the federal government to the provinces is contingent upon federal revenues being spent, rather than be used to reduce the deficit.
SCHOOL OF PUBLIC POLICY
Economic Costs and Benefits of the Trans Mountain Expansion Project (TMX) for BC and Metro Vancouver 33
In turn, any fiscal benefits flowing to Metro Vancouver will be even smaller, perhaps in
the order of half of the provincial benefits.67
3.6.2 Operating TMX
The long-term fiscal benefits of operating TMX are small for BC and Metro Vancouver.
KM/TMP estimates that operating TMX will result in increased tax revenues for the BC
provincial government of $36-47 million/year (2012 $).68 This is equivalent to about
0.01% of current provincial government revenues.
KM/TMP also estimates that operating TMX will result in increased tax revenues to the
federal government, and that BC will receive $10-12 million/year of fiscal benefits via
federal spending.
Including both increased tax revenues to the provincial government and increased
federal tax revenues spent in BC, KM/TMP estimates that operating TMX will result in
total fiscal benefits for BC of $46-60 million/year. This is also equivalent to about 0.01%
of current annual provincial government revenues.69
The fiscal benefits estimated by KM/TMP substantially overstate likely actual fiscal
benefits for BC. As shown in Section 3.4, operating TMX might actually result in only
about half (or less) of the BC jobs estimated by KM/TMP. And to the extent that jobs are
overestimated, other measures of economic activity (including fiscal benefits) will also
be overstated.70
Also, as discussed in Section 3.6.1, the fiscal benefits estimated by KM/TMP assume
that any federal tax revenues from TMX flow back to the provinces, including BC. But
federal revenues could be used for deficit reduction, rather than spending. Likewise, if
they are spent, they might be distributed on a different basis than that assumed by
KM/TMP, such that BC receives a smaller share.
67
As discussed in Sections 3.2.1 and 3.3.1 and footnote 39, Metro Vancouver has slightly more than half of the province’s population and economy, but the region might not receive this large a share of any fiscal benefits from TMX. 68
As was explained in Section 3.4.1 and footnotes 35 and 37, KM/TMP analyzes two scenarios for TMX operations: minimum effects with $644 million in annual revenue from firm contracts with shippers, and maximum effects with $835 million in annual revenue including non-firm transactions. 69
BC provincial government total revenues are now in the order of $43 billion/year (2012 $). See footnote 61 for sources. 70
See footnote 63 for discussion of the relationships between jobs and fiscal benefits. As explained there, compared with building TMX, operating TMX will not have as strong a relationship between jobs and fiscal benefits. Also, to the extent that TMX is used for non-firm transactions, this may result in relatively little additional employment, but it will provide additional revenue to KM/TMP and in turn fiscal benefits via federal and provincial corporate income taxes.
SCHOOL OF PUBLIC POLICY
Economic Costs and Benefits of the Trans Mountain Expansion Project (TMX) for BC and Metro Vancouver 34
Within the limited resources and time available for preparation of this Report, we cannot
readily quantify the likely fiscal benefits for BC from operating TMX. But our preliminary
SFU-TGG Estimate is that they could be $35-45 million/year (or less). These fiscal
benefits for BC from operating TMX are equivalent to about 0.01% of current annual
provincial government revenues.
In turn, any fiscal benefits flowing to Metro Vancouver will be even smaller, perhaps in
the order of half of the provincial benefits.71
3.6.3 Increased Revenues for Crude Producers
Alberta tar sands production has been growing, and pipeline capacity (including on the
existing KM/TMP system) is constrained. TMX would provide tar sands producers with
substantially expanded pipeline capacity to deliver their production to markets.
Moreover, TMX would connect tar sands to Pacific tidewater, facilitating access to US
West Coast and Asian markets.
KM/TMP estimates that TMX will result in higher heavy crude prices and increased
revenues for tar sands producers, with resulting fiscal benefits for BC.72 The estimated
increase in revenues to tar sands producers is quite large, averaging $1.5-2.3
billion/year73 (2012 $, over a 20-year period).74 But as explained below, the estimated
fiscal benefit for BC is quite small, averaging $27-40 million/year (2012 $, over a 20-
year period).75
The KM/TMP fiscal analysis of increased revenues for crude producers first estimates
increased tax revenues (and royalties) paid directly by the crude producers to the
provincial and federal governments. BC is not a heavy crude producer, so it receives no
fiscal benefits in terms of tax revenues paid directly to the provincial government.
71
See footnote 67. 72
The KM/TMP analysis assumes that TMX will affect pricing for all Western Canadian heavy crude production. Most of this is Alberta tar sands, but there is also some non-tar sands heavy crude production in Alberta and Saskatchewan. Thus, when we refer to tar sands in this section, it should be understood to sometimes include the relatively small amount of Western Canadian non-tar sands heavy crude. 73
The upper end of the range of increased revenues for tar sands producers ($2.3 billion/year) is for the KM/TMP Base Case, and the lower end of the range ($1.5 billion/year) is for an alternative case, with results for the other alternative case falling within this range. 74
See footnote 33 for more details on 20 year period. 75
The upper end of the range of fiscal benefits for BC ($40 million/year) is for the KM/TMP Base Case, and the lower end of the range ($27 million/year) is for an alternative case, with results for the other alternative case falling within this range.
SCHOOL OF PUBLIC POLICY
Economic Costs and Benefits of the Trans Mountain Expansion Project (TMX) for BC and Metro Vancouver 35
But the KM/TMP fiscal analysis then considers a scenario where the increased federal
tax revenues flow back to the provinces, including BC.76 And on that basis, KM/TMP
estimates that BC will receive $27-40 million/year of fiscal benefits via federal spending
of the tax revenues from tar sands producers. This is equivalent to less than 0.01% of
current annual provincial government revenues.77
To recap, KM/TMP estimates that TMX will result in higher crude prices and increased
revenues, some of which will be paid in taxes to the federal government, and some of
which will then flow back to BC. KM/TMP estimates that BC will receive only $27-40
million/year of fiscal benefits, which is less than 2% of the $1.5-2.3 billion of the
increased (before tax) revenues that tar sands producers are estimated to receive due
to TMX.
Based on KM/TMP’s own analysis, it is clear that BC will receive (at most) only a tiny
share of TMX benefits from increased revenues for crude producers. The issue of how
benefits are shared will be further considered in Section 3.7. The remainder of this
section will review KM/TMP’s analysis, in order to develop an SFU-TGG estimate of
likely fiscal benefits to BC from increased revenues to crude producers.
The KM/TMP fiscal analysis of increased revenues for crude producers is based on a
separate crude market analysis, which estimates increased revenues to crude
producers from TMX.78
The KM/TMP analysis forecasts that TMX will benefit all tar sands producers (whether
or not they are shippers on TMX). KM/TMP assumes that TMX will help to relieve
constraints on overall pipeline capacity and reduce the need for higher priced rail
deliveries; as a result, prices (net of pipeline and other logistics cost) are estimated to
be higher for all tar sands production.
By connecting tar sands to Pacific tidewater, TMX would facilitate access to US West
Coast and Asian markets. The KM/TMP analysis forecasts that tar sands producers will
receive higher prices (net of pipeline and other logistics costs) selling into these markets
(notably California and China), rather than into markets with pricing based on the US
Gulf Coast market. In estimating higher revenues to crude producers from TMX, the
76
See footnote 62 for more details on the scenario assumed by KM/TMP. The KM/TMP analysis points out that transfer of fiscal benefits from the federal government to the provinces is contingent upon federal revenues being spent, rather than be used to reduce the deficit. 77
BC provincial government total revenues are now in the order of $43 billion/year (2012 $). See footnote 61 for sources. 78
IHS Kelly Evidence (2013), https://docs.neb-one.gc.ca/ll-eng/llisapi.dll/fetch/2000/90464/90552/548311/956726/2392873/2451003/2385938/B1-5_-_V2_4of4_PROJ_OVERVIEW_-_A3S0R1.pdf?nodeid=2392869&vernum=-2 App. A, (PDF pp.1-68)
SCHOOL OF PUBLIC POLICY
Economic Costs and Benefits of the Trans Mountain Expansion Project (TMX) for BC and Metro Vancouver 36
KM/TMP analysis specifically assumes that shippers with firm capacity on TMX will use
50% of this capacity for deliveries to China and thus receive higher prices for these
deliveries. This pricing benefit to TMX shippers is in addition to the pricing benefit for all
tar sands producers discussed in the previous paragraph.
We have extensive expertise concerning crude markets, and in particular have
undertaken extensive reviews of crude market analyses for other major crude pipeline
projects.79 But in the context of the limited resources and time available for this Report,
we have undertaken a relatively brief review of the KM/TMP crude market analysis. As
explained above, the KM/TMP fiscal analysis estimates that BC shares receives less
than 2% of increased revenues to crude producers. Thus, we did not undertake an
extensive review of the KM/TMP crude market analysis, since increased revenues for
crude producers (even if greatly overstated) have only a relatively small impact in terms
of fiscal benefits for BC.
Based on available information and a number of considerations, it is credible that TMX
will have benefits for tar sands producers in terms of increased revenues;80 however,
these benefits are both difficult to predict and could be of considerably smaller
magnitude than claimed in the KM/TMP analysis.
Crude markets are rapidly evolving, highly dynamic, and subject to substantial volatility
and uncertainty, both short and long-term. Thus, it cannot be easily predicted how
pricing for crudes will evolve over time and specifically how much price advantage there
may be for selling into US West Coast and Asian markets, rather than into markets with
pricing based on the US Gulf Coast market. The KM/TMP crude market analysis is
based on crude price forecasts and other assumptions that are now almost a year old.
Meanwhile, crude markets and pricing continue to evolve very rapidly.
In recent years, the North American oil system has been undergoing dramatic shifts that
are large, rapid, ongoing, and possibly accelerating. Put very simply, Canadian and US
crude production is rapidly increasing, but Canadian and US demand for refining
products is stagnant or falling, such that crude imports (from overseas) are rapidly
falling and product exports (to overseas) are rapidly rising.
79
http://www.thegoodman.com/pdf/TGG20130422_Sierraetal_KeystoneXL_DSEISComments.pdf https://docs.neb-one.gc.ca/ll-eng/llisapi.dll/981156/C13-6-11_-_Attachment_E-_TGG_Evidence_NEB_Line_9B_20130806_-_A3J7U2.pdf?func=doc.Fetch&nodeid=981156 80
As discussed in footnote 34, KM/TMP has firm contracts in place with shippers for about 410,000 barrels/day, about 70% of total TMX capacity. This sizable commercial backing for TMX is a strong indication that TMX will have significant benefits for tar sands producers.
SCHOOL OF PUBLIC POLICY
Economic Costs and Benefits of the Trans Mountain Expansion Project (TMX) for BC and Metro Vancouver 37
While various forecasts have begun to take these dramatic shifts into account, there is
typically a significant lag. So it is fair to say that forecasts are now often a lagging
indicator of emerging shifts in oil markets. At some point in the future, conditions may
begin to stabilize, and forecasts may catch up to more fully reflect emerging future
realities. But for now and quite possibly for at least the next few years, each new
forecast will reflect major changes then emerging, and thus may differ substantially from
prior forecasts.
In particular, oil market forecasts will likely continue to play catch up until the boom in
shale/tight oil production levels off, or at least until it becomes better understood and its
future evolution becomes more predictable.
We are very aware of the difficulties of energy forecasting and policymaking, in general
and especially in a period of very rapid change. We share the view of some other
energy market analysts that the recent shifts in North American oil system (notably the
rapid increase in production from shale/tight oil, hydraulic fracturing (fracking), and
horizontal drilling) are likely to be ongoing and possibly accelerating, as they have been
for natural gas. But there are very large uncertainties associated with these shifts, and
many (including numerous environmental organizations) continue to be skeptical that
these shifts are likely to be sustained and are sustainable (in a variety of senses).
The lagging nature of oil market forecasts (and oil market analysis more generally)
matters for evaluating TMX. There is a wide range of opinion regarding future crude
prices (for both North American and global markets). Given the shifts underway in North
America and globally, crude prices have recently declined substantially from the levels
of the preceding several years. In particular, the decline in waterborne imports into
North America is certainly affecting crude pricing in North American markets, and this
large decrease in imports has also begun to put substantial downward pressure on
global crude prices.81
The TMX crude market analysis assumes that there will be a sizable price advantage
for selling into US West Coast and Asian markets, rather than into markets with pricing
based on the US Gulf Coast market. But large pricing differentials between these
81
This decline in crude prices is in line with our previous analyses of crude markets (see footnote 79), as well as the predictions of some other analysts; see for example, Verleger http://www.pkverlegerllc.com/assets/documents/TIE_W13_Verleger.pdf and Citi, Energy 2020: Independence Day https://www.citivelocity.com/citigps/ReportSeries.action https://ir.citi.com/dY2GZTnBVKoXNrT1sVyHcQCSQNAUUsI%2F8pXCARkTtvUOa8zDR2EckBRtxCGyJoDVW58uAgJ35%2BU%3D
SCHOOL OF PUBLIC POLICY
Economic Costs and Benefits of the Trans Mountain Expansion Project (TMX) for BC and Metro Vancouver 38
markets (and more generally between North American and global crudes) may not be
sustainable given evolving market conditions.
More generally, the KM/TMP market analysis assumes there will be substantial ongoing
growth in tar sands production. In the Base Case, production doubles over the assumed
20-year period of TMX operations; while in the alternative Low and High Cases,
production grows by 56% and 133%, respectively. Even leaving aside all of the other
reasons why ongoing growth in tar sands production may not be preferable or
achievable, tar sands expansion could be curtailed in the context of lower crude prices.
Thus, while it is credible that TMX will benefit tar sands producers, these benefits could
be of considerably smaller magnitude than estimated in the TMX crude market analysis
and assumed in the KM/TMP fiscal analysis.
Also, as discussed in Section 3.6.1, the fiscal benefits estimated by KM/TMP assume
that any federal tax revenues from TMX flow back to the provinces, including BC. But
federal revenues could be used for deficit reduction, rather than spending. Likewise, if
they are spent, they might be distributed on a different basis than that assumed by
KM/TMP, such that BC receives a smaller share.
Within the limited resources and time available for preparation of this Report, we cannot
readily quantify the likely fiscal benefits for BC from increased revenues for crude
producers. But our preliminary estimate is that they could be $0-30 million/year. These
fiscal benefits for BC are equivalent to substantially less than 0.01% of current annual
provincial government revenues.
In turn, any fiscal benefits flowing to Metro Vancouver will be even smaller, perhaps in
the order of half of the provincial benefits.82
Figure 4 illustrates the annual fiscal benefits for BC from TMX.
3.7 BC Share of TMX Benefits
BC’s share of TMX benefits is an important issue to be considered. We have already
provided some consideration of this issue as part of our review of the KM/TMP
employment, fiscal, and crude market analyses in Sections 3.2 through 3.6. In this
Section (3.7), we will focus on the issue of BC’s share of TMX benefits so that the
information from multiple analyses can be used in combination to provide useful insights
into how TMX benefits will be shared.
82
See footnote 67.
SCHOOL OF PUBLIC POLICY
Economic Costs and Benefits of the Trans Mountain Expansion Project (TMX) for BC and Metro Vancouver 39
As discussed in Section 2, the five minimum requirements that must be met for the BC
government to consider the construction and operation of heavy-oil pipelines within its
borders include:
British Columbia receives a fair share of the fiscal and economic benefits
of a proposed heavy-oil project that reflects the level, degree and nature of
the risk borne by the government, the environment and taxpayers.83
Our detailed review of the KM/TMP employment, fiscal, and crude market analyses
provides some useful insights into BC’s share of TMX benefits. As shown in Sections
3.2 through 3.6, the KM/TMP analysis of TMX benefits substantially overstates the likely
actual benefits, especially for BC. Nonetheless, a review of the KM/TMP analysis
provides useful insights into how TMX benefits will be shared.
In Section 3.7.1, we analyze how the benefits from building the BC component of TMX
will be shared between BC, other provinces, and the federal government. In Section,
3.7.2, we show how the benefits from operating the BC component of TMX will be
shared between KM/TMP, BC (including BC municipalities along the TMX routing),
other provinces, and the federal government. Finally, in Section 3.7.3, we analyze how
the benefits of increased revenues for crude producers from TMX will be shared
between tar sands producers, BC, Alberta, other provinces, and the federal
government. See Figure 4.
3.7.1 Building TMX
Based on the KM/TMP employment analysis, the employment benefits of building the
BC component of TMX mainly occur within BC. About three-quarters of total Canadian
jobs from building the BC component of TMX are in BC, with the remaining one-quarter
in supply chain and other spin-offs located in other provinces.84
As shown in Sections 3.3.3 and 3.3.4, the KM/TMP employment analysis substantially
overstates the likely actual jobs from building the BC component of TMX. The BC share
of actual jobs from building the BC component of TMX could be substantially lower than
the three-quarters share indicated by the KM/TMP jobs estimate.
The short-term jobs building TMX are estimated to have a large component of
temporary non-local workers (84% of the direct construction workforce). It is possible
that some of these non-local workers will come from other parts of BC, but most will 83
See footnote 8. 84
In this section (3.7.1), we focus on the sharing of benefits from building the BC component of TMX, as opposed to building the entire project (which also includes an Alberta component). As such, “other provinces” includes Alberta, but does not include the benefits in Alberta and elsewhere from building the Alberta component of TMX.
SCHOOL OF PUBLIC POLICY
Economic Costs and Benefits of the Trans Mountain Expansion Project (TMX) for BC and Metro Vancouver 40
probably come from outside the province. And given the tight labour market conditions
expected for the period when TMX might be built, many BC jobs are expected to be
filled by new migrants relocating from other provinces and countries.85
From a BC perspective, jobs located in BC may not actually be a net benefit for the
province if the labour supply is workers from other provinces (and countries).86 Thus, to
the extent that building TMX results in jobs located in BC, this employment benefit may
be shared with other provinces (and countries).
As shown in Section 3.6.1, the KM/TMP analysis of TMX fiscal benefits substantially
overstates the likely actual benefits for BC. KM/TMP estimates that building TMX will
result in total fiscal benefits for BC of $394 million, or about $130 million/year, averaged
over a 3-year period for construction and related activity). But our preliminary SFU-TGG
Estimate is that they are likely less than $180 million, or less than $60 million/year
averaged over a 3-year period for construction and related activity.
Within the limited resources and time available for preparation of this Report, our review
of fiscal benefits from operating TMX focused on the benefits for BC, as opposed to how
these benefits were shared between BC and the other provinces and the federal
government. But the review we undertook does provide some insights about how these
fiscal benefits are shared.
KM/TMP estimates that just over half of increased tax revenues from building TMX flow
to the federal government, as opposed to the provinces. The KM/TMP fiscal analysis is
based on the KM/TMP employment analysis, which estimates that building TMX in BC
will result in significant employment in BC, with some supply chain and other spin-offs in
other provinces. Thus, the increased tax revenues from building TMX are mainly related
to job income, as opposed to corporate income.87 And this mix of income results in
provincial tax revenues that are almost as large as federal tax revenues.
The KM/TMP fiscal analysis considers a scenario where the taxes paid to the federal
government will flow back to the provinces on a per capita basis.88 BC has only a small
part of the Canadian population (about 13%), so it does not receive much benefit from
85
http://www.workbc.ca/WorkBC/media/WorkBC/Documents/Docs/BCLMOutlook.pdf 86
As discussed in footnote 27, employment may not be a benefit from a provincial perspective, if the workers are migrants who did not previously reside in-province. 87
See footnote 63 for more details on the types of taxes considered in the KM/TMP fiscal analysis. 88
See footnote 49 for more details on the scenario assumed by KM/TMP.
SCHOOL OF PUBLIC POLICY
Economic Costs and Benefits of the Trans Mountain Expansion Project (TMX) for BC and Metro Vancouver 41
the assumed federal transfers; in reality, BC might receive a smaller share or possibly
no direct benefit from tax revenues paid to federal government.89
Building TMX does provide some benefits to BC, in the form of increased tax revenues;
however, these benefits are small, both absolutely and relatively.
Building TMX in BC also provides some benefits to the other provinces,90 in the form of
increased provincial tax revenues from supply chain and other spin-offs located in the
other provinces. But these direct benefits to other provinces are small.
Relative to direct fiscal benefits, the other provinces could receive a somewhat larger
benefit from building TMX in BC if federal revenues are flowed back to the provinces,
especially if distributed so that BC receives only a small share as assumed in the TMX
fiscal analysis.
Overall, BC receives less than half the fiscal benefits from building TMX in BC.
3.7.2 Operating TMX
Based on the KM/TMP employment analysis, the employment benefits of operating the
BC component of TMX mainly occur within BC. About three-quarters of total Canadian
jobs from operating the BC component of TMX are in BC, with the other one-quarter in
supply chain and other spin-offs located in other provinces.91
As shown in Section 3.4.3, the KM/TMP employment analysis substantially overstates
the likely actual jobs from operating the BC component of TMX. So it is possible that the
BC share of actual jobs from operating the BC component of TMX could be lower than
the three-quarters indicated by the KM/TMP jobs estimate.
In contrast with the short-term jobs building TMX that are estimated to have a large
component of temporary non-local workers, jobs operating TMX are long-term and thus
may be more likely to employ workers that are (or become) BC residents (and
taxpayers). Given the tight labour market conditions expected for the period when TMX
might be in-service, many BC jobs are expected to be filled by new migrants relocating
from other provinces and countries.92 From a BC perspective, employment for workers,
89
The KM/TMP analysis points out that transfer of fiscal benefits from the federal government to the provinces is contingent upon federal revenues being spent, rather than be used to reduce the deficit. 90
See footnote 84. 91
In this section (3.7.2), we focus on the sharing of benefits from operating the BC component of TMX, as opposed to operating the entire project (which also includes an Alberta component). As such, “other provinces” includes Alberta, but does not include the benefits in Alberta and elsewhere from operating the Alberta component of TMX. 92
http://www.workbc.ca/WorkBC/media/WorkBC/Documents/Docs/BCLMOutlook.pdf
SCHOOL OF PUBLIC POLICY
Economic Costs and Benefits of the Trans Mountain Expansion Project (TMX) for BC and Metro Vancouver 42
who did not previously reside in BC, may not constitute a net benefit for the province.93
Thus, to the extent that operating TMX results in jobs located in BC, this employment
benefit may be shared with workers from other provinces (and countries).
All of the property tax revenues from TMX operating in BC would flow to BC
municipalities, but these property taxes are small, both absolutely and relatively.
KM/TMP is estimated to receive annual revenues of at least $448 million from the BC
component of TMX, and revenues could be as high as $580 million if TMX capacity is
fully utilized.94 Meanwhile, BC property taxes ($23.2 million/year) are a relatively small
expenditure for KM/TMP, equivalent to about 4-5% of the revenues generated by the
TMX project.
As shown in Section 3.6.2, the KM/TMP analysis of TMX fiscal benefits substantially
overstates the likely actual benefits for BC. KM/TMP estimates that BC will receive fiscal
benefits from operating TMX of $46-60 million/year, equivalent to about 10% of the
revenues generated by the TMX project. But our preliminary SFU-TGG Estimate is that
they could be only $35-45 million/year (or less), which is less than 8% of the revenues
generated by the TMX project.
Within the limited resources and time available for preparation of this Report, our review
of fiscal benefits from operating TMX focused on the benefits for BC, as opposed to how
these benefits were shared between BC and the other provinces and the federal
government. But the review we undertook does provide some insights about how these
fiscal benefits are shared.
Increased tax revenues from operating TMX mainly flow to the federal government, as
opposed to the provinces. This reflects that TMX generates large corporate revenues
and thus sizable government revenues from corporate profit taxes, which mainly flow to
the federal government. In particular, operating TMX generates large revenues for
KM/TMP, which in turn pays a portion of these revenues in taxes, mainly to the federal
government.
The KM/TMP fiscal analysis considers a scenario where the taxes paid to the federal
government will flow back to the provinces on a per capita basis.95 BC has only a small
part of the Canadian population (about 13%), so it does not receive much benefit from
93
As discussed in footnote 27, employment may not be a benefit from a provincial perspective, if the workers are migrants who did not previously reside in-province. 94
See footnotes 35 and 37 for more details of how these revenues were estimated. 95
See footnote 49 for more details on the scenario assumed by KM/TMP.
SCHOOL OF PUBLIC POLICY
Economic Costs and Benefits of the Trans Mountain Expansion Project (TMX) for BC and Metro Vancouver 43
the assumed federal transfers; in reality, BC might receive a smaller share or possibly
no direct benefit from tax revenues paid to federal government.96
Thus, the benefits of operating TMX in BC flow mainly to KM/TMP, in the form of
increased revenues (before tax) and profits (after tax). Operating KM/TMP does provide
some benefits to BC, in the form of employment and increased tax revenues; however,
these benefits are very small, both absolutely and relatively.
Operating TMX in BC also provides some benefits to the federal government, in the
form of increased tax revenues. In turn, the benefits to the federal government may flow
back to the provinces, but (in the scenario assumed in the KM/TMP fiscal analysis) BC
receives only a 13% share, with the other 87% going to the other provinces.
Building TMX in BC also provides some direct fiscal benefits to the other provinces, in
the form of increased provincial tax revenues from supply chain and other spin-offs
located in the other provinces. But these direct benefits to other provinces are small.
Relative to direct fiscal benefits, the other provinces could receive a much larger benefit
from TMX operations in BC if federal revenues are flowed back to the provinces,
especially if distributed so that BC receives only a small share as assumed in the TMX
fiscal analysis.
Overall, BC receives less than half of the fiscal benefits from operating TMX in BC. Put
simply, most of the fiscal benefits go to the federal government, and if flowed back to
the provinces, almost all of this will go to the provinces other than BC
All of the property tax revenues from TMX operating in BC would flow to BC
municipalities, but these property taxes are small, both absolutely and relatively.
Moreover, the fiscal and municipal property tax benefits to BC are small relative to the
other benefits from operating TMX. The benefits of operating TMX in BC flow mainly to
KM/TMP, in the form of increased revenues (before tax) and profits (after tax).
3.7.3 Increased Revenues for Crude Producers
As shown in Section 3.6.3, the KM/TMP analysis of fiscal benefits from increased
revenues for crude producers may substantially overstate the likely actual benefits for
BC. But a review of the KM/TMP analysis provides useful insights into how the fiscal
and other benefits of increased revenues for crude producers will be shared. Based on
the KM/TMP fiscal analysis, BC receives only a tiny portion (less than 2%) of the
96
The KM/TMP analysis points out that transfer of fiscal benefits from the federal government to the provinces is contingent upon federal revenues being spent, rather than be used to reduce the deficit.
SCHOOL OF PUBLIC POLICY
Economic Costs and Benefits of the Trans Mountain Expansion Project (TMX) for BC and Metro Vancouver 44
benefits of increased revenues for crude producers from TMX.97 See bottom bar graph
of Figure 4.
Crude producers retain the large majority (almost 68%) of these benefits, with the
remainder (32%) paid in taxes and royalties to the federal (13%) and provincial
governments (Alberta 18% and Saskatchewan 1%).98 In turn, the KM/TMP fiscal
analysis assumes that the taxes paid to the federal government will flow back to the
provinces on a per capita basis. BC has only a small part of the Canadian population
(about 13%), so it does not receive much benefit from the assumed federal transfers.
Thus, BC gets less than 2% of the total benefits (BC gets 13% of the federal transfers,
which are coincidentally 13% of the increased revenues to crude producers). Alberta
gets almost 20% of the increased revenues to crude producers (18% directly in
provincial taxes and royalties, plus another less than 2% from federal transfers).99 The
rest of Canada (other than Alberta and BC) gets 11% (1% in taxes and royalties directly
to Saskatchewan, plus another 10% from federal transfers).
To summarize the results of the KM/TMP analysis, TMX has large benefits for crude
producers in terms of increased revenues, but BC gets less than 2% of these benefits.
The large majority (68%) of these benefits are retained by the tar sands producers as
net revenues after taxes and royalties, with most of the remainder (20%) going to
Alberta.100
3.7.4 Conclusions
As shown in Sections 3.7.1, 3.7.2, and 3.7.3, BC receives only a very small share of the
benefits from TMX.
97
In this section (3.7.3), we focus on the sharing of benefits from increased revenues to crude producers. These benefits result from the entire TMX project (including components in both BC and Alberta), which benefits crude producers via higher crude prices (net of pipeline and other logistics costs). As such, BC and Alberta are each considered individually as beneficiaries, and “other provinces” are provinces other than BC and Alberta. Likewise, tar sands producers are considered as beneficiaries (both before and after taxes and royalties). 98
As explained in footnote 72, the KM/TMP analysis assumes that TMX will affect pricing for all Western Canadian heavy crude production, including the relatively small amount in Saskatchewan. Thus, the KM/TMP analysis estimates that Saskatchewan will receive some benefit from higher crude producer revenues, via taxes and royalties paid directly to the provincial government. 99
Alberta has 11% of the Canadian population, and KM/TMP’s fiscal analysis thus assumes that Alberta will receive 11% of the total federal tax revenues estimated for TMX. Thus, Alberta gets almost as large a share of federal transfers (11%) as does BC (13%). But in addition to federal transfers, Alberta receives much larger benefits via taxes and royalties paid directly to the provincial government. 100
As discussed in footnotes 73 and 75, the KM/TMP analysis considers a Base Case and two alternative cases. The detailed data reported here for share of benefits are based on KM/TMP’s Base Case. But the results are very similar for the two alternative cases. In all cases, BC gets less than 2% of the total, with the large majority (67-70%) retained by the tar sands producers as net revenues after taxes and royalties, and most of the remainder going to Alberta (18-20%).
SCHOOL OF PUBLIC POLICY
Economic Costs and Benefits of the Trans Mountain Expansion Project (TMX) for BC and Metro Vancouver 45
Most of the benefits from TMX go to tar sands producers and KM/TMP.
TMX would provide tar sands producers with substantially expanded pipeline capacity to
deliver their production to markets. Moreover, TMX would connect tar sands to Pacific
tidewater, facilitating access to US West Coast and Asian markets. KM/TMP estimates
that TMX will result in higher heavy crude prices and increased revenues for tar sands
producers.
The estimated increase in revenues to tar sands producers is quite large, averaging
$1.5-2.3 billion/year (2012 $, over a 20-year period).101
Meanwhile, the estimated fiscal benefit for BC is relatively tiny, averaging $27-40
million/year (2012 $, over a 20-year period).102 In terms of allocation of the benefits, BC
gets less than 2% of the total benefits from increased revenues for crude producers.
Moreover, as has been shown above, the TMX benefits from increased revenues for
crude producers are a big part of overall benefits for TMX. Put simply, BC gets a tiny
share of the most important benefit, such that BC gets a small share of overall benefits
for TMX.
As starkly illustrated in the bottom bar graph of Figure 4, the benefits are unevenly
distributed among the provinces; and particularly unevenly distributed between the tar
sands producers and the provinces. Of the $2.270 billion in increased revenues to tar
sands producers (before-tax) from TMX raising crude prices, BC would a get less than
2% (or C$40 million) at the high range. In contrast, Alberta would receive 20% of these
benefits and other provinces, 11% (despite assuming no additional spill risk). The big
winners are the tar sands producers, who keep 68% (or C$1.1534 billion) of the
increased revenues after tax.
101
See footnote 73 for more details on the range estimated. See footnote 33 for more details on 20 year period. 102
See footnote 75 for more details on the range estimated.
SCHOOL OF PUBLIC POLICY
Economic Costs and Benefits of the Trans Mountain Expansion Project (TMX) for BC and Metro Vancouver 46
4 Economic Costs/Risks of TMX for BC and Metro
Vancouver
While we have provided an approximation of the economic benefits of TMX (under a
range of possible conditions), there is a high degree of uncertainty and a broad range of
potential costs. Despite the impossibility of making a precise determination of the costs
(or the risks) associated with the proposed pipeline, this Report can offer guidance
concerning the relative magnitude of the costs versus the benefits.
Specifically, our main area of disagreement with KM/TMP is not related to the costs of
smaller (or even average) spills, but rather the magnitude of bad to worst-case
scenarios that are possible with a pipeline that runs through Metro Vancouver
(proximate to people, water and economic activity) and with the potential of a spill to
sea. Using a range of relevant real-world examples of major oil and gas transport
accidents, we determine a range of bad to worst-case scenario costs for an onshore
spill in Section 4.1. In Section 4.2, we discuss the concentration of current and future
risks of a worst-case scenario in Metro Vancouver. Section 4.3 examines the potential
costs and risks of a marine spill resulting from TMX and Section 4.4 reviews KM/TMP's
estimates for the worst-case scenarios. Section 4.5 outlines our concerns about
KM/TMP's capability to cover damages in a worst-case scenario. In Section 5, we
compare approximated benefits with this range of bad to worst-case scenario costs.
4.1 Range of Bad-to-Worst-Case Scenario Costs for an Onshore Spill
We are highly concerned with the catastrophic impacts of a major TMX pipeline rupture,
particularly in the more densely populated areas (proximate to people, water and
economic activity) along the route (and particularly as it crosses Metro Vancouver). We
will make the case that KM/TMP, a wholly-owned subsidiary of Kinder Morgan has
vastly underestimated these potential costs. The Company has estimated that the
potential cleanup and damage costs of an oil spill under the worst-case scenario would
range from C$100-$300 million.103 The Report will demonstrate in this section that the
costs of a bad scenario could start at $1 billion with a worst-case scenario ranging from
$2-$5 billion. See Figure 5.
We have limited our cost analysis to costs that directly affect economic activity and can
be somewhat readily (albeit approximately) quantified using market economics. These
103
This estimate is a rounding off of the results of high damage cost scenario (i.e. worst-case scenario) filed by KM/TMP as part of its evidence in the current NEB case. See footnote 120 for more details.
SCHOOL OF PUBLIC POLICY
Economic Costs and Benefits of the Trans Mountain Expansion Project (TMX) for BC and Metro Vancouver 47
costs escalate very quickly in more populated urban areas. Moreover, as we have
witnessed firsthand in Quebec in 2012 and Qingdao (China) in 2013, a major crude
accident can result in the loss of human life. Therefore our determination of worst-case
examples will be derived from examples of onshore spills. As discussed in Section 4.3,
TMX will also increase tanker traffic and thus the risk of marine spills. Such spills will
further increase the costs/risks of TMX.
To illustrate the range of cost magnitudes and potential effects of an accident or
malfunction on TMX, we have selected a variety of relevant examples of major oil and
gas transport accidents in a variety of relevant locations ranging from a somewhat
populated area (Marshall, MI), to a small town (Lac-Mégantic), to a residential area in
an urban setting (San Bruno, CA), to a densely populated urban area with an
accompanying marine spill (Qingdao, China). Some of these examples are more directly
comparable than others, but we have provided the range of examples to highlight that a
major accident/rupture on TMX will have very high costs with respect to damage and
disruption of infrastructure, particularly in Metro Vancouver.
The four relevant examples described in the table below are:
1. the spill of tar sands dilbit from Enbridge’s Line 6B in Marshall, MI (2010)
2. the explosion, fire and spill of Bakken crude from a train derailment in Lac-
Mégantic, QC (2013)
3. San Bruno natural gas pipeline rupture, explosion and fire in the San Francisco
metropolitan area (2010)
4. the crude oil pipeline rupture, explosion and fire in Qingdao with accompanying
marine spill (2013).
For each example, the table below will provide:
1. description of the disaster;
2. the cost and sources of the cost data;
3. the relevance of the example to TMX.
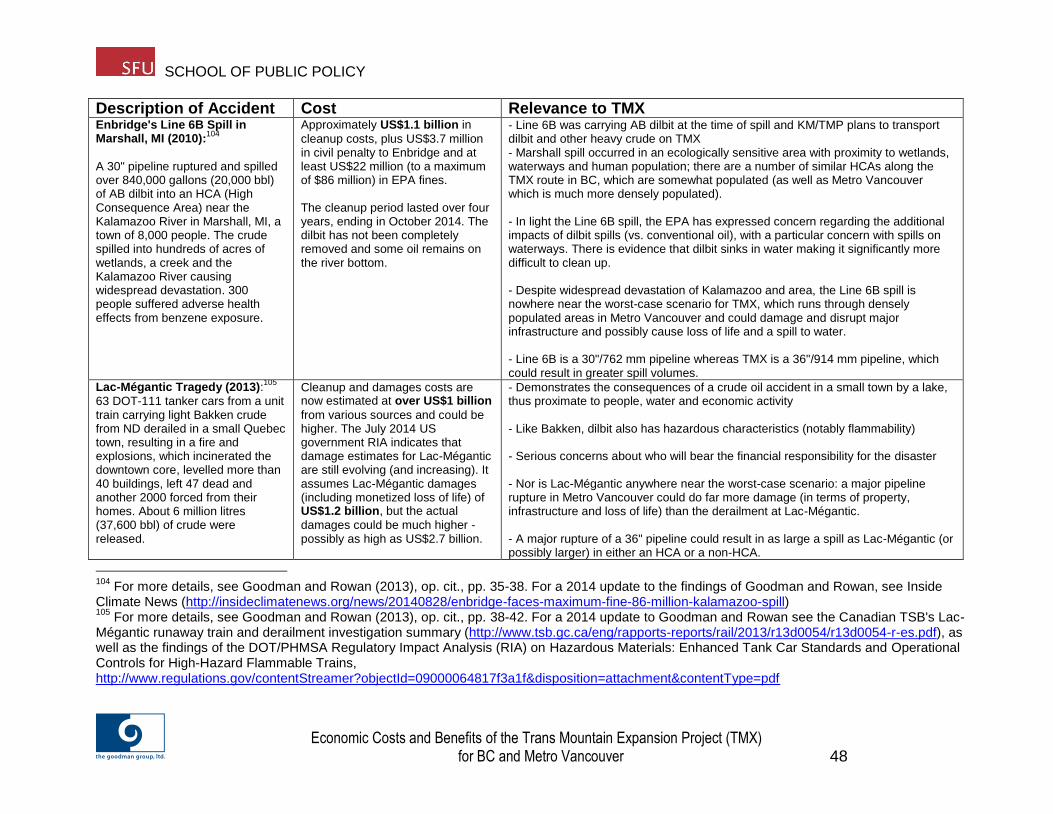
SCHOOL OF PUBLIC POLICY
Economic Costs and Benefits of the Trans Mountain Expansion Project (TMX)
for BC and Metro Vancouver 48
Description of Accident Cost Relevance to TMX Enbridge's Line 6B Spill in Marshall, MI (2010):
104
A 30" pipeline ruptured and spilled over 840,000 gallons (20,000 bbl) of AB dilbit into an HCA (High Consequence Area) near the Kalamazoo River in Marshall, MI, a town of 8,000 people. The crude spilled into hundreds of acres of wetlands, a creek and the Kalamazoo River causing widespread devastation. 300 people suffered adverse health effects from benzene exposure.
Approximately US$1.1 billion in
cleanup costs, plus US$3.7 million in civil penalty to Enbridge and at least US$22 million (to a maximum of $86 million) in EPA fines. The cleanup period lasted over four years, ending in October 2014. The dilbit has not been completely removed and some oil remains on the river bottom.
- Line 6B was carrying AB dilbit at the time of spill and KM/TMP plans to transport dilbit and other heavy crude on TMX - Marshall spill occurred in an ecologically sensitive area with proximity to wetlands, waterways and human population; there are a number of similar HCAs along the TMX route in BC, which are somewhat populated (as well as Metro Vancouver which is much more densely populated). - In light the Line 6B spill, the EPA has expressed concern regarding the additional impacts of dilbit spills (vs. conventional oil), with a particular concern with spills on waterways. There is evidence that dilbit sinks in water making it significantly more difficult to clean up. - Despite widespread devastation of Kalamazoo and area, the Line 6B spill is nowhere near the worst-case scenario for TMX, which runs through densely populated areas in Metro Vancouver and could damage and disrupt major infrastructure and possibly cause loss of life and a spill to water. - Line 6B is a 30"/762 mm pipeline whereas TMX is a 36"/914 mm pipeline, which could result in greater spill volumes.
Lac-Mégantic Tragedy (2013):105
63 DOT-111 tanker cars from a unit train carrying light Bakken crude from ND derailed in a small Quebec town, resulting in a fire and explosions, which incinerated the downtown core, levelled more than 40 buildings, left 47 dead and another 2000 forced from their homes. About 6 million litres (37,600 bbl) of crude were released.
Cleanup and damages costs are now estimated at over US$1 billion
from various sources and could be higher. The July 2014 US government RIA indicates that damage estimates for Lac-Mégantic are still evolving (and increasing). It assumes Lac-Mégantic damages (including monetized loss of life) of US$1.2 billion, but the actual
damages could be much higher - possibly as high as US$2.7 billion.
- Demonstrates the consequences of a crude oil accident in a small town by a lake, thus proximate to people, water and economic activity - Like Bakken, dilbit also has hazardous characteristics (notably flammability) - Serious concerns about who will bear the financial responsibility for the disaster - Nor is Lac-Mégantic anywhere near the worst-case scenario: a major pipeline rupture in Metro Vancouver could do far more damage (in terms of property, infrastructure and loss of life) than the derailment at Lac-Mégantic. - A major rupture of a 36" pipeline could result in as large a spill as Lac-Mégantic (or possibly larger) in either an HCA or a non-HCA.
104
For more details, see Goodman and Rowan (2013), op. cit., pp. 35-38. For a 2014 update to the findings of Goodman and Rowan, see Inside Climate News (http://insideclimatenews.org/news/20140828/enbridge-faces-maximum-fine-86-million-kalamazoo-spill) 105
For more details, see Goodman and Rowan (2013), op. cit., pp. 38-42. For a 2014 update to Goodman and Rowan see the Canadian TSB's Lac-Mégantic runaway train and derailment investigation summary (http://www.tsb.gc.ca/eng/rapports-reports/rail/2013/r13d0054/r13d0054-r-es.pdf), as well as the findings of the DOT/PHMSA Regulatory Impact Analysis (RIA) on Hazardous Materials: Enhanced Tank Car Standards and Operational Controls for High-Hazard Flammable Trains, http://www.regulations.gov/contentStreamer?objectId=09000064817f3a1f&disposition=attachment&contentType=pdf
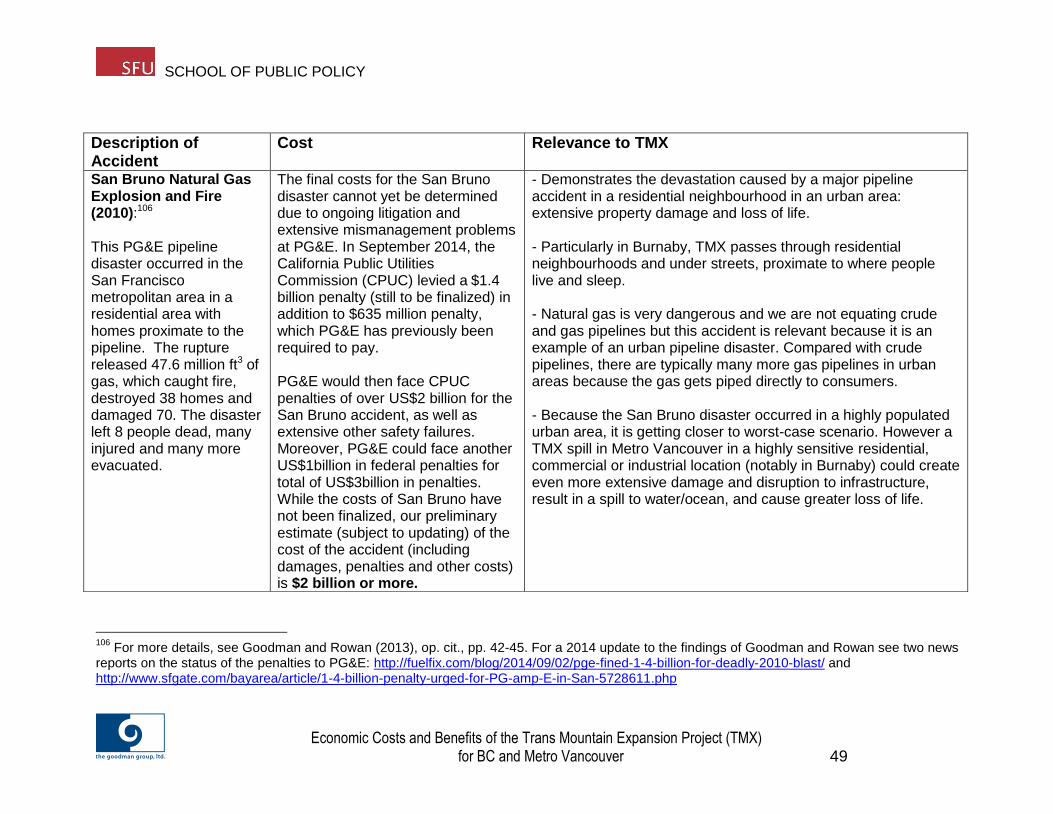
SCHOOL OF PUBLIC POLICY
Economic Costs and Benefits of the Trans Mountain Expansion Project (TMX)
for BC and Metro Vancouver 49
106
For more details, see Goodman and Rowan (2013), op. cit., pp. 42-45. For a 2014 update to the findings of Goodman and Rowan see two news reports on the status of the penalties to PG&E: http://fuelfix.com/blog/2014/09/02/pge-fined-1-4-billion-for-deadly-2010-blast/ and http://www.sfgate.com/bayarea/article/1-4-billion-penalty-urged-for-PG-amp-E-in-San-5728611.php
Description of Accident
Cost Relevance to TMX
San Bruno Natural Gas Explosion and Fire (2010):106 This PG&E pipeline disaster occurred in the San Francisco metropolitan area in a residential area with homes proximate to the pipeline. The rupture released 47.6 million ft3 of gas, which caught fire, destroyed 38 homes and damaged 70. The disaster left 8 people dead, many injured and many more evacuated.
The final costs for the San Bruno disaster cannot yet be determined due to ongoing litigation and extensive mismanagement problems at PG&E. In September 2014, the California Public Utilities Commission (CPUC) levied a $1.4 billion penalty (still to be finalized) in addition to $635 million penalty, which PG&E has previously been required to pay. PG&E would then face CPUC penalties of over US$2 billion for the San Bruno accident, as well as extensive other safety failures. Moreover, PG&E could face another US$1billion in federal penalties for total of US$3billion in penalties. While the costs of San Bruno have not been finalized, our preliminary estimate (subject to updating) of the cost of the accident (including damages, penalties and other costs) is $2 billion or more.
- Demonstrates the devastation caused by a major pipeline accident in a residential neighbourhood in an urban area: extensive property damage and loss of life. - Particularly in Burnaby, TMX passes through residential neighbourhoods and under streets, proximate to where people live and sleep. - Natural gas is very dangerous and we are not equating crude and gas pipelines but this accident is relevant because it is an example of an urban pipeline disaster. Compared with crude pipelines, there are typically many more gas pipelines in urban areas because the gas gets piped directly to consumers. - Because the San Bruno disaster occurred in a highly populated urban area, it is getting closer to worst-case scenario. However a TMX spill in Metro Vancouver in a highly sensitive residential, commercial or industrial location (notably in Burnaby) could create even more extensive damage and disruption to infrastructure, result in a spill to water/ocean, and cause greater loss of life.
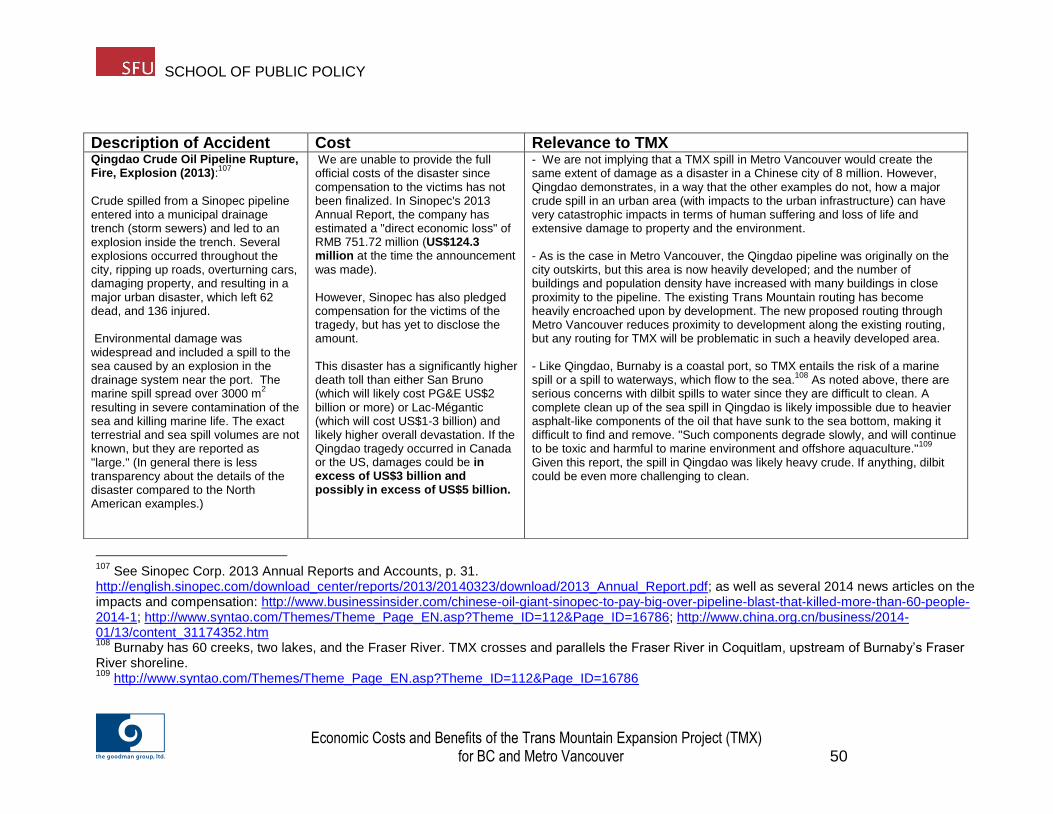
SCHOOL OF PUBLIC POLICY
Economic Costs and Benefits of the Trans Mountain Expansion Project (TMX)
for BC and Metro Vancouver 50
107
See Sinopec Corp. 2013 Annual Reports and Accounts, p. 31. http://english.sinopec.com/download_center/reports/2013/20140323/download/2013_Annual_Report.pdf; as well as several 2014 news articles on the impacts and compensation: http://www.businessinsider.com/chinese-oil-giant-sinopec-to-pay-big-over-pipeline-blast-that-killed-more-than-60-people-2014-1; http://www.syntao.com/Themes/Theme_Page_EN.asp?Theme_ID=112&Page_ID=16786; http://www.china.org.cn/business/2014-01/13/content_31174352.htm 108
Burnaby has 60 creeks, two lakes, and the Fraser River. TMX crosses and parallels the Fraser River in Coquitlam, upstream of Burnaby’s Fraser River shoreline. 109
http://www.syntao.com/Themes/Theme_Page_EN.asp?Theme_ID=112&Page_ID=16786
Description of Accident Cost Relevance to TMX Qingdao Crude Oil Pipeline Rupture, Fire, Explosion (2013):
107
Crude spilled from a Sinopec pipeline entered into a municipal drainage trench (storm sewers) and led to an explosion inside the trench. Several explosions occurred throughout the city, ripping up roads, overturning cars, damaging property, and resulting in a major urban disaster, which left 62 dead, and 136 injured. Environmental damage was widespread and included a spill to the sea caused by an explosion in the drainage system near the port. The marine spill spread over 3000 m
2
resulting in severe contamination of the sea and killing marine life. The exact terrestrial and sea spill volumes are not known, but they are reported as "large." (In general there is less transparency about the details of the disaster compared to the North American examples.)
We are unable to provide the full official costs of the disaster since compensation to the victims has not been finalized. In Sinopec's 2013 Annual Report, the company has estimated a "direct economic loss" of RMB 751.72 million (US$124.3 million at the time the announcement
was made). However, Sinopec has also pledged compensation for the victims of the tragedy, but has yet to disclose the amount. This disaster has a significantly higher death toll than either San Bruno (which will likely cost PG&E US$2 billion or more) or Lac-Mégantic (which will cost US$1-3 billion) and likely higher overall devastation. If the Qingdao tragedy occurred in Canada or the US, damages could be in excess of US$3 billion and possibly in excess of US$5 billion.
- We are not implying that a TMX spill in Metro Vancouver would create the same extent of damage as a disaster in a Chinese city of 8 million. However, Qingdao demonstrates, in a way that the other examples do not, how a major crude spill in an urban area (with impacts to the urban infrastructure) can have very catastrophic impacts in terms of human suffering and loss of life and extensive damage to property and the environment. - As is the case in Metro Vancouver, the Qingdao pipeline was originally on the city outskirts, but this area is now heavily developed; and the number of buildings and population density have increased with many buildings in close proximity to the pipeline. The existing Trans Mountain routing has become heavily encroached upon by development. The new proposed routing through Metro Vancouver reduces proximity to development along the existing routing, but any routing for TMX will be problematic in such a heavily developed area. - Like Qingdao, Burnaby is a coastal port, so TMX entails the risk of a marine spill or a spill to waterways, which flow to the sea.
108 As noted above, there are
serious concerns with dilbit spills to water since they are difficult to clean. A complete clean up of the sea spill in Qingdao is likely impossible due to heavier asphalt-like components of the oil that have sunk to the sea bottom, making it difficult to find and remove. "Such components degrade slowly, and will continue to be toxic and harmful to marine environment and offshore aquaculture."
109
Given this report, the spill in Qingdao was likely heavy crude. If anything, dilbit could be even more challenging to clean.
SCHOOL OF PUBLIC POLICY
Economic Costs and Benefits of the Trans Mountain Expansion Project (TMX) for BC and Metro Vancouver 51
Even with a narrow economic definition of costs (which excludes many environmental
impacts such as upstream GHGs, compromised ecosystem services, damage to plant
and animal habitat, harm to plant and animal species, and broader human health
impacts beyond injuries and death related to an accident), the potential cost of TMX
under a bad to worst-case scenario are very high. In fact, under a range of
malfunction/accident scenarios, these costs could escalate from significant to
catastrophic.
The Marshall MI example demonstrates that a pipeline accident involving a significant
dilbit spill to water in a somewhat populated non-metropolitan area (or in a less
populated area with very environmentally sensitive water and other resources) would
cost approximately US$1 billion. There are a number of HCAs (High Conequence
Areas) along the TMX routing in BC, which are somewhat populated and/or have very
environmentally sensitive water and other resources.110 In BC and specifically along the
TMX routing, topography and other factors concentrate infrastructure, other
development, and environmentally sensitive water and other resources into constrained
corridors (notably valleys). Trans Mountain Pipeline has proposed that TMX would
deviate from the existing Trans Mountain routing in some areas. This new routing would
reduce proximity to populated and other sensitive areas along the existing routing, but
any TMX routing can be problematic in areas of BC where populated and other
sensitive areas are concentrated owing to topography and other factors.
Therefore, the $US 1 billion cost of Marshall can be used as the basis for the cost of a
bad-case (but not worst-case) scenario in BC. The Lac-Mégantic example describes the
damage and death toll from a fire and explosions in a small town involving a derailed
train transporting Bakken crude. Based on various sources, the US Government's
Regulatory Impact Analysis (RIA) on Enhanced Tank Car Standards and Operational
Controls estimated that the Lac-Mégantic tragedy cost US$1.2 billion (including
monetized loss of life), but noted the costs were still evolving and the actual damages
could be much higher - possibly as high as US$2.7 billion.111
It is notable that the RIA concluded that major crude by rail accidents could result in
damages per accident of US$1.2 billion or more, with multi-billion dollar damages
110
https://docs.neb-one.gc.ca/ll-eng/llisapi.dll/2498451/B255-37_-_Part_6.2_Risk_Results_Report_-_A4A4E9.pdf?func=doc.Fetch&nodeid=2498451 https://docs.neb-one.gc.ca/ll-eng/llisapi.dll/2498756/B255-38_-_Part_6.2_Risk_Results_Report_Attachment_A_-_A4A4F0.pdf?func=doc.Fetch&nodeid=2498756 111
DOT/PHMSA Draft Regulatory Impact Analysis on Hazardous Materials: Enhanced Tank Car Standards and Operational Controls for High-Hazard Flammable Trains, July 2014. http://www.regulations.gov/contentStreamer?objectId=09000064817f3a1f&disposition=attachment&contentType=pdf
SCHOOL OF PUBLIC POLICY
Economic Costs and Benefits of the Trans Mountain Expansion Project (TMX) for BC and Metro Vancouver 52
(estimated at $5.8 billion or more) from a very high consequence accident (in areas with
high proximity to people, water, and economic activity). The RIA estimates for higher
consequence events (i.e. major catastrophic accidents resulting in large releases of
crude/ethanol and a sizable number of injuries and fatalities) are based on the Lac-
Mégantic accident, together with various assumptions about potential major
catastrophic accidents that could occur in the US. Like the authors of this Report, the
RIA concludes that Lac-Mégantic is not a worst case for a catastrophic rail accident,
since the Lac-Mégantic accident occurred in a small town in a mainly rural area (albeit
in a downtown area very proximate to the rail line and accident). Compared with Lac-
Mégantic, a major rail accident in an area that was more populous, congested, and/or
sensitive could result in much larger damages (including fatalities).112
While Marshall had devastating effects on wetlands and the Kalamazoo River, and the
Lac-Mégantic tragedy killed 47 people and incinerated a small town, neither is near the
worst-case scenario for TMX. A major pipeline rupture in Metro Vancouver could do far
more damage (in terms of property, infrastructure and loss of life) than either of these
catastrophes. As indicated above, a major rupture of a 36" pipeline under pressure
could result in as large a spill as Lac-Mégantic (or possibly larger) in either an HCA or a
non-HCA.
San Bruno and Qingdao provide relevant examples of how costs can rapidly escalate
when a disaster occurs in an urban area, which damages and disrupts infrastructure
and affects large numbers of people. While the costs of the San Bruno disaster have not
been finalized, our preliminary estimate (subject to updating) of the cost of the accident
(including damages, penalties and other costs) is $2 billion or more.
As indicated above, the full official costs of the Qingdao disaster are not still be
determined since compensation to the victims has not been finalized. Sinopec has
estimated a "direct economic loss" of US$124.3 million. However, Sinopec has also
pledged compensation for the victims of the tragedy, but has yet to disclose the amount.
$124.3 million in "direct economic loss" is very low and reflects the fact that internalized
costs probably are typically lower in China, in part because externalities are so high
(i.e., large costs are not internalized). It is challenging and controversial to estimate
externalities even in North America. And it is even more difficult in China where there
tends to be a lack of data and transparency.
112
Over the 20 year period 2015-2034, under the current safety regime, the RIA estimates there could be nine high consequence events similar to Lac-Mégantic (which would have environmental damages and monetized injury and fatality costs exceeding US$1.15 billion per event) and one very high consequence event with 5 times larger consequences (costs exceeding US$5.75 billion).
SCHOOL OF PUBLIC POLICY
Economic Costs and Benefits of the Trans Mountain Expansion Project (TMX) for BC and Metro Vancouver 53
It is fair to say that if an event like Qingdao occurred in North America, it would have
cost far more. This disaster has a significantly higher death toll than either San Bruno
(which will likely cost PG&E US$2-3 billion) or Lac-Mégantic (which will cost US$1-2
billion). If the Qingdao tragedy occurred in Canada or the US, damages could be in
excess of US$3 billion and possibly in excess of US$5 billion. As indicated in the
table above, we are not implying that a TMX spill in Metro Vancouver would create the
same extent of damage as a disaster in a Chinese city of 8 million. However, Qingdao
demonstrates in a way that the other examples do not, how a major crude spill in an
urban area (with impacts to the urban infrastructure) can have very catastrophic impacts
in terms of human suffering and loss of life and extensive damage to property and the
environment.
Under bad to worst-case scenarios, this Report concludes that the potential costs for a
major rupture in an HCA but not an urban setting (similar to Marshall) could start at
US$1 billion (bad scenario). If a major accident occurred in a more densely populated
area (such as Burnaby), damaging and disrupting key infrastructure, and possibly
resulting in a spill to water, these costs could escalate to multi-billion dollar damages,
potentially as high as US$2-5 billion (worst-case scenario).113 Given the hazardous
characteristics (notably flammability) of dilbit (with sizable amounts of diluent such as
condensate), an accident involving this pipeline could also involve loss of human life.
We note also that these estimates are very much in line with the RIA findings that major
crude by rail accidents could result in damages per accident of US$1 billion or more,
with multi-billion dollar damages (estimated at $5.8 billion or more) from a very high
consequence accident (in areas with high proximity to people, water, and economic
activity)
Our concerns about the high cost of bad to worst-case scenarios are further intensified
by recent reports of lack of adequate oil response resources and preparedness in BC
for both land and sea spills. If emergency response is delayed, spill damage and
cleanup costs increase - often dramatically. Slow and incompetent emergency
responses on the part of Enbridge in Marshall, MI and Sinopec in Qingdao turned a
pipeline rupture into a disaster in both cases.
113
The worst-case scenario range was drawn from consideration of the disasters at Lac-Mégantic and San Bruno (and an estimation of the costs of similar accidents in more densely populated more urban areas), as well as the very relevant example of Qingdao (and an estimation of the cost of a similar accident in North America). We are not implying that a TMX spill in Metro Vancouver would create the same extent of damage as a disaster in a Chinese city of 8 million. However, Qingdao demonstrates, in a way that the other examples do not, how a major crude spill in an urban area (with impacts to the urban infrastructure) can have very catastrophic impacts in terms of human suffering and loss of life and extensive damage to property and the environment.
SCHOOL OF PUBLIC POLICY
Economic Costs and Benefits of the Trans Mountain Expansion Project (TMX) for BC and Metro Vancouver 54
4.2 Concentration of Current and Future Risks in Metro Vancouver
As discussed above, this Report has determined that a bad-case scenario (which could
cost US$1billion) would involve a major rupture in in an HCA but not an urban setting
(similar to Marshall, MI). A number of areas along the TMX route in BC outside Metro
Vancouver are at risk for a bad-case scenario. We have concluded that the worst-case
scenario (which could cost US$2 billion to $5 billion) would involve a catastrophic
rupture in a more densely populated area damaging and disrupting key infrastructure.
The Metro Vancouver region is much more populous and urbanized than the rest of the
areas along the TMX route. Therefore Metro Vancouver is currently at the highest risk of
a worst-case scenario, and these risks will only increase over time.
The routing of the existing Trans Mountain pipeline through Metro Vancouver has
become heavily developed since the construction of the original pipeline in 1953. This is
similar to the situation in Qingdao: when the Chinese pipeline was originally constructed
it was on the outskirts of the city, but this area has subsequently developed into a highly
urbanized district.
KM/TMP has proposed that TMX would deviate from the existing Trans Mountain
routing from about 217th St. in Langley all the way west into Burnaby. This new routing
would reduce proximity to development along the existing routing, but any TMX routing
will be problematic in such a heavily developed area.114
The Metro Vancouver Region includes the following municipalities along the TMX
routing: Burnaby, Coquitlam, Surrey and Langley. These communities would then at risk
for a worst-case scenario due to the urbanized nature of the region and the specific
routing of TMX (and a very high proximity to people, water, and economic activity),
combined with a substantially expanded crude storage at the Burnaby Terminal.
Substantially expanded marine operations also put these communities at further risk for
tanker spills.
Furthermore, the risks and impacts of TMX will only increase over time in Metro
Vancouver. It is projected that there will be sizable ongoing growth in population and
employment throughout Metro Vancouver, but especially in the municipalities along the
114
We note with concern that KM/TMP has appealed to Burnaby residents with a letter stating that "[t]he ability to route through Burnaby Mountain would avoid several private homeowners and minimize community disruptions," and threatening that if the Company is unable to complete those studies soon, "we may have to pursue our alternate route through city streets." http://www.lillooetnews.net/burnaby-trans-mountain-both-looking-for-support-in-pipeline-fight-1.1390559#sthash.m3yzlANU.dpuf
SCHOOL OF PUBLIC POLICY
Economic Costs and Benefits of the Trans Mountain Expansion Project (TMX) for BC and Metro Vancouver 55
TMX routing.115 And to the extent that the municipalities along the TMX routing are
growing (and will in the future be even more populous and have even more employment
and other economic activity), this will further increase the potential costs and risks for
accidents during the many years in which TMX could be operating.
Moreover, TMX has potential costs and risks for the entire Metro Vancouver region,
including the City of Vancouver. And to the extent that the entire Metro Vancouver
region is growing, this will further increase the potential costs and risks associated with
TMX. The pipeline would result in substantially increased marine operations and
potential tanker spills. TMX could thus affect municipalities along the Burrard Inlet and
other coastal waters. Moreover, if TMX affects communities directly along the TMX
routing and/or along coastal waters, this could in turn have ripple effects in other Metro
Vancouver communities. And the potential for harmful ripple effects is significant, given
that TMX could directly impact populous communities throughout the region, as well as
major infrastructure and the port.
Of all the municipalities along TMX, Burnaby (the third largest city in BC) is exposed to
the highest concentration of risks of a worst-case scenario from TMX. This is due to its
large and growing population and diverse and growing economy, in combination with
the large concentration of oil infrastructure already hosted in Burnaby (including the
existing Trans Mountain pipeline, tank farms, and marine terminal; other tank farms and
marine terminals; and the Chevron refinery). Burnaby already has a disproportionate
exposure to the risks and impacts of oil infrastructure and it is has rejected TMX,
arguing that it is not the place for yet more oil infrastructure.
115
The following more detailed analysis of Metro Vancouver growth is based on the regional government’s “Regional Growth Strategy Projections: Population, Housing and Employment 2006 – 2041: Assumptions and Methods” (December 2011) http://www.metrovancouver.org/about/publications/Publications/20110729RegionalGrowthStrategyProjections20062041_TH.pdf: The four municipalities along TMX (Burnaby, Coquitlam, Surrey, and Langley Township) are estimated to have a combined population of 0.9 million in 2010, 1.2 million in 2021 and 1.5 million in 2041, as well as combined employment of 415k in 2010, 527k in 2021 and 687k in 2041. These four municipalities together now account for around 40% of Metro Vancouver’s population and about one-third of regional employment; however, they are estimated to account for about one-half of total regional growth in population and employment. It is not surprising that the municipalities along the TMX routing are such a large and growing part of the region. The Vancouver Region has limited remaining semi-rural land that is planned for future urban development, and almost all of the developable land is in the municipalities along the TMX routing. Langley and Surrey together have about 80% of land for future development, with the remainder in Coquitlam and Maple Ridge. Consistent with past experience, the Vancouver Region is expected to grow mainly via infill and intensification within existing developed areas. Development is expected to become denser, including in the municipalities along the TMX routing, which are already heavily developed (such as Burnaby).
SCHOOL OF PUBLIC POLICY
Economic Costs and Benefits of the Trans Mountain Expansion Project (TMX) for BC and Metro Vancouver 56
Burnaby has made an assertive and economically sophisticated case against TMX. In
explaining its opposition to TMX, Burnaby emphasizes that TMX is inappropriate in the
context of a large and growing Burnaby and Metro Vancouver region. Furthermore,
TMX has sizable costs and risks, which exceed the benefits for Burnaby, the region,
and BC. There is substantial agreement between Burnaby's Council Report on TMX and
this Report's analysis on the benefits and costs of TMX.116
Metro Vancouver is big and growing, but quite geographically constrained such that
development is expected to become denser. In light of this densification and the
important risk factors discussed above, this Report concludes (as does the City of
Burnaby), that TMX is a high-risk, low-value use of an increasingly high value
resource.117 This is true generally throughout BC, but even more true in the Metro
Vancouver region.
4.3 Costs for a Marine Spill
In Section 4.1, this Report has determined that the worst-case scenario would involve a
catastrophic pipeline rupture in a more densely populated urban area (as described
above), which could also involve a spill to sea or to a waterway. The authors of this
Report have considerable experience in estimating the costs of terrestrial spills.
But within the limited resources and time available for preparation of this Report, we
cannot readily quantify the worst-case scenario for a marine spill. We have determined,
however, that the risks and costs relating to marine operations and increased tanker
116
For more details on the City of Burnaby's strong arguments against TMX, see (a) Council Report: Kinder Morgan Proposed Trans Mountain Pipeline Expansion, May 23, https://burnaby.civicweb.net/Documents/DocumentList.aspx?ID=12710; and (b) City of Burnaby Website: Proposed Kinder Morgan Trans Mountain Expansion Project (TMEP), What is Burnaby’s Position? http://www.burnaby.ca/Proposed-Kinder-Morgan-Trans-Mountain-Expansion-Project.html 117
By "high value resource," we mean the land, water, ecosystems, communities and economies that are at risk from TMX. Even by the narrowest economic definition, Metro Vancouver and the communities along the TMX route are highly productive economies with high property and land values. Moreover, the route crosses many sensitive areas proximate to people water and economic activity. As discussed in this section, cleanup and damage costs for a dilbit spills to water are particularly problematic. And a major rupture in an urban area could disrupt and damage key infrastructure, resulting in very high costs. With projected high economic and population growth in Metro Vancouver, the costs of a catastrophic urban spill become even higher. Defining a high value resource more broadly, there is a strong consensus that BC, Metro Vancouver and the Pacific coast are the sites of extraordinary beauty and "a kingdom of abundance," which should be protected for their own sake and for the sake of all humanity. A recent video from the Province of BC illustrates this broader definition of a high value resource and the need to protect it: http://www.hellobc.com/?utm_campaign=ski2014-15ph2&utm_medium=vanityurl&utm_source=wildwithin.ca
SCHOOL OF PUBLIC POLICY
Economic Costs and Benefits of the Trans Mountain Expansion Project (TMX) for BC and Metro Vancouver 57
traffic will further increase overall costs/risk for TMX, even if a tanker spill would not
likely be the worst-case scenario.
TMX will substantially increase tanker traffic accessing the Westridge Marine Terminal
on Burrard Inlet in Burnaby. Furthermore, tanker spills can be very be very expensive.
In considering the costs and risks of a tanker spill for TMX, there are disastrous real-
world examples of offshore spills such as the Exxon Valdez and BP Deepwater Horizon.
However, these examples may not be as directly relevant for TMX. The Westridge
Marine Terminal does not accommodate supertankers, so the volume of oil that could
be spilled could be considerably less than that of a supertanker.
Nonetheless, the costs and risks of marine spills from TMX could be quite serious. A
number of recent reports and incidents118 have raised concerns that there is a general
lack of preparedness for emergency response in BC and that the existing liability
available for ship-source spills in insufficient (despite recent Federal
announcements119). However, in terms of economic costs for TMX, a tanker spill alone
would likely not be as expensive a worst-case scenario terrestrial spill in Metro
Vancouver as described above.
The risks and costs relating to marine operations and increased tanker traffic will further
increase overall costs/risk for TMX, even if a tanker spill would not likely be the worst-
case scenario. As discussed in footnote 112, the US Government's RIA (related to tank
car safety) estimated that over 20 years there could be nine high consequence events
similar to Mégantic (each costing $1.15 billion) and one very high consequence event
(costing $5.8 billion). Similarly, TMX could result in a very high consequence event (an
catastrophic terrestrial pipeline rupture in a densely populated urban area), as well as a
separate high consequence tanker spill. In this way, a tanker spill would add to the
overall cost/risk of the worst-case scenario for TMX.
118
2012 Fall Report of the Commissioner of the Environment and Sustainable Development, Chapter 2—Financial Assurances for Environmental Risks, Marine Transportation Sector, http://www.oag-bvg.gc.ca/internet/English/parl_cesd_201212_02_e_37711.html (February 2013); "B.C. oil spill response 'gaps' exposed in government email," http://www.cbc.ca/news/canada/british-columbia/b-c-oil-spill-response-gaps-exposed-in-government-email-1.2814468 (Oct 27, 2014). 119
World-Class Tanker Safety System: New measures to strengthen oil spill prevention, preparedness and response, and the polluter pay principle, http://news.gc.ca/web/article-en.do?nid=847489 (May 2014).
SCHOOL OF PUBLIC POLICY
Economic Costs and Benefits of the Trans Mountain Expansion Project (TMX) for BC and Metro Vancouver 58
4.4 KM/TMP's C$170-$316 Million Estimate for Worst-Case Scenario is
Far Too Low
This Report's main area of disagreement around the potential costs of TMX relates to
the cost of a worst-case scenario in an urban area with devastating consequences.
Based on real-world examples, we have estimated that costs for such a worst-case
scenario escalate to the multi-billion range, potentially as high as US$2-5 billion. In its
evidence in the NEB case, KM/TMP estimates costs for “credible” worst-case spill are
only C$170 million in an HCA or C$316M in a non-HCA.120 This section will discuss why
this estimate is far too low and fails to take into account the full-range of worst-case
scenarios.
KM/TMP's approach uses various spill data to determine a worst-case scenario in terms
of volumes spilled, as well as spill costs per barrel for both cleanup and damage. In
other words:
Cost of worst-case scenario = Volume spilled (in bbl) x Spill cost (in $/bbl)
of combined damage and cleanup costs
With relevant data for the volume spilled and the spill costs, this would not be an
unreasonable approach.
The first two rows of the following table illustrate how this approach has been used by
KM/TMP to determine the worst-case scenario costs in an HCA and a non-HCA. The
third row then supplies comparative data demonstrating how the Joint Review Panel
determined worst-case spill costs earlier this year in its Decision on Northern Gateway.
We then provide comparative data from the real-world examples of the accidents
Marshall and Lac-Mégantic (based on the review of these accidents above). For both
Marshall and Lac-Mégantic, the spill costs per barrel are derived from spill volume and
cost data. The final two rows of the table illustrate what the potential costs could be in a
120
https://docs.neb-one.gc.ca/ll-eng/llisapi.dll/2393434/B18-14_-_V7_APPG_CLEANUP_COST_POTEN_OIL_SPILL_-_A3S4W8.pdf?func=doc.Fetch&nodeid=2393434 See pp 16, 18, and especially, p. 24, Table B.2. On pp. 16 and 18, KM/TMP rounds off the results of its high damage cost scenario to a range between C$100-300 million. However, a closer review of the results of the high damage cost scenario in Table B.2 (p. 24), shows that costs in the high damage cost scenario range from C$102.9-$315.9 million with the worst-case HCA spill at C$170.2 million and the worst-case non-HCA spill at C$315.9 million, which we have rounded up to C$170 million and C$316 million, respectively.
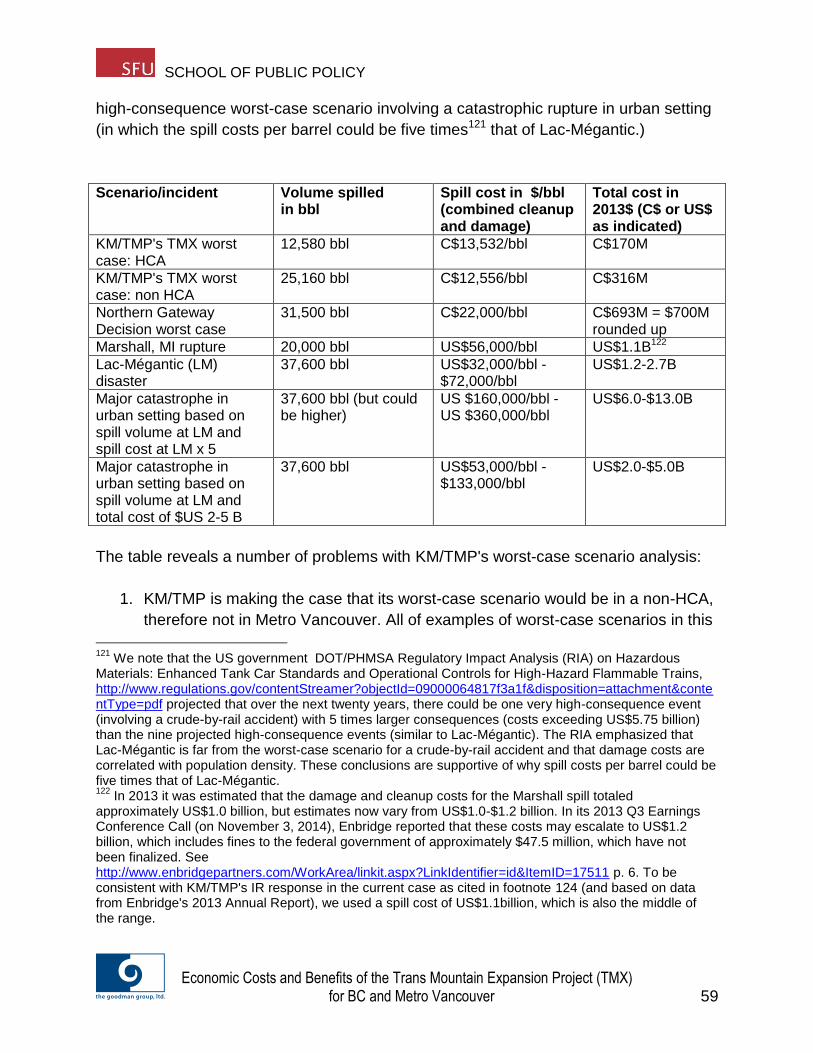
SCHOOL OF PUBLIC POLICY
Economic Costs and Benefits of the Trans Mountain Expansion Project (TMX) for BC and Metro Vancouver 59
high-consequence worst-case scenario involving a catastrophic rupture in urban setting
(in which the spill costs per barrel could be five times121 that of Lac-Mégantic.)
Scenario/incident Volume spilled in bbl
Spill cost in $/bbl (combined cleanup and damage)
Total cost in 2013$ (C$ or US$ as indicated)
KM/TMP's TMX worst case: HCA
12,580 bbl C$13,532/bbl C$170M
KM/TMP's TMX worst case: non HCA
25,160 bbl C$12,556/bbl C$316M
Northern Gateway Decision worst case
31,500 bbl C$22,000/bbl C$693M = $700M rounded up
Marshall, MI rupture 20,000 bbl US$56,000/bbl US$1.1B122
Lac-Mégantic (LM) disaster
37,600 bbl US$32,000/bbl - $72,000/bbl
US$1.2-2.7B
Major catastrophe in urban setting based on spill volume at LM and spill cost at LM x 5
37,600 bbl (but could be higher)
US $160,000/bbl - US $360,000/bbl
US$6.0-$13.0B
Major catastrophe in urban setting based on spill volume at LM and total cost of $US 2-5 B
37,600 bbl US$53,000/bbl - $133,000/bbl
US$2.0-$5.0B
The table reveals a number of problems with KM/TMP's worst-case scenario analysis:
1. KM/TMP is making the case that its worst-case scenario would be in a non-HCA,
therefore not in Metro Vancouver. All of examples of worst-case scenarios in this
121
We note that the US government DOT/PHMSA Regulatory Impact Analysis (RIA) on Hazardous Materials: Enhanced Tank Car Standards and Operational Controls for High-Hazard Flammable Trains, http://www.regulations.gov/contentStreamer?objectId=09000064817f3a1f&disposition=attachment&contentType=pdf projected that over the next twenty years, there could be one very high-consequence event (involving a crude-by-rail accident) with 5 times larger consequences (costs exceeding US$5.75 billion) than the nine projected high-consequence events (similar to Lac-Mégantic). The RIA emphasized that Lac-Mégantic is far from the worst-case scenario for a crude-by-rail accident and that damage costs are correlated with population density. These conclusions are supportive of why spill costs per barrel could be five times that of Lac-Mégantic. 122
In 2013 it was estimated that the damage and cleanup costs for the Marshall spill totaled approximately US$1.0 billion, but estimates now vary from US$1.0-$1.2 billion. In its 2013 Q3 Earnings Conference Call (on November 3, 2014), Enbridge reported that these costs may escalate to US$1.2 billion, which includes fines to the federal government of approximately $47.5 million, which have not been finalized. See http://www.enbridgepartners.com/WorkArea/linkit.aspx?LinkIdentifier=id&ItemID=17511 p. 6. To be consistent with KM/TMP's IR response in the current case as cited in footnote 124 (and based on data from Enbridge's 2013 Annual Report), we used a spill cost of US$1.1billion, which is also the middle of the range.
SCHOOL OF PUBLIC POLICY
Economic Costs and Benefits of the Trans Mountain Expansion Project (TMX) for BC and Metro Vancouver 60
Report involve HCAs, and the most expensive worst-case scenarios (San Bruno
and Qingdao) occur in highly urbanized areas with high proximity to people,
water, and economic activity.
KM/TMP justifies its position by maintaining that projected worst-case spill
volumes are higher in non-HCAs given that TMX is designed to reduce risks and
spill volumes in an HCA. While it may be true that worst-case spill volumes are
higher in non-HCAs, KM/TMP has assumed very similar (and very low) spill costs
in terms of dollars per barrel for both HCAs and non-HCAs. Based on our own
research, as well as the RIA conclusions, damage and cleanup costs for major
accidents are highly correlated with population density. Because TMX goes
through four densely populated and growing communities in Metro Vancouver, it
is surprising that KM/TMP has not provided a more thorough and realistic
investigation into the worst-case scenario of a major urban accident.
2. The worst-case spill volumes assumed by KM/TMP are significantly lower than
those assumed in the Northern Gateway decision, as well as the actual volume
spilled at Lac-Mégantic.
3. As introduced above, our major area of disagreement is that KM/TMP has vastly
underestimated worst-case spill costs (in dollars per barrel). Our position is
further supported by a comparison with the Northern Gateway decision, as well
as real-world examples. The JRP's spill cost/bbl is 63% higher than KM/TMP's
spill cost/bbl estimate for an HCA.123 Using real-world comparative spill-cost data
from Marshall and Lac-Mégantic, we note the following: Marshall's spill cost/bbl is
more than 4 times higher than KM/TMP's spill cost/bbl estimate for an HCA; Lac-
Mégantic's spill cost/bbl is 2.4 to 5.3 times higher than KM/TMP's spill cost/bbl
estimate for an HCA.
4. By using low volumes and very low spill costs in its worst-case scenarios,
KM/TMP fails to take into account the full range of worst-case scenarios. Part of
the problem may be related to the fact that the model used by KM/TMP's expert
is based on a data set of oil spills over the period of 1974-1999. This entire data
123
It is interesting to note that the worst-case costs for Northern Gateway (i.e. $700 million) are close to this Report's bad-case scenario of a major spill in a non-urban HCA. Although it could be argued that the Northern Gateway spill cost per barrel is on the low side for a worst-case scenario for Enbridge's project, it is more comparable to our data for a bad scenario for TMX (starting at US$1 billion). And this makes sense because unlike TMX, Northern Gateway does not cross any very populous urban communities similar to Metro Vancouver. But Northern Gateway does have very high proximity to very environmentally sensitive water and other resources, such that spill costs could be very high for a non-urban HCA.
SCHOOL OF PUBLIC POLICY
Economic Costs and Benefits of the Trans Mountain Expansion Project (TMX) for BC and Metro Vancouver 61
set predates the recent growth in North American production and transport of
more hazardous non-conventional crudes. Especially given the hazardous
characteristics (notably flammability) of dilbit (with sizable amounts of diluent
such as condensate), an accident on TMX could result in loss of human life,
particularly in a major urban centre. Furthermore, there is evidence that dilbit
sinks in water making it significantly more difficult to clean up, and thus
increasing cleanup costs (as exemplified by Marshall)
5. It is clear from the real-world comparative data related to Marshall and Lac-
Mégantic that a very large spill cost (of US$1 billion or more) typically involves
some combination of large/very large spill volume and a very high spill cost per
barrel. This combination can happen and has happened at Marshall and Lac-
Mégantic. And these spills are not the worst case for a major rupture in a
populous urban area (such as Metro Vancouver).
6. As indicated above, the second-last row of the table illustrates what the potential
costs could be in a more realistic worst-case scenario involving a catastrophic
rupture in urban setting (in which the spill costs per barrel could be five times that
of Lac-Mégantic.) Using the spill volumes for Lac-Mégantic with the very high
spill costs that are plausible at the high end of the estimates for an urban
disaster, a worst-case scenario could cost in the range of the US$6.0-13.0 billion.
This worst-case scenario cost is significantly higher than the US$2-5 billion
projected as the worst-case scenario in Section 4.1, and serves to illustrate that
very high consequence events could be even higher than US$2-5 billion.
7. The final row shows what spill costs per barrel would be necessary to produce
$2-5 billion spill using the same volumes as Mégantic: US$53,000/bbl -
$133,000/bbl. We note that the low end is less than the Marshall spill cost per
barrel (US$56,000/bbl) and the high end is only 2.4 times the unit spill cost at
Marshall, which seems highly credible given that Marshall is not an urban area.
So if anything, the worst-case scenario cost estimate of US$2-5 billion for a
catastrophic urban rupture in Metro Vancouver is conservative.
In the current NEB case, KM/TMP was asked in interrogatories about why the Company
was not using the Marshall accident as a basis for worst-case TMX spill costs. KM/TMP
SCHOOL OF PUBLIC POLICY
Economic Costs and Benefits of the Trans Mountain Expansion Project (TMX) for BC and Metro Vancouver 62
reports Marshall cost US$1.122 billion, and $56,000/barrel given a spill volume of
20,000 barrels.124
KM/TMP’s position is that Marshall is an atypical event and not a valid basis for
estimating TMX spill cost, since a) costs at Marshall were much higher owing to the very
slow and bungled response, and b) costs for US spills are generically higher than for
Canadian spills.125
This Report's position is that worst-case scenarios are by nature unusual events, which
are hard to predict, and typically involve multiple errors. They almost always involve
extenuating circumstances - malfunctions and/or defects in combination with detection
and response mistakes being made, and typically many mistakes lining up to create
very big problems.
In the case of the relevant examples of worst-case scenarios in Section 4.1 (Marshall,
San Bruno, Lac-Mégantic), the public had been assured that accidents of this
magnitude would not happen, but they did. And they keep happening.
Unlike the KM/TMP's model's outdated data set, all the examples in Section 4.1 are
very recent (2010 onward). The two crude disasters (Marshall and Mégantic) involved
big spills of non-conventional and more hazardous crude and occurred during the North
American oil boom, which involves transporting higher volumes of non-conventional and
more hazardous crude.
124
KM/TMP’s response to R Allan IR 1.18 q, https://docs.neb-one.gc.ca/ll-eng/llisapi.dll/2480550/B40-1_-_Trans_Mountain_Response_to_Allan_R_IR_No._1_-_A3X5V9.pdf?func=doc.Fetch&nodeid=2480550 125
See for example, KM/TMP's response to R Allan IR 1.18 u: In the case of the Enbridge Line 6B (“Kalamazoo” or “Marshall”) release, spill volumes and higher costs were related to extenuating circumstances associated with the spill. Regulators recognize that these circumstances make it an untypical spill. For example: · The National Transportation Safety Board observed the following: “The rupture and prolonged release were made possible by … failures … that included … Inadequate training of control center personnel, which allowed the rupture to remain undetected for 17 hours and through two startups of the pipeline.” · The NEB Joint Review Panel for the Northern Gateway Project – after examining the evidence – concluded with the view that: “The Panel accepts that the cleanup costs for the Marshall, Michigan spill were orders of magnitude higher because of the extended response time. … For this reason the Panel did not use the Marshall spill costs in its calculations.” Trans Mountain did not rely on the Marshall spill costs to inform the hypothetical spill scenarios that would be relevant to this Application. https://docs.neb-one.gc.ca/ll-eng/llisapi.dll/2480550/B40-1_-_Trans_Mountain_Response_to_Allan_R_IR_No._1_-_A3X5V9.pdf?func=doc.Fetch&nodeid=2480550
SCHOOL OF PUBLIC POLICY
Economic Costs and Benefits of the Trans Mountain Expansion Project (TMX) for BC and Metro Vancouver 63
Regarding, KM/TMP's position that US spills are generically higher than Canadian spills,
Lac-Mégantic, the most expensive onshore oil transportation disaster to date in North
America, occurred in Canada, and it is far from a worst-case scenario.
This Report has made a strong case above as to why real-world examples are a better
basis for estimating the costs of worst-case scenarios. KM/TMP's estimates of the costs
for “credible” worst case spill (C$170 million in an HCA and C$316 million in a non-
HCA) are based on a model that underestimates potential spill volumes and vastly
underestimates spill costs per barrel. And this is particularly true for a worst-case
scenario in an urban area (like Metro Vancouver).
Low volumes and very low spill costs fail to take into account the full range of worst-
case scenarios, and particularly the costs of our worst-case scenario for TMX, i.e. a
very high consequence urban rupture in Metro Vancouver. However, KM/TMP's
approach for estimating the cost of worst-case scenario (by multiplying spill cost and
spill volume of combined damage and cleanup costs) can be used with relevant and up-
to-date real-world spill data. The result of this calculation (in the second-last row of the
table above) serves to further underscore that our estimate of US$2-5B for a worst-
scenario is highly credible and may even be conservative. Figure 5 compares the SFU-
TGG cost estimates of a bad to worst-case scenario for TMX against the estimates
provided by KM/TMP.
4.5 Concerns about KM/TMP's Capability to Cover Damages in a Worst-
Case Scenario
In response to a series of interrogatories in the current case, KM/TMP has assured the
NEB that it has sufficient financial capacity to cover its projected worst-case scenario of
C$300 million "or even the $1 billion financial capacity that is anticipated to be legislated
by the federal government."126 In its responses, the Company claims to have to have
C$750 million in insurance (C$150 million specific to pollution events from KM Canada
properties including TMP, plus $600 million for general liability insurance for all KM
activities including in the US). KM comments that the details of the new federal
requirements (notably for $1 billion in financial capacity) have not been established, but
126
See especially KM/TMP response to NEB IRs 1.7-1.10: https://docs.neb-one.gc.ca/ll-eng/llisapi.dll/2456419/B32-2_-_Trans_Mountain_Response_to_NEB_IR_No._1_1_of_2_-_A3W9H8.pdf?func=doc.Fetch&nodeid=2456419
SCHOOL OF PUBLIC POLICY
Economic Costs and Benefits of the Trans Mountain Expansion Project (TMX) for BC and Metro Vancouver 64
the Company claims it will comply with whatever standards are put in place. In addition
to insurance, KM points out that it has extensive other financial resources.
However, given the very high costs of a more credible bad to worst-case scenario for
TMX (estimated at US$1-5 billion), we have concerns about KM's financial capability,
responsibility and willingness to mitigate and compensate for all the potential damages
for spills costing $1 billion or more.
In light of the Lac-Mégantic tragedy and concerns around the adequacy of MM&A’s127
(and other parties’) ability and willingness to pay for damages, we are particularly
concerned about the following questions surrounding KM’s insurance:
1. To what extent will KM/TMP be forced to internalize the costs of a major pipeline
accident/spill?
2. To what extent will the NEB direct KM/TMP to provide adequate financial
assurances as part of its decision in the TMX application?
3. Given the uncertainty around (1) and (2), to what extent does KM/TMP have the
proper incentives to buy enough insurance (as opposed to self-insuring based
on an assumption that the full costs of a major pipeline accident/spill will not be
internalized)?
4. To what extent will KM/TMP’s insurance actually operate to internalize the costs
of pipeline accident/spill (as opposed to the insurers acting to limit their payment
of claims such that costs are not actually internalized)?
5. Even if KM/TMP were willing to buy adequate insurance, to what extent would
such insurance be available at an affordable price?
Within the limited resources and time available for this Report, we have not been able to
conduct an in-depth review of KM/TMP’s insurance situation, and its legal obligations in
compensating for damages. But given our experience with liability issues for pipeline
and crude by rail transportation, as well as the high costs of a worst-case scenario, we
have concerns about KM/TMP’s capability/responsibility to internalize the costs in the
event of a major accident/spill (of $1 billion or more).
For smaller spills, it is more credible that KM/TMP could internalize the cost. But for bad
to worst-case scenarios (i.e. spills of $1 billion or more), it is possible (and even likely)
that taxpayers will end up paying for some portion of the damages and cleanup (and/or
127
MM&A (Montreal, Maine & Atlantic Railway), the operator of the unit train which spilled the crude at Lac-Mégantic, has declared bankruptcy.
SCHOOL OF PUBLIC POLICY
Economic Costs and Benefits of the Trans Mountain Expansion Project (TMX) for BC and Metro Vancouver 65
there will be significant residual damages that are not fully mitigated or compensated).
And these liability concerns only increase if spill costs escalate into the multi-billion
dollar range.
Finally we note that despite the federal government's May 2014 announcement of a
requirement of $1 billion in absolute liability for NEB-regulated pipelines,128 no
legislative changes have been enacted to date in the Canadian Parliament to make this
announcement into law; so there is currently no absolute liability requirement for NEB-
regulated pipelines.
128
"Minister Rickford Announces Latest Actions to Enhance Canada's World-Class Pipeline Safety System," May 14, 2014 http://news.gc.ca/web/article-en.do?nid=848059
SCHOOL OF PUBLIC POLICY
Economic Costs and Benefits of the Trans Mountain Expansion Project (TMX) for BC and Metro Vancouver 66
5 Comparisons of Costs and Benefits: A Summary
5.1 Results of Sections 3 (Benefits) and 4 (Costs)
Section 3 provided estimates of the benefits of TMX for BC (and Metro Vancouver if
applicable), including the employment benefits of building and operating TMX, property
tax benefits, fiscal benefits, and benefits of increased revenues to crude producers.
These respective benefits are contrasted with KM/TMP's estimates. Figures 1 to 4
summarize and compare the respective benefits estimates from SFU-TGG and
KM/TMP.
The Report concludes that the benefits of TMX are very small in the context of the BC
and Metro Vancouver economies. Moreover, these benefits have been significantly
overstated by KM/TMP.
Sections 3.2 and 3.3 show how KM/TMP has overestimated the short-term jobs from
building TMX by a factor of three in both BC and Metro Vancouver. The Company
maintains that building TMX will create 36,000 person-years of employment in BC
(including a wide range of spin-offs). But the Report has determined that TMX will only
create 12,000 person-years or less over the 3-year period for construction and related
activity. This is equivalent to 4000 jobs/year (or less) and to less than 0.2% of the total
provincial employment.
Similarly, for Metro Vancouver, the area most at risk for a catastrophic worst-case spill,
the Report has determined that building TMX will only create 6,000 person-years or less
over this period. This is equivalent to 2000 jobs/year (or less) and to substantially less
than 0.2% of the total regional employment. (See Figure 1.)
Section 3.4 discusses long-term jobs from operating TMX. KM/TMP estimates that
operating TMX will create only 50 direct full-time jobs in BC, but also claims that a wide
range of spin-offs could push the total up to almost 2000 jobs. Once again, these claims
are exaggerated: even with a wide range of spin-offs TMX will only create 800 long-term
jobs (or less). This is equivalent to approximately 0.03% of total BC employment.
Similarly, for Metro Vancouver, the Report has determined that building TMX will only
create 1,200 person-years or less over this period. This is equivalent to 400 jobs/year
(or less) and to less than 0.03% of the total regional employment. (See Figure 2.)
Section 3.5 demonstrates that TMX would provide only small property tax benefits for
BC communities along its route. For BC, these benefits (averaging less than 1% of 2013
SCHOOL OF PUBLIC POLICY
Economic Costs and Benefits of the Trans Mountain Expansion Project (TMX) for BC and Metro Vancouver 67
total municipal revenues) will be even smaller in the context of projected growth for
these communities. (See Figure 3.)
A review of the fiscal benefits in Section 3.6 also demonstrates the tiny returns to BC
from TMX. Kinder Morgan’s flawed analysis, which overstates jobs, also overstates tax
benefits from building and operating TMX. Based on the Company’s own estimates
regarding the increased revenues to tar sand producers from TMX, BC gets less than
2% of these revenues; tar sands producers retain 68%, and 31% goes to Alberta and
other provinces in royalties and corporate income taxes (paid directly to the provinces,
or paid to the federal government and then flowed back to the provinces). (See Figure
4.)
Despite KM/TMP's claims of significant economic benefits for BC and Metro Vancouver,
the employment benefits are much smaller than the Company has claimed; the property
tax benefits are small and even smaller when weighed against the growth projections
for the communities along the pipeline route; and fiscal benefits from TMX are tiny for
BC.
Regarding the costs of TMX, Section 4 concludes that under a bad to worst-case
scenario, the potential costs of a major rupture in a sensitive area, but non-urban setting
could start at US$1billion. Under a worst-case scenario involving a catastrophic rupture
in an urban setting (such as Metro Vancouver), costs could escalate to US$2-5 billion.
Moreover, these costs have been vastly underestimated by KM/TMP, which has
estimated a "credible" high-cost damage scenario would cost only C$100-$300 million
with the most expensive spill projected in a non-urban, non-sensitive area. (See Figure
5.)
As set out in Section 2, it is impossible to make a precise determination of the costs (or
risks) associated with the proposed pipeline; however, the Report can offer useful
guidance by comparing an estimate of the economic benefits against a range of bad to
worst-case scenario costs.
We have focused on the costs of bad to worst-scenarios because this is our core area
of disagreement with KM/TMP in regard to spill costs. Our main concern is not the costs
of smaller (or even average) spills because it is more likely that KM/TMP's can pay for
these spills (via insurance or even self-insurance). Instead, we are most concerned
about the costs of bad to worst-case scenarios that are possible given that TMX runs
through Metro Vancouver (proximate to people, water and economic activity), with the
potential of a spill to water. As discussed in Section 4.5, given the very high costs of a
bad to worst-case scenario for TMX, we have concerns about KM/TMP's financial
SCHOOL OF PUBLIC POLICY
Economic Costs and Benefits of the Trans Mountain Expansion Project (TMX) for BC and Metro Vancouver 68
capability, responsibility and willingness to mitigate and compensate for all the potential
damages for spills costing $1 billion or more.
To determine a range of bad to worst-case scenario costs for TMX, the SFU-TGG
Report has selected a variety of relevant examples of major oil and gas transport
accidents in a variety of relevant locations ranging from a somewhat populated area
(Marshall, MI), to a small town (Lac-Mégantic), to a residential area in an urban setting
(San Bruno, CA), to a densely populated urban area with an accompanying marine spill
(Qingdao, China). These examples demonstrate that even with a narrow economic
definition of costs, which excludes many broader environmental and human health
impacts (notably from increased GHGs), the potential cost of TMX under a bad to worst-
case scenario are very high. In fact, under a range of malfunction/accident scenarios,
these costs could escalate from significant to catastrophic.
Contrary to KM/TMP's findings, damage and cleanup costs for major accidents are
highly correlated with population density. So a worst-case scenario for TMX would
involve a major accident in a more densely populated area (such as Metro Vancouver).
Under bad to worst-case scenarios, this Report concludes that the potential costs for a
major rupture in an HCA but not an urban setting (similar to Marshall) could start at
US$1 billion (bad scenario).
If a major accident occurred in a more densely populated area (in Metro Vancouver),
damaging and disrupting key infrastructure, and possibly resulting in a spill to water,
these costs could escalate to multi-billion dollar damages, potentially as high as US$2-5
billion (worst-case scenario). Given the hazardous characteristics (notably
flammability) of dilbit (with sizable amounts of diluent such as condensate), an accident
involving this pipeline could also involve loss of human life.
5.2 Under a Range of Bad to Worst-Case Scenarios, Costs Will Exceed
Benefits
Sections 3 and 4 demonstrate that the benefits of TMX are very small and have been
significantly overstated by KM/TMP, whereas the worst-case costs of a catastrophic spill
are very large and have been vastly understated. Based on evaluation of the economic
costs and benefits in Sections 3 and 4, the SFU-TGG Report concludes that under a
range of bad to worst-case scenarios, the costs of TMX will exceed, or greatly exceed,
the benefits for both BC and Metro Vancouver.
We note once again that we have limited our cost analysis to environmental and socio-
economic impacts that directly affect economic activity, and that can be somewhat
readily (albeit approximately) quantified using market economics. The consideration of
human health and safety and the broader and cumulative environmental and other
SCHOOL OF PUBLIC POLICY
Economic Costs and Benefits of the Trans Mountain Expansion Project (TMX) for BC and Metro Vancouver 69
socio-economic costs (which excludes many broader environmental and human health
impacts (notably from increased GHGs) will further increase the overall costs of the
Project. However, TGG has concluded that our narrow comparison of more narrowly
defined economic costs and benefits (including a more limited consideration of socio-
economic and environmental impacts) is sufficient demonstration that under a range of
bad to worst-case scenarios, the costs of TMX will exceed, or greatly exceed, the
benefits for both BC and Metro Vancouver.
5.3 Highly Uneven Allocation of Costs and Benefits
In our review of the costs and the benefits of TMX, we have noted that the costs and
benefits are very unevenly allocated among various stakeholders and across regions.
The biggest costs and potential risks of the project are borne by the inhabitants of urban
areas (the four communities Metro Vancouver along the TMX route), where the worst-
case scenario related to a major pipeline disaster could occur. Because there is some
concern about Kinder Morgan's willingness and ability to pay all of the damages
associated with a worst-case scenario, BC and municipal taxpayers are also subject to
significant risks. Section 3 concludes that the employment, property tax and fiscal
benefits of TMX for both BC and Metro Vancouver are small in the context of the
regional and provincial economies, particularly when weighed against the risk of a major
spill. (See Figures 1-4.)
As discussed in greater detail in Section 3.7 and starkly illustrated in the bottom bar
graph of Figure 4, the benefits are unevenly distributed among the provinces; and
particularly unevenly distributed between the tar sands producers and the provinces. Of
the $2.270 billion in increased revenues to tar sands producers (before-tax) from TMX
raising crude prices, BC would a get less than 2% (or C$40 million) at the high range. In
contrast, Alberta would receive 20% of these benefits and other provinces, 11%
(despite assuming no additional spill risk). The big winners are the tar sands producers,
who keep 68% (or C$1.1534 billion) of the increased revenues after tax.
Tar sands crude producers will be able to increase profits by accessing higher priced
markets via access to tidewater. Furthermore, KM/TMP is also highly motivated to
extend its pipeline network and increase profits. Moreover, tar sands producers are
facing considerable uncertainty with respect to its Northern Gateway project (and all
other major pipeline projects to transport tar sands crude) and are currently pipeline-
constrained. As such, KM/TMP and Alberta crude producers are even more highly
motivated to tout the supposed benefits of these projects to the citizens of BC and
Metro Vancouver.
SCHOOL OF PUBLIC POLICY
Economic Costs and Benefits of the Trans Mountain Expansion Project (TMX) for BC and Metro Vancouver 70
The vast majority of benefits from TMX will flow to KM/TMP, Alberta tar sands
producers and Alberta. But the lion's share of the risks will be borne by the citizens of
BC, and Metro Vancouver in particular.
5.4 Key Questions to Guide Decision-Making
As indicated in Section 2, there is increasing evidence that the current NEB hearings
may not ensure that TMP provides all the necessary information on the costs and
benefits of TMX. In this context, the independent assessment of costs and benefits
provided in this Report can offer useful guidance to inform decision-making, and can
help British Columbians evaluate if TMX is indeed in the public interest.
Decision-makers must search out the most comprehensive and reliable information and
analysis before determining whether projects and supporting policies should be
approved. The comparison of economic benefits estimates against a range of bad to
worst-case scenario costs in the SFU-TGG Report is sufficient to raise the following
serious questions for decision-makers:
1. Are there serious problems with TMX? And more specifically, under a range of
bad to worst-case scenarios, do the costs of TMX exceed the benefits?
2. Can the KM/TMP evaluation of the costs and benefits (which concludes that the
overall costs are moderate and acceptable compared to the benefits) be relied
upon?
3. Is TMX in the public interest of the citizens of BC and Metro Vancouver? More
specifically, is BC's fifth condition being fulfilled - i.e. that "British Columbia
receives a fair share of the fiscal and economic benefits of a proposed heavy-oil
project that reflects the level, degree and nature of the risk borne by the
government, the environment and taxpayers?"129
In answer to Question 1, the range of bad to worst-case scenarios which start at $1
billion and escalate into the multi-billion dollar range in the case of a major rupture in an
urban area (as described in Section 4.1) show unequivocally that there can be serious
problems with TMX. As discussed in Section 5.2, based on evaluation of the economic
costs and benefits in Sections 3 and 4, the SFU-TGG Report concludes that under a
range of bad to worst-case scenarios, the costs of TMX will exceed, or greatly exceed,
the benefits for both BC and Metro Vancouver.
129
See footnote 8.
SCHOOL OF PUBLIC POLICY
Economic Costs and Benefits of the Trans Mountain Expansion Project (TMX) for BC and Metro Vancouver 71
The answer to Question 2 is a definitive no. As discussed throughout this Report (and
made very clear in Figures 1 through 5), the benefits of TMX are very small and have
been significantly overstated by KM/TMP, whereas the worst-case costs of a
catastrophic spill are very large and have been vastly understated. The Company's
evidence before the NEB has overestimated short-term employment benefits by a factor
of three. Most other employment and non-employment benefits have also been
overstated. On the cost side, KM/TMP's miscalculations are even more dramatic. Worst-
case scenario costs could escalate to the multi-billion dollar range - more than 10 times
higher than the C$100-$300 million estimated by the Company.
In answer to Question 3, in light of our evaluation of the costs and benefits, the SFU-
TGG Report concludes that TMX is not in the public interest of the citizens of BC and
Metro Vancouver. More specifically, it is clear from our discussion of the highly uneven
allocation of the costs and the benefits in Section 5.3 that the benefits of the project flow
mainly to tar sands producers, KM/TMP and Alberta, whereas the citizens of BC and of
Metro Vancouver in particular bear most of the risk of a catastrophic spill.
Furthermore, Section 3.7.3 and Figure 4 show that the fiscal benefits are unevenly
distributed among the provinces; and particularly unevenly distributed between the tar
sands producers and the provinces. Section 3.5 and Figure 3 show that the incremental
municipal property tax benefits are very small in the context of the provincial and
regional economies. Finally, Sections 3.2, 3.3 and 3.4, and Figures 1 and 2 show that
the employment benefits for both BC and Metro Vancouver are small and have been
significantly overstated by KM/TMP.
The findings of the SFU-TGG Report clearly show that BC's fifth condition (that BC
receive a fair share of the fiscal and economic benefits commensurate to the risk borne
by the government, the environment and taxpayers) is very far from being fulfilled by
TMX.
5.5 Recommendation
In light of the findings of the SFU-TGG Report regarding the evaluation of the costs and
benefits of TMX, we conclude that the pipeline project is not in the economic or public
interest of the citizens of BC and, in particular, the citizens of Metro Vancouver.
Moreover, TMX completely fails to satisfy BC's fifth condition for the consideration of
construction and operation of heavy-oil pipelines within its borders. This Report
therefore strongly recommends that the citizens and decision-makers of BC and Metro
Vancouver reject this pipeline, which is neither in the economic nor public interest of BC
and Metro Vancouver.