economic crisis and social policy in finland in the 1990s · 1990s. it asks what happened to the...
TRANSCRIPT

ECONOMIC CRISIS ANDSOCIAL POLICY INFINLAND IN THE 1990s
by Hannu Uusitalo
SPRC Discussion Paper No. 70October 1996
ISSN 1037 2741ISBN 7334 1453 2
Professor Hannu Uusitalo is Deputy Director General of the National Research andDevelopment Centre for Welfare and Health, Finland

The Social Policy Research Centre (formerly the Social Welfare Research Centre) wasestablished in January 1980 under an Agreement between the University of New SouthWales and the Commonwealth Government. In accordance with the Agreement theCentre is operated by the University as an independent unit within the University. TheDirector of the Centre is responsible to the Vice-Chancellor and receives advice informulating the Centre's research agenda from a Management Board.
SOCIAL POLICY RESEARCH CENTRE DISCUSSION PAPERS are intended as aforum for the publication of selected research papers on research within the Centre, orcommissioned by the Centre, for discussion and comment in the research communityand/or welfare sector prior to more formal publication. Limited copies of eachDISCUSSION PAPER will be available on a first-come, first-served basis from thePublications Officer, Social Policy Research Centre, University of New South Wales,Sydney NSW 2052 [tel: (02) 9385 7800]. A full list of DISCUSSION PAPERS can befound at the back of this DISCUSSION PAPER.
The series is indebted to Diana Encel for her continuing editorial contribution.
As with all of the Centre’s publications, the views expressed in this DISCUSSIONPAPER do not reflect any official position on the part of the Centre.
Tony EardleyEditor
Abstract
This paper discusses the social policy consequencesof the exceptional economic decline in Finland in the1990s. It asks what happened to the Finnish welfarestate in these exceptional economic conditions, andconsequent political problems. It describes Finland’seconomic performance in a comparative perspective,studies how government(s) have defined the goals ofeconomic and social policies, and examines how theopinions of the Finns concerning the welfare statehave changed during the recession. It also looks atthe welfare outcomes, focusing on income levels,income distribution, poverty and social and healthservices. The results suggest that Finnish householdshave suffered economic losses which are smallerthan the decline in the GDP would predict. Thefindings show that equivalent income distributionand relative poverty levels have not changed duringthe recession. The income losses of the recessionhave been spread relatively evenly, and theredistribution of the welfare state has been animportant tool. Finally, it is argued that theexplanatory factors of the growth vis-a-vis theretrenchment of the welfare state (or the lack of it)are different. Once established, structures andinstitutions of the welfare state can work as powerfultools even when economic and political conditionsare difficult.

1 Introduction
In most Western advanced industrial nations, the welfare state has facedeconomic and political problems during the 1980s and 1990s. The fiscalcrisis of the state has been on the political agenda, although the severityand the timing of the problems has varied from one country to another. Inmany countries economic and political problems were visible in the1980s. In Finland, the 1980s were economically very successful, andFinland was frequently referred to as Europe’s Japan. All that changed atthe beginning of the 1990s, when Finland’s economy fell into anexceptionally deep decline which has no parallel in any of the OECDfamily, former Central and Eastern European socialist countries apart.
This paper discusses the social policy consequences of this economicdecline. It asks what has happened to Finnish welfare in theseexceptional economic conditions, and consequent political problems. The paper is organised as follows. First, Finland’s economic performanceis put into a broader comparative perspective. Second, we study how thegovernment(s) have defined the goals of economic and social policies.Third, we look at the outcomes of policies and other developments,focusing on income levels, income distribution, poverty and social andhealth services. Fourth, we claim that the case of Finland in the 1990shas particular relevance for some theories of the welfare state and drawsome tentative theoretical conclusions concerning the irreversibility ofthe welfare state and the distinction between explanatory factors of thegrowth and retrenchment of the welfare state.
2 Economic Performance in the 1990s inComparative Perspective
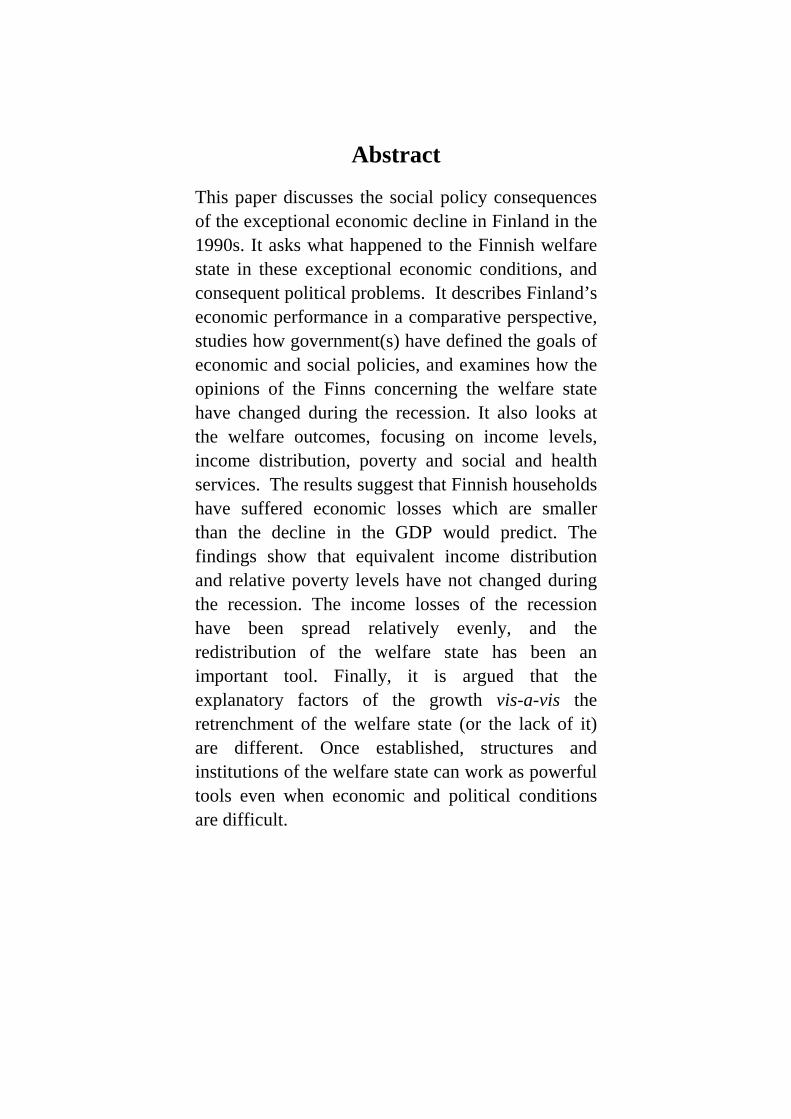
Let us start with two key economic indicators, GDP growth andunemployment. Figures 1 and 2 display the trends from 1985 to 1995 insome countries. After high growth rates in the latter part of 1980s, 1990was a zero growth year in Finland, followed by three years of negativegrowth, during which the GDP declined about 13 per cent. In no otherOECD country has the economic situation been so gloomy as in Finlandduring this decade. 1994 witnessed some relatively high growth, which is
2
Figure 1: Economic Growth in Selected OECD Countries: 1985-1995
expected to continue, although not at the same speed. As shown in thefigure, some other countries have had economic difficulties in the 1990sas well, but not at a parallel degree.
The growth of unemployment shows similar exceptional developments inFinland, as seen in Figure 2. In three years, the unemployment rateclimbed from under four per cent to 17-18 per cent of the labour force.These figures are actually the second highest, after Spain, in the OECDarea. Although the numbers have started to decrease, long-termunemployment, especially, continues at a very high level.
Of course, negative growth and unemployment were not the onlyeconomic problems. The public economy had considerable incomelosses, while expenditures tended to grow due to the increased needs ofthe population, but also due to a severe banking crisis, which during therecession caused expenditures of 45-50 billion Finnish marks to the state,

3
Figure 2: Unemployment in Selected OECD Countries: 1985-1994
which had to subsidise banks to keep them in business. Consequently, thestate budget deficit grew dramatically from 10 per cent of the GDP in1990 up to 50 per cent in 1993, and 70 per cent in 1995.
Finland is an exceptional case in its economic performance in the 1990s.The causes of this decline probably include unhappy economic policydecisions, such as the binding of the Finnish mark to the German mark ata level which undermined the competitiveness of export industries, and avery rapid deregulation of financial markets but also such externalfactors as the collapse of trade with Soviet Union. Because of thisexceptionalism, it is particularly interesting to look at what has happenedto the Finnish welfare state. This exploration requires a brief excursionthrough the economic and social policies of the governments which haveruled the country during these years.

4
3 Economic and Social Policies
3.1 The Centre-right Cabinet, 1991-1995
After the general election in March 1991, a centre-right cabinet assumedpower. The core of this cabinet was formed by the Centre Party (formerlythe Agrarian Party) and the National Coalition (conservatives), with theparticipation of some smaller parties. The cabinet had a firm majority inthe parliament. Social Democrats experienced losses in the generalelection, and remained in the opposition.
Prime Minister Esko Aho’s centre-right cabinet stayed in power throughthe whole time, until the next election in March 1995. In 1991 the cabinetcould not have foreseen the depth of the economic crisis: no one could.Gradually, the consciousness of the crisis increased, and the key elementsof the cabinet’s economic policies in the crisis were formulated.
The cabinet began to see public deficit as the major problem andproposed and made considerable cuts in public expenditure, while therate of taxation increased considerably. Inflation was seen to be animportant issue as well, leading to tight fiscal policies. Traditionally, theFinnish governments have considered the international competitivenessof paper and metal industries as a key element in economic growth, andconsistent with this presupposition, the centre-right cabinet introducedmeasures (deflation of the Finnish mark) to improve the conditions ofthese major export industries.
The growth of unemployment was also perceived as a major problem, butmeasures to fight it were mainly indirect: growth, control of inflation andstability of the currency were seen as keys to decrease unemploymentrates.
Social expenditure continued to grow in the first years of recession,although the cabinet started to cut social benefits as early as 1991. Thereal growth of social expenditure decreased from the record high 9.3 percent in 1991 to 1.6 per cent in 1993, despite the dramatic growth ofunemployment and social assistance expenditure. Cuts to social benefitsdid not concentrate on any particular benefit types, but were spread to all
5
schemes. The techniques varied: indexed increases to benefits werecancelled, compensation levels of earnings-related unemployment,sickness and maternity benefits were lowered and eligibility for somebenefits were tightened.
3.2 The Rainbow Cabinet 1995-
The new parliament was elected in March 1995. The parties in thecabinet lost, especially the Prime Minister’s Centre Party, while SocialDemocrats - the largest opposition party - made considerable progress.The new cabinet was formed in April by the chairman of the SocialDemocratic Party, Paavo Lipponen. It is a broad coalition cabinet formedby the Social Democratic Party, the National Coalition (conservatives),the Leftist League (a party to the left of the Social Democrats), theSwedish People’s party, and the Green League. These parties have morethan two-thirds of the seats in the Parliament. The Centre Party, whichhad the key role in the previous cabinet, became the largest oppositionparty.
The program of Paavo Lipponen’s cabinet has emphasised two targets:the improvement of the employment situation and the decrease of theratio of the public debt to the national product. It has claimed that unlessthese goals can be achieved, welfare society is endangered. In order tomaintain the core of the welfare society (social welfare and health careservices, income-related social security and minimum security foreverybody), considerable restructuring and cuts in expenditure were seento be necessary. The cabinet estimated that the cuts should be carried outin the first two years. It also set monetary targets for the cuts, andoutlined a program which specified the expenditures from which savingsare to be made. Details were left to be designed in future work.
In this restructuring, the cabinet program has emphasised the followingprinciples. The disincentives to work existing in the subsidy system mustbe removed. The cabinet established a working party, the task of which isto present a total estimate of the coordination of social income transfers,charges and taxation and to suggest necessary measures withoutdiminishing the security of those in the most vulnerable positions. Theworking party has finished its task before the budget for 1997 has beenannounced.
6
The social security contributions levied from the enterprises but notconnected with work-related benefits will be abolished gradually. Alsothe national pension contribution levied from wage-earners and pensionrecipients will be abolished.
In order to balance employment pension contributions and pensionbenefits and to reduce the pressure to increase pension contributions,employment pension schemes were reformed in 1996. Before 1996, theFinnish national pension scheme consisted of two parts. The so-calledbasic amount was universal and payable to all above 65 years of age. Thesecond, supplementary amount, was tested against legislatedemployment-related pensions so that other pensions gradually decreasedthe supplementary amount until it ceased at a certain employmentpension level. In the 1996 reform, the two parts of the national pensionwere merged so that the previously universal basic amount becamesubject to income testing.
A similar step was taken in the sickness insurance system in whicheligibility for the receipt of the minimum daily allowance was tightened.Earlier, even those who did not have any income (housewives, students)could qualify for the daily allowance of sickness insurance, but from1996, only those who lose income because of sickness can receive thedaily allowance.
A revision of unemployment benefits was carried out rapidly inconsultation with the labour market parties. The reform includes areconsideration of the period for which the benefit is paid and of thebases on which the benefit is granted. At the same time there is anincrease in activating factors - rehabilitation, training - and in measuresof labour policy to improve the employment situation.
In Finland, social and health (as well as educational) services are, to avery large extent, publicly provided. In practise the responsibility is inthe hands of the municipalities, who tax their citizens to provide theseand other services. They also get a block grant from the state to financethese services, the level and quality of which is monitored by the state. Inits program, the cabinet emphasised the role of basic social and healthservices for the welfare society. Social and health services should berestructured by developing non-institutional care and various half-way
7
services. The program also mentions preventive social welfare and healthcare policies, in particular activities keeping up the ability to work andearly rehabilitation. These goals have not hindered the cabinet fromcutting considerably the block grants to municipalities. It has justifiedthese savings by arguing that the economies of the municipalities havebeen in a far better condition than those of the state.
Amongst all cuts and discussions about the curtailment of the welfarestate one important improvement of social security has been carried out.This is the extension of the right to day-care for children under schoolage. Previously, only children under three years of age were eligible.
The goal of taxation policy of the rainbow cabinet is to make taxstructures and ratios comparable with the OECD countries. This impliesthat the balancing of the state economy will be carried out withoutincreasing the overall tax rate. The taxation structure will be changed tofavour work and employment. The tax relief will benefit all incomeclasses, with particular emphasis on low- and middle-income groups. Thetax rate for capital income, income from interest and corporate incomehas been increased to 28 per cent. The lower taxation of labour will, to aconsiderable extent, be compensated by new environment taxes.
So far, the cabinet has, with minor exceptions, succeeded in getting itsway in parliament. It has also been able to foster a large base incomespolicy agreement together with trade unions and employers’organisations. Furthermore, it seems likely that the state budget deficitwill be under control in a few years.
Having been in power one and a half years, the major new element in theeconomic policy of the cabinet is the emphasis on the fulfilment of EMUcriteria which the European Union has set as a condition for entry intothe forthcoming European Monetary Union1. The government hasemphasised that this does not imply that a decision to join the EMU hasbeen taken, but it means that Finland will be able to join if and when the
1 EMU criteria are: (1) inflation at most 1.5 per cent units above three low
inflation countries; (2) public deficit at most three per cent of the GDP; (3)public debt at most 60 per cent of the GDP; (4) exchange rates within thelimits of ERM; (5) interest rate at most two per cent units higher than in threelowest countries.

8
day comes that she so wishes. This emphasis has strengthened thepriorities to control public expenditures and to keep fiscal policies tight,and has consequently weakened the employment target, which aimed tohalve unemployment within the government’s four years in power. Itseems fairly obvious that this target cannot be achieved, andunemployment will remain above ten per cent even at the end of thismillennium.
One could ask what are the major differences between the former centre-right cabinet and the present one, led by social democrats and theconservatives. Broadly speaking they seem to be pretty similar. Budgetdeficit, control of public expenditure, international competitiveness arekeywords in the agenda of both cabinets. However, there are two crucialdifferences. First, the present cabinet has tried and succeeded inmaintaining negotiations with labour market organisations when makingits cuts in pension and unemployment expenditures, whereas the formercabinet maintained a confrontational state with the trade unions. Thecentre-right cabinet, in turn, had far better relations with the federation ofagricultural producers. Secondly, the social policy profiles of the cabinetsare somewhat different, reflecting traditional differences between SocialDemocrats and the Agrarian Party (now the Centre Party) (see Alestalo,Flora and Uusitalo, 1985). The Finnish Agrarian Party has been anadvocate of universalism and basic social security, and it has tried toavoid cuts in expenditures related to these goals. Social Democrats, havebeen the main advocates of work-related benefits. Although the cabinethas touched these benefits, it has also introduced some changes whichinvolve reduction in the universalism of the Finnish welfare state - asexemplified by the reforms to the national pensions and daily sicknessallowance.
3.3 Social Policy Cuts and the Development of SocialExpenditure
The Ministry of Social Affairs and Health has assessed the economicimpact of the changes in the social welfare system by estimating howmuch these changes decrease social expenditure in comparison with acounterfactual based on no changes having been made. Figure 3

9
Figure 3: The Impact of Savings on Social Expenditure in Finland: 1991-1996
-14
-12
-10
-8
-6
-4
-2
0
1990 1992 1994 1996 1998 2000
Social expenditure
Families and children
Health care and illness
Unemployment
Old age and disability
describes the outcomes of this exercise. It shows that in the year 2000,social expenditure will be 8.6 per cent smaller than it would have beenwithout savings. This figure can be put into perspective by noting that inthe 1980s the average annual growth of social expenditure in real termswas somewhat less, about 8 per cent.2 Furthermore, one can see that thecuts to unemployment and family benefits will have a higher thanaverage impact, whereas old age and disability as well as health care andillness have managed with smaller losses.
As seen in Figure 4, the share of GDP devoted to social expenditure grewrapidly in the first two years of the recession. This was, in the first place,due to the decline in the GDP denominator but, secondly to real growthin expenditure. In a couple of years, Finland jumped from the ranks ofmiddle spenders to the top league, superseded only by Sweden, andpossibly by the Netherlands.
2 The comparison is not quite adequate, because the growth of social
expenditure in the 1980s was due to changes in the provision and changes inthe utilisation of benefits due to changing age structures and unemployment,whereas the impact of cuts include here only the former.

10
Figure 4: Social Expenditure as Percentage of GDP in Four Countries: 1990-2000
Source: M inistry of Social Affairs and Health, 1996.
25
30
35
40
45
1990 1991 1992 1993 1994 1995 1996 1997 1998 1999 2000
Social expenditure, % of GDP
Sweden
France
Germany
Finland
Figure 4 also displays the projection of social expenditure made by theMinistry of Social Affairs and Health up to the year 2000. This particularprojection is based on the assumption that economic growth will be 3.5per cent per year, and that unemployment rates will decline. In 1995, theGDP share of social expenditures will decline, and the decline willcontinue so that in the year 2000, the level of 30 per cent is reached.
Such estimates are dependent on assumptions, but according to OECDestimates, the average growth rate of 3.5 per cent is not totallyunreasonable. Even though the growth in 1995 was 4.2 per cent, the GDPshare of social expenditure did not quite drop to the level of thisprojection, which casts some doubts as to whether the decline will be aslarge as assumed in the projection.
3.4 The Finns Understand the Need to Save Public Expenditures,but Give their Support to the Welfare State
The fiscal crisis of the state has provoked public discussion about thefuture of the welfare state in Finland. The frontlines of this debate are

11
manifold and not easily summarised. As elsewhere, public discussion hassome neoliberal tones. Issues of freedom, the excessive wardship of thestate over the citizens, tax rates that are too high, and disincentivescreated by social benefits have been the core claims of the neoliberalcritique. The opposite side also wants to maintain the Scandinavian typeof welfare state in the future. It has dismissed the claims of neoliberals asempirically false. The third stream in the debate appreciates the virtues ofthe Scandinavian welfare state, but claims that it must not rest on thelaurels of its past achievements, but must adjust to new conditions andchallenges, both internal and external.
However, it is fair to say that the debate is not so much dominated byideological disputes but rather by a more practical discourse, the core ofwhich is the claim that public expenditures - and hence the welfare state -must be reduced in order to win back the balance of state incomes andexpenditures and in order to clear space for private initiatives.
The National Research and Development Centre for Welfare and Healthhas, since 1991, conducted opinion surveys in order to find out what theFinns think about the welfare state (see Sihvo and Uusitalo, 1995a,1995b). The study analysing these data shows that during Finland’sunforeseen economic recession in the 1990s the support for the welfarestate decreased to a level lower than at any time since 1975, when thefirst systematic measurements were made. The newest data for 1994 and1995 show that support has started to increase again. The studies alsoreveal that the welfare state occupies a special place in the hearts of theFinns. They understand the need to make savings, but they do not want tocut this expenditure and would like savings to be made in other statefunctions, such as defence, agricultural and industrial support, supportfor cultural activities and sports. The dilemma facing the decision makersis, of course, that the expenditures on social transfers and social, healthand education services make up the lion’s share of public spending.
4 Outcomes
What then are the outcomes of these policies on the living standards ofthe Finns? These outcomes cannot be fully examined here, and weconcentrate on four issues only. We look at the income levels of
12
households, study the development of income inequality and poverty,and describe what has happened to social and health services.
4.1 Household Incomes During the Recession
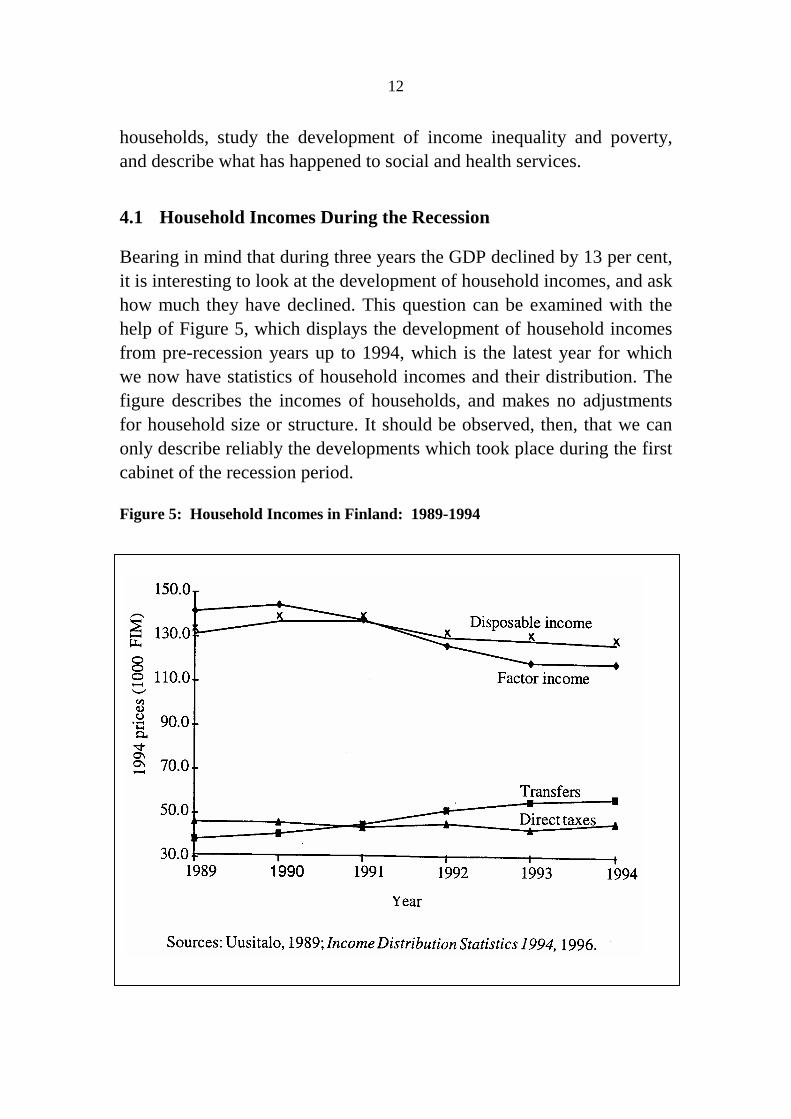
Bearing in mind that during three years the GDP declined by 13 per cent,it is interesting to look at the development of household incomes, and askhow much they have declined. This question can be examined with thehelp of Figure 5, which displays the development of household incomesfrom pre-recession years up to 1994, which is the latest year for whichwe now have statistics of household incomes and their distribution. Thefigure describes the incomes of households, and makes no adjustmentsfor household size or structure. It should be observed, then, that we canonly describe reliably the developments which took place during the firstcabinet of the recession period.
Figure 5: Household Incomes in Finland: 1989-1994

13
The average disposable income of households was at its highest in 1991.In succeeding years it dropped significantly, and the drop has continuedto 1994. Estimates for 1995 indicate that a return to growth took place inthat year. From the top year (1991) to the bottom year (1994), theaverage decline of household disposable incomes has been 7.6 per cent,which is much less than the decline on the GDP.
The most interesting feature of Figure 5 is the comparison of thedevelopment of factor and disposable incomes. The factor incomes ofhouseholds were at their highest in 1990, and the decline to 1994 hasbeen as high as 18 per cent, compared to 7.6 per cent in the drop indisposable incomes. This decline is for the most part due to increasedunemployment levels. However, the welfare state has, through its cashtransfers, compensated for a large part of this decline: income transfershave in real terms increased by almost 40 per cent. The growth is causedby expenditure on unemployment payments, but pension expenditure andsocial assistance expenditure have also grown remarkably. Earlier, Figure4 showed how social expenditures had grown at the level of nationaleconomy, and this figure shows the same at the level of the averagehousehold. This is, of course, what the welfare state is about: to helpindividuals and households when they meet difficulties. Judged from thisframe of reference, the welfare state has shown its ability to soften theharshness of dramatic economic changes, which at another level, that ofthe national economy, have contributed to the problems of publicfinances.
4.2 Income Distribution
International Perspective
The recent OECD study by Atkinson, Rainwater and Smeeding (1995),based on the data sets of the Luxembourg Income Study (LIS) shows thatFinland had, in the late 1980s, the most equal income distribution in theOECD area, irrespective of the measure used. This is shown in Figure 6,which also sheds light on the relationship between the size of socialexpenditure and income distribution. The relationship is obvious: themore a nation uses for social protection, the more equal is its income

14
Figure 6: The Distribution of Equivalent Disposable Income and the Size of theWelfare State in 15 Countries: 1985
distribution. This is not a coincidence, but a causal relationship: theredistributive impact of social transfers and (direct) taxes work for theequalisation of income distribution (see, e.g. Mitchell, 1991; Korpi andPalme, 1996).
However, the correlation is not a perfect one, other factors influenceincome distribution in addition to the mere size of social expenditure. Itcould be noted that Australia and Finland deviate from the pattern: bothcountries have more equal income distributions than their socialexpenditure levels would predict. One reason for Australia’sexceptionalism is probably the compressed wage distribution: it is almostas equal as in Sweden (Fritzell and Saunders, 1994). As regards Finland,one cause of her deviation from the general pattern is found in therelatively even distribution of factor equivalent income. It is, forexample, less unequal than in Sweden (Gustafsson and Uusitalo, 1990).

15
The other outliers are Ireland and France, which have relatively highinequality compared to their social expenditure levels.
These results refer to the latter part of the 1980s, that is, the pre-recessionperiod in Finland. How has income distribution changed in Finland sincethen?
Income Distribution in Finland
Finland has comparable income distribution data from 1966 up to 1994.The data for the years 1966 to 1985 are based on household budgetsurveys, carried out at five-year intervals, while data for 1986 to 1994 arebased on income distribution statistics, both collected by CentralStatistical Office of Finland. Income Distribution Statistics is an annualcollection, based on a larger sample than household budget surveys3.Both operate with very similar income concepts. Comparisons of the twosources indicate that Income Distribution Statistics displays a slightlyhigher inequality than the household budget surveys (see Uusitalo 1989:28-29). The data sets are not exactly comparable, but their differences arelikely to be within the limits of sampling variation.
From the viewpoint of economic welfare or standard of living, the mostcrucial income concept is disposable income. Wages, salaries, incomefrom self-employment and property income add up to factor income.When income transfers such as pensions, sickness insurance benefits,unemployment insurance benefits and others are added, we get grossincome. Gross income minus direct taxes (including other tax-likepayments) is disposable income.
In order to compare the income levels of households having varyingnumbers of members and varying structures, an adjustment must bemade. This is done by equivalence scales. There is no one scale whichcan be regarded as the right one, but there are many alternatives. Theequivalence scale used by the OECD is applied here4. The first adult gets 3 For a description of household budget surveys, see Uusitalo, 1989: 28-31.
Income Distribution Statistics 1994 describes this data source (only inFinnish).
4 Uusitalo (1989) includes sensitivity analyses for the years 1966 to 1985. Forlater years such analyses have not been performed.

16
the weight of 1.0, the second 0.7 and children 0.5. This means that a two-parent family with two children needs 2.7 times the income of a singleadult in order to have the same standard of living.
Finally, we do not compare the distribution of income betweenhouseholds, but the distribution of household equivalent income betweenpersons. For further information on methods and specifications seeUusitalo (1989: 20-31). The OECD study referred to above used similarmethods, and examined the robustness of the results by experimentingwith different equivalence scales and inequality measures.
By comparing the distributions of factor and gross income we can findthe redistributive effect of social transfers. The comparison of gross anddisposable income shows the impact of direct taxes. Finally thecomparison of factor and disposable income gives the combined effect oftransfers and taxes.
As a measure of income inequality we use Gini coefficients and therespective income shares of deciles of persons. The higher the Gini, thegreater the inequality. Redistribution due to transfers and taxes areestimated by the changes in Gini coefficients.
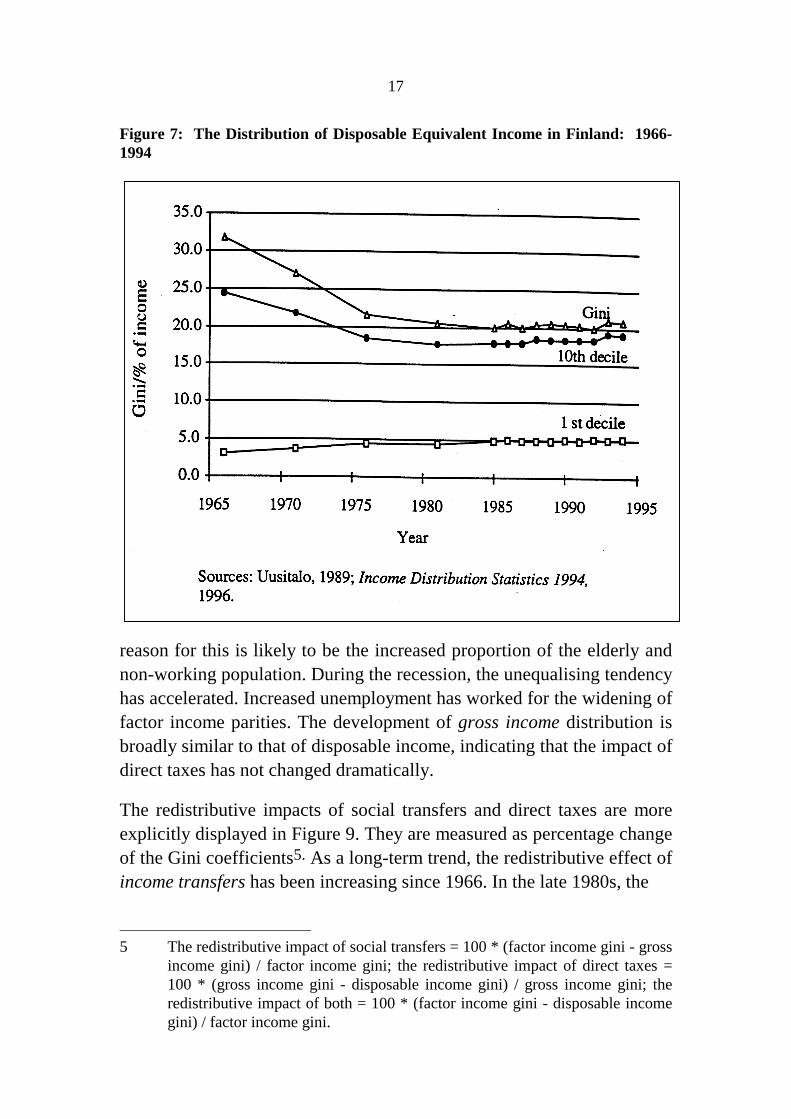
Figure 7 shows the development of equivalent income inequality inFinland 1966-1994. Inequality declined dramatically between 1966 and1976. The main causes of this decline are to be found in the growth ofsocial transfers and direct taxes, but also in income policy introduced inFinland in the late 1960s, which considerably compressed thedistribution of earnings (see Uusitalo, 1989, for a detailed analysis).During the next ten years one can also observe a decline, but a muchweaker one. From 1985 to 1994, inequality remained at roughly at thesame level. It is of particular interest to note that the recession years havenot witnessed any growth of income inequality. For instance, the incomeshare of the lowest decile has remained astonishingly stable during therecession.
As seen in Figure 8, the distribution of factor income became more equalbetween 1966 and 1976, but in contrast with the distribution ofdisposable income it has become more unequal since 1981. The main
17
Figure 7: The Distribution of Disposable Equivalent Income in Finland: 1966-1994
reason for this is likely to be the increased proportion of the elderly andnon-working population. During the recession, the unequalising tendencyhas accelerated. Increased unemployment has worked for the widening offactor income parities. The development of gross income distribution isbroadly similar to that of disposable income, indicating that the impact ofdirect taxes has not changed dramatically.
The redistributive impacts of social transfers and direct taxes are moreexplicitly displayed in Figure 9. They are measured as percentage changeof the Gini coefficients5. As a long-term trend, the redistributive effect ofincome transfers has been increasing since 1966. In the late 1980s, the
5 The redistributive impact of social transfers = 100 * (factor income gini - gross
income gini) / factor income gini; the redistributive impact of direct taxes =100 * (gross income gini - disposable income gini) / gross income gini; theredistributive impact of both = 100 * (factor income gini - disposable incomegini) / factor income gini.

18
Figure 8: The Distribution of Factor, Gross and Disposable Equivalent Incomein Finland: 1966-1994
effect seemed to be stabilising, but during the recession it has grownagain. The increase of social expenditure both in real terms and inrelation to the GDP is the key explanation for this development.
The redistributive effect of direct taxes increased at the same pace as theeffect of social transfers between 1966 and 1976, after which the increaseup to 1989 has been much more modest. Since 1989 the trend has beentowards a decreasing redistributive effect. This can be attributed to taxreform which started in 1989, the aim of which was to broaden the taxbase and to decrease the marginal tax rates. Although the total tax ratehas increased during these years, the share of direct taxes has beendeclining.
The total redistributive impact of transfers and direct taxes increasedconsiderably between 1966 and 1975. After that it has increased a slower

19
Figure 9: Redistributive Effects of Cash Transfers and Direct Taxes in Finland:1966-1994
pace. The trends in the redistributive effects of transfers and direct taxeshave worked in opposite directions in the 1990s, the impact of theincreased redistribution of transfers being larger.
To summarise the developments during the recession in the 1990s:income distribution has remained remarkably stable. Increased factorincome inequality, which probably can be attributed to extremely highlevels of unemployment, has been compensated by the increased impactof social transfers, so that equivalent disposable income distribution hasnot changed.
4.3 Poverty
Finally, Figure 10 describes the development of some poverty indicatorsover time in Finland. ‘Income poverty’ is a measure usually applied in

20
Figure 10: Poverty Indicators in Finland: 1980-1994
international comparisons. It describes the proportion of individuals wholive in households whose equivalent disposable income is less than thepopulation median. ‘Consumption poverty’ is the same measure, butcounted not on the basis of disposable income but on the basis ofconsumption expenditures. These two measures focus on relativepoverty, and they both show the same pattern: poverty declinedconsiderably in the 1980s. The measure of income poverty shows thatrelative poverty levels have not changed during the recession years, afinding which is fully consistent with the development of incomeinequality.
‘Social assistance’ measures the percentage of individuals who have,during a year, received the ‘last resort’ needs-tested social benefit. Thesenumbers had grown already in the 1980s, which was at least partly due tobroadened eligibility and improved benefits. However, no such changesin the supply of this benefit took place in the 1990s, when the proportionof the population relying on social assistance has doubled. The majorcauses of this growth are increased unemployment, decreased real

21
income levels, and difficulties in paying back debts incurred in thegolden years of the 1980s.
This poverty measure thus conflicts with relative measures like incomepoverty, in a way, however, which is not difficult to explain. As alsoshown in Figure 10, the real income level of the lowest income decile(10 per cent of people having the lowest equivalent disposable income)decreased during the recession - as has the income of all other deciles. Sothey, like people in other deciles as well, have faced economicdifficulties in managing their households. These difficulties have leadmore and more people to social assistance, and absolute poverty hasincreased. The conclusion is then, that economic recession withdecreased income levels and increased unemployment has causedeconomic problems for Finnish households, but because of the welfarestate, these problems have not fallen more on low income people than onothers; hence, the stability of relative income shares and relative poverty.
4.4 Local Welfare Policies
We have now examined how some aspects of economic welfare,measurable in terms of income and money, have developed during therecession. This approach neglects one particular aspect of the‘Scandinavian welfare state’, namely the role of social, health and otherservices, such as education, which in Scandinavia are overwhelminglyprovided by the public sector.
In Finland, as in the other Scandinavian countries, the municipalities arelargely responsible for the provision of social and health services. Theirbudgets have also been under stress during the recession, because their(tax) incomes have declined and because the state has lowered its blockgrants to them. In the late 1980s, the costs of the provision of social andhealth services increased yearly by about 10 per cent. This increase wastransformed into a decrease in 1993. In the first phase, the municipalitiescut services and costs rather evenly, but gradually started to clarify theirpriorities and make reductions in a more selective way. It is obvious thatthe quantity and quality of social and health services have decreased andthe fees the clients have to pay have increased, creating additionalproblems for the population, whose needs during the recession are
22
increasing6. Statistics compiled by the National Research andDevelopment Centre for Welfare and Health show, however, that up to1993 the performance of social and health services had in general beensatisfactory. The main exceptions are in the services for alcohol abusers,mentally retarded persons and people suffering from mental problems. Inthese cases, the supply of services has clearly deteriorated (Uusitalo,Konttinen and Staff, 1995).
5 Too Early to Draw Firm Conclusions, But ...
We believe that a fair summary of the findings reported above could beas follows. It is obvious that the Scandinavian welfare state has beenmaintained in Finland during the recession, and moreover, it has workedsurprisingly well in alleviating the harmful consequences of the recessionto the well-being of the citizens. Income distribution has not changed andthe relative poverty levels are as low as they were before the recessionHowever, it is equally true that the Finnish welfare state is not asgenerous, not as universal and more reliant on means-tested benefits thanjust before recession.
These findings are interesting when related to theories of the welfarestate. Typically, these theories have been developed and tested inconditions where the welfare state has grown. It is not self-evident thatthe retrenchments or reorganisations of the welfare state follow the samelogic (see Pierson, 1994), and Finland is the country where the welfarestate has experienced harder economic times than elsewhere, while themain political problems have been experienced in the United States andthe United Kingdom.
One could argue that the case of Finland lends support to the thesisaccording to which the welfare state is irreversible, that is, onceestablished, it cannot be turned off. Economic growth is regarded as aprerequisite for the growth of the welfare state, even though therelationship is not a linear one and even though the impact of increasedprosperity on the welfare state is mediated by other factors. In our case, 6 This is not true for all services. For example, the demand of children’s day-
care services has declined during the recession, because of increasedunemployment.

23
the dramatic economic decline has not caused the dismantlement of thewelfare state. This is even more peculiar when political theories of thewelfare state are taken into account. These theories have emphasised therole of social democracy in facilitating the growth of the welfare state,and, on the other hand, the role of the cooperation of the bourgeoisparties in hindering the growth. Neither of these conditions prevailed inFinland at the beginning of the recession: Social Democrats were inopposition and the centre and the right were together in the cabinet,which had an unquestionable majority in the parliament. Given theframework of both political and economic theories of the growth of thewelfare state, the case of Finland in the 1990s seems peculiar indeed.
However, it may not be so peculiar. It could be argued that the case ofFinland supports Pierson’s (1994) view according to which the processof retrenchment differs from the process of growth. In the former,existing structures and institutions created by the welfare state play asignificant role. They have created their own constituencies and interests,which, during such exceptional conditions as those in Finland in 1990s,work for stability and against dramatic retrenchments. Not that thesestructures and institutions stubbornly keep up with the old; on thecontrary, they often adapt flexible strategies in order to survive inchanging conditions and show considerable capabilities of politicallearning. In the case of Finland, these structures and institutions havebeen strong enough to survive in hostile economic and difficult politicalconditions, and are likely to do so in the future.
A strong case can be made that this analysis and these theoreticalinterpretations are too hasty. It should be observed that our statisticalindicators have reached the year 1994, which was the fourth recessionyear and the first one showing some signs of recovery. However, it wasalmost two years until the first political reactions to the recession tookplace in terms of cuts and savings of public expenditure. Moreover, wehave been able to describe the possible outcomes of the politics of thecentre-right cabinet only. The outcomes of the politics of its successor,the rainbow cabinet, have not yet left their fingerprints on relevantstatistics. As shown in Figure 3, the impact of savings first becomesignificant in 1996. Cuts in family policy services and income transfersand in unemployment benefits will have large impacts on households

24
who are dependent on these benefits, but cuts in other benefits (old ageand health) will also be significant.
Therefore, it is conceivable that in the coming years the povertyalleviating impact of social transfers and their redistributive impact willdecrease from their current levels. This could cause an increase ininequality and poverty, but only to a limited extent. It seems likely thateven after these data become available, the conclusions made above willstill be accurate.
References
Alestalo, M., P. Flora and H. Uusitalo (1985), ‘Structure and politics inthe making of the welfare state: Finland in comparativeperspective’, in R. Alapuro, M. Alestalo, E. Haavio-Mannila, and R.Väyrynen, eds, Small States in Comparative Perspective. Essays forErik Allardt, The Norwegian University Press, Oslo.
Atkinson, A., L. Rainwater and T. Smeeding (1995), Income Distributionin OECD Countries. Evidence from the Luxembourg Income Study,OECD, Paris.
Central Statistical Office of Finland (1996), Income DistributionStatistics 1994, Helsinki.
Fritzell, J. and P. Saunders (1995), Wage and Income Inequality in TwoWelfare States: Australia and Sweden, Discussion Paper No. 60,Social Policy Research Centre, University of New South Wales,Sydney.
Gustafsson, B. and H. Uusitalo (1990), ‘Income distribution andredistribution during two decades: experiences from Finland andSweden’, in I. Persson, ed., Generating Equality in the WelfareState. The Swedish Experience, Norwegian University Press, Oslo.
ILO (1992), The Cost of Social Security 1984-1986, International LabourOffice, Geneva.
Korpi, W. and J. Palme (1996), ‘The Paradox of Redistribution and theStrategy of Equality: On the Role of Welfare State Institutions forInequality and Poverty in the Western Countries’, unpublishedpaper presented at the RC19 Conference in Canberra, August 19-22,1996.

25
Ministry of Social Affairs and Health, Finland, Sosiaaliturvakatsaus,forthcoming.
Mitchell, D. (1991), Income Transfers in Ten Welfare States, Avebury,Aldershot.
OECD Economic Outlook (1995), OECD, Paris.Pierson, P. (1994), Dismantling the Welfare State? Reagan, Thatcher,
and the Politics of Retrenchment, Cambridge University Press,Cambridge.
Sihvo, T. and H. Uusitalo (1995a), ‘Attitudes towards the welfare statehave several dimensions’, Scandinavian Journal of Social Welfare,4, 215-23.
Sihvo, T. and H. Uusitalo (1995b), ‘Economic crises and support for thewelfare state in Finland 1975-1993’, Acta Sociologica, 38, 251-62.
Toimeentuloturvakatsaus (1996), ‘Sosiaali- ja terveysministeriönjulkaisuja’, Helsinki.
Uusitalo, H. (1989), Income Distribution in Finland. The Effects of theWelfare State and the Structural Changes in Society on IncomeDistribution in Finland in 1966-1985, Studies No. 148, CentralStatistical Office of Finland, Helsinki.
Uusitalo, H., M. Konttinen and M. Staff, eds (1995), Sosiaali- jaterveydenhuollon palvelukatsaus, Raportteja 176, Stakes, Helsinki.

SOCIAL POLICY RESEARCH CENTRE DISCUSSION PAPERS
✦ No longer available.
✧ Published in Journal (list follows)
1. ✦✧ The Labour Market Position of Aboriginal Russell Ross August 1988People in Non-Metropolitan New South Wales
2.✦ Welfare Fraud, Work Incentives and Income Bruce Bradbury August 1988Support for the Unemployed
3.✦✧ Taxation and Social Security: An Overview Peter Whiteford August 1988
4.✦✧ Income Inequality in Australia in an Peter Saunders & August 1988International Comparative Perspective Garry Hobbes
5.✦✧ Family Size Equivalence Scales and Survey Bruce Bradbury December 1988Evaluations of Income and Well-Being
6.✦✧ Income Testing the Tax Threshold Peter Whiteford December 1988
7.✦ Workers’ Compensation and Social Security Don Stewart & December 1988Expenditure in Australia: Anti-Social Jennifer DoyleAspects of the ‘Social’ Wage
8.✦ Teenagers in the Labour Market: 1983-1988 Russell Ross December 1988
9.✦ A Legacy of Choice: Economic Thought and Paul Smyth May 1989Social Policy in Australia, the Early Post-WarYears
10.✦✧ The ‘Family Package’ and the Cost of Children Bruce Bradbury May 1989
11.✦ Towards an Understanding of Commonwealth Peter Saunders May 1989Social Expenditure Trends
12.✦✧ A Comparative Study of Home and Hospital Cathy Boland July 1989Births: Scientific and Normative Variablesand their Effects
13.✦ Adult Goods and the Cost of Children Bruce Bradbury July 1989in Australia
14.✦✧ Some Australian Evidence on the Consensual Peter Saunders & July 1989Approach to Poverty Measurement Bruce Bradbury
15 ✧ Income Inequality in Australia and Peter Saunders, September 1989New Zealand: International Comparisons Garry Hobbes &and Recent Trends Helen Stott
16.✦✧ Trends in the Disposable Incomes of Bruce Bradbury, January 1990Australian Families, 1982-83 to 1989-90 Jennifer Doyle &
Peter Whiteford
17.✧ Selectivity and Targeting in Income Support: Peter Saunders February 1990The Australian Experience

18.✦✧ How Reliable are Estimates of Poverty in Bruce Bradbury & February 1990Australia? Some Sensitivity Tests for the Peter SaundersPeriod 1981-82 to 1985-86
19.✧✦ The Labour Supply Behaviour of Single Russell Ross & July 1990Mothers and Married Mothers in Australia Peter Saunders
20.✦✧ Income Poverty Among Aboriginal Families Russell Ross & July 1990with Children: Estimates from the 1986 Census Peter Whiteford
21.✧ Compensating Low Income Groups for Indirect Peter Saunders & August 1990Tax Reforms Peter Whiteford
22.✦✧ Reflections on the Review of the Home and Peter Saunders August 1990Community Care Program
23.✦✧ Sole Parent Families in Australia Peter Saunders & September 1990George Matheson
24.✧ Unemployment, Participation and Bruce Bradbury September 1990Family Incomes in the 1980s
25.✦✧ Employment Growth and Poverty: An Analysis Peter Saunders September 1990of Australian Experience, 1983-1990
26.✦ Gender, Social Policy Regimes and the Sheila Shaver November 1990Welfare State
27. A Probit Analysis of the Factors Influencing Russell Ross November 1990Labour Market Success of Aborigines inNew South Wales
28.✦✧ Efficiency and Effectiveness in Social Policies: Peter Saunders December 1990An International Perspective
29. Take-up of Family Income Supplement in 1986 - Peter Whiteford & February 1991A Research Note Jennifer Doyle
30.✧ An Ever-Rising Tide? Poverty in Australia Peter Saunders & May 1991in the Eighties: George Matheson
31.✧ Are Immigrants Over-Represented in the Peter Whiteford March 1992Australian Social Security System?
32. Measuring the Cost of Children Bruce Bradbury May 1992
33.✧ The Impact of Family Assistance Changes on Bruce Bradbury August 1992Patterns of Unemployment Benefit Receipt
34.✧ Recent Trends in the Size and Growth Peter Saunders September 1992of Government in OECD Countries
35.✧ Noncash Income, Living Standards, Inequality Peter Saunders November 1992and Poverty: Evidence from the Luxembourg et alIncome Study .
36.✦✧ The Mixed Economy of Support for the Aged Peter Saunders November 1992In Australia: Lesson for Privatisation & Michael Fine

37. The Welfare Interpretation of Family Size Bruce Bradbury November 1992Equivalence Scales
38.✧ Body Rights, Social Rights and the Liberal Sheila Shaver December 1992Welfare State
39.✧ Unemployment and Income Support: Bruce Bradbury May 1993Challenges for the Years Ahead
40.✧ Married Women's Earnings and Family Income Peter Saunders May 1993Inequality in the Eighties
41. Women and the Australian Social Security Sheila Shaver June 1993System: From Difference Towards Equality
42. Male Wage Inequality Before and After Tax: Bruce Bradbury June 1993A Six Country Comparison
43.✦ The Fragmented Structure of Community Michael Fine June 1993Support Services: A Community Case Study
44.✦✧ The Recognition of Wifely Labour by Sheila Shaver & August 1993Welfare States Jonathan Bradshaw
45. Postmodernism and Social Policy: PeterA Great Leap Backwards? Taylor-Gooby September 1993
46.✧ Making Ends Meet in Australia and Sweden: Peter Saunders, October 1993A Comparative Analysis of the Consensual Björn Halleröd &Approach to Poverty Measurement George Matheson
47.✦ Economic Adjustment and Distributional Peter Saunders November 1993Change: Income Inequality and Povertyin Australia in the Eighties
48.✧✦ Poverty and Inequality: Social Security Peter Saunders May 1994in Australia in the 1990s
49.✧ Rising on the Tasman Tide: Income Inequality Peter Saunders June 1994in Australia and New Zealand in the 1980s
50. A New Approach to the Direct Measurement Björn Halleröd October 1994of Consensual Poverty
51. The Distribution of Welfare: Inequality, Peter Saunders November 1994Earnings Capacity and Household Production Inge O'Connor &in a Comparative Perspective Timothy Smeeding
52.✧ Immigrants and the Distribution of Income: Peter Saunders November 1994National and International Comparisons
53.✧ The Role, Value and Limitations of Poverty Peter Saunders November 1994Research
54.✧ The Use of Replacement Rates In International Peter Whiteford February 1995Comparisons of Benefit Systems

55.✧ Two Papers on Citizenship and the Basic Peter SaundersIncome & Sheila Shaver April 1995
56.✧ Improving Work Incentives in a Means-tested Peter Saunders May 1995System: The 1994 Australian Social SecurityReforms
57.✦ Corporatism in Australia Peter Kriesler & May 1995Joseph Halevi
58. Universality and Selectivity in Income Support: Sheila Shaver May 1995A Comparative Study in Social Citizenship
59. Household Semi-public Goods and the Bruce Bradbury May 1995Estimation of Consumer Equivalence Scales:Some First Steps
60.✧ Wage and Income Inequality in Two Welfare Peter Saunders August 1995States: Australia and Sweden & Johann Fritzell
61.✦ The Changing Mix of Welfare in Health Care Michael Fine August 1995and Community Support Services
62.✧ Evaluation and Research in Social Policy Peter Saunders December 1995& Michael Fine
63.✧ Unpacking Inequality: Wage Incomes, Peter Saunders December 1995Disposable Incomes and Living Standards
64.✦✧ A Challenge to Work and Welfare: Poverty Peter Saunders December 1995in Australia in the 1990s
65.✦✧ Social Policy and Personal Life: Changes Sheila Shaver & December 1995in State, Family and Community in the Michael FineSupport of Informal Care
66. Household Income Sharing, Joint Bruce Bradbury May 1996Consumption and the Expenditure Patternsof Australian Couples and Single People
67. Explaining Changes in the Social Structure Boyd Hunter June 1996of Employment: The Importance of Geography
68. Liberalism, Gender and Social Policy Sheila Shaver July 1996
69. Redistribution by the State in Austria Alois Guger October 1996
70. Economic Crisis and Social Policy in Finland Hannu Uusitalo October 1996in the 1990s
71. Sole Mothers in Australia: Supporting Mothers Marilyn McHugh November 1996to Seek Work & Jane Millar
72. ‘All Else Confusion’: What Time Use Surveys Michael Bittman November 1996Show About Changes in Gender Equity & George Matheson
73. Are the Low Income Self-employed Poor? Bruce Bradbury December 1996
74. Social Policy in East Asia and the Pacific Peter Saunders December 1996
Area in the Twenty-First Century:Challenges and Responses
75. Dawning of a New Age? The Extent, Peter Saunders December 1996Causes and Consequences of Ageing inAustralia
76. Poverty, Choice and Legitimacy Peter Saunders March 1997
77. The Restructuring of the Canadian Welfare Maureen Baker June 1997State: Ideology and Policy
78. Developing Policy Planning and Research Peter Saunders October 1997Capabilities in the Asia Pacific
79. New Relations of Welfare in the Contracting Tony Eardley October 1997State: The Marketisation of Services for theUnemployed in Australia
80. Coordinating Health, Extended Care and Michael Fine October 1997Community Support Services: Issues for PolicyMakers and Service Providers in Australia
81. How do the Elderly in Taiwan Fare Cross- Peter Saunders & April 1998Nationally? Evidence from the Luxembourg Timothy M.Income Study Project Smeeding
82. An Australian Model for Labour Supply Guyonne Kalb June 1998and Welfare Participation in Two-adultHouseholds
83. The Land of the Lost Long Weekend? Trends Michael Bittman June 1998in Free Time Among Working AgeAustralians, 1974-1992
84. Defining Poverty and Identifying the Poor: Peter Saunders June 1998Reflections on the Australian Experience
85. An Equivalence Scale for Time Michael Bittman July 1998& Robert E.Goodin
86. The Changing Boundary Between Home Michael Bittman, July 1998and Market: Australian Trends in Outsourcing Gabrielle MeagherDomestic Labour & George Matheson
87. Incomes, Incentives and the Growth of Means Gerry Redmond August 1998Testing in Hungary
88. Economic Insecurity Lars Osberg October 1998
89. Household Budgets and Income Distribution Peter Saunders October 1998Over the Longer Term: Evidence for Australia
90. Global Pressures, National Responses: Peter Saunders October 1998The Australian Welfare State in Context
91. Working But Poor? Low Pay and Poverty Tony Eardley November 1998in Australia

92. Extension Amidst Retrenchment: Gender and Sheila Shaver December 1998Welfare State Restructuring in Australia andSweden
93. Using Budget Standards to Assess the Well- Peter Saunders December 1998Being of Families
94. Later Life, Gender and Ethnicity: Changing Gail Wilson December 1998Theory for Social Policy Research
95. Social Participation and Family Welfare: Michael Bittman February 1999The Money and Time Costs of Leisure
96. The Increasing Financial Dependency of Judy Schneider February 1999Young People on Their Families
97. The Rush Hour: The Quality of Leisure Michael Bittman February 1999Time and Gender Equity & Judy Wajcman
98. Women and Retirement Income in Australia: Merrin Thompson May 1999Social Rights, Industrial Rights and PropertyRights
99. The ‘Dutch Miracle’: Employment Growth in Uwe Becker May 1999a Retrenched but Still Generous WelfareSystem
100. Tax Theory and Targeting: A Survey Bruce Bradbury May 1999
101. Home and Away: Reflections on Long-term Melanie Henwood June 1999Care in the UK and Australia
102. Australian Attitudes to Tony Eardley and June 1999Unemployment and Unemployed George MathesonPeople
103. The Costs of Children: Budget Standards Marilyn McHugh July 1999Estimates and the Child Support Scheme
104. Tax-benefit Policies and Parents’ Incentives Gerry Redmond July 1999to Work: The Case of Australia 1980-1997
105. The Responsibility for Child and Aged Care: Michael Fine August 1999Shaping Policies for the Future

SOCIAL POLICY RESEARCH CENTRE REPRINTS
The following Discussion Papers have been published in journals or books. Whereindicated, Reprints of the articles are available from the SPRC at the cost of $2.00each. To order reprints, quote the Reprint number and attach a cheque or money ordermade out to the Social Policy Research Centre. Send orders to:
The Publications OfficerSocial Policy Research CentreUniversity of New South WalesSydney NSW 2052Australia
DP No. Published as SPRCReprint No.
(if applicable)
1. Russell Ross (1988), ‘The Labour Market Position of AboriginalPeople in Non-metropolitan New South Wales’, AustralianBulletin of Labour, 15(1), December, 29-56. 48
3. Peter Whiteford (1989), ‘Taxation and Social Security: AnOverview’, Australian Tax Forum, 6(1), 2-39. 49
4. Peter Saunders and Garry Hobbes (1988), ‘Income Inequalityin an International Comparative Perspective,’ AustralianEconomic Review, 3rd Quarter, 25-34. 47
5. Bruce Bradbury (1989), ‘Family Size Equivalence Scales and SurveyEvaluations of Income and Well-being’, Journal of Social Policy,18(3), July, 383-408. 52
6. Peter Whiteford (1989), ‘Taxation Reform and the Tax Threshold’,in John G. Head, ed., Australian Tax Reform in Retrospect andProspect, papers presented at a conference organised by the Centreof Policy Studies, Monash University, Conferences Series no. 8,Australian Tax Research Foundation, Sydney, 219-47.
10. Bruce Bradbury (1989), ‘The "Family Package" and the Costof Children’, Australian Social Policy, 1(12), Winter, 21-51. 59
12. Cathy Boland (1989), ‘A Comparative Study of Home and HospitalBirths: Scientific and Normative Variables and Their Effects’,in Celebrating a Revolution in Birth: Proceedings of 10thNational Homebirth Conference, Sydney, 19-33.
14. Peter Saunders and Bruce Bradbury (1991), ‘Some AustralianEvidence on the Consensual Approach to Poverty Measurement’,Economic Analysis and Policy, 21(1), March, 47-73. 62
15. Peter Saunders, Helen Stott and Garry Hobbes (1991), ‘IncomeInequality in Australian and New Zealand: InternationalComparisons and Recent Trends’, Review of Income and Wealth,37(1), March, 63-79. 47
DP No. Published as SPRCReprint No.
(if applicable)
16. Bruce Bradbury, Jenny Doyle and Peter Whiteford (1993), ‘Trendsin the Disposable Income and Housing Costs of Australian Families’,Greg Mahoney, ed., The Australian Economy under Labor, Allenand Unwin, Sydney, 137-158. 71
17. Peter Saunders (1991), ‘Selectivity and Targeting in IncomeSupport: The Australian Experience’, Journal of Social Policy,20(3), 299-326.
18. Bruce Bradbury and Peter Saunders (1990), ‘How Reliable areEstimates of Poverty in Australia? Some Sensitivity Tests forthe Period 1981-82 to 1985-86’, Australian Economic Papers,29(55), December 154-81. 60
19. Russell Ross and Peter Saunders (1993), ‘The Labour Supply ofSole Mothers and Married Mothers in Australia: Evidence fromthe 1986 Income Distribution Survey’, Australian Economic Papers,Vol. 32, June, 116-133.
20. Russell Ross and Peter Whiteford (1992), ‘Poverty in 1986:Aboriginal Families with Children’, Australian Journal ofSocial Issues, 27(2), May, 92-111. 61
21. Peter Saunders and Peter Whiteford (1990), ‘CompensatingLow Income Groups for Indirect Taxes’, Australian Tax Forum,7(4), 443-64.
22. Peter Saunders (1990), ‘Reflections on the Review of the HACCProgram’, in A. Howe, E. Ozanne and C. Selby Smith, eds,Community Care Policy and Practice: New Directions inAustralia, Public Sector Management Institute, MonashUniversity, Victoria, 201-12. 63
23. Peter Saunders and George Matheson (1991), ‘Sole ParentFamilies in Australia’, International Social Security Review,44(3), 51-75.
24. Bruce Bradbury (1992), ‘Unemployment, Participation andFamily Incomes in the 1980s’, Economic Record, 68(203),December, 328-42. 73
25. Peter Saunders (1991), ‘Employment Growth and Poverty: AnAnalysis of the Australian Experience 1982-1990’, in MichaelJohnson, Peter Kriesler and Anthony D. Owen, eds, ContemporaryIssues in Australian Economics, The Economic Society of Australia,Macmillan, Australia, 105-33. (Also excerpts in ACTCOSS News,5 October, 12-14.)
28. Peter Saunders (1991), ‘Efficiency and Effectiveness in SocialPolicies: an International Perspective’, in T. P. Hardiman andMichael Mulreany, eds, Efficiency and Effectiveness in thePublic Domain, Institute of Public Administration, Dublin, 78-117.

DP No. Published as SPRCReprint No.
(if applicable)
30. Peter Saunders and George Matheson (1991), ‘An Ever Rising Tide?:Poverty in Australia in the Eighties’, Economic and LabourRelations Review, 2(2), December, 142-71. 67
31. Peter Whiteford (1991), ‘Are immigrants over-represented in theAustralian social security system?’, Journal of the AustralianPopulation Association, 8(2), November, 93-109.
33. Bruce Bradbury (1993), ‘Family Assistance and the Incomes ofLow Wage Families’, Social Security Journal, March, 1-18.andBruce Bradbury (1993), ‘Family Assistance, Replacement Ratesand the Unemployment of Married Men’, Australian Bulletin ofLabour, Vol. 19, No. 2, June, 114-132. 70
34. Peter Saunders (1993), ‘Recent Trends in the Size and Growth ofGovernment in OECD Countries’, in Normal Gemmell, ed., TheGrowth of the Public Sector: Theories and InternationalEvidence, Edward Elgar, Aldershot, 17-33.
35. Timothy M. Smeeding, Peter Saunders, John Coder, StephenJenkins, Johan Fritzell, Aldi J. M. Hagenaars, RichardHauser and Michael Wolfson (1993), ‘Poverty, Inequality andFamily Living Standards Impacts Across Seven Nations: TheEffects of Noncash Subsidies for Health, Education and Housing’,The Review of Income and Wealth, Series 39, No. 3, September,229-256.
36. Peter Saunders and Michael Fine (1992), ‘The Mixed Economy ofSupport for the Aged in Australia: Lessons for Privatisation’,Economic and Labour Relations Review, 3(2), December, 18-42. 69
38. Sheila Shaver (1993), ‘Body Rights, Social Rights and theLiberal Welfare State’, Critical Social Policy, Issue 39,Winter 1993/94, 66-93. 72
39. Bruce Bradbury (1993), ‘Unemployment, and Income Support:Challenges for the Years Ahead’, Economic Papers, Vol. 12,No. 2, June, 14-31.
40. Peter Saunders (1993), ‘Married Women’s Earnings and FamilyIncome Inequality in the Eighties’, Australian Bulletin of Labour,Vol. 19, No. 3, 3-22.
44. Sheila Shaver and Jonathan Bradshaw (1995), ‘The Recognition ofWifely Labour by Welfare States’, Social Policy and Administration, Vol.29, No.1, March, 10-25.
46. Peter Saunders, Björn Halleröd and George Matheson (1994),‘Making Ends Meet in Australia and Sweden: A ComparativeAnalysis Using the Subjective Poverty Line Methodology’,Acta Sociologica, Vol. 37, No. 3, 3-22.

DP No. Published as SPRCReprint No.
(if applicable)
48. Peter Saunders (1993), ‘Poverty and Inequality: Social Securityin the 1990s’, in J. Disney and L. Briggs, eds, Social SecurityPolicy: Issues and Options, papers from the Conference,‘Social Security Policy: The Future’, November, AGPS 29-48.
49. Peter Saunders (1994), ‘Rising on the Tasman Tide: IncomeInequality in Australia and New Zealand’, Social Policy Journalof New Zealand, Issue 2, July, 97-114.
52. Peter Saunders, ‘The Immigrant Dimension of Income Inequality’ in J.Neville, ed., As the Rich Get Richer: Changes in Income Distribution,Committee for the Economic Development of Australia (CEDA), Sydney,66-86.
53. Peter Saunders (1995), ‘In Defence of a Poverty Line’, Just Policy, No. 4,September, 9-16.
54. Peter Whiteford (1995), ‘The Use of Replacement Rates in International Comparisons of Benefit Systems’, International Social Security Review,Vol. 48, No.2/95, 3-30.
55. Peter Saunders (1995), ‘Conditionality and Transition as Issues in theBasic Income Debate’, in Income Support in an Open Economy: BasicIncome Seminar, Victorian Council of Social Service and the GoodShepherd Youth and Family Services, Melbourne, 51-62.
56. Peter Saunders (1995), ‘Improving Work Incentives in a Means-TestedWelfare System: The 1994 Australian Social Security Reforms, FiscalStudies, Vol. 16, No. 2, May, 145-70.
60. Johan Fritzell and Peter Saunders (1995), ‘Wage and Income Inequality inTwo Welfare States: Australia and Sweden’, in F. Engelstad, R.Kalleberg, A. Lura and L. MjØset, eds, Comparative Social Research,Volume 15: Institutional Aspects of Work and Wage Determination, JAIPress, Greenwich, CT, 187-229.Also in Comparative Social Research Yearbook
62. Peter Saunders and Michael Fine (1997), ‘Evaluation and Research inSocial Policy’, Australian Journal of Social Research, Vol. 3, No. 1,January, 75-94.
63. Peter Saunders (1996), ‘Unpacking Inequality: Wage Incomes,Disposable Incomes and Living Standards’, in The Industry CommissionConference on Equity, Efficiency and Welfare, Conference Proceedings,AGPS, Canberra,225-55.
64. Peter Saunders (1996), ‘Poverty in the 1990s: A Challenge to Work andWelfare’, in P. Sheehan, B. Grewal and M. Kumnick, eds, Dialogues inAustralia’s Future: In Honour of the Late Professor Ronald Henderson,Centre for Strategic Economic Studies, Victoria University ofTechnology, Melbourne, 325-50.

DP No. Published as SPRCReprint No.
(if applicable)
65. Sheila Shaver and Michael Fine (1996), ‘Social Policy and Personal Life:Changes in State, Family and Community in the Support of InformalCare’ in Aged and Community Care Division and Office of Disability,Department of Human Services and Health, Towards a National Agendafor Carers, Workshop Papers, No. 22, AGPS, Canberra, 19-36.