economic development five- year strategic
TRANSCRIPT
City of Scottsdale
Economic Development Five-Year Strategic Plan Approved by the Scottsdale City Council April 20, 2021
PAGE 2
Scottsdale is a prosperous, sustainable destination for diverse talent, investment, and innovative businesses.

PAGE 3
Executive Summary Scottsdale is one of the most desirable destinations and fastest-growing communities in the U.S.
The City of Scottsdale requires a deliberate, collaborative strategy for business expansion, startup
and enterprise development, talent attraction/retention, and destination development.
Key insights include:
• Scottsdale’s population growth is 3 times the U.S. average.
• Nearly 6 in 10 Scottsdale’s residents have a bachelor’s degree or higher.
• The City outpaces Arizona for share of knowledge businesses:1,900 firms per
100K residents.
• Scottdale startups attract more than $295 million in annual venture capital.
• The City’s median household income ($86,000) is 40% higher than the U.S.
average.
• Scottsdale boasts a high rate of home ownership, and a good quality of life as
proven by the quality and variety of amenities offered.
Six target industries offer a strong foundation for Scottsdale’s Economic Development Strategic
Plan:
1. Corporate Headquarters. A city with an exceptional quality of life, Scottsdale’s share of
corporate HQs is 13% greater than U.S.
2. IT Services and Software. With a competitive advantage two times the U.S. average,
Scottsdale is a magnet for technology development.
3. Financial and Insurance Services and Technology. Employing 13,000, the City’s Financial
and Insurance Services sector offers a foundation for future innovation and enterprise
development.
4. Healthcare Services and Innovation. With an array of leading healthcare institutions,
Scottsdale is one of the country’s premier healthcare centers.
5. Logistics Management. This fast-growing sector boasts an employment base of 3,000 in
Scottsdale and has access to ASU’s top-ranked Department of Supply Chain Management.
6. Tourism. Scottsdale’s tourism and hospitality industry is an important employment base for
the City and essential for maintaining the community’s quality of life appeal.

PAGE 4
Guided by Resonance Consultancy and supported by leading edge research and analysis, the City
of Scottsdale has engaged residents, business executives, community leaders, and elected officials
to create strategies and tactics to further build Scottsdale into the premier destination for talent,
investment and visitors – a model for economic development for the state of Arizona and the U.S.
Key engagement takeaways include:
• Scottsdale is changing quickly, creating both opportunities and challenges.
• The City needs a clear vision to guide future economic development.
• Retaining and expanding Scottsdale’s corporate presence is a priority for the community.
• Industry diversification is an economic necessity for the City of Scottsdale’s future.
• Scottsdale’s startup ecosystem is expanding but it needs a champion.
• Medical tourism is a significant opportunity for the City.
• When attracting new businesses, Scottsdale has a strong quality of place story.
• Scottsdale is a welcoming community but needs to better tell its story.
To advance economic prosperity and opportunity, the City of Scottsdale’s Economic Development
Five-Year Strategic Plan will focus on 6 goals:
1. Grow Scottsdale’s existing industries to foster economic vitality.
2. Attract investment to diversify the City’s economy.
3. Bolster Scottsdale’s startup ecosystem.
4. Make inclusion and diversity an economic development priority.
5. Build Scottsdale into the premier destination for talent in the Southwest.
6. Enhance the City’s brand for business, capital and talent.
The following report describes the City of Scottdale’s Economic Development Five-Year Strategic
Plan and includes the competitive market assessment (Appendix A), engagement summary
(Appendix B) and key industries analysis (Appendix C) that serve as the foundation for the plan.
The Strategic Plan is aligned with the City’s General Plan and Smart City Strategic Roadmap.

PAGE 5
Strategy GOALS
The City of Scottdale’s Economic Development Five-Year Strategic Plan has six key goals:
1. Grow Scottsdale’s existing industries
to foster economic vitality. Scottsdale
must support existing businesses in
an effort to maintain competitiveness
and foster prosperity.
2. Attract investment to diversify
Scottsdale’s economy. Scottsdale
must attract new investment into the
local economy to ensure resiliency.
3. Bolster Scottsdale’s startup
ecosystem. With its strong destination
assets, Scottsdale will be a magnet
for startups.
4. Make inclusion and diversity an
economic development priority.
Scottsdale must ensure that all
residents and businesses have the
opportunity to thrive.
5. Build the premier destination for talent
in the Southwest. Scottsdale’s
economic development success
today hinges on talent attraction and
retention.
6. Enhance the Scottsdale brand for
business, capital and talent.
Scottsdale must broaden its
reputation as a city to grow a
business and launch a career.
VALUES
The Strategic Plan is built around the following values:
• Economic Prosperity for All. The City will advance economic prosperity for all Scottsdale
residents and enterprises, by supporting wealth creation and economic mobility. This can

PAGE 6
be achieved by supporting a robust business attraction and expansion effort, as well as
providing support to Scottsdale entrepreneurs to grow and scale their enterprises.
• Future-Defining Innovation. Scottsdale will invest in an entrepreneurial ecosystem that
solves tomorrow’s most pressing challenges. Already a growing center for venture capital
investment and startups, Scottsdale’s startups and scaleups are helping to ensure the city’s
traditional industries are relevant for the future.
• A Healthy Economy for Tomorrow. The City will foster resiliency through industry
diversification, upskilling, talent attraction and responsible revitalization. A more resilient
Scottsdale will ensure a faster economic recovery in the future.
• A Sonoran Desert Way of Life. Economic development efforts will prioritize Scottsdale’s
quality of place and promote the City’s authenticity, character and values. Scottsdale’s high
quality of place is a central offering as it looks to attract and retain skilled residents.
GUIDING PRINCIPLES
The following six guiding principles serve as a framework for the Strategic Plan:
• Balanced Development. Consistent with the values in the City’s General Plan, Scottsdale
will advance economic development initiatives that balance prosperity and livability. Staff
across the City’s economic development and planning departments will collaborate to
develop a framework for evaluating the “highest and best” use of future redevelopment
efforts.
• Export Industry-Driven. Scottsdale will pursue a data-driven export industry approach to
drive economic diversification. Research shows that growing sectors that sell goods and
services outside of the city accelerate job creation.
• Existing Businesses First. The City will focus on business expansion and retention to grow
Scottsdale’s economic base and attract investment. Generally, more than 70% of the new
jobs created in a city come from existing businesses.

PAGE 7
• Focus on Entrepreneurship. Scottsdale will foster an inclusive startup ecosystem as a
means of wealth creation for residents. A supportive startup environment is also essential
for creating a more resilient, shock-resistant economy.
• Private Sector and Partner Engagement. To achieve success with this plan, Scottsdale’s
private sector and economic development partners will be critical to advance the City’s
economic development priorities.
• Equitable Approach. The City will apply an equity lens to all economic development efforts,
ensuring all Scottsdale residents and businesses can thrive. This is essential for attracting
and retaining businesses and residents that want to operate and live in more inclusive
communities.
PAGE 8
GOALS AND ACTION PLAN
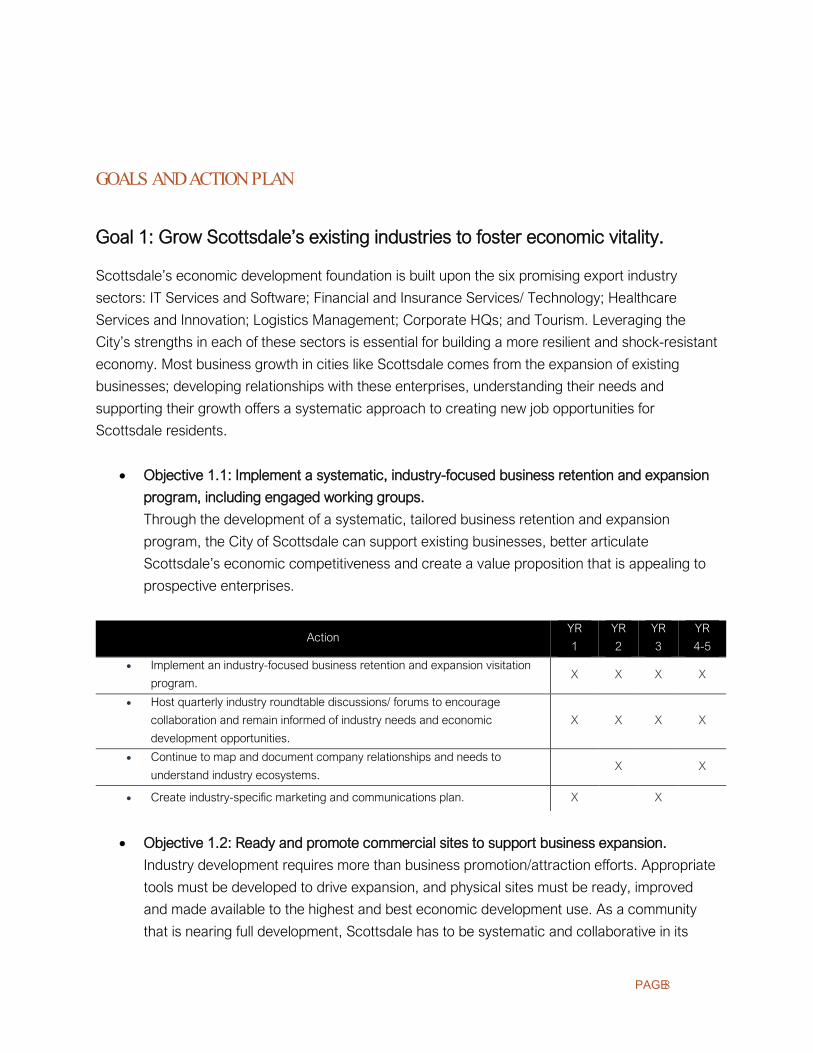
Goal 1: Grow Scottsdale’s existing industries to foster economic vitality.
Scottsdale’s economic development foundation is built upon the six promising export industry
sectors: IT Services and Software; Financial and Insurance Services/ Technology; Healthcare
Services and Innovation; Logistics Management; Corporate HQs; and Tourism. Leveraging the
City’s strengths in each of these sectors is essential for building a more resilient and shock-resistant
economy. Most business growth in cities like Scottsdale comes from the expansion of existing
businesses; developing relationships with these enterprises, understanding their needs and
supporting their growth offers a systematic approach to creating new job opportunities for
Scottsdale residents.
• Objective 1.1: Implement a systematic, industry-focused business retention and expansion
program, including engaged working groups.
Through the development of a systematic, tailored business retention and expansion
program, the City of Scottsdale can support existing businesses, better articulate
Scottsdale’s economic competitiveness and create a value proposition that is appealing to
prospective enterprises.
Action YR
1
YR
2
YR
3
YR
4-5
• Implement an industry-focused business retention and expansion visitation
program. X X X X
• Host quarterly industry roundtable discussions/ forums to encourage
collaboration and remain informed of industry needs and economic
development opportunities.
X X X X
• Continue to map and document company relationships and needs to
understand industry ecosystems. X X
• Create industry-specific marketing and communications plan. X X
• Objective 1.2: Ready and promote commercial sites to support business expansion.
Industry development requires more than business promotion/attraction efforts. Appropriate
tools must be developed to drive expansion, and physical sites must be ready, improved
and made available to the highest and best economic development use. As a community
that is nearing full development, Scottsdale has to be systematic and collaborative in its

PAGE 9
redevelopment opportunities. This will require building relationships with outside entities and
partners to achieve this goal.
Action YR
1
YR
2
YR
3
YR
4-5
• Collaborate with City of Scottsdale Planning and Development department to
identify and map potential redevelopment opportunities. X X X X
• Partner with Arizona State Land Department and other partners to promote
available parcels through updated marketing collateral and channels. X X X X
• Work with commercial real estate partners to highlight and market new
commercial development and vacancies. X X X X
• Objective 1.3: Deliver technical resources to Scottsdale small businesses to support
economic recovery.
Scottsdale has a well-deserved reputation as a great place to operate a small business.
Scottsdale must continue to offer resources for its small businesses as they continue to
operate and grow in the future.
Action YR
1
YR
2
YR
3
YR
4-5
• Continue to offer small business training and resources specific to COVID-19
recovery. X X
• Continue the efforts of the Small Business Assistance Center, offering an
array of programming and networking opportunities. X X X X
• Provide ongoing updates to Scottsdale’s small businesses about federal,
state and local resources. X X X X
PAGE 10
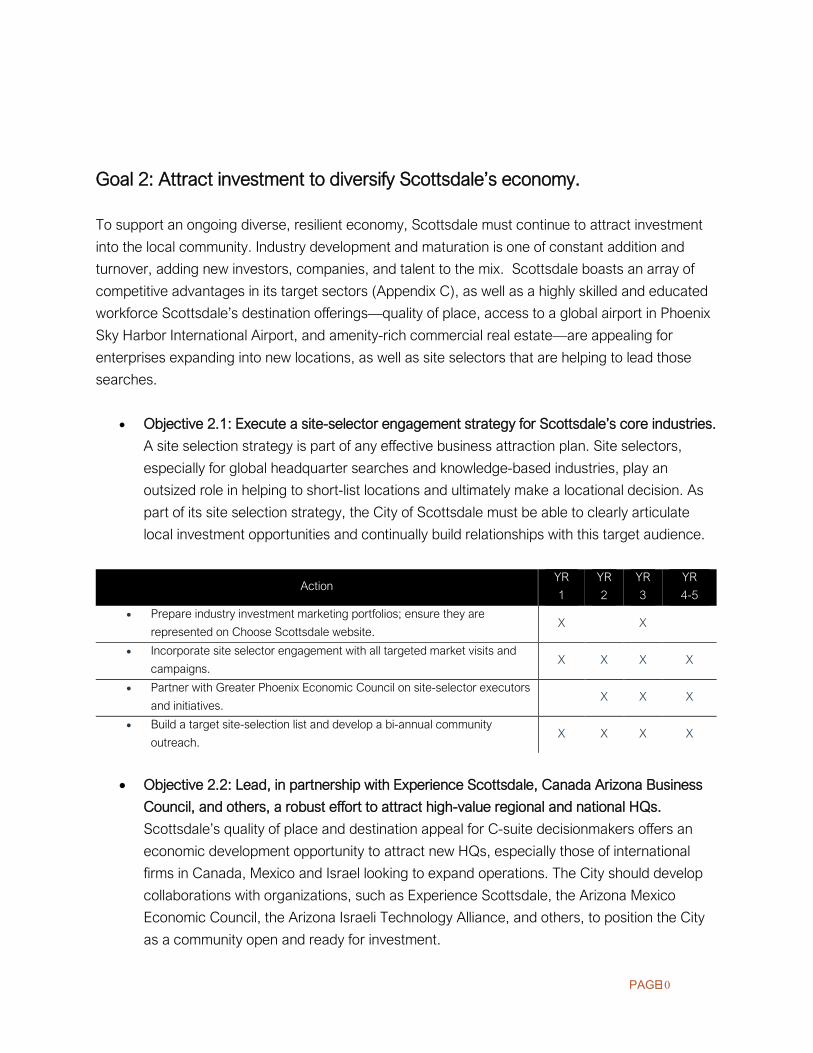
Goal 2: Attract investment to diversify Scottsdale’s economy.
To support an ongoing diverse, resilient economy, Scottsdale must continue to attract investment
into the local community. Industry development and maturation is one of constant addition and
turnover, adding new investors, companies, and talent to the mix. Scottsdale boasts an array of
competitive advantages in its target sectors (Appendix C), as well as a highly skilled and educated
workforce Scottsdale’s destination offerings—quality of place, access to a global airport in Phoenix
Sky Harbor International Airport, and amenity-rich commercial real estate—are appealing for
enterprises expanding into new locations, as well as site selectors that are helping to lead those
searches.
• Objective 2.1: Execute a site-selector engagement strategy for Scottsdale’s core industries.
A site selection strategy is part of any effective business attraction plan. Site selectors,
especially for global headquarter searches and knowledge-based industries, play an
outsized role in helping to short-list locations and ultimately make a locational decision. As
part of its site selection strategy, the City of Scottsdale must be able to clearly articulate
local investment opportunities and continually build relationships with this target audience.
Action YR
1
YR
2
YR
3
YR
4-5
• Prepare industry investment marketing portfolios; ensure they are
represented on Choose Scottsdale website. X X
• Incorporate site selector engagement with all targeted market visits and
campaigns. X X X X
• Partner with Greater Phoenix Economic Council on site-selector executors
and initiatives. X X X
• Build a target site-selection list and develop a bi-annual community
outreach. X X X X
• Objective 2.2: Lead, in partnership with Experience Scottsdale, Canada Arizona Business
Council, and others, a robust effort to attract high-value regional and national HQs.
Scottsdale’s quality of place and destination appeal for C-suite decisionmakers offers an
economic development opportunity to attract new HQs, especially those of international
firms in Canada, Mexico and Israel looking to expand operations. The City should develop
collaborations with organizations, such as Experience Scottsdale, the Arizona Mexico
Economic Council, the Arizona Israeli Technology Alliance, and others, to position the City
as a community open and ready for investment.
PAGE 11
Action YR
1
YR
2
YR
3
YR
4-5
• Continue to collaborate with Experience Scottsdale in the co-creation of
messaging at the interaction of business and tourism. X X X X
• Establish working relationship with the Arizona Mexico Economic Council
to evaluate business development opportunities. X X X X
• Evaluate the prospects of a Canadian medical and wellness tourism
initiative. X
• Partner with the Arizona Israeli Technology Alliance to attract venture
capital and new enterprises. X X X X
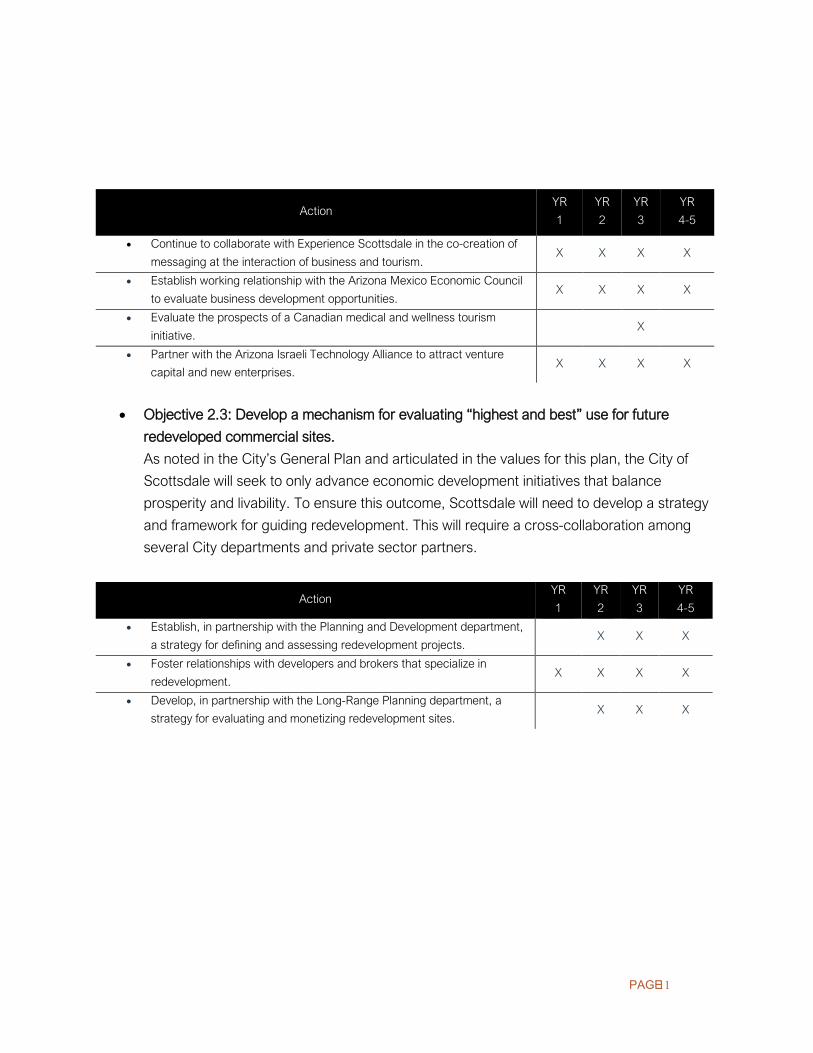
• Objective 2.3: Develop a mechanism for evaluating “highest and best” use for future
redeveloped commercial sites.
As noted in the City’s General Plan and articulated in the values for this plan, the City of
Scottsdale will seek to only advance economic development initiatives that balance
prosperity and livability. To ensure this outcome, Scottsdale will need to develop a strategy
and framework for guiding redevelopment. This will require a cross-collaboration among
several City departments and private sector partners.
Action YR
1
YR
2
YR
3
YR
4-5
• Establish, in partnership with the Planning and Development department,
a strategy for defining and assessing redevelopment projects. X X X
• Foster relationships with developers and brokers that specialize in
redevelopment. X X X X
• Develop, in partnership with the Long-Range Planning department, a
strategy for evaluating and monetizing redevelopment sites. X X X

PAGE 12
Goal 3: Bolster Scottsdale’s startup ecosystem.
With its strong destination assets, Scottsdale is already a magnet for startups. In 2019, the City
attracted more than $295 million in venture capital. While the entrepreneurial ecosystem in
Scottsdale is growing, the cluster is dispersed and would benefit from a comprehensive approach
to supporting entrepreneurs who want to grow and launch their enterprises in the community. This
not only helps to diversify Scottsdale’s economy, but it also creates new employment opportunities
for local residents who want to live and work in the same community.
• Objective 3.1: Explore the creation of "Startup Scottsdale," an initiative to support high-
potential entrepreneurs and activate a formalized investor/ angel network.
Building and scaling an entrepreneurial ecosystem requires a comprehensive approach.
The City of Scottsdale and its partners can help build the networks that allow startups to
connect to investors and customers, and it can help make it easier for new enterprises to
find available affordable space.
Action YR
1
YR
2
YR
3
YR
4-5
• Identify and convene an advisory working group to support the
exploration of “Startup Scottsdale.” X X X
• Build relationships with venture capital organizations within Phoenix
Metro, Arizona and outside the state X X X X
• Promote Scottsdale entrepreneurial successes across economic
development communication platforms. X X X X
• Support startup community events such as pitch competitions and
networking sessions. X X X X
• Objective 3.2: Collaborate with SkySong to accelerate the growth of Scottsdale's high-tech
startups.
Scottsdale’s growing startup ecosystem benefits tremendously from the presence of
SkySong. The research and development and commercialization being catalyzed there will
help to fuel the next generation of innovation for Scottsdale’s key economic clusters.

PAGE 13
Action YR
1
YR
2
YR
3
YR
4-5
• Strengthen partnership with SkySong through Startup Scottsdale
initiative. X X X
• Promote successes of SkySong startup enterprises. X X X
• Objective 3.3: Discover a sustainable organizational and funding model for the Cure
Corridor, to galvanize Scottsdale's health sciences sector.
As noted in Scottsdale’s upcoming General Plan, as well as in this economic development
strategy, the City’s strength in healthcare services and innovation is a competitive
advantage. This asset can be credited to the City and its partners’ efforts to create and
promote the Cure Corridor, a place-based initiative that has helped healthcare, wellness
firms and institutions thrive within the City of Scottsdale. To ensure this initiative can
continue in the future, the City must develop and evaluate a sustainable funding and
organizational model.
Action YR
1
YR
2
YR
3
YR
4-5
• Create an advisory group to explore the creation of Cure Corridor
Alliance initiative. X X
• Evaluate best practices across the country to inform strategy creation
and a funding model. X
• Develop, if deemed viable, a strategy for sustaining the Cure Corridor
Alliance. X
• Objective 3.4: Leverage the investment in Scottsdale's Smart City Strategic Roadmap to
grow urban tech and sustainable tech enterprises.
In its Smart City Strategic Roadmap, Scottsdale offers strategies for how new technology
can enhance quality of life for residents. In an effort to promote additional entrepreneurship
opportunities in the growing urban tech and sustainable tech arena, the City should align
the Roadmap’s priorities with its economic development and startup initiatives.
Action YR
1
YR
2
YR
3
YR
4-5
• Collaborate with the City’s internal Smart City team to promote and
market the Roadmap. X X
• Align the Smart City roadmap with future economic development, startup
support, and marketing efforts. X X X

PAGE 14
Goal 4: Make inclusion and diversity an economic development
priority.
For too long, economic development and equity have been seen as separate entities.
Many companies and talented workers looking to make location and relocation
decisions expect cities like Scottsdale to make inclusion and diversity an economic
development priority, helping to ensure that all residents and business have the
opportunity to thrive.
• Objective 4.1: Evaluate the needs of Scottsdale’s diverse businesses.
In an effort to advance an equitable economic development strategy Scottsdale must
consistently engage with an array of business stakeholders to understand their needs. This
includes developing appropriate arenas and feedback loops to learn what is working, and
what is needed to help a larger group of Scottsdale businesses thrive and scale.
Action YR
1
YR
2
YR
3
YR
4-5
• Convene business leaders to inform and help lead Scottsdale's inclusive
economic development efforts. X X X
• Conduct quarterly business roundtables or forums by industry type or
size. X X
• Spotlight and celebrate minority-and women- owned enterprises X X X X
• Objective 4.2: Advance, in concert with local partners, an initiative to support Scottsdale’s
diverse businesses.
Scottsdale is home to many large-scale anchors—destination resorts, HQ companies, and
healthcare institutions. Through shared values, they can have a large economic impact in
the community and advance an agenda of inclusive prosperity.
Action YR
1
YR
2
YR
3
YR
4-5
• Convene roundtables of anchor employers to better understand current
DEI initiatives, create shared value, and promote efforts. X X X
• Explore with ASU and GPEC the opportunity to create a diversity growth
accelerator at SkySong. X X X X

PAGE 15
• Objective 4.3: Celebrate Scottsdale’s arts, culture, heritage and diverse entrepreneurial
success stories.
By sharing Scottsdale’s diverse culture, businesses, and heritage with the world, the City
will promote a diversity and variety of successes, demonstrating Scottsdale is open to an
array of residents and enterprises.
Action YR
1
YR
2
YR
3
YR
4-5
• Develop a systematic approach to identify diverse enterprises, arts, and
culture successes throughout Scottsdale. X X X X
• Promote Scottsdale’s successes across multiple communication
channels and platforms. X X X X
• Actively support and participate in diverse chambers throughout the
region. X X X X

PAGE 16
Goal 5: Build the premier destination for talent in the Southwest.
Economic development success today hinges on talent attraction and retention; it is the number
one factor for company locations and expansions. Scottsdale’s ample quality of place should be
engaged to attract a new generation of workers: young professionals and highly skilled remote
workers who have the flexibility to make personalized location decisions. In addition to attracting
talent, the City of Scottsdale should also collaborate with its workforce partners to ensure training
pipelines are developed to connect residents with an opportunity to gain upskilling tied to the City’s
growth industries.
• Objective 5.1: Support the Scottsdale Rising Young Professionals initiative.
One of the most important methods of attracting and retaining young professional talent is
to develop local initiatives that connect young residents to one another. While young
professionals in Scottsdale appreciate the advantages of the local community, they are
eager for increased engagement in the community. Partnering with the Scottsdale
Chamber, the City should explore opportunities to grow and scale the Scottsdale Rising
Young Professionals initiative.
Action YR
1
YR
2
YR
3
YR
4-5
• Actively participate and promote the Scottsdale Rising Young
Professionals. X X X X
• Explore, in concert with the Scottsdale Chamber of Commerce and
Scottsdale Leadership, to design a Scottsdale “Top 20 under 40” program
initiative.
X X
• Promote the successes of young professionals in Scottsdale. X X X X
• Objective 5.2: Collaborate with ASU, Scottsdale Community College, and anchor
employers to build a talent pipeline (entry-level IT, business and healthcare), through flexible
certificate programs and on-the-job training initiatives.
While nearly 6 in 10 Scottsdale residents have a college degree, the City should collaborate
with its educational partners in ASU, Scottsdale Community College, and other anchors to
establish workforce pipelines tied to the City’s export sectors. Economic development and
workforce development go together; all efforts to drive them must be carefully coordinated
and industry-driven.

PAGE 17
Action YR
1
YR
2
YR
3
YR
4-5
• Engage a working group of private sector-hiring managers across sectors
and workforce development practitioners to discuss needed skill programs. X X X
• Develop and administer a survey of workforce training gaps in Scottsdale,
utilizing findings to shape possible skill programs. X
• Objective 5.3: Develop a remote worker campaign to draw tech-savvy and skilled talent to
Scottsdale.
Fifty percent of remote workers across the U.S. are highly educated, boasting at least a
graduate degree. This is a highly desirable workforce pool for any city. With its reputation as
a premier amenity-rich destination, Scottsdale’s quality of place must be leveraged to
attract remote workers and retain skilled talent.
Action YR
1
YR
2
YR
3
YR
4-5
• Evaluate various remote worker campaigns across the U.S. for best
practices. X
• Implement a digital remote worker campaign aimed at skilled and
technology workers, promoting Scottsdale’s opportunity and quality of
place.
X X X
• Objective 5.4: Invest in placemaking efforts to enhance Scottsdale as an inviting destination
for local talent.
Studies show that talented people are drawn to locations for lifestyle reasons, and then
businesses follow. There is no other city in Arizona that boasts the caliber and number of
destination assets as Scottsdale. Scottsdale should more effectively utilize placemaking
initiatives to fully represent the authenticity of the community and its residents.
Action YR
1
YR
2
YR
3
YR
4-5
• Support the creation of a systematic placemaking program to attract talent. X
• Commission destination development features for blog posts, social media,
and direct communications.
X X X X

PAGE 18
Goal 6: Enhance the Scottsdale brand for business, capital and
talent. A significant element of economic development is community promotion: telling a story that creates
an attractive brand identity for business, capital investment, and prospective residents. Scottsdale
has a strong reputation as a tourist destination, while its reputation for business investment, talent
attraction and economic development needs to be elevated. To achieve long-term economic
development success, it will be essential for Scottsdale to broaden its reputation as a place to live,
work and grow your business; prioritizing efforts to attract new talent in search of a better place to
live, young professionals in search of a place to build a career, and entrepreneurs and investors
who are looking to build companies.
• Objective 6.1: Develop a competitive identity/marketing campaign to support Scottsdale’s
economic development efforts.
Marketing is an essential element in economic development for Scottsdale to be successful
in its efforts to attract and retain talent and companies. As a global brand, Scottsdale must
craft a compelling narrative and identity that signifies who it is and what its business climate
will represent now and in the future.
Action YR
1
YR
2
YR
3
YR
4-5
• Complete the refresh of Choose Scottsdale brand and messaging platform. X
• Refresh Scottsdale economic development website in concert with new
identity and messaging. X X X X
• Objective 6.2: Ensure that community collaborators, and economic development partners
utilize consistent messages about investment and talent attraction.
With a newly competitive identity in hand, Scottsdale should create a communication
strategy that ensures all City representatives and partners share a unified and consistent
message about the City’s competitive advantages and investment opportunities.
Action YR
1
YR
2
YR
3
YR
4-5
• Develop and execute a communication strategy, including messaging
points, about Scottsdale’s economic development successes. X X X X

PAGE 19
• Objective 6.3: Launch an “Economic Ambassadors” program—engaging entrepreneurs,
business owners and executives, and young professionals—to tell the story of Scottsdale’s
economy and its diversity of opportunities.
Often when an entrepreneur, business executive or site selector looks to a new city for
expansion, hearing a city’s story first-hand from a fellow executive or business owner can be
an effective recruitment tool. Scottsdale has a wealth of engaged business leaders in the
community; the City will continue to partner with business leaders to tell Scottsdale’s
economic development story.
Action YR
1
YR
2
YR
3
YR
4-5
• Establish and leverage, in collaboration with Scottsdale Chamber, an
“Economic Ambassadors” program to assist in economic development
recruitment and attraction efforts
X X

PAGE 20
Appendix A: Community Competitive Assessment The following information provides a current snapshot of community and economic conditions in the City of Scottsdale that provide direction regarding strategic actions. These data points can serve as a point of reference to gauge the City’s competitive advantages or weaknesses. For context and comparisons, this analysis compares the City of Scottsdale to fourteen American communities, whose size, demographics, and economics are similar to the City or offer policies and practices that the community can look to for best practices: Chandler, Arizona; Tempe, Arizona; Gilbert, Arizona; Tucson, Arizona; Albuquerque, New Mexico; Durham, North Carolina; San Mateo, California; Carlsbad, California; Hillsboro, Oregon; Plano, Texas; Bellevue, Washington; Fort Collins, Colorado; Colorado Springs, Colorado; St. Petersburg, Florida. A total of 54 metrics was collected for the City of Scottsdale and the benchmarking cities. The metrics fall into the following six categories: People and Diversity, Talent, Economic Vitality, Innovation, Equity, and Quality of Place. The methodology for the benchmarking analysis revolves around the use of three main fundamental tools: the calculation of shares, growth rates, and location quotients. The calculation of shares/ratios helps us view the figures as part of the whole and creates a common basis for comparison between benchmark communities. Growth rates allow us to assess the change in a certain value over time. By definition, they express the recession or expansion of a particular variable. In all cases, a five-year time span is chosen. In order to assess the concentration of a certain community characteristic (e.g. share of millennial population, share of immigrants, etc.) or industry competitiveness, location quotients are calculated. The location quotients use the U.S. national value as a benchmark. In this sense, a value higher than one demonstrates a concentration / specialization relative to the U.S. norm, while a value lower than one indicates that the particular characteristic is under-represented in Scottsdale. The assessment also provides comparisons to the state and metro area averages when appropriate. Benchmarks and metrics were selected in partnership with City staff.

PAGE 21
KEY INSIGHTS
SCOTTSDALE HAS A FAST GROWING AND EDUCATED POPULATION Scottsdale’s population grew in the last five years at a rate that is three times the U.S. average. Also, more than half of the population have a Bachelor’s degree or higher, a share that is 80% larger than the U.S. average. Scottsdale has the necessary human capital to achieve sustainable economic development. The creative class in Scottsdale is the foundation for economic growth through entrepreneurship and technological advances. DIVERSITY AND INEQUALITY IN SCOTTSDALE Scottsdale’s population is fairly homogenous with only 12% of residents being people of color. Diversity grows a more creative, innovative, and productive workforce, while inclusivity provides equal education and employment opportunities. They both represent key ingredients to growing a strong economy. LABOR PARTICIPATION IN SCOTTSDALE A popular retiree destination, the median age in Scottsdale is 47 (compared to 38.2 for the U.S.). This has an implication on the city’s labor force, where four in ten Scottsdale residents are not actively working. SCOTTSDALE’S BUSINESSES AND INVESTMENT Scottsdale outpaces Arizona for share of knowledge businesses: 1,900 professional services firms per 100,000 residents. The city also is a strong venture capital investment hub, comparable to Durham. THE QUALITY OF LIFE SCOTTSDALE HAS TO OFFER Despite regional high housing prices, Scottsdale has median household incomes which are 40% higher than the U.S. average. The city boasts a high rate of home ownership, and a good quality of life as proven by the quality and variety of amenities provided.

PAGE 22
PEOPLE AND DIVERSITY
The City of Scottsdale is home to approximately 246,000 residents. The following outlines the key takeaways from the analysis of Scottsdale’s population and demographics: POPULATION GROWTH IS THREE TIMES THE U.S. AVERAGE Over the past five years, Scottsdale’s population has increased 11.2%, above other Arizona cities such as Gilbert (10.1%), Chandler (3.1%), and Tucson (3.0%). Scottsdale’s population growth rate is three times the U.S. average (3.6%), and above the state and metro area growth rates (7.2% and 9.5%, respectively). This growth ranks fourth among the selected benchmark communities.
SMALL IMMIGRANT POPULATION Immigrants make up nearly 12% of Scottsdale’s population — a share that is 10% smaller than the national average. The share of immigrants is higher at both the state and metro area levels (13.5% and 14.4%, respectively).
104,035
104,730
113,670
142,242
162,511
183,652
237,484
246,026
248,631
259,041
264,310
284,579
457,502
539,216
559,202
San Mateo, CA
Hillsboro, OR
Carlsbad, CA
Bellevue, WA
Fort Collins, CO
Tempe, AZ
Gilbert, AZ
Scottsdale, AZ
Chandler, AZ
St. Petersburg, FL
Durham, NC
Plano, TX
Colorado Springs, CO
Tucson, AZ
Albuquerque, NM
Population, 2018
1.7%
3.0%
3.1%
3.6%
5.0%
5.5%
5.9%
6.7%
7.2%
7.4%
9.5%
10.1%
10.1%
10.7%
11.2%
11.5%
11.6%
12.5%
Albuquerque, NM
Tucson, AZ
Chandler, AZ
United States
St. Petersburg, FL
San Mateo, CA
Carlsbad, CA
Plano, TX
Arizona
Colorado Springs, CO
Phoenix MSA
Bellevue, WA
Gilbert, AZ
Fort Collins, CO
Scottsdale, AZ
Tempe, AZ
Hillsboro, OR
Durham, NC
Population growth, 2013-2018
0.9
0.0
0.5
1.0
1.5
2.0
2.5
3.0
Bel
levu
e, W
A
San
Mat
eo, C
A
Pla
no, T
X
Hill
sbor
o, O
R
Tem
pe,
AZ
Cha
ndle
r, A
Z
Tucs
on, A
Z
Car
lsba
d, C
A
Dur
ham
, NC
Pho
enix
MS
A
Ariz
ona
Sco
ttsd
ale,
AZ
St.
Pet
ersb
urg,
FL
Alb
uque
rque
, NM
Gilb
ert,
AZ
Col
orad
o S
prin
gs, C
O
Fort
Col
lins,
CO
Location Quotient of foreign-born population, 2018
PAGE 23
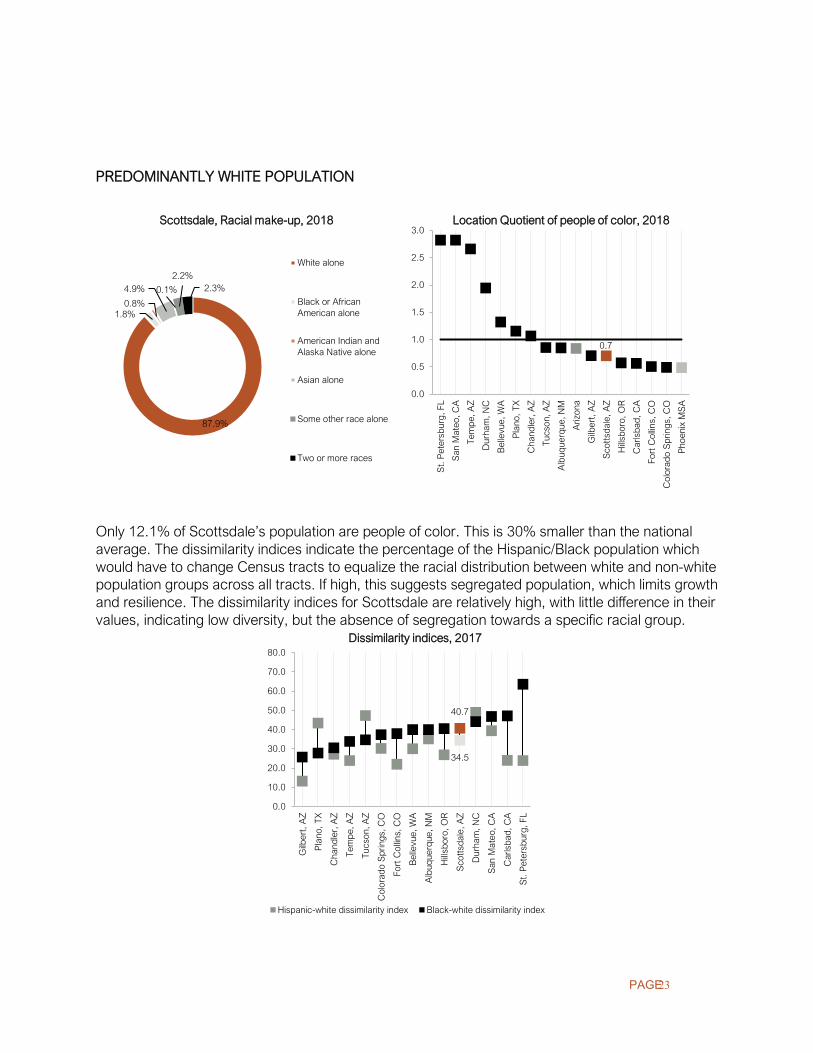
PREDOMINANTLY WHITE POPULATION
Only 12.1% of Scottsdale’s population are people of color. This is 30% smaller than the national average. The dissimilarity indices indicate the percentage of the Hispanic/Black population which would have to change Census tracts to equalize the racial distribution between white and non-white population groups across all tracts. If high, this suggests segregated population, which limits growth and resilience. The dissimilarity indices for Scottsdale are relatively high, with little difference in their values, indicating low diversity, but the absence of segregation towards a specific racial group.
34.5
40.7
0.0
10.0
20.0
30.0
40.0
50.0
60.0
70.0
80.0
Gilb
ert,
AZ
Pla
no, T
X
Cha
ndle
r, A
Z
Tem
pe,
AZ
Tucs
on, A
Z
Col
orad
o S
prin
gs, C
O
Fort
Col
lins,
CO
Bel
levu
e, W
A
Alb
uque
rque
, NM
Hill
sbor
o, O
R
Sco
ttsd
ale,
AZ
Dur
ham
, NC
San
Mat
eo, C
A
Car
lsba
d, C
A
St.
Pet
ersb
urg,
FL
Dissimilarity indices, 2017
Hispanic-white dissimilarity index Black-white dissimilarity index
0.7
0.0
0.5
1.0
1.5
2.0
2.5
3.0
St.
Pet
ersb
urg,
FL
San
Mat
eo, C
A
Tem
pe,
AZ
Dur
ham
, NC
Bel
levu
e, W
A
Pla
no, T
X
Cha
ndle
r, A
Z
Tucs
on, A
Z
Alb
uque
rque
, NM
Ariz
ona
Gilb
ert,
AZ
Sco
ttsd
ale,
AZ
Hill
sbor
o, O
R
Car
lsba
d, C
A
Fort
Col
lins,
CO
Col
orad
o S
prin
gs, C
O
Pho
enix
MS
A
Location Quotient of people of color, 2018
87.9%
1.8%0.8%
4.9% 0.1%
2.2%2.3%
Scottsdale, Racial make-up, 2018
White alone
Black or AfricanAmerican alone
American Indian andAlaska Native alone
Asian alone
Some other race alone
Two or more races

PAGE 24
PEOPLE AND DIVERSITY
Compared to its peer cities, Scottsdale’s talent metrics generally rank among the higher tier and significantly above both the national and state averages. The following are key takeaways about Scottsdale’s various talent metrics: EDUCATED POPULATION The vast majority of Scottsdale is educated, with 57.2% with a Bachelor’s degree or higher, ranking third among the benchmarks and significantly above the national average (26.4%).
Scottsdale ranks first for its share of population with less than a high school diploma (3.5%). The national average is more than three times that share (12.3%).
1.8
0.0
0.5
1.0
1.5
2.0
Bel
levu
e, W
A
Car
lsba
d, C
A
Sco
ttsd
ale,
AZ
Pla
no, T
X
Fort
Col
lins,
CO
San
Mat
eo, C
A
Dur
ham
, NC
Tem
pe,
AZ
Cha
ndle
r, A
Z
Gilb
ert,
AZ
Hill
sbor
o, O
R
Col
orad
o S
prin
gs, C
O
Alb
uque
rque
, NM
St.
Pet
ersb
urg,
FL
Pho
enix
MS
A
Ariz
ona
Tucs
on, A
Z
Location Quotient of population with a Bachelor's degree or above, 2018
3.5%12.6%
26.8%
34.8%
22.4%
Scottsdale, Educational attainment, 2018
Less than high schoolgraduate
High school graduate(includesequivalency)
Some college orassociate's degree
Bachelor's degree
Graduate orprofessional degree
15.1%
13.2%
12.8%
12.3%
12.1%
10.3%
10.3%
10.1%
9.0%
7.5%
7.2%
6.7%
6.6%
4.8%
4.6%
4.0%
3.5%
3.5%
Tucson, AZ
Arizona
Phoenix MSA
United States
Durham, NC
Albuquerque, NM
Hillsboro, OR
San Mateo, CA
St. Petersburg, FL
Tempe, AZ
Chandler, AZ
Colorado Springs, CO
Plano, TX
Carlsbad, CA
Bellevue, WA
Gilbert, AZ
Fort Collins, CO
Scottsdale, AZ
Share of the population with less than a high school diploma, 2018

PAGE 25
ATTRACTIVE CITY FOR EDUCATED MIGRANTS The share of educated migrants (outside of Maricopa county) who have a Bachelor’s degree or above is 14.4% in Scottsdale. This share is higher than the national average at 13.2%. Scottsdale is an attractive city for educated out-of-state movers, where 11.7% of the population have moved from other states. The U.S. average for out-of-state migrants at this level of education is 5.9%. Scottsdale ranks 4th for different state migration. Foreign educated migrants constitute 1.9% of Scottsdale’s population, this is only slightly below the national average at 2%.
THE CREATIVE CLASS Five in 10 Scottsdale residents are part of the creative class, this is 40% greater than the national average.
1.4
0.0
0.2
0.4
0.6
0.8
1.0
1.2
1.4
1.6
1.8
2.0
Bel
levu
e, W
A
Pla
no, T
X
Car
lsba
d, C
A
Sco
ttsd
ale,
AZ
San
Mat
eo, C
A
Dur
ham
, NC
Gilb
ert,
AZ
Cha
ndle
r, A
Z
Fort
Col
lins,
CO
Hill
sbor
o, O
R
Tem
pe,
AZ
Alb
uque
rque
, NM
Col
orad
o S
prin
gs, C
O
St.
Pet
ersb
urg,
FL
Pho
enix
MS
A
Ariz
ona
Tucs
on, A
Z
Location Quotient of employment in creative class occupations, 2018
1.1
0.0
0.2
0.4
0.6
0.8
1.0
1.2
1.4
1.6
1.8
2.0
2.2
Hill
sbor
o, O
R
Dur
ham
, NC
San
Mat
eo, C
A
Bel
levu
e, W
A
Col
orad
o S
prin
gs, C
O
St.
Pet
ersb
urg,
FL
Cha
ndle
r, A
Z
Fort
Col
lins,
CO
Pla
no, T
X
Tucs
on, A
Z
Sco
ttsd
ale,
AZ
Ariz
ona
Pho
enix
MS
A
Tem
pe,
AZ
Car
lsba
d, C
A
Alb
uque
rque
, NM
Gilb
ert,
AZ
Location Quotient of migrants with a Bachelor's degree or above, 2018

PAGE 26
ECONOMIC VITALITY
Research has found that it is the factors of talent and skills that drive long-run growth and prosperity. There are three broad sets of skills that drive today’s economy: knowledge, service, and working sector. For Scottsdale, a competitive advantage lies in the city’s creative class and its knowledge-based sector. A detailed analysis is presented below: LOW LABOR FORCE PARTICIPATION RATE Approximately 127,000 individuals comprise Scottsdale’s labor force. That’s a participation rate of 62.3%, below the national average (63.3%), and ranking 14th among peer cities.
HIGH MEDIAN EARNINGS Scottsdale ranks fifth for median earnings, at slightly below $50,000. This is $16,000 more than the national median earnings and $18,000 more than the state median earnings. In the last 5 years, median earnings grew by 16%, ranking the city eighth in terms of growth. This is higher than both the growth rate at the national and state level (9.5 and 6.6%, respectively).
59.5%
61.6%
62.3%
62.5%
62.9%
63.3%
63.9%
65.5%
66.6%
67.1%
69.0%
69.4%
69.9%
70.1%
70.7%
70.8%
71.1%
71.8%
Arizona
Tucson, AZ
Scottsdale, AZ
Phoenix MSA
St. Petersburg, FL
United States
Albuquerque, NM
Carlsbad, CA
Bellevue, WA
Colorado Springs, CO
Tempe, AZ
Durham, NC
Plano, TX
Fort Collins, CO
Gilbert, AZ
Hillsboro, OR
San Mateo, CA
Chandler, AZ
Labor force participation rate, 2018
$49,876
16.0%
0%
5%
10%
15%
20%
25%
30%
35%
$0
$10,000
$20,000
$30,000
$40,000
$50,000
$60,000
$70,000
$80,000
San
Mat
eo, C
AB
elle
vue,
WA
Hill
sbor
o, O
RFo
rt C
ollin
s, C
OC
arls
bad,
CA
Tem
pe,
AZ
Dur
ham
, NC
Sco
ttsd
ale,
AZ
Pla
no, T
XC
hand
ler,
AZ
Uni
ted
Sta
tes
Tucs
on, A
ZS
t. P
eter
sbur
g, F
LC
olor
ado
Spr
ings
, CO
Ariz
ona
Pho
enix
MS
AG
ilber
t, A
ZA
lbuq
uerq
ue, N
M
Median earnings, 2018
Median earnings Growth in median earnings (2013-2018)

PAGE 27
“KNOWLEDGE-BASED” BUSINESSES Scottsdale’s share of “knowledge-based” businesses outpaces Arizona.
EMPLOYMENT IN THE INFORMATION SECTOR The information sector in Scottsdale employs 2.5% of the population. Boasting an LQ (specialization) of 1.2, the sector has experienced expansion since 2013 (9.2%), now employing more than 3,000 employees. On the national level, the information sector employs 2.1% and has experienced 3.5% growth in the last five years. Scottsdale ranks seventh for share of employment in the information sector, and 11th for growth rate in that sector.
27.9%
14.9%
7.9%
1.6%
20.4%
11.0%9.7%
1.4%
0%
5%
10%
15%
20%
25%
30%
Professionalservices
Finance andinsurance, andreal estate, and
rental andleasing
Arts,entertainment,and recreation,
andaccomodation
and foodservices
Information
Share of "knowledge-based" establishments
Scottsdale city Arizona
2.5%
9.2%
-20%
-10%
0%
10%
20%
30%
40%
50%
60%
70%
80%
90%
0%
1%
2%
3%
4%
5%
6%
7%
San
Mat
eo, C
A
Bel
levu
e, W
A
Car
lsba
d, C
A
Cha
ndle
r, A
Z
Hill
sbor
o, O
R
Tem
pe,
AZ
Dur
ham
, NC
Pla
no, T
X
Pho
enix
MS
A
Gilb
ert,
AZ
Ariz
ona
Col
orad
o S
prin
gs, C
O
Sco
ttsd
ale,
AZ
Fort
Col
lins,
CO
Uni
ted
Sta
tes
Tucs
on, A
Z
Alb
uque
rque
, NM
St.
Pet
ersb
urg,
FL
Employment in information, 2018
Share of employment in InformationEmployment growth in Information (2013-2018)
1.2
0.0
0.5
1.0
1.5
2.0
2.5
3.0
Bel
levu
e, W
A
San
Mat
eo, C
A
Pla
no, T
X
Col
orad
o S
prin
gs, C
O
Car
lsba
d, C
A
Tem
pe,
AZ
Sco
ttsd
ale,
AZ
Cha
ndle
r, A
Z
Hill
sbor
o, O
R
Gilb
ert,
AZ
Dur
ham
, NC
Alb
uque
rque
, NM
Pho
enix
MS
A
Fort
Col
lins,
CO
St.
Pet
ersb
urg,
FL
Ariz
ona
Tucs
on, A
Z
Location Quotient of employment in information, 2018
PAGE 28
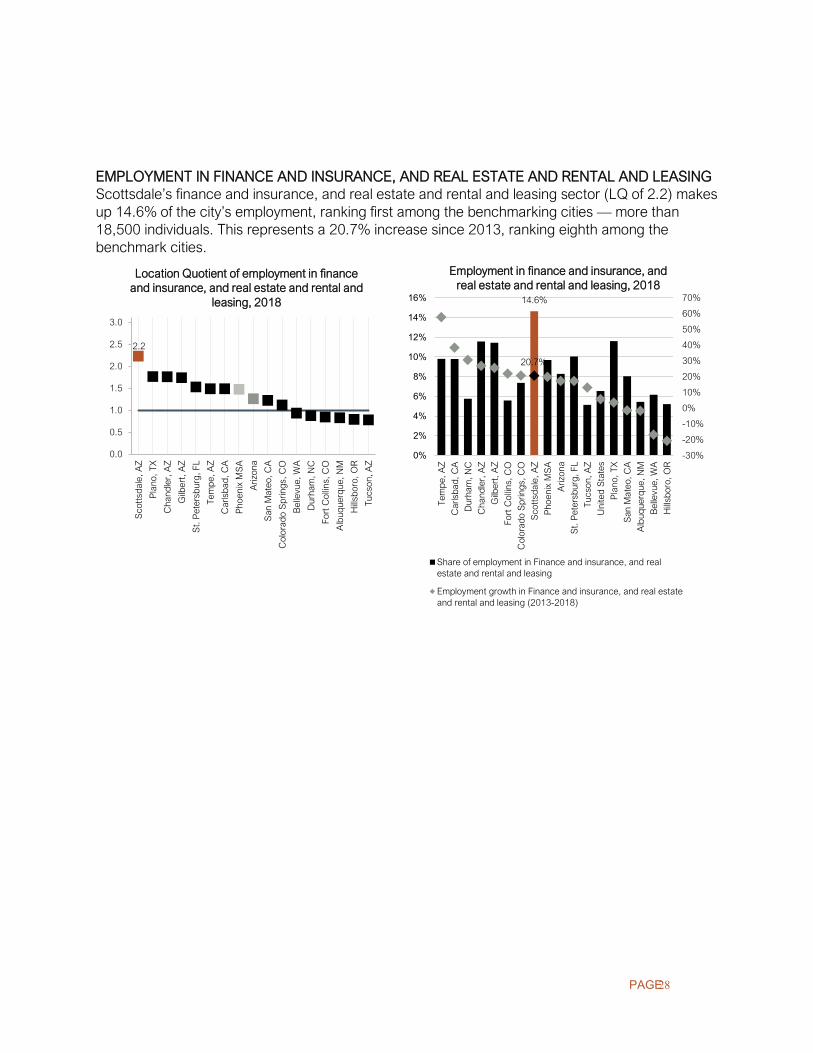
EMPLOYMENT IN FINANCE AND INSURANCE, AND REAL ESTATE AND RENTAL AND LEASING Scottsdale’s finance and insurance, and real estate and rental and leasing sector (LQ of 2.2) makes up 14.6% of the city’s employment, ranking first among the benchmarking cities — more than 18,500 individuals. This represents a 20.7% increase since 2013, ranking eighth among the benchmark cities.
2.2
0.0
0.5
1.0
1.5
2.0
2.5
3.0
Sco
ttsd
ale,
AZ
Pla
no, T
X
Cha
ndle
r, A
Z
Gilb
ert,
AZ
St.
Pet
ersb
urg,
FL
Tem
pe,
AZ
Car
lsba
d, C
A
Pho
enix
MS
A
Ariz
ona
San
Mat
eo, C
A
Col
orad
o S
prin
gs, C
O
Bel
levu
e, W
A
Dur
ham
, NC
Fort
Col
lins,
CO
Alb
uque
rque
, NM
Hill
sbor
o, O
R
Tucs
on, A
Z
Location Quotient of employment in finance and insurance, and real estate and rental and
leasing, 2018 14.6%
20.7%
-30%
-20%
-10%
0%
10%
20%
30%
40%
50%
60%
70%
0%
2%
4%
6%
8%
10%
12%
14%
16%
Tem
pe,
AZ
Car
lsba
d, C
A
Dur
ham
, NC
Cha
ndle
r, A
Z
Gilb
ert,
AZ
Fort
Col
lins,
CO
Col
orad
o S
prin
gs, C
O
Sco
ttsd
ale,
AZ
Pho
enix
MS
A
Ariz
ona
St.
Pet
ersb
urg,
FL
Tucs
on, A
Z
Uni
ted
Sta
tes
Pla
no, T
X
San
Mat
eo, C
A
Alb
uque
rque
, NM
Bel
levu
e, W
A
Hill
sbor
o, O
R
Employment in finance and insurance, and real estate and rental and leasing, 2018
Share of employment in Finance and insurance, and realestate and rental and leasing
Employment growth in Finance and insurance, and real estateand rental and leasing (2013-2018)

PAGE 29
EMPLOYMENT IN PROFESSIONAL SERVICES Scottsdale’s professional services sector has increased significantly (28.6%) since 2013, employing 21,850 in 2018 (17.2% of the workforce). The city boasts an LQ of 1.5, ranking fifth for share of employment, and first for rate of growth, among the benchmarking cities.
17.2%
28.6%
0%
5%
10%
15%
20%
25%
30%
35%
0%
5%
10%
15%
20%
25%
30%
35%
Sco
ttsd
ale,
AZ
Bel
levu
e, W
A
St.
Pet
ersb
urg,
FL
Tucs
on, A
Z
San
Mat
eo, C
A
Pho
enix
MS
A
Pla
no, T
X
Ariz
ona
Cha
ndle
r, A
Z
Col
orad
o S
prin
gs, C
O
Gilb
ert,
AZ
Tem
pe,
AZ
Hill
sbor
o, O
R
Dur
ham
, NC
Uni
ted
Sta
tes
Fort
Col
lins,
CO
Alb
uque
rque
, NM
Car
lsba
d, C
A
Employment in professional services, 2018
Share of employment in Professional services
Employment growth in Professional services (2013-2018)
1.5
0.0
0.5
1.0
1.5
2.0
2.5
Bel
levu
e, W
A
San
Mat
eo, C
A
Pla
no, T
X
Car
lsba
d, C
A
Sco
ttsd
ale,
AZ
Alb
uque
rque
, NM
Dur
ham
, NC
Tem
pe,
AZ
Col
orad
o S
prin
gs, C
O
St.
Pet
ersb
urg,
FL
Cha
ndle
r, A
Z
Tucs
on, A
Z
Pho
enix
MS
A
Fort
Col
lins,
CO
Hill
sbor
o, O
R
Ariz
ona
Gilb
ert,
AZ
Location Quotient of employment in professional services, 2018

PAGE 30
EMPLOYMENT IN ARTS, ENTERTAINMENT, & RECREATION, & ACCOMMODATION & FOOD SERVICES Boasting an LQ (specialization) of 1.2, arts, entertainment, recreation, and accommodation and food services in Scottsdale has experienced an 8.7% expansion since 2013, now employing around 15,000. This growth is lower than the national average at 11.6%. In terms of specialization, Scottsdale ranks fifth among the benchmarking cities, and tenth for rate of growth.
1.2
0.0
0.2
0.4
0.6
0.8
1.0
1.2
1.4
1.6
Tem
pe,
AZ
Tucs
on, A
Z
Fort
Col
lins,
CO
Alb
uque
rque
, NM
Sco
ttsd
ale,
AZ
Col
orad
o S
prin
gs, C
O
Ariz
ona
St.
Pet
ersb
urg,
FL
Car
lsba
d, C
A
Pho
enix
MS
A
Dur
ham
, NC
San
Mat
eo, C
A
Cha
ndle
r, A
Z
Pla
no, T
X
Bel
levu
e, W
A
Gilb
ert,
AZ
Hill
sbor
o, O
R
Location Quotient of employment in arts, entertainment, recreation, and
accommodation and food services, 2018
11.4%
8.2%
-10%
0%
10%
20%
30%
40%
50%
0%
2%
4%
6%
8%
10%
12%
14%
16%
Dur
ham
, NC
Car
lsba
d, C
A
Hill
sbor
o, O
R
Pla
no, T
X
Pho
enix
MS
A
Ariz
ona
Bel
levu
e, W
A
Tem
pe,
AZ
Tucs
on, A
Z
Uni
ted
Sta
tes
Col
orad
o S
prin
gs, C
O
Cha
ndle
r, A
Z
Sco
ttsd
ale,
AZ
St.
Pet
ersb
urg,
FL
Alb
uque
rque
, NM
Fort
Col
lins,
CO
Gilb
ert,
AZ
San
Mat
eo, C
A
Employment in arts, entertainment, recreation, and accommodation and food
services, 2018
Share of employment in Arts, entertainment, and recreation, andaccommodation and food services
Employment growth in Arts, entertainment, and recreation, andaccommodation and food services (2013-2018)

PAGE 31
INNOVATION
Scottsdale is an emerging center for technology development and is increasingly a location of choice for companies looking for national expansion. Its environment combines successful entrepreneurs, a highly talented workforce and a burgeoning high-tech industry sector. A detailed analysis is presented below:
PROFESSIONAL SERVICE FIRMS Scottsdale is home to 4,664 professional service firms; this is almost 1,900 firms per 100,000 residents. The city ranks second. However, only 3% of total revenues come from establishments in that category; the city ranks tenth among benchmark cities for this metric.
1.6%
1.9%
2.1%
2.2%
2.6%
2.7%
2.7%
2.9%
3.0%
3.0%
3.3%
3.4%
3.9%
4.3%
4.7%
5.6%
5.9%
6.9%
Chandler, AZ
Hillsboro, OR
Arizona
Phoenix MSA
Tucson, AZ
United States
Tempe, AZ
Albuquerque, NM
Scottsdale, AZ
St. Petersburg, FL
San Mateo, CA
Bellevue, WA
Gilbert, AZ
Fort Collins, CO
Carlsbad, CA
Colorado Springs, CO
Plano, TX
Durham, NC
Shares of revenues from establishments in professional services, 2018
0
243
292
401
458
521
552
555
566
580
581
615
622
644
958
1,013
1,896
1,914
Albuquerque, NM
Hillsboro, OR
Tucson, AZ
Durham, NC
Colorado Springs, CO
Arizona
Tempe, AZ
San Mateo, CA
United States
Fort Collins, CO
Phoenix MSA
Plano, TX
Gilbert, AZ
Chandler, AZ
Carlsbad, CA
St. Petersburg, FL
Scottsdale, AZ
Bellevue, WA
Number of establishments in professional services per 100,000 residents, 2018

PAGE 32
Scottsdale employs 21,850 in professional services, that is 17.2% of the workforce. Foreign-born individuals constitute 17.8% of workforce in professional services. This is above the national average at 13.2%, ranking the city sixth.
YOUNG TALENT US News ranks the best STEM high schools on a national level. BASIS Scottsdale ranks 49th on this ranking, rendering the city third place among the benchmarking cities after Chandler and Tucson.
11.5%
11.8%
12.6%
12.9%
13.2%
14.3%
14.5%
14.9%
16.2%
17.0%
17.0%
17.2%
17.8%
17.8%
22.5%
22.7%
23.9%
38.0%
Gilbert, AZ
St. Petersburg, FL
Hillsboro, OR
Albuquerque, NM
United States
Colorado Springs, CO
Tucson, AZ
Arizona
Phoenix MSA
Chandler, AZ
Tempe, AZ
Fort Collins, CO
Scottsdale, AZ
Durham, NC
Carlsbad, CA
San Mateo, CA
Plano, TX
Bellevue, WA
Share of foreign-born employees in professional services, 2018
11.4%
12.2%
12.3%
12.3%
13.0%
13.0%
13.2%
13.2%
13.9%
13.9%
13.9%
14.2%
15.2%
17.2%
18.7%
19.8%
20.9%
29.8%
United States
Gilbert, AZ
Arizona
Hillsboro, OR
Fort Collins, CO
Phoenix MSA
Tucson, AZ
Chandler, AZ
St. Petersburg, FL
Colorado Springs, CO
Tempe, AZ
Durham, NC
Albuquerque, NM
Scottsdale, AZ
Carlsbad, CA
Plano, TX
San Mateo, CA
Bellevue, WA
Share of employment in professional services, 2018
967, Fossil Ridge High school
177, Newport Senior HIgh School
49, BASIS Scottsdale
48, BASIS Tucson North
7, BASIS Chandler
Gilbert, AZ
Tempe, AZ
Carlsbad, CA
San Mateo, CA
Colorado Springs, CO
St. Petersburg, FL
Albuquerque, NM
Durham, NC
Hillsboro, OR
Plano, TX
Fort Collins, CO
Bellevue, WA
Scottsdale, AZ
Tucson, AZ
Chandler, AZ
National rankings of best STEM high school, 2020

PAGE 33
VENTURE CAPITAL Scottsdale attracted $295 million in venture capital in 2019, ranking 4th among peers and on par with Durham. The city ranks third for venture deals, with 57 deals.
1
3
10
11
11
14
17
22
24
26
27
47
57
65
106
1.6
1.4
0.9
0.2
1.5
0.7
2.6
3.7
1.8
0.5
1.0
3.0
2.0
1.5
5.5
St. Petersburg, FL
Gilbert, AZ
Colorado Springs, CO
Chandler, AZ
Hillsboro, OR
Fort Collins, CO
Tempe, AZ
Carlsbad, CA
Plano, TX
Tucson, AZ
Albuquerque, NM
Bellevue, WA
Scottsdale, AZ
Durham, NC
San Mateo, CA
Venture capital deals, 2020
Median Venture Capital Deal Size Venture Capital Deals
$1.6M
$11.1M
$29.7M
$32.3M
$43.1M
$51.4M
$73.0M
$84.6M
$87.9M
$140.9M
$271.0M
$294.7M
$312.0M
$440.0M
$1,640.0M
St. Petersburg, FL
Gilbert, AZ
Fort Collins, CO
Tucson, AZ
Tempe, AZ
Hillsboro, OR
Albuquerque, NM
Colorado Springs, CO
Chandler, AZ
Plano, TX
Carlsbad, CA
Scottsdale, AZ
Durham, NC
Bellevue, WA
San Mateo, CA
Venture capital, 2020

PAGE 34
EQUITY
Equity evaluates who benefits from growth within a city. Research has found that greater economic equity enables more people to engage at a higher level and add value in ways that help the economy perform better overall. A closer look at equity in Scottsdale is presented in the analysis below:
STRONG MEDIAN HOUSEHOLD AND PER CAPITA INCOMES At $84,601, Scottsdale’s median household income is 40% higher than the national average ($60,293) and ranks sixth among the benchmark cities. On a per capita level, income is even stronger at $59,953, which is 84% higher than the national average, and ranks second among the benchmark cities.
$22,645
$29,210
$29,265
$29,786
$30,975
$32,440
$32,539
$32,621
$32,932
$33,356
$34,268
$35,710
$37,567
$46,394
$55,518
$58,922
$59,953
$63,115
Tucson, AZ
Albuquerque, NM
Arizona
Tempe, AZ
Phoenix MSA
Fort Collins, CO
Colorado Springs, CO
United States
Durham, NC
St. Petersburg, FL
Hillsboro, OR
Gilbert, AZ
Chandler, AZ
Plano, TX
Carlsbad, CA
San Mateo, CA
Scottsdale, AZ
Bellevue, WA
Per capita income, 2018
$41,625
$51,128
$53,816
$54,210
$55,851
$56,213
$60,293
$60,996
$61,324
$62,132
$78,144
$80,716
$84,601
$92,121
$92,350
$107,172
$112,283
$115,167
Tucson, AZ
Albuquerque, NM
St. Petersburg, FL
Tempe, AZ
Durham, NC
Arizona
United States
Phoenix MSA
Colorado Springs, CO
Fort Collins, CO
Hillsboro, OR
Chandler, AZ
Scottsdale, AZ
Plano, TX
Gilbert, AZ
Carlsbad, CA
Bellevue, WA
San Mateo, CA
Median household income, 2018

PAGE 35
LOW INCOME RESIDENTS Approximately 5% of Scottsdale’s families are below the poverty line, ranking sixth among the benchmarks and below the national average (10.1%).
STRONG HOMEOWNERSHIP Scottsdale boasts a high rate of home ownership at 65.9%, ranking second among the benchmarking cities.
17.2%
13.1%
12.7%
11.6%
11.1%
10.6%
10.1%
10.0%
9.0%
7.0%
6.4%
6.1%
5.0%
5.0%
4.6%
4.2%
4.1%
3.7%
Tucson, AZ
Albuquerque, NM
Durham, NC
Arizona
Tempe, AZ
Phoenix MSA
United States
St. Petersburg, FL
Colorado Springs, CO
Hillsboro, OR
Fort Collins, CO
Chandler, AZ
Scottsdale, AZ
Plano, TX
Bellevue, WA
Gilbert, AZ
San Mateo, CA
Carlsbad, CA
Share of families below the poverty line, 2018
40.1%
49.5%
50.0%
52.7%
53.1%
55.2%
56.0%
58.8%
59.1%
59.6%
60.3%
62.4%
62.9%
63.6%
63.8%
64.4%
65.9%
72.7%
Tempe, AZ
Durham, NC
Tucson, AZ
Hillsboro, OR
Fort Collins, CO
San Mateo, CA
Bellevue, WA
St. Petersburg, FL
Colorado Springs, CO
Albuquerque, NM
Plano, TX
Phoenix MSA
Chandler, AZ
Arizona
United States
Carlsbad, CA
Scottsdale, AZ
Gilbert, AZ
Home ownership rate, 2018

PAGE 36
HOUSING BURDEN 24.5% of homeowners and 37.5% of renters in Scottsdale spend more than 30% of monthly income on housing costs. The rate for homeowners is among the highest, where Scottsdale ranks 11th and is above the national average (23.1%). However, for renters, Scottsdale ranks 3rd among the benchmarking cities, where the national average is at 46.5%.
24.5%
37.5%
0%
10%
20%
30%
40%
50%
60%
Bel
levu
e, W
A
Pla
no, T
X
Sco
ttsd
ale,
AZ
Cha
ndle
r, A
Z
Gilb
ert,
AZ
Hill
sbor
o, O
R
Pho
enix
MS
A
Ariz
ona
Tem
pe,
AZ
Dur
ham
, NC
Car
lsba
d, C
A
Uni
ted
Sta
tes
St.
Pet
ersb
urg,
FL
San
Mat
eo, C
A
Alb
uque
rque
, NM
Col
orad
o S
prin
gs, C
O
Tucs
on, A
Z
Fort
Col
lins,
CO
Share of home and rent burdened households, 2018
Percentage of home-burdened households
Percentage of rent-burdened households
PAGE 37
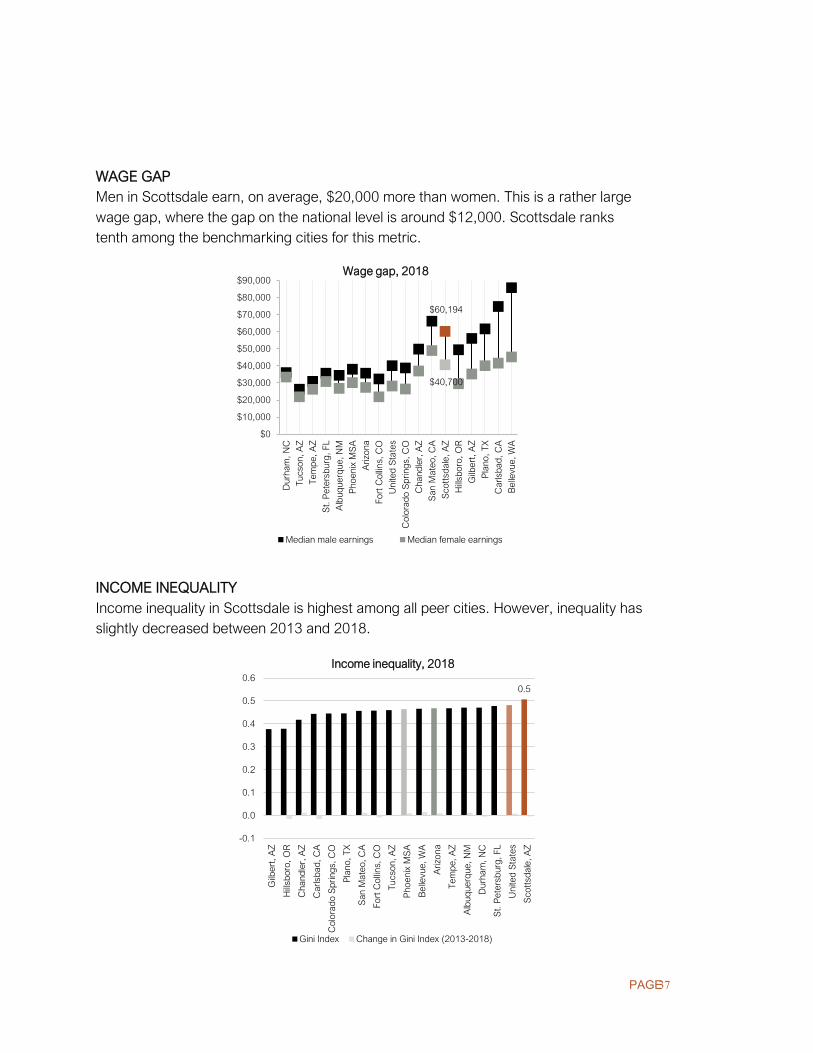
WAGE GAP Men in Scottsdale earn, on average, $20,000 more than women. This is a rather large wage gap, where the gap on the national level is around $12,000. Scottsdale ranks tenth among the benchmarking cities for this metric.
INCOME INEQUALITY Income inequality in Scottsdale is highest among all peer cities. However, inequality has slightly decreased between 2013 and 2018.
0.5
-0.1
0.0
0.1
0.2
0.3
0.4
0.5
0.6
Gilb
ert,
AZ
Hill
sbor
o, O
R
Cha
ndle
r, A
Z
Car
lsba
d, C
A
Col
orad
o S
prin
gs, C
O
Pla
no, T
X
San
Mat
eo, C
A
Fort
Col
lins,
CO
Tucs
on, A
Z
Pho
enix
MS
A
Bel
levu
e, W
A
Ariz
ona
Tem
pe,
AZ
Alb
uque
rque
, NM
Dur
ham
, NC
St.
Pet
ersb
urg,
FL
Uni
ted
Sta
tes
Sco
ttsd
ale,
AZ
Income inequality, 2018
Gini Index Change in Gini Index (2013-2018)
$60,194
$40,700
$0
$10,000
$20,000
$30,000
$40,000
$50,000
$60,000
$70,000
$80,000
$90,000D
urha
m, N
C
Tucs
on, A
Z
Tem
pe,
AZ
St.
Pet
ersb
urg,
FL
Alb
uque
rque
, NM
Pho
enix
MS
A
Ariz
ona
Fort
Col
lins,
CO
Uni
ted
Sta
tes
Col
orad
o S
prin
gs, C
O
Cha
ndle
r, A
Z
San
Mat
eo, C
A
Sco
ttsd
ale,
AZ
Hill
sbor
o, O
R
Gilb
ert,
AZ
Pla
no, T
X
Car
lsba
d, C
A
Bel
levu
e, W
A
Wage gap, 2018
Median male earnings Median female earnings

PAGE 38
QUALITY OF PLACE
Quality of place is an indicator of the quality and type of existing workforce in a city, which is an important factor for business retention and growth. It is also a promising foundation for an economic development strategy. Scottsdale has a competitive advantage when it comes to quality of place, as shown by the analysis below:
COMMUTING Eight of out of 10 Scottsdale residents drive to work. Less than 3% bike, walk, or take public transit. However, the mean travel time to work is less than 23 minutes, ranking Scottsdale fourth among the benchmarking cities.
0.9%
1.6%
0%
2%
4%
6%
8%
10%
12%
14%
Gilb
ert,
AZ
Pla
no, T
X
Cha
ndle
r, A
Z
Car
lsba
d, C
A
Pho
enix
MS
A
Sco
ttsd
ale,
AZ
Alb
uque
rque
, NM
St.
Pet
ersb
urg,
FL
Ariz
ona
Col
orad
o S
prin
gs, C
O
San
Mat
eo, C
A
Hill
sbor
o, O
R
Dur
ham
, NC
Uni
ted
Sta
tes
Tucs
on, A
Z
Fort
Col
lins,
CO
Tem
pe,
AZ
Bel
levu
e, W
A
Means of transportation to work, 2018
Public transit Bike Walk
30.0
29.3
28.6
28.1
27.7
27.3
26.4
24.6
24.4
24.1
24.0
23.9
23.7
23.1
22.6
22.5
21.6
21.2
Carlsbad, CA
Gilbert, AZ
San Mateo, CA
United States
Plano, TX
Phoenix MSA
Arizona
Chandler, AZ
Bellevue, WA
St. Petersburg, FL
Hillsboro, OR
Durham, NC
Colorado Springs, CO
Tucson, AZ
Scottsdale, AZ
Albuquerque, NM
Fort Collins, CO
Tempe, AZ
Mean travel time to work, 2018
PAGE 39
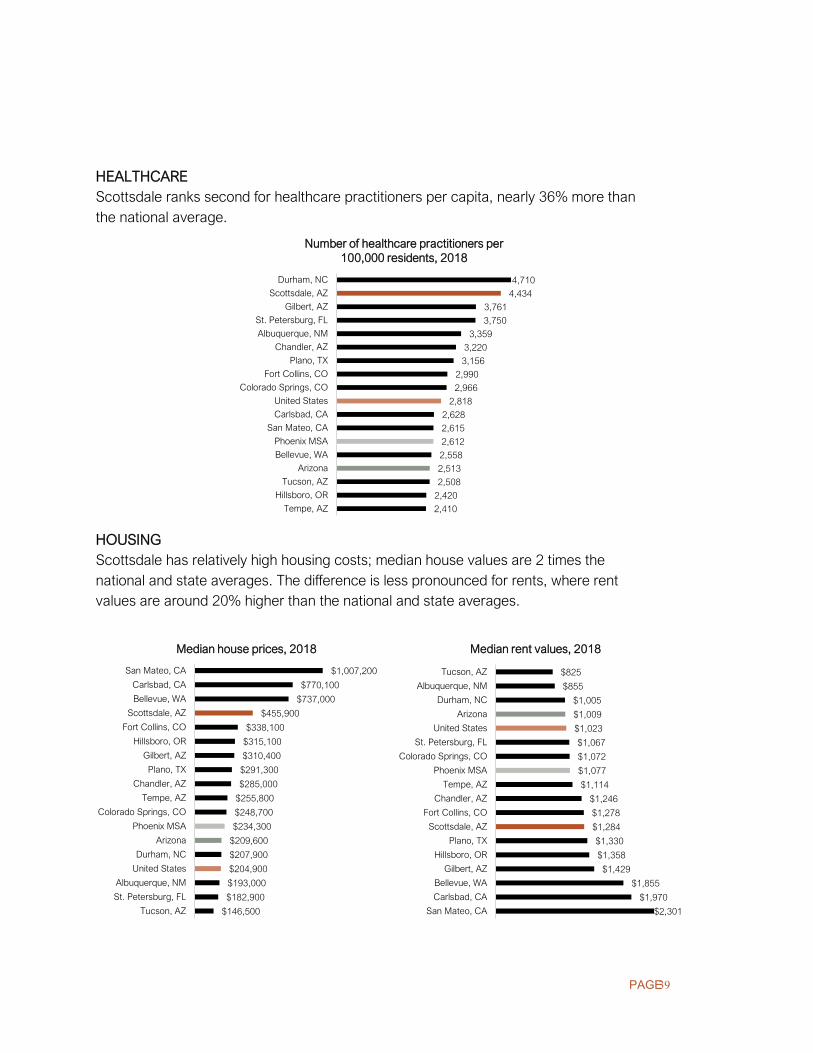
HEALTHCARE Scottsdale ranks second for healthcare practitioners per capita, nearly 36% more than the national average.
HOUSING Scottsdale has relatively high housing costs; median house values are 2 times the national and state averages. The difference is less pronounced for rents, where rent values are around 20% higher than the national and state averages.
2,410
2,420
2,508
2,513
2,558
2,612
2,615
2,628
2,818
2,966
2,990
3,156
3,220
3,359
3,750
3,761
4,434
4,710
Tempe, AZ
Hillsboro, OR
Tucson, AZ
Arizona
Bellevue, WA
Phoenix MSA
San Mateo, CA
Carlsbad, CA
United States
Colorado Springs, CO
Fort Collins, CO
Plano, TX
Chandler, AZ
Albuquerque, NM
St. Petersburg, FL
Gilbert, AZ
Scottsdale, AZ
Durham, NC
Number of healthcare practitioners per 100,000 residents, 2018
$146,500
$182,900
$193,000
$204,900
$207,900
$209,600
$234,300
$248,700
$255,800
$285,000
$291,300
$310,400
$315,100
$338,100
$455,900
$737,000
$770,100
$1,007,200
Tucson, AZ
St. Petersburg, FL
Albuquerque, NM
United States
Durham, NC
Arizona
Phoenix MSA
Colorado Springs, CO
Tempe, AZ
Chandler, AZ
Plano, TX
Gilbert, AZ
Hillsboro, OR
Fort Collins, CO
Scottsdale, AZ
Bellevue, WA
Carlsbad, CA
San Mateo, CA
Median house prices, 2018
$2,301
$1,970
$1,855
$1,429
$1,358
$1,330
$1,284
$1,278
$1,246
$1,114
$1,077
$1,072
$1,067
$1,023
$1,009
$1,005
$855
$825
San Mateo, CA
Carlsbad, CA
Bellevue, WA
Gilbert, AZ
Hillsboro, OR
Plano, TX
Scottsdale, AZ
Fort Collins, CO
Chandler, AZ
Tempe, AZ
Phoenix MSA
Colorado Springs, CO
St. Petersburg, FL
United States
Arizona
Durham, NC
Albuquerque, NM
Tucson, AZ
Median rent values, 2018

PAGE 40
HOME VALUE TO HOUSEHOLD INCOME RATIO The home value to household income ratio in Scottsdale is relatively high but on par with other western cities.
8.7
7.2
6.6
5.4
5.4
4.7
4.1
4.0
3.8
3.8
3.7
3.7
3.5
3.5
3.4
3.4
3.4
3.2
San Mateo, CA
Carlsbad, CA
Bellevue, WA
Fort Collins, CO
Scottsdale, AZ
Tempe, AZ
Colorado Springs, CO
Hillsboro, OR
Phoenix MSA
Albuquerque, NM
Arizona
Durham, NC
Chandler, AZ
Tucson, AZ
St. Petersburg, FL
United States
Gilbert, AZ
Plano, TX
Home value to housheold income ratio, 2018

PAGE 41
VIBRANCY Scottsdale is a vibrant city, known for its high-end boutiques and restaurants, and luxurious amenities. The city ranks first for shopping and culinary experiences, and second for nightlife and theatres among the benchmarks.
3
4
4
6
6
6
7
7
7
8
11
13
14
24
25
Gilbert, AZ
Plano, TX
Bellevue, WA
Hillsboro, OR
Carlsbad, CA
Albuquerque, NM
San Mateo, CA
Chandler, AZ
Durham, NC
Colorado Springs, CO
Tempe, AZ
Fort Collins, CO
Tucson, AZ
Scottsdale, AZ
St. Petersburg, FL
Number of nightlife experiences per 100,000 residents
0
0
1
1
2
2
2
4
4
5
5
5
6
6
7
San Mateo, CA
Gilbert, AZ
Bellevue, WA
Plano, TX
Durham, NC
Carlsbad, CA
Chandler, AZ
St. Petersburg, FL
Tempe, AZ
Hillsboro, OR
Albuquerque, NM
Colorado Springs, CO
Fort Collins, CO
Scottsdale, AZ
Tucson, AZ
Number of theatres and concerts per 100,000 residents
4
4
4
5
8
9
10
11
13
20
22
22
23
28
36
Plano, TX
Gilbert, AZ
Chandler, AZ
San Mateo, CA
Bellevue, WA
Durham, NC
Tempe, AZ
Hillsboro, OR
Colorado Springs, CO
Fort Collins, CO
Carlsbad, CA
St. Petersburg, FL
Albuquerque, NM
Tucson, AZ
Scottsdale, AZ
Number of shopping experiences per 100,000 residents
181
239
245
247
251
268
270
272
300
303
339
384
388
424
425
Gilbert, AZ
Durham, NC
Carlsbad, CA
Chandler, AZ
Fort Collins, CO
St. Petersburg, FL
Albuquerque, NM
Colorado Springs, CO
Plano, TX
Tucson, AZ
Bellevue, WA
San Mateo, CA
Tempe, AZ
Hillsboro, OR
Scottsdale, AZ
Number of restaurants per 100,000 residents

PAGE 42
PROMOTION Scottsdale is a well promoted city, ranking fourth for Google Trends and search results, and Facebook check-ins, fifth for Instagram hashtags, and second for TripAdvisor reviews.
1.9M
9.1M
11.4M
13.1M
13.9M
15.8M
16.5M
17.6M
19.2M
27.5M
29.5M
31.1M
34.5M
34.6M
42.9M
Hillsboro, OR
San Mateo, CA
Gilbert, AZ
St. Petersburg, FL
Fort Collins, CO
Carlsbad, CA
Chandler, AZ
Tempe, AZ
Bellevue, WA
Plano, TX
Colorado Springs, CO
Scottsdale, AZ
Durham, NC
Albuquerque, NM
Tucson, AZ
Google search results, 2020
4
6
7
7
9
10
10
12
14
14
16
20
29
31
46
Hillsboro, OR
San Mateo, CA
Gilbert, AZ
Carlsbad, CA
Chandler, AZ
Tempe, AZ
Bellevue, WA
Fort Collins, CO
St. Petersburg, FL
Durham, NC
Plano, TX
Scottsdale, AZ
Colorado Springs, CO
Albuquerque, NM
Tucson, AZ
Google Trends, 2020
374,254
495,968
724,817
914,770
1,004,351
1,074,776
1,079,912
1,156,465
1,298,393
1,337,829
1,891,453
2,337,552
3,031,761
3,127,804
3,234,678
Hillsboro, OR
San Mateo, CA
Bellevue, WA
Gilbert, AZ
Carlsbad, CA
Chandler, AZ
Fort Collins, CO
Plano, TX
Tempe, AZ
Durham, NC
St. Petersburg, FL
Scottsdale, AZ
Albuquerque, NM
Tucson, AZ
Colorado Springs, CO
Facebook check ins, 2020
35,740
37,328
78,504
91,000
194,980
274,809
310,542
313,441
341,644
412,507
420,630
430,041
515,578
1,777,471
2,371,736
Hillsboro, OR
Carlsbad, CA
Fort Collins, CO
Bellevue, WA
Tempe, AZ
St. Petersburg, FL
Chandler, AZ
Plano, TX
Tucson, AZ
Gilbert, AZ
Scottsdale, AZ
San Mateo, CA
Durham, NC
Albuquerque, NM
Colorado Springs, CO
Instagram hashtags, 2020
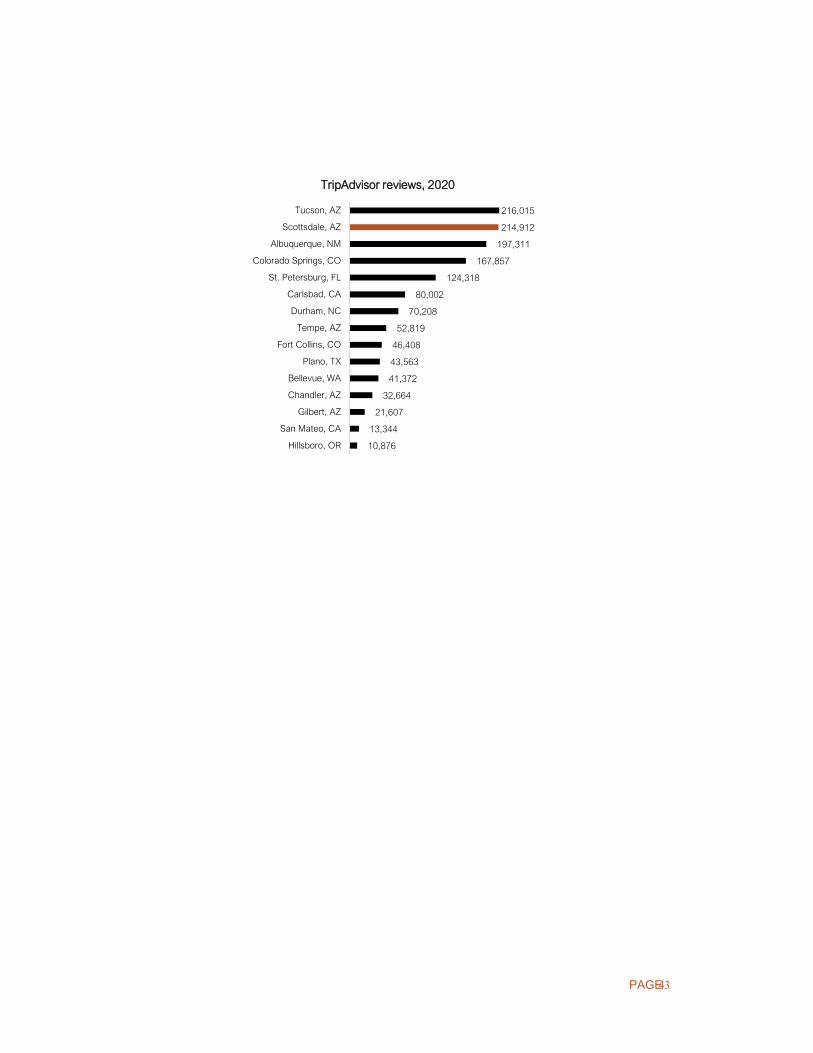
PAGE 43
10,876
13,344
21,607
32,664
41,372
43,563
46,408
52,819
70,208
80,002
124,318
167,857
197,311
214,912
216,015
Hillsboro, OR
San Mateo, CA
Gilbert, AZ
Chandler, AZ
Bellevue, WA
Plano, TX
Fort Collins, CO
Tempe, AZ
Durham, NC
Carlsbad, CA
St. Petersburg, FL
Colorado Springs, CO
Albuquerque, NM
Scottsdale, AZ
Tucson, AZ
TripAdvisor reviews, 2020

PAGE 44
Appendix B: Engagement While a data assessment helps determine a city’s competitive advantages, opportunities, and challenges, an economic development strategy must be co-authored by the community it intends to serve. By providing a platform for community members to share their expertise and new ideas, we hope to generate a universal understanding of economic opportunity among public, private, and governmental partners. This process of convening local stakeholders is reflective of the City of Scottsdale’s mission to build meaningful relationships between industry players, service providers, residents, non-profit organizations, and economic development partners. The roundtable discussions with the following groups represent the beginning of a long-term effort to foster community engagement. To arrive at a firm understanding of Scottsdale’s many assets and challenges, the City of Scottsdale, in partnership with Resonance Consultancy, hosted a series of discussions on a detailed list of topics; more than seventy business, community and government representatives participated in the conversation. ROUNDTABLE DISCUSSIONS
CURRENT ECONOMIC DEVELOPMENT PRIORITIES/INITIATIVES The City of Scottsdale will rely on its key partner organizations – regional and provincial economic development entities, workforce providers, the airport, local educational facilities, and industry associations – to implement its three-year economic development strategy. This discussion identified community competitive advantages, shared priorities, and the opportunity for future collaboration. STARTUPS AND ENTREPRENEURSHIP AND INNOVATION This discussion included local entrepreneurs, small business support organizations and founders of local businesses to consider what makes the city a unique environment for entrepreneurship. In addition to identifying certain action steps and gaps in the small business ecosystem, the conversation pinpointed target industries that have demonstrated the greatest opportunity for supporting entrepreneurship. BRAIN GAIN/DRAIN Talent is the driving factor in economic development today. This roundtable discussions gathered young professionals, workforce development professionals, and business representatives to discuss Scottsdale’s appeal to the growing creative class in the region, as well as the challenges that talent experiences in the city.

PAGE 45
DIVERSITY, EQUITY, AND INCLUSION Cities across the country are grappling with how to build more inclusive, equitable communities. This conversation pulled together DEI representatives across Scottsdale to address how the city can tackle growing equity and inclusion challenges and gaps through its economic development efforts. CITY COUNCIL AND CITY STAFF LEADERSHIP One-on-one conversations with the elected officials and city staff helped to frame the key priorities for economic growth, vision, and principles. Moving forward, these leaders will continue to provide input for Scottsdale’s economic development strategy and help identify resources needed to support the plan. FINANCIAL AND INSURANCE SERVICES AND TECHNOLOGY Scottsdale’s financial and insurance industries are key employment sectors and competitive advantages. This discussion brought together industry professionals (from large anchor and midsized companies) and entrepreneurs to discuss the city’s growth opportunities within these industries and how technology and innovation may alter their trajectory. QUALITY OF PLACE AND DESTINATION DEVELOPMENT, ARTS AND CULTURE The tourism, placemaking, and arts and culture session convened destination marketing organization professionals, planners, arts and culture representatives (theaters, galleries and collectives) to discuss the importance of quality of place to Scottsdale’s economic development efforts. Specifically, the conversation highlighted Scottsdale’s growing tourism sector but the need for additional product development. The discussion also acknowledged the significant value that Scottsdale’s arts community brings to the city, as well as the challenges it faces as the city grows. COMMERCIAL DEVELOPERS/BROKERS The COVID-19 pandemic will dramatically transform how cities utilize space in the future. This roundtable discussion brought together commercial real estate brokers and developers for a dialogue about development in Scottsdale in a post COVID-19 world.
KEY THEMES AND TAKEAWAYS
Roundtable participants and community stakeholders identified the following themes. Their takeaways, cross cutting several sessions, have helped to shape the City of Scottsdale’s Economic Development Strategy. FOSTERING A COMMUNITY DIALOGUE ABOUT GROWTH
• CITY AT A CROSSROADS Scottsdale is changing quickly, creating both opportunities and challenges.

PAGE 46
• THE GROWTH DEBATE
There is a growing debate in Scottsdale surrounding the issue of development.
• ANXIOUS ABOUT FAST-PACED GROWTH Some Scottsdale residents are growing anxious with the city’s rapid growth.
• NEED FOR A VISION
Scottsdale needs a vision for economic development. ARTICULATING ECONOMIC DEVELOPMENT PRIORITIES
• GROWING CORPORATE PRESENCE Retaining and expanding Scottsdale’s corporate presence is a priority for the city.
• DEVELOPMENT ALONG THE 101 CORRIDOR
The 101 corridor is a growing center of economic activity.
• DIVERSIFICATION FOR LONG-TERM SUCCESS Diversification is an economic necessity for Scottsdale’s future.
• DEFINING ECONOMIC DEVELOPMENT TARGETS
Scottsdale needs a target sector approach.
• AIRPARK OPPORTUNITY Scottsdale should leverage the airpark in the city.
• SUSTAINABILITY IS KEY For some Scottsdale residents, sustainability is an important economic development principle.
• LEVERAGING TIES TO MEXICO
Scottsdale and Arizona should leverage the connection to Mexico. DISCUSSING THE ROLE AND FUTURE OF TOURISM
• TOURISM IS KEY Scottsdale has effectively leveraged tourism to tell its story.
• TOURISM IMPACT
Tourism is an essential sector for Scottsdale.
• HIGHLY DEPENDENT ON TOURISM Scottsdale’s economy remains highly dependent upon tourism dollars.
PAGE 47
• A GROWING CANADIAN FOOTPRINT BECAUSE OF TOURISM
Tourism helps open the door to FDI.
• GLOBAL TOURISM COMPETITION Scottsdale competes on a global scale as a destination.
• FUTURE OF RESORTS IN POST-COVID
Scottsdale has a large number of resorts; some may need to be reimagined in a post-COVID world.
• A LONG ROAD TO RECOVERY
As a destination and tourism hub, the recovery for Scottsdale will be extended. PROMOTING THE IMPORTANCE OF QUALITY OF PLACE
• QUALITY OF PLACE A DRAW FOR HQ RELOCATION When closing relocation deals, Scottsdale has a strong quality of place story.
• APPEAL FOR EXECUTIVE WORKFORCE
As a destination, Scottsdale is very appealing for executives.
• BALANCING ECONOMIC DEVELOPMENT AND QUALITY OF PLACE Scottsdale’s economic development efforts have to balance growth and quality of life.
• SCOTTSDALE’S APPEAL TO THE CREATIVE CLASS
Scottsdale has a strong appeal for the creative class.
• A BRAND FOR THE ARTS Scottsdale has a well-established reputation for the arts.
BUILDING A MORE INCLUSIVE SCOTTSDALE
• GROWING DIVERSITY IN SCOTTSDALE Scottsdale is growing in diversity.
• COMMUNICATING INCLUSION Scottsdale is a welcoming community but needs to better tell its story.
• ONGOING DYNAMIC PROCESS
Inclusion requires ongoing engagement.
• DEFINING INCLUSION Inclusion is community value that benefits everyone.

PAGE 48
• AN INTENTIONAL STRATEGY FOR INCLUSION
Inclusion should be a central part of the city’s economic development efforts. GROWING SCOTTSDALE’S STARTUPS
• BOOMING STARTUP COMMUNITY Scottsdale’s startup ecosystem is expanding.
• A SPREAD-OUT INNOVATION SECTOR
Scottsdale’s startup community is dispersed.
• GAP OF YOUNG COMPANIES Scottsdale, including Arizona, has a gap in the startup lifecycle.
• STARTUP CHAMPION NEEDED
Arizona’s startup community needs an advocate to step up.
• CAPITAL AND FUNDER ECOSYSTEM A lot of out-of-state startups and capital providers when they arrive in Arizona do not interact with the local entrepreneurial community.
• VC INCREASING
Arizona is experiencing an increase in startup capital.
• FINTECH OPPORTUNITY Arizona, including Scottsdale, has a growing opportunity in fintech.
• FEW UNICORNS
Arizona’s startup ecosystem has had very few ‘unicorns’.
• LACK OF STARTUP LEADERSHIP TALENT Arizona has a deep bench of business executive talent, but few have scaled a startup business.
• MOVING BEYOND STORYTELLING TO STRATEGY Scottsdale needs a defined startup strategy.
• FORMING AN IDENTITY
The Scottsdale startup community is still forming its identity. LEVERAGING HEALTHCARE ASSETS
• GROWING MEDICAL TOURISM

PAGE 49
Medical tourism is a significant opportunity for Scottsdale.
• PLACE OF HEALTH AND HEALING Scottsdale has a long history as a healthcare center.
• MAYO CLINIC IMPACT
The Mayo Clinic is a significant anchor institution for the city and region.
• IMPROVING COMPETITIVENESS While Arizona has one of the longest-standing biosciences roadmap in the U.S, the state’s sector is not as competitive as some peers.
• LEVERAGING THE CURE CORRIDOR
Looking forward, Scottsdale has to build upon the energy and buzz created by the Cure Corridor.
RETHINKING FUTURE OF THE OFFICE AND DEVELOPMENT
• REVALUATING THE OFFICE With the impact of the COVID-19 pandemic, many businesses are re-evaluating their office space needs.
• WORKING FROM HOME
The “rise of the home office” will change the future of office space in the future, even after the pandemic
• WHERE TO DRIVE COMPANY CULTURE
The office will be the “place” where you drive company culture.
• DEVELOPMENT PROCESS There are mixed perspectives on the ease of Scottsdale’s development process.

PAGE 50
Appendix C: Key Industr ies WHAT IS AN INDUSTRY SECTOR?
The term “industry sector” refers to a group of similar and related traded sector businesses in a defined geographic area. Businesses in the same industry tend to share common markets, technologies and skill sets, and are often connected through buyer-seller relationships. For this reason, industry sectors tend to be highly specific. This allows a city to identify the industry’s unique workforce and supply chain needs, while promoting the industry more effectively. On the most basic level, industry sectors promote two functions: collaboration and competition. Due to their shared resources and markets, businesses in the same industry can collaborate to solve issues within their own industry or throughout the broader community, including infrastructure needs and regulations such as incentives or zoning. Industries also help to distinguish a community from nearby areas, define its role in the regional or national landscape, and encourage the development of new business opportunities. At the same time, these sectors encourage competition among related businesses, thereby promoting innovation. By highlighting a specific group of like-minded businesses, cities can better communicate their competitive strengths to outside talent and firms. Through data analysis, we examined the following 13 traded industries for Scottsdale:
1 Aerospace and Defense
2 Biotech and Medical Devices
3 Corporate and Regional HQ
4 Financial Services
5 FinTech
6 Higher Education
7 Hospitality
8 Insurance Services
9 IT Services and Computer Software
10 Life Sciences

PAGE 51
11 Logistics
12 Shared Business Services and Data Hosting
13 Telecommunications
The following is an analysis of the City of Scottsdale’s sector advantages and associated workforce skills.

PAGE 52
TRADED INDUSTRIES
INDUSTRY SPECIALIZATION Nine of the traded sector industries in Scottsdale have a competitive advantage (specialization greater than 1). The following four industries do not have a competitive advantage: Higher Education, Life Sciences, Aerospace and Defense, Biotech and Medical Devices.
INDUSTRY EMPLOYMENT Scottsdale’s largest traded sector industries are business services, technology and hospitality. Together, they employ around 44,000 employees.
0.1 0.2 0.5 0.71.1
1.4 1.62.1 2.2
2.63.0 3.0
5.8
City of Scottsdale: Industry Specialization, 2019
U.S. Average: 1.0
89
121
217
342
1,412
2,775
3,828
4,197
8,211
8,808
10,015
14,416
19,239
Life Sciences
Aerospace and Defense
Biotech and Medical Devices
Higher Education
Telecommunications
Logistics
Insurance Services
Corporate and Regional HQ
FinTech
Hospitality
Financial Services
IT Services and Computer Software
Shared Business Services and Data Hosting
City of Scottsdale: Industry Employment, 2019

PAGE 53
INDUSTRY JOB CREATION Scottsdale’s traded industries added nearly 11,000 jobs since 2014, a 12.8% increase. Six of the industries have a job growth that is faster than Arizona.
Sector 2019 Jobs 5-Year
Growth, 2014-2019
New Jobs, 2014-2019
Job Growth Faster/ Slower than AZ 2019
Shared Business Services and Data Hosting 19,239 10.8% 1,875 -3.4%
IT Services and Computer Software 14,416 41.6% 4,235 3.5%
Financial Services 10,015 33.7% 2,524 12.2%
Hospitality 8,808 3.7% 314 -1.0%
FinTech 8,211 27.1% 1,749 -0.9%
Corporate and Regional HQ 4,197 3.7% 148 2.2%
Insurance Services 3,828 4.6% 169 2.1%
Logistics 2,775 -10.5% -325 -34.5%
Telecommunications 1,412 10.5% 134 -8.9%
Higher Education 342 -18.4% -77 8.1%
Biotech and Medical Devices 217 128.4% 122 100.2%
Aerospace and Defense 121 -24.8% -40 -36.9%
Life Sciences 89 67.9% 36 -16.3% *Note: Brick shading represents an employment decline or slower growth than Arizona.

PAGE 54
5-YEAR EMPLOYMENT GROWTH Five Scottsdale industries outpace Arizona in job growth: Biotech and Medical Devices, IT Services and Computer Software, Financial Services, Insurance Services, and Corporate and Regional HQ. INDUSTRY EARNINGS PER WORKER
Out of the 13 traded industries, 12 have earnings above $50,000, while 6 have earnings above $75,000.
$36,703
$54,152
$58,328
$66,597
$71,005
$72,399
$74,082
$77,830
$91,824
$92,632
$98,966
$99,338
$107,298
Hospitality
Shared Business Services and Data…
Life Sciences
Logistics
Higher Education
Telecommunications
Biotech and Medical Devices
Insurance Services
IT Services and Computer Software
FinTech
Financial Services
Corporate and Regional HQ
Aerospace and Defense
City of Sottsdale: Industry earnings per worker, 2019
-24.8%
-18.4%
-10.5%
3.7%
3.7%
4.6%
10.5%
10.8%
27.1%
33.7%
41.6%
67.9%
128.4%
12.1%
-26.5%
24.0%
1.4%
4.7%
2.6%
19.4%
14.2%
28.0%
21.5%
38.1%
84.2%
28.2%
Aerospace and Defense
Higher Education
Logistics
Corporate and Regional HQ
Hospitality
Insurance Services
Telecommunications
Shared Business Services and Data Hosting
FinTech
Financial Services
IT Services and Computer Software
Life Sciences
Biotech and Medical Devices
City of Scottsdale: 5-year employment growth, 2014-2019
Arizona
Scottsdale

PAGE 55
TRADED SECTOR GROSS REGIONAL PRODUCT Scottsdale accounts for a quarter of Arizona’s IT services and computer software gross domestic product.
Sector GDP 2019 (Millions) Share of AZ Sector GDP 2019
IT Services and Computer Software $2,770.7 26.0%
Financial Services $2,268.4 16.7%
FinTech $1,847.9 17.7%
Shared Business Services and Data Hosting $1,445.9 14.0%
Insurance Services $825.7 14.0%
Hospitality $763.3 16.4%
Corporate and Regional HQ $611.5 14.8%
Logistics $409.8 7.3%
Telecommunications $364.0 9.5%
Biotech and Medical Devices $45.4 3.1%
Higher Education $36.5 1.9%
Aerospace and Defense $34.1 0.5%
Life Sciences $20.4 2.3%

PAGE 56
INDUSTRY SUMMARY Nine of the Scottsdale industries that were included in the analysis have a competitive advantage (LQ>1). Of the nine competitive industries, five industries are experiencing slower job growth than Arizona.
Industry
Location Quotient
2019
Employment 2019
Employment in Sectors > 1.25 (LQ)
2019
Share of AZ
Sectors Employ 2019
Share of New Jobs, 2014-2019
New Jobs, 2014-2019
Job Growth Faster/ Slower than AZ
2019
Average Earnings
Per Worker 2019
GRP 2019 (Millions)
Share of AZ
Sector GDP - 2019
Shared Business Services and Data
Hosting 5.83 19,239 97.1% 16.5% 10.8% 1,875 -3.4% $54,152 $1,445.90 14.0%
Financial Services 3.02 10,015 95.3% 14.6% 33.7% 2,524 12.2% $98,966 $2,268.40 16.7%
Telecommunications 3.02 1,412 94.9% 15.0% 10.5% 134 -8.9% $72,399 $364.00 9.5%
IT Services and Computer Software 2.64 14,416 96.3% 23.3% 41.6% 4,235 3.5% $91,824 $2,770.70 26.0%
FinTech 2.24 8,211 90.1% 14.6% 27.1% 1,749 -0.9% $92,632 $1,847.90 17.7%
Hospitality 2.09 8,808 98.1% 14.6% 3.7% 314 -1.0% $36,703 $763.30 16.4%
Insurance Services 1.58 3,828 95.4% 12.8% 4.6% 169 2.1% $77,830 $825.70 14.0%
Logistics 1.42 2,775 73.1% 5.0% -10.5% -325 -34.5% $66,597 $409.80 7.3%
Corporate and Regional HQ 1.13 4,197 5.6% 14.0% 3.7% 148 2.2% $99,338 $611.50 14.8%
Biotech and Medical Devices 0.68 217 0.0% 2.9% 128.4% 122 100.2% $74,082 $45.40 3.1%
Aerospace and Defense 0.46 121 0.0% 0.3% -24.8% -40 -36.9% $107,298 $34.10 0.5%
Life Sciences 0.24 89 0.0% 2.5% 67.9% 36 -16.3% $58,328 $20.40 2.3%
Higher Education 0.08 342 0.0% 1.5% -18.4% -77 8.1% $71,005 $36.50 1.9%
Note: Grey shading represents sectors with LQ’s greater than the U.S. average; brick shading represents an employment decline.

PAGE 57
EMPLOYMENT AND JOB CREATION The industry with the largest number of jobs created in the last five years is IT Services and Computer Software. Scottsdale has also added a number of new jobs in the Shared Business Services and Data Hosting industry, which is the largest industry sector in the city in terms of employment and is also the most competitive. Other growing industries include Financial Services and FinTech.
Size of Bubble: Total Employment
5-Year New Jobs, 2014-2019
-1.00
0.00
1.00
2.00
3.00
4.00
5.00
6.00
7.00
-2,000 -1,000 0 1,000 2,000 3,000 4,000 5,000
Shared Business Services and Data Hosting
Telecommunications
Insurance Services
Logistics
Aerospace and Defense
Life Sciences
Higher Education Biotech and Medical Devices
Corporate and Regional HQ
Hospitality
FinTech
Financial ServicesIT Services and Computer Software
Spe
cial
izat
ion
(LQ
) [U
.S. A
vera
ge=
1]

PAGE 58
EMPLOYMENT AND JOB GROWTH The Financial Services sector stands out as the industry with the largest growth, compared to Arizona. Even though the Shared Business Services and Data Hosting sector added jobs in the last five years, the state’s rate of growth has been slightly faster. The Logistics sector is a competitive, nevertheless, is shrinking.
Size of Bubble: Total Employment
5-Year Job Growth Difference from Arizona (%), 2014-2019
0.00
1.00
2.00
3.00
4.00
5.00
6.00
7.00
-45.0% -35.0% -25.0% -15.0% -5.0% 5.0% 15.0% 25.0%
Shared Business Services and Data Hosting
Telecommunications
Logistics
FinTech
IT Services and Computer Software
Insurance Services
Corporate and Regional HQ
Spe
cial
izat
ion
(LQ
) [U
.S. A
vera
ge=
1]
Hospitality
Financial Services

PAGE 59
TARGET SECTOR PROFILES
IT SERVICES AND SOFTWARE
Overview Scottsdale’s business environment combines successful entrepreneurs with an outstanding workforce. For this reason, Scottsdale is increasingly becoming a center for technology development and many New York and San Francisco companies are choosing to expand and relocated to the city. Scottsdale’s tech ecosystem continues to flourish, especially with the city’s strong base of highly skilled software engineers, programmers and systems analysts. The city is home to both tech tycoons and promising startups that are reshaping the fabric of the economy.
NAICS Sector Location Quotient
2019
Employment 2019
% of Sector Employment
2019
New Jobs, 2014-2019
Average Earnings Per Worker 2019
GRP 2019 (Millions)
IT Services and
Computer Software 2.64 14,416 4,235 $91,824 $2,770.7
518210 Data Processing,
Hosting, and Related Services
6.68 3,677 25.5% 628 $95,760 $1,047.6
519130 Internet Publishing
and Broadcasting and Web Search Portals
3.26 1,460 10.1% 813 $72,171 $328.4
541513 Computer Facilities
Management Services 3.05 401 2.8% 96 $74,743 $47.0
541512 Computer Systems
Design Services 2.86 5,001 34.7% 1,599 $96,317 $720.2
541519 Other Computer Related Services
2.65 550 3.8% 16 $90,631 $85.4
541511 Custom Computer
Programming Services 1.68 2,793 19.4% 817 $87,531 $357.6
511210 Software Publishers 0.75 534 3.7% 266 $112,873 $184.4
Note: Grey shading represents sectors with LQ’s greater than the U.S. average.
Education and Training: 51.9% of essential occupations require a BA or higher 62.7% require no prior work experience 14.0% require some on the job work experience Top 10 Occupations:
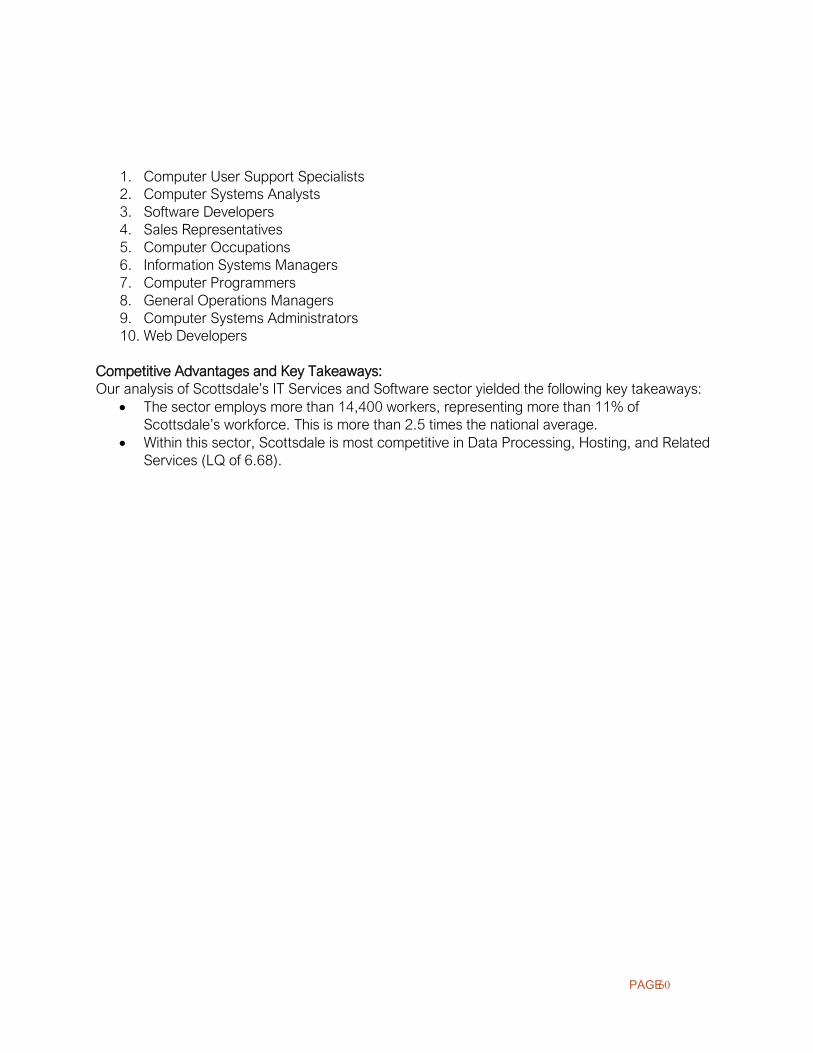
PAGE 60
1. Computer User Support Specialists 2. Computer Systems Analysts 3. Software Developers 4. Sales Representatives 5. Computer Occupations 6. Information Systems Managers 7. Computer Programmers 8. General Operations Managers 9. Computer Systems Administrators 10. Web Developers
Competitive Advantages and Key Takeaways: Our analysis of Scottsdale’s IT Services and Software sector yielded the following key takeaways:
• The sector employs more than 14,400 workers, representing more than 11% of Scottsdale’s workforce. This is more than 2.5 times the national average.
• Within this sector, Scottsdale is most competitive in Data Processing, Hosting, and Related Services (LQ of 6.68).
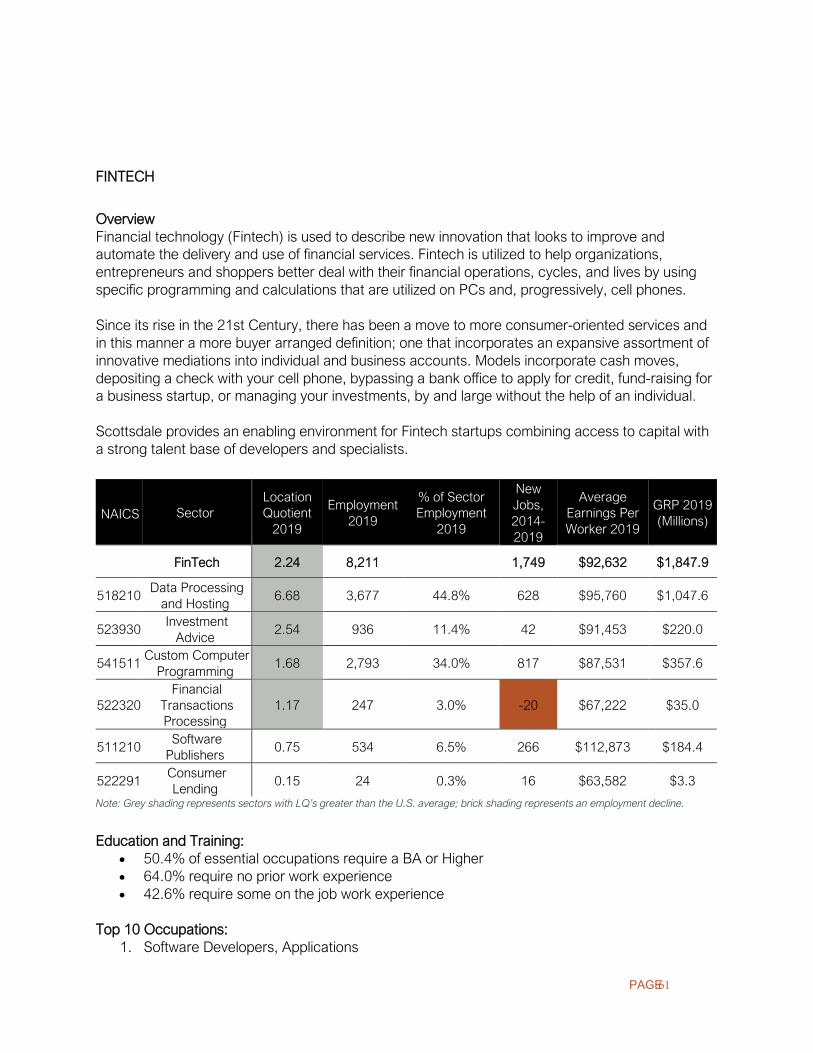
PAGE 61
FINTECH
Overview Financial technology (Fintech) is used to describe new innovation that looks to improve and automate the delivery and use of financial services. Fintech is utilized to help organizations, entrepreneurs and shoppers better deal with their financial operations, cycles, and lives by using specific programming and calculations that are utilized on PCs and, progressively, cell phones. Since its rise in the 21st Century, there has been a move to more consumer-oriented services and in this manner a more buyer arranged definition; one that incorporates an expansive assortment of innovative mediations into individual and business accounts. Models incorporate cash moves, depositing a check with your cell phone, bypassing a bank office to apply for credit, fund-raising for a business startup, or managing your investments, by and large without the help of an individual. Scottsdale provides an enabling environment for Fintech startups combining access to capital with a strong talent base of developers and specialists.
NAICS Sector Location Quotient
2019
Employment 2019
% of Sector Employment
2019
New Jobs, 2014-2019
Average Earnings Per Worker 2019
GRP 2019 (Millions)
FinTech 2.24 8,211 1,749 $92,632 $1,847.9
518210 Data Processing
and Hosting 6.68 3,677 44.8% 628 $95,760 $1,047.6
523930 Investment
Advice 2.54 936 11.4% 42 $91,453 $220.0
541511 Custom Computer
Programming 1.68 2,793 34.0% 817 $87,531 $357.6
522320 Financial
Transactions Processing
1.17 247 3.0% -20 $67,222 $35.0
511210 Software
Publishers 0.75 534 6.5% 266 $112,873 $184.4
522291 Consumer Lending
0.15 24 0.3% 16 $63,582 $3.3
Note: Grey shading represents sectors with LQ’s greater than the U.S. average; brick shading represents an employment decline. Education and Training:
• 50.4% of essential occupations require a BA or Higher • 64.0% require no prior work experience • 42.6% require some on the job work experience
Top 10 Occupations:
1. Software Developers, Applications

PAGE 62
2. Customer Service Representatives
3. Customer User Support Specialists
4. Computer Systems Analysts
5. Software Developers, Systems
6. Sales Representatives
7. Information Systems Managers
8. Operations Managers
9. Computer Network Support Specialists
10. Computer Programmers Competitive Advantages and Key Takeaways: Our analysis of Scottsdale’s FinTech sector yielded the following key takeaways:
• The FinTech sector is a competitive one in Scottsdale, employing 8,211 workers. This represents 6.5% of the total workforce in Scottsdale, a share that is more than twice the national average.
• Within this sector, Scottsdale is most competitive in Data Processing and Hosting (LQ of 6.68), followed by Investment Advice (LQ of 2.54).
• Early Warning Services is Scottsdale’s largest employer in FinTech, employing 664 workers. The company is owned by seven of the country’s largest banks.
• PayPal Inc. is the second largest employer in this sector after Early Warning Services, employing 479 workers.
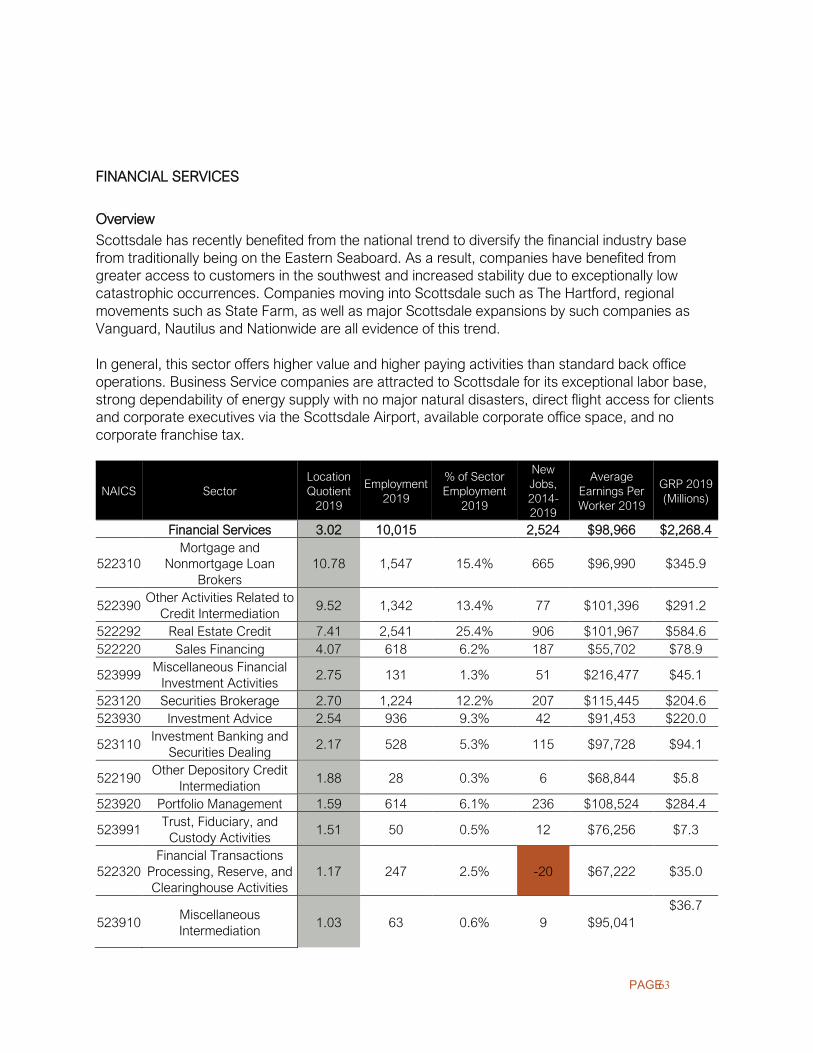
PAGE 63
FINANCIAL SERVICES
Overview
Scottsdale has recently benefited from the national trend to diversify the financial industry base from traditionally being on the Eastern Seaboard. As a result, companies have benefited from greater access to customers in the southwest and increased stability due to exceptionally low catastrophic occurrences. Companies moving into Scottsdale such as The Hartford, regional movements such as State Farm, as well as major Scottsdale expansions by such companies as Vanguard, Nautilus and Nationwide are all evidence of this trend. In general, this sector offers higher value and higher paying activities than standard back office operations. Business Service companies are attracted to Scottsdale for its exceptional labor base, strong dependability of energy supply with no major natural disasters, direct flight access for clients and corporate executives via the Scottsdale Airport, available corporate office space, and no corporate franchise tax.
NAICS Sector Location Quotient
2019 Employment
2019 % of Sector Employment
2019
New Jobs, 2014-2019
Average Earnings Per Worker 2019
GRP 2019 (Millions)
Financial Services 3.02 10,015 2,524 $98,966 $2,268.4
522310 Mortgage and
Nonmortgage Loan Brokers
10.78 1,547 15.4% 665 $96,990 $345.9
522390 Other Activities Related to
Credit Intermediation 9.52 1,342 13.4% 77 $101,396 $291.2
522292 Real Estate Credit 7.41 2,541 25.4% 906 $101,967 $584.6 522220 Sales Financing 4.07 618 6.2% 187 $55,702 $78.9
523999 Miscellaneous Financial
Investment Activities 2.75 131 1.3% 51 $216,477 $45.1
523120 Securities Brokerage 2.70 1,224 12.2% 207 $115,445 $204.6 523930 Investment Advice 2.54 936 9.3% 42 $91,453 $220.0
523110 Investment Banking and
Securities Dealing 2.17 528 5.3% 115 $97,728 $94.1
522190 Other Depository Credit
Intermediation 1.88 28 0.3% 6 $68,844 $5.8
523920 Portfolio Management 1.59 614 6.1% 236 $108,524 $284.4
523991 Trust, Fiduciary, and
Custody Activities 1.51 50 0.5% 12 $76,256 $7.3
522320 Financial Transactions
Processing, Reserve, and Clearinghouse Activities
1.17 247 2.5% -20 $67,222 $35.0
523910 Miscellaneous Intermediation
1.03 63 0.6% 9 $95,041 $36.7
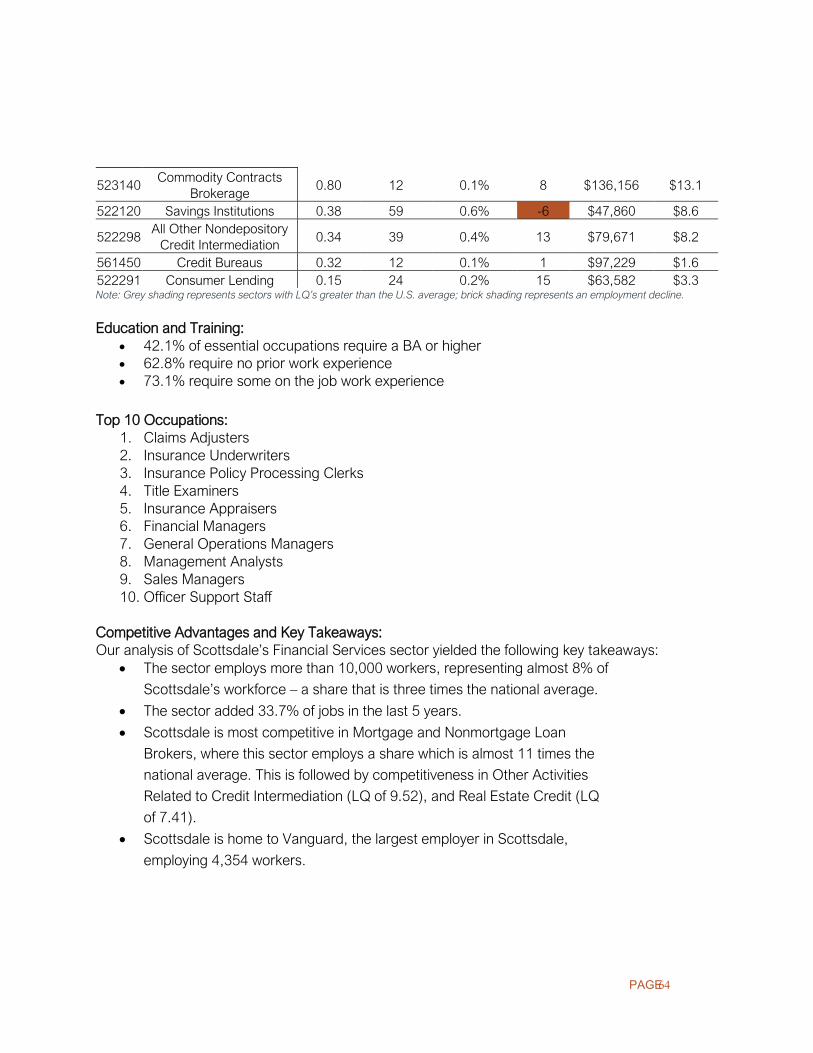
PAGE 64
523140 Commodity Contracts
Brokerage 0.80 12 0.1% 8 $136,156 $13.1
522120 Savings Institutions 0.38 59 0.6% -6 $47,860 $8.6
522298 All Other Nondepository
Credit Intermediation 0.34 39 0.4% 13 $79,671 $8.2
561450 Credit Bureaus 0.32 12 0.1% 1 $97,229 $1.6 522291 Consumer Lending 0.15 24 0.2% 15 $63,582 $3.3 Note: Grey shading represents sectors with LQ’s greater than the U.S. average; brick shading represents an employment decline. Education and Training:
• 42.1% of essential occupations require a BA or higher • 62.8% require no prior work experience • 73.1% require some on the job work experience
Top 10 Occupations:
1. Claims Adjusters 2. Insurance Underwriters 3. Insurance Policy Processing Clerks 4. Title Examiners 5. Insurance Appraisers 6. Financial Managers 7. General Operations Managers 8. Management Analysts 9. Sales Managers 10. Officer Support Staff
Competitive Advantages and Key Takeaways: Our analysis of Scottsdale’s Financial Services sector yielded the following key takeaways:
• The sector employs more than 10,000 workers, representing almost 8% of
Scottsdale’s workforce – a share that is three times the national average.
• The sector added 33.7% of jobs in the last 5 years.
• Scottsdale is most competitive in Mortgage and Nonmortgage Loan
Brokers, where this sector employs a share which is almost 11 times the
national average. This is followed by competitiveness in Other Activities
Related to Credit Intermediation (LQ of 9.52), and Real Estate Credit (LQ
of 7.41).
• Scottsdale is home to Vanguard, the largest employer in Scottsdale,
employing 4,354 workers.
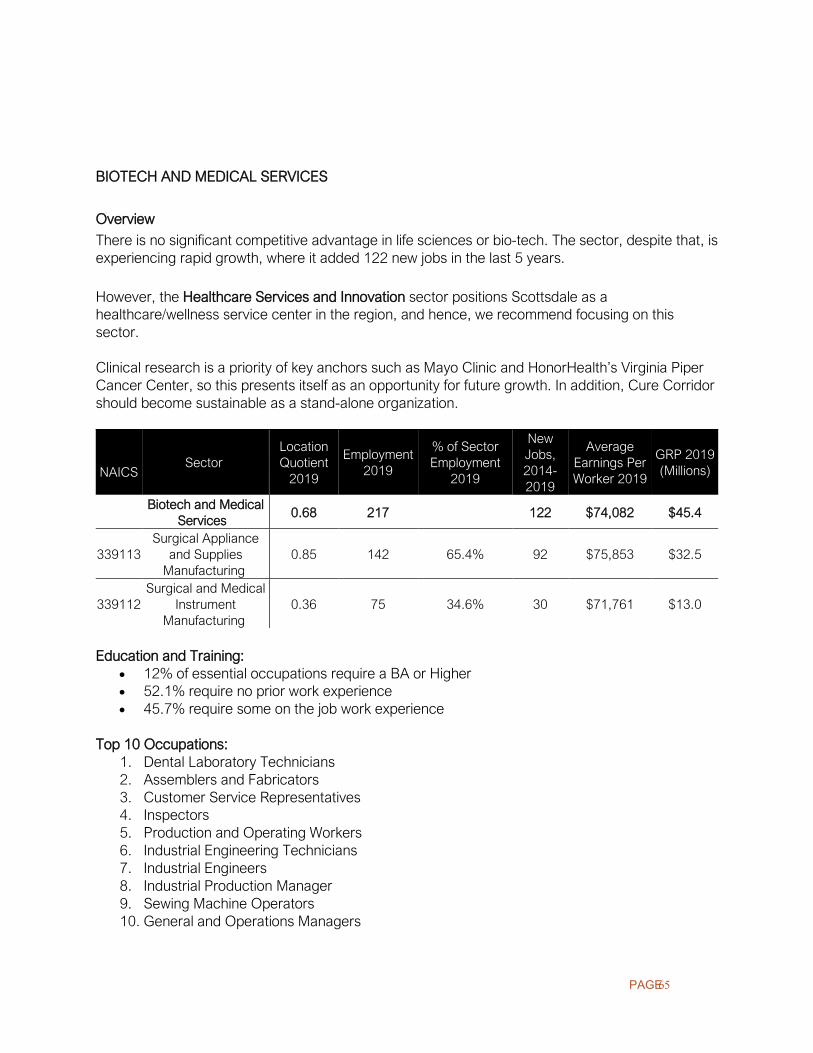
PAGE 65
BIOTECH AND MEDICAL SERVICES
Overview
There is no significant competitive advantage in life sciences or bio-tech. The sector, despite that, is experiencing rapid growth, where it added 122 new jobs in the last 5 years.
However, the Healthcare Services and Innovation sector positions Scottsdale as a healthcare/wellness service center in the region, and hence, we recommend focusing on this sector. Clinical research is a priority of key anchors such as Mayo Clinic and HonorHealth’s Virginia Piper Cancer Center, so this presents itself as an opportunity for future growth. In addition, Cure Corridor should become sustainable as a stand-alone organization.
NAICS
Sector Location Quotient
2019
Employment 2019
% of Sector Employment
2019
New Jobs, 2014-2019
Average Earnings Per Worker 2019
GRP 2019 (Millions)
Biotech and Medical
Services 0.68 217 122 $74,082 $45.4
339113 Surgical Appliance
and Supplies Manufacturing
0.85 142 65.4% 92 $75,853 $32.5
339112 Surgical and Medical
Instrument Manufacturing
0.36 75 34.6% 30 $71,761 $13.0
Education and Training:
• 12% of essential occupations require a BA or Higher • 52.1% require no prior work experience • 45.7% require some on the job work experience
Top 10 Occupations:
1. Dental Laboratory Technicians 2. Assemblers and Fabricators 3. Customer Service Representatives 4. Inspectors 5. Production and Operating Workers 6. Industrial Engineering Technicians 7. Industrial Engineers 8. Industrial Production Manager 9. Sewing Machine Operators 10. General and Operations Managers

PAGE 66
Competitive Advantages and Key Takeaways: Our analysis of Scottsdale’s Biotech and Medical Devices sector yielded the following key takeaways:
• The sector is not competitive, employing 0.17% of Scottsdale’s workforce
- a share that is 32% lower than the national average.
• The sector has, however, added 122 new jobs in the last 5 years.

PAGE 67
LOGISTICS
Overview Supported by its location, Scottsdale has a competitive advantage in Logistics. It is chosen by many Logistics firms for talent and transportation. Scottsdale has recently been chosen as a destination for BlueGrace Logistics, one of the largest third-party logistics (3PL) providers in the United States.
NAICS Sector Location Quotient
2019
Employment 2019
% of Sector Employment
2019
New Jobs, 2014-2019
Average Earnings Per Worker 2019
GRP 2019 (Millions)
Logistics 1.42 2,775 -325 $66,597 $409.8
454110 Electronic Shopping and Mail-Order Houses 1.89 1,458 52.5% 96 $56,855 $244.8
488510 Freight Transportation Arrangement 1.35 568 20.5% 88 $63,500 $57.4
425120 Wholesale Trade Agents and Brokers 0.64 520 18.7% -516 $99,395 $86.0
561499 All Other Business Support Services 0.64 96 3.5% -6 $43,877 $7.4
425110 Business to Business Electronic Markets 0.42 22 0.8% -2 $81,760 $3.2
541614
Process, Physical Distribution, and
Logistics Consulting Services
0.35 82 3.0% -3 $84,226 $9.3
493110 General Warehousing and Storage 0.02 29 1.0% 18 $42,839 $1.6
Note: Grey shading represents sectors with LQ’s greater than the U.S. average.
Education and Training:
• 5.7% of essential occupations require a BA or higher • 62.8% require no prior work experience • 61.8% require some on the job work experience
Top 10 Occupations:
1. Claims Adjusters 2. Insurance Underwriters 3. Insurance Policy Processing Clerks 4. Title Examiners 5. Insurance Appraisers 6. Financial Managers 7. General Operations Managers

PAGE 68
8. Management Analysts 9. Sales Managers 10. Officer Support Staff
Competitive Advantages and Key Takeaways: Our analysis of Scottsdale’s Logistics sector yielded the following key takeaways:
• The sector employs more than 2,775 workers, a share that is 42% higher
than the national average. However, the sector lost 325 jobs over the last
5 years.
• The majority (52.5%) of the sector’s workers are employed in Electronic
Shopping and Mail-Order Houses.
• The Wholesale Trade Agents and Brokers sector lost 516 jobs over the
past 5 years, rendering itself a non-competitive sector for the city.

PAGE 69
CORPORATE AND REGIONAL HEADQUARTERS
Overview Corporate and regional headquarters relocations are driven by a combination of many factors, frequently triggered by new leadership or ownership, changing market conditions, the need to change corporate culture, or attaining a more favorable and competitively priced business operating cost environment to achieve cost efficiencies and maximize profits. Scottsdale has a favorable environment, attracting both organizations and talent. The quality of life Scottsdale has to offer is also one of the aspects that could be harnessed for this attraction – especially, post-pandemic.
NAICS Sector Location Quotient
2019
Employment 2019
% of Sector Employment
2019
New Jobs, 2014-2019
Average Earnings Per Worker 2019
GRP 2019 (Millions)
Corporate and Regional HQ
1.13 4,197 148 $99,338 $611.5
551112 Offices of Other
Holding Companies 1.99 233 5.6% 20 $114,314 $40.6
551114
Corporate, Subsidiary, and
Regional Managing Offices
1.08 3,964 94.4% 128 $98,460 $570.8
Note: Grey shading represents sectors with LQ’s greater than the U.S. average.
Education and Training:
• 39.7% of essential occupations require a BA or higher • 35.5% require no prior work experience
• 16.4% require some on the job work experience
Top 10 Occupations:
1. Customer Service Representative 2. General and Operations Managers 3. Accountants and Auditors 4. Market Research Analysts 5. Financial Managers 6. Computer System Analysts 7. Business Operation Specialists 8. Office Supervisors 9. Bookkeepers 10. Marketing Managers
Competitive Advantages and Key Takeaways:

PAGE 70
Our analysis of Scottsdale’s Corporate and Regional Headquarters sector yielded the following key takeaways:
• The Corporate and Regional Headquarters sector is a competitive one in
Scottsdale, employing 4,197 workers. This represents 3.3% of the total
workforce in Scottsdale, a share that is 13% higher than the national
average.
• The majority of the sector’s workforce (94.4%) are employed in Corporate,
Subsidiary, and Regional Managing Offices. Employment in this sector is
8% higher than the national average.
• The sector added 148 new jobs over the last 5 years.
• Scottsdale is home to the headquarters of Godaddy, Axon Enterprise Inc.,
Nationwide Insurance, Honor Health, and Discount Tire Co.

PAGE 71
HOSPITALITY
Overview Tourism is a major industry in Scottsdale. The city is an internationally recognized tourism destination, widely known for its high-class shopping and dining experiences, golf courses, recreational amenities, beautiful weather and high-end resorts. A vibrant downtown area complements the Old-Town western heritage and beautiful open spaces of the McDowell Sonoran Preserve to provide visitors a unique and exciting destination for travel.
NAICS Sector Location Quotient
2019
Employment 2019
% of Sector Employment
2019
New Jobs, 2014-2019
Average Earnings Per Worker 2019
GRP 2019 (Millions)
Hospitality 2.09 8,808 314 $36,703 $763.3
453920 Art Dealers 5.02 195 2.2% -69 $37,612 $23.7
721310 Rooming and Boarding Houses 3.62 96 1.1% 44 $30,047 $46.9
721110 Hotels (except Casino Hotels) and Motels 2.96 7,826 88.9% 297 $35,228 $622.9
561520 Tour Operators 2.78 143 1.6% 37 $42,502 $10.0
561591 Convention and Visitors Bureaus 2.23 40 0.5% 1 $70,290 $4.4
487110 Scenic and Sightseeing
Transportation, Land 2.07 50 0.6% -8 $38,121 $5.8
561599 All Other Travel
Arrangement and Reservation Services
2.07 297 3.4% 0 $62,385 $30.1
712130 Zoos and Botanical Gardens 0.66 45 0.5% 15 $33,039 $2.7
561510 Travel Agencies 0.39 71 0.8% -7 $66,469 $8.1
712110 Museums 0.27 45 0.5% 4 $35,276 $2.9 Note: Grey shading represents sectors with LQ’s greater than the U.S. average; brick shading represents an employment decline. Education and Training:
• 1.3% of essential occupations require a BA or Higher • 64.4% require no prior work experience • 67.6% require some on the job work experience
Top 10 Occupations:
1. General Operations Managers
2. Chefs

PAGE 72
3. Housekeeping Workers
4. Administrative Support Workers
5. Lodging Managers
6. Food Preparation and Servers
7. Cooks
8. Hotel and Deck Clerks
9. Travel Agents
10. Customer Service Representatives
Competitive Advantages and Key Takeaways: Our analysis of Scottsdale’s Hospitality sector yielded the following key takeaways:
• The sector employs more than 8,800 workers, representing almost 7% of Scottsdale’s workforce – a share that is twice the national average.
• The majority of employment in this sector is in Hotels (except Casino Hotels) and Motels, employing almost 89% of the sector’s workers.
• Within the sector, Scottsdale is most competitive in the Art Dealers sector, employing a share that is 5 times the national average. However, the sector has lost 69 jobs in the last 5 years.
• The second most competitive sector is Rooming and Boarding Houses (LQ of 3.62). • Scottsdale has some of the world’s biggest names in hospitality including The Fairmont,
Hyatt, and Four Seasons. The three corporations offer jobs to over 1,700 workers. INSURANCE SERVICES

PAGE 73
ADDITIONAL SECTOR PROFILES
SHARED BUSINESS SERVICES AND DATA HOSTING
Overview
Scottsdale is becoming increasingly known as an emerging center for business services. Its business ecosystem combines successful entrepreneurs with a highly talented workforce. The sector as a whole is evolving from the simple outsourcing of specific business units such as information technology, data processing, or accounts payable to low cost regions, to one where higher level corporate functions are integrated into a global business services model that standardizes approaches across facilities, business units, and geographies. Scottsdale has a strong base of highly skilled professionals to support this industry, together with an excellent climate for data integrity and an attractive quality of life to attract professionals to the city.
NAICS Sector Location Quotient
2019
Employment 2019
% Sector Employment
2019
New Jobs, 2014-2019
Average Earnings Per Worker 2019
GRP 2019 (Millions)
Shared Business
Services and Data Hosting
5.83 19,239 1,875 $54,152 $1,445.9
561330 Professional Employer Organizations 17.72 10,940 56.9% 174 $42,297 $736.8
518210 Data Processing,
Hosting, and Related Services
6.68 3,677 19.1% 628 $95,760 $1,047.6
561422 Telemarketing
Bureaus and Other Contact Centers
3.29 2,442 12.7% 475 $36,964 $114.8
541214 Payroll Services 3.20 916 4.8% 261 $68,946 $92.2
541513 Computer Facilities
Management Services
3.05 401 2.1% 96 $74,743 $47.0
561920 Convention and Trade Show Organizers 3.02 293 1.5% 76 $54,733 $26.7
541990 All Other Professional,
Scientific, and Technical Services
0.83 354 1.8% 55 $55,599 $99.4
541199 All Other Legal Services 0.70 38 0.2% 3 $50,342 $4.1
561210 Facilities Support Services 0.69 178 0.9% 107 $34,921 $14.1
Note: Grey shading represents sectors with LQ’s greater than the U.S. average.

PAGE 74
Education and Training:
• 11.7% of essential occupations require a BA or higher • 46.3% require no prior work experience • 31.2% require some on the job work experience
Top 10 Occupations:
1. Customer Service Representatives 2. Laborers and Freight 3. Personal Care Aides 4. Human Resources Specialists 5. Sales Representatives 6. Office Clerks 7. Telemarketers 8. Computer User Support Specialists 9. Software Developers, Applications 10. Accountants and Auditors
Competitive Advantages and Key Takeaways: Our analysis of Scottsdale’s Shared Business Services and Data Hosting sector yielded the following key takeaways:
• The sector employs more than 19,200 workers, adding almost 11% of
these jobs in the last 5 years.
• More than 15% of Scottsdale’s workers are employed in Shared Business
Services and Data Hosting – a share that is almost 6 times the national
average.
• Scottsdale is most competitive in Professional Employer Organizations,
where this sector employs a share which is almost 18 times the national
average. This is followed by competitiveness in Data Processing, Hosting
and Related Services (LQ of 6.68).
• Major employers in this sector include Favorite Healthcare Staffing Inc.,
Go Daddy Software Inc., and Mindbody. Together, they employ 2,160
workers.
TELECOMMUNICATIONS

PAGE 75
Overview
Communications infrastructure is an important element of an effective functioning economy. Telecommunications have been quickly emerging as a fundamental industry, and the pandemic has only re-enforced that trend, allowing employees to collaborate easily from wherever they are located, remote or local. Scottsdale has distinctive attributes that directly align with the locational requirements of the industry, most importantly, the educated talent.
NAICS Sector Location Quotient
2019
Employment 2019
% of Sector Employment
2019
New Jobs, 2014-2019
Average Earnings Per
Worker 2019
GRP 2019
(Millions)
Telecommunications 3.02 1,412 134 $72,399 $364.0
517919 All Other Telecommunications 12.98 695 49.2% 150 $64,092 $99.6
334220
Radio and Television Broadcasting and Wireless
Communications Equipment Manufacturing
6.49 499 35.3% -141 $76,698 $128.7
515210 Cable and Other Subscription Programming 1.70 146 10.3% 124 $101,727 $90.4
517312 Wireless
Telecommunications Carriers (except Satellite)
0.40 72 5.1% 1 $63,252 $45.4
Note: Grey shading represents sectors with LQ’s greater than the U.S. average; brick shading represents an employment decline. Education and Training:
• 24.0% of essential occupations require a BA or higher • 57.0% require no prior work experience • 31.6% require some on the job work experience
Top 9 Occupations:
1. Customer Service Representatives 2. Telecommunication Equipment Installers 3. Sales Representatives 4. Software Developers, Systems 5. Computer Network Support Specialists 6. Telecommunications Line Installers 7. Electronics Engineers 8. Electrical Finishers 9. Software Developers, Applications
Competitive Advantages and Key Takeaways:
PAGE 76
Our analysis of Scottsdale’s Telecommunications sector yielded the following key takeaways: • The sector employs 1,412 workers, the majority (49%) employed in All
Other Telecommunications.
• Around 1% of Scottsdale’s workers are employed in Telecommunications.
• 0.5% of Scottsdale’s workers are employed in All Other Communications,
a share that is almost 13 times the national average.
• The second most competitive sector in this sector is Radio and Television
Broadcasting and Wireless Communications Equipment Manufacturing
(LQ of 6.49). However, this sector has lost 141 jobs in the 5 years.
• Major employers in this sector include GPS Insight (which moved its
headquarters to Scottsdale in 2013), Cox Arizona Telecom, and Limelight
Networks Inc. Together, these three companies, employ 448 workers.
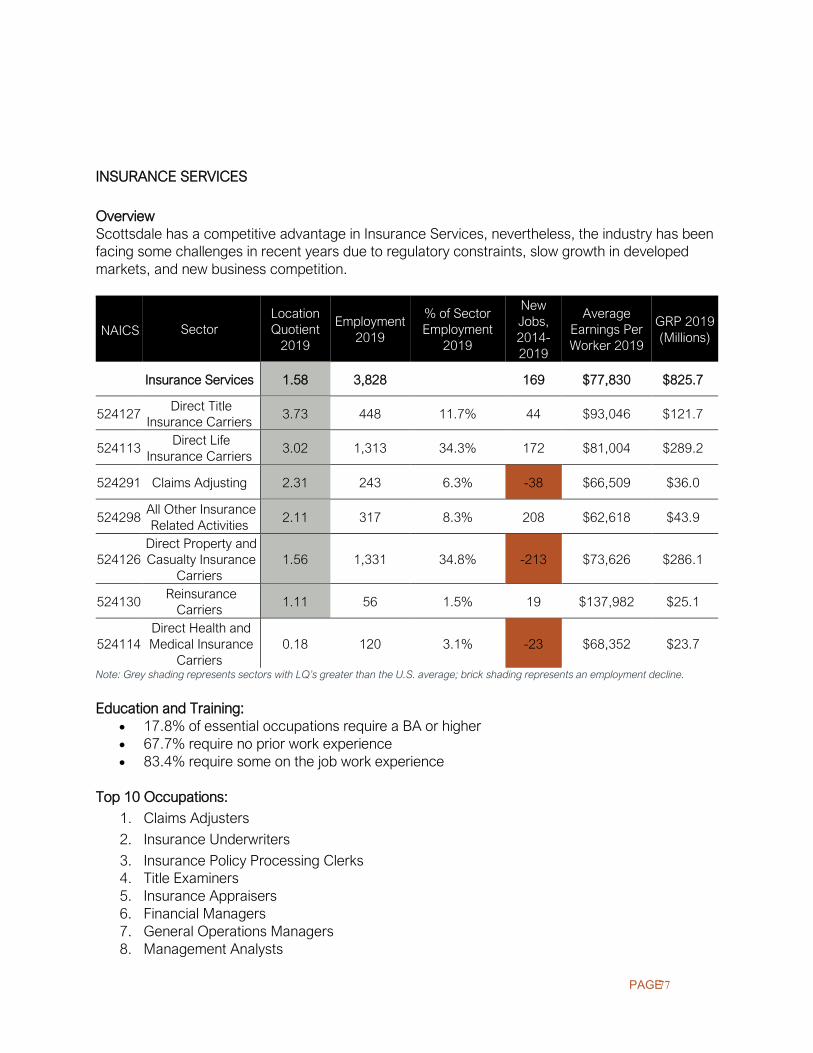
PAGE 77
INSURANCE SERVICES
Overview Scottsdale has a competitive advantage in Insurance Services, nevertheless, the industry has been facing some challenges in recent years due to regulatory constraints, slow growth in developed markets, and new business competition.
NAICS Sector Location Quotient
2019
Employment 2019
% of Sector Employment
2019
New Jobs, 2014-2019
Average Earnings Per Worker 2019
GRP 2019 (Millions)
Insurance Services 1.58 3,828 169 $77,830 $825.7
524127 Direct Title Insurance Carriers 3.73 448 11.7% 44 $93,046 $121.7
524113 Direct Life Insurance Carriers 3.02 1,313 34.3% 172 $81,004 $289.2
524291 Claims Adjusting 2.31 243 6.3% -38 $66,509 $36.0
524298 All Other Insurance Related Activities 2.11 317 8.3% 208 $62,618 $43.9
524126 Direct Property and Casualty Insurance
Carriers 1.56 1,331 34.8% -213 $73,626 $286.1
524130 Reinsurance Carriers 1.11 56 1.5% 19 $137,982 $25.1
524114 Direct Health and Medical Insurance
Carriers 0.18 120 3.1% -23 $68,352 $23.7
Note: Grey shading represents sectors with LQ’s greater than the U.S. average; brick shading represents an employment decline.
Education and Training: • 17.8% of essential occupations require a BA or higher • 67.7% require no prior work experience • 83.4% require some on the job work experience
Top 10 Occupations:
1. Claims Adjusters
2. Insurance Underwriters
3. Insurance Policy Processing Clerks 4. Title Examiners 5. Insurance Appraisers 6. Financial Managers 7. General Operations Managers 8. Management Analysts

PAGE 78
9. Sales Managers 10. Officer Support Staff
Competitive Advantages and Key Takeaways: Our analysis of Scottsdale’s Insurance Services sector yielded the following key takeaways:
• The sector employs more than 3,800 workers, a share that is 58% higher
than the national average.
• Scottsdale is competitive in Direct Title Insurance Carriers (LQ of 3.73),
followed by Direct Life Insurance Carriers (LQ of 3.02).

PAGE 79
AEROSPACE AND DEFENSE Overview Arizona's cloudless skies and overall weather attracted to the state aerospace & defense industry giants. In addition, low taxes, competitive incentives, and eased government regulations have had an impact in developing the sector in the state. Moreover, the outstanding aerospace and engineering programs at the university level have led to Arizona’s top-10 rankings in Department of Defense contracts as well as in A&D manufacturing, aerospace exports and aerospace jobs. However, because of limited land Scottsdale does not have a competitive advantage in this industry. and has been a diminishing industry over the past few years.
NAICS Sector Location Quotient
2019
Employment 2019
% of Sector Employment
2019
New Jobs, 2014-2019
Average Earnings Per Worker 2019
GRP 2019 (Millions)
Aerospace and Defense 0.46 121 -40 $107,298 $34.1
336411 Aircraft Manufacturing 0.03 13 10.7% 1 $105,340 $3.8
334511
Search, Detection, Navigation, Guidance,
Aeronautical, and Nautical System and Instrument
Manufacturing
0.52 108 89.3% -41 $107,049 $30.4
Note: Brick shading represents an employment decline. Education and Training:
• 36.8% of essential occupations require a BA or higher • 54.9% require no prior work experience • 22.8% require some on the job work experience
Top 10 Occupations:
1. Electrical and Electronic Assemblers 2. Software Developers, Systems 3. Assemblers and Fabricators 4. Aerospace Engineers 5. Electrical Engineers 6. Industrial Engineers 7. Inspectors 8. Electronics Engineers 9. Mechanical Engineers 10. Software Developers, Applications
Competitive Advantages and Key Takeaways: Our analysis of Scottsdale’s Aerospace and Defense sector yielded the following key takeaways:

PAGE 80
• The sector is not competitive, employing almost 0.1% of Scottsdale’s
workforce – a share that is 54% less than the national average.
• The sector is also diminishing, where it lost 40 jobs over the last 5 years.
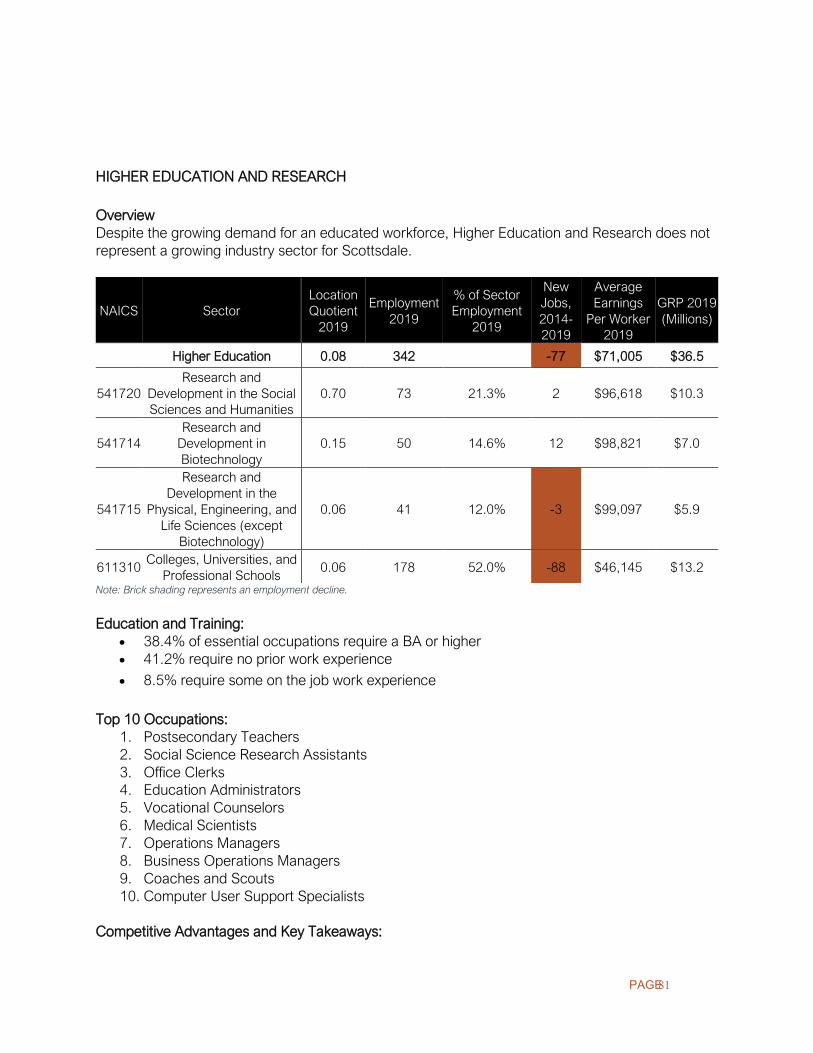
PAGE 81
HIGHER EDUCATION AND RESEARCH Overview Despite the growing demand for an educated workforce, Higher Education and Research does not represent a growing industry sector for Scottsdale.
NAICS Sector Location Quotient
2019
Employment 2019
% of Sector Employment
2019
New Jobs, 2014-2019
Average Earnings
Per Worker 2019
GRP 2019 (Millions)
Higher Education 0.08 342 -77 $71,005 $36.5
541720 Research and
Development in the Social Sciences and Humanities
0.70 73 21.3% 2 $96,618 $10.3
541714 Research and
Development in Biotechnology
0.15 50 14.6% 12 $98,821 $7.0
541715
Research and Development in the
Physical, Engineering, and Life Sciences (except
Biotechnology)
0.06 41 12.0% -3 $99,097 $5.9
611310 Colleges, Universities, and Professional Schools 0.06 178 52.0% -88 $46,145 $13.2
Note: Brick shading represents an employment decline. Education and Training:
• 38.4% of essential occupations require a BA or higher • 41.2% require no prior work experience
• 8.5% require some on the job work experience
Top 10 Occupations:
1. Postsecondary Teachers 2. Social Science Research Assistants 3. Office Clerks 4. Education Administrators 5. Vocational Counselors 6. Medical Scientists 7. Operations Managers 8. Business Operations Managers 9. Coaches and Scouts 10. Computer User Support Specialists
Competitive Advantages and Key Takeaways:
PAGE 82
Our analysis of Scottsdale’s Higher Education and Research sector yielded the following key takeaways:
• The sector is not competitive, employing only 342 workers, the majority
(52%) being employed in Colleges, Universities, and Professional Schools,
a sector which lost 88 jobs in the last 5 years.