economic development tax incentives evaluation act
TRANSCRIPT

STATE OF RHODE ISLAND Governor Gina M. Raimondo
Economic Development Tax Incentives Evaluation Act:
Evaluation of New Qualified Jobs Incentive Act 2015
(R.I. Gen. Laws Chapter 44-48.3) Tax Years 2016 Through 2018
Office of Revenue Analysis March 2, 2021

New Qualified Jobs Incentive Act
Economic Development Tax Incentive Evaluation 2
Table of Contents Foreword ...................................................................................................................................................... 3 Executive Summary .................................................................................................................................... 4 Part I: Introduction .................................................................................................................................... 7 1. Description of the Incentive ........................................................................................................... 8 2. Statutory and Programmatic Goals and Intent of the Tax Incentive ......................................... 9 Part II: Benchmarking and Background ................................................................................................ 11 Part III: Report Data Description ........................................................................................................... 17 1. Number of Taxpayers Granted Tax Incentive ........................................................................... 17 2. Value of Tax Incentive Granted by NAICS Code ...................................................................... 18 3. Cost of Administration ................................................................................................................. 18 4. Number of Aggregate Jobs ........................................................................................................... 19 5. Direct Taxes Paid by Recipients .................................................................................................. 19 6. Direct Taxes Paid by Recipients’ Employees .............................................................................. 19 7. Additional Data Analysis .............................................................................................................. 21
• New Qualified Jobs Incentive Act Program Awardee Characteristics ....................................... 21 • New Qualified Jobs Incentive Act Program Tax Credit Utilizer Characteristics ....................... 29
Part IV: Evaluation of the Economic Impact of the Tax Credit ........................................................... 31 1. Assessment and Five-Year Projection of Revenue ..................................................................... 31 2. Rhode Island Commerce Corporation Economic Impact Analysis .......................................... 32
• Company A (NAICS 335) ............................................................................................................ 32 • Company B (NAICS 42) .............................................................................................................. 33
3. “Breakeven” Cost-Benefit Analysis ............................................................................................. 34 • Introduction to the “Breakeven” Cost-Benefit Analysis Methodology ....................................... 34 • Modeling Costs ........................................................................................................................... 35 • Modeling Benefits ....................................................................................................................... 36 • The “Breakeven” Approach........................................................................................................ 37
Part V: Discussion and Recommendations ............................................................................................. 42 1. Statement by the CEO of the Commerce Corporation .............................................................. 42 2. ORA Recommendations ............................................................................................................... 43 3. ORA Conclusion and Overall Recommendation ....................................................................... 46 APPENDICES ........................................................................................................................................... 49 Appendix A: New Qualified Jobs Incentive Act Application Form ..................................................... 49 Appendix B: Breakdown of Targeted Industries by Specific NAICS Codes ....................................... 59 Appendix C: Agency Groups Breakdown .............................................................................................. 60 Appendix D: Additional Breakeven Scenarios ....................................................................................... 62

New Qualified Jobs Incentive Act
Economic Development Tax Incentive Evaluation 3
Foreword The evaluation of the “New Qualified Jobs Incentive Act” program, Tax Years 2016 through 2018 was prepared at the request of Paul L. Dion, Ph.D., Chief of the Rhode Island Department of Revenue, Office of Revenue Analysis in accordance with Rhode Island General Laws § 44-48.2-4. Madiha Zaffou, Principal Economic and Policy Analyst in the Office of Revenue Analysis was project leader for the production and writing of this report, under the guidance of Mr. Dion. Ms. Zaffou was assisted by Emily Fazio, Senior Economic and Policy Analyst in the Office of Revenue Analysis.
Much of the information needed to complete the analysis contained in this report was provided by the Rhode Island Department of Revenue, Division of Taxation, under the direction of Neena Sinha Savage, State Tax Administrator. The compilation of the data that was provided to the Office of Revenue Analysis was due to the tremendous efforts of Tracy Wunder, Data Analyst III in the Division of Taxation. Tracy was assisted in this task by Donna Dube, Chief Revenue Agent, Forms, Credits and Incentives.
In addition, the Rhode Island Commerce Corporation (CommerceRI), under the direction of Stefan Pryor, Secretary of Commerce, was instrumental in providing information pertaining to the New Qualified Jobs Incentive Act program.
The Office of Revenue Analysis is appreciative of the efforts made by the Division of Taxation and the Rhode Island Commerce Corporation to provide us with the best information available at the time this report was written.
It should be noted that the first version of the New Qualified Jobs Incentive Act evaluation was sent to the Rhode Island Commerce Corporation in June 2020. As a result, much of the information contained in this evaluation was current as of that date. Changes in state law and/or data updates that occurred after June 2020 may not be incorporated into this evaluation despite its 2021 publication date.

New Qualified Jobs Incentive Act
Economic Development Tax Incentive Evaluation 4
Executive Summary This report is an evaluation of the “New Qualified Jobs Incentive Act” program conducted by the Department of Revenue, Office of Revenue Analysis (ORA) in accordance with Rhode Island General Laws Chapter 44-48.2. The report provides an estimate of the economic and fiscal impacts of this tax incentive. ORA relied primarily on data provided by the Department of Revenue, Division of Taxation (Taxation) and the Rhode Island Commerce Corporation (CommerceRI) to conduct the analysis. The following is a summary of this evaluation:
The Tax Incentive Provision:
Under the “New Qualified Jobs Incentive Act” program, a qualifying business may receive a tax credit of up to $2,500 a year for each new full-time job created. A full-time employee is defined as an employee that works at least 35 hours a week and whose wages are subject to personal income tax withholding. The maximum amount of the tax credit can rise to $7,500 a year if the business meets certain criteria. Administered by CommerceRI, the program may provide tax credits to eligible businesses for a period of up to 10 years against the taxes imposed by Rhode Island General Laws Chapters 44-11 (Business Corporation Tax), 44-13 (Public Service Corporation Tax only as it applies to gross earnings), 44-14 (Taxation of Banks), 44-17 (Taxation of Insurance Companies), and 44-30 (Personal Income Tax), provided the eligible business awarded the tax credits maintains the full-time jobs in the state for a period 20% longer than that for which the credits were received. For applications approved by CommerceRI prior to July 1, 2019, the period covered by this incentive evaluation, the amounts of tax credits cannot exceed the reasonable W-2 withholding received by the State in that year for each new full-time job created by the recipient.1 The sunset date of this program is December 31, 2020.2
The Main Goals and Objectives of the Tax Incentive:
The stated goals and objectives of the “New Qualified Jobs Incentive Act” program are to: • Promote the creation of new jobs, attract new business and industry, and stimulate growth
in businesses that are prepared to make meaningful investment and foster job creation in Rhode Island.
• Stimulate business expansion and attraction, create well-paying jobs for Rhode Island’s residents, and generate revenues for necessary state and local governmental services.
The Report’s Key Findings:
• According to the Division of Taxation, two companies received the “New Qualified Jobs Incentive Act” tax benefit over tax years 2017 through 2018, totaling $136,229 in tax credits issued and 74 jobs.
1 For applications approved after July 1, 2019, the amounts of tax credits cannot exceed 75% of the reasonable W-2 withholding. 2 The FY 2021 enacted budget that was signed into law in December 2020 extended the sunset date for the New Qualified Jobs Incentive Act program to June 30, 2021.

New Qualified Jobs Incentive Act
Economic Development Tax Incentive Evaluation 5
• According to the testimony of the Rhode Island Commerce Corporation at the May 2020 Revenue Estimating Conference (REC), a total of 38 companies have been authorized to receive an estimated $66.9 million in tax credits under the “New Qualified Jobs Incentive Act” program over the FY 2017 – FY 2032 period pending actual job creation and performance. As a result, “New Qualified Jobs Incentive Act” tax credit usage is expected to increase substantially in the coming years.
• For the TY 2017 – TY 2018 period, a comparison of the average total credit amount per job and the average taxes paid per job shows that the average total credit amount granted exceeds the average taxes paid by recipient employees in both TY 2017 and TY 2018, as well as on average for the two tax years, and in total over the two tax years.
1. In TY 2017, the average total credit amount per job was $1,386 vs. average taxes paid per job of $562, a difference of $824 more in “New Qualified Jobs Incentive Act” tax credits vs. Rhode Island tax liability. Thus, in TY 2017, the average total credit amount per job received was 146.6% more than average taxes paid per job.
2. In 2018, the average total credit amount per job was $2,134 vs. average taxes paid per job of $1,093, a difference of $1,041 more in “New Qualified Jobs Incentive Act” tax credits vs. Rhode Island tax. Thus, in TY 2018 the average total credit amount per job received was 95.3 % more than average taxes paid per job.
• CommerceRI provided application data for 32 “New Qualified Jobs Incentive Act” awardees for the tax years 2016 through 2018. Of the 32 companies approved for “New Qualified Jobs Incentive Act” tax credits to expand or create jobs in the state, 75% of businesses plan to offer a median wage of less than $75,000 for these jobs. One-half of these businesses plan to create new jobs that pay a median wage between $25,000 and $50,000 and one-half of these businesses will plan to create new jobs that pay a median wage between $50,000 and $75,000. The remaining 25% of businesses awarded New Qualified Jobs Incentive Act tax credits will create new jobs that pay a median wage above $75,000.
• The evaluation of the “New Qualified Jobs Incentive Act” program was conducted using the TY 2018 “New Qualified Jobs Incentive Act” tax credit amount of $96,042 with the assumption that this amount will more accurately reflect the full year cost of the program.
• ORA employed a break-even analysis to estimate the minimum percentage of the jobs created by the tax incentive beneficiaries that would have to be new to the Rhode Island economy, and thus, would not exist without the tax incentive, in order for the program to pay for itself and/or break even.3 ORA estimated these minimum percentages on a net general revenue, gross domestic product, and total employment basis as a means for
3 Regional Economic Models Incorporated’s (REMI) Tax PI model was used to analyze the “New Qualified Jobs Incentive Act” program. This analysis used version 2.3.1 of the REMI Tax-PI model.

New Qualified Jobs Incentive Act
Economic Development Tax Incentive Evaluation 6
determining the employment conditions under which the “New Qualified Jobs Incentive Act” program would pay for itself.4
1. With respect to Rhode Island net general revenues, the “New Qualified Jobs Incentive Act” program breaks even if at least 38.0% of the jobs of the credit recipients are new jobs that exist because of this tax incentive.
2. With respect to Rhode Island Gross Domestic Product, the “New Qualified Jobs Incentive Act” program breaks even if at least 2.0% of the jobs of the credit recipients are new jobs that exist because of this tax incentive.
3. With respect to Rhode Island employment the “New Qualified Jobs Incentive Act” program breaks even if only 2.0% of the jobs of the credit recipients are new jobs that exist because of this tax incentive.
One of the conditions of the New Qualified Jobs Incentive Act program is that businesses that receive tax credits under the program must maintain the agreed upon employment levels for a period 20% longer than the period for which the tax credits are received.5 The breakeven analysis included in this report considers only TY 2018 and does not capture this aspect of the program. One obstacle to such an analysis is not knowing how much in taxes would be paid annually by workers over the periods beyond TY 2018.
The “New Qualified Jobs Incentive Act” program as constructed may be inconsistent with the good tax policy principles of vertical and horizontal equity but less directly than other economic development tax incentives. A discussion of this issue can be found in Part V. Section 3. ORA Conclusion and Overall Recommendation.
4 ORA modeled the “New Qualified Jobs Incentive Act” program as a change to employment and compensation in the recipient companies corresponding industries, under the assumption that without the program, the jobs created by the tax incentive beneficiaries would not exist in Rhode Island 5 For example, a New Qualified Jobs Incentive Act agreement that provides a business with tax credits over a 10-year period requires the business to maintain the jobs that generate the tax credits for 12 years, or 20% longer than the time period over which the tax credits are awarded.

New Qualified Jobs Incentive Act
Economic Development Tax Incentive Evaluation 7
Part I: Introduction
Pursuant to Rhode Island General Laws (R.I. Gen. Laws) § 44-48.2-4, titled Rhode Island Economic Development Tax Incentives Evaluation Act of 2013, the Chief of the Office of Revenue Analysis (ORA) is required to produce, in consultation with the Director of the Economic Development Corporation (now the Rhode Island Commerce Corporation), the Director of the Office of Management and Budget, and the Director of the Department of Labor and Training, a report that contains analyses of economic development tax incentives as listed in R.I. Gen. Laws § 44-48.2-3(1). According to R.I. Gen. Laws § 44-48.2-4(1), the report “[s]hall be completed at least once between July 1, 2014, and June 30, 2017, and no less than once every three (3) years thereafter”.
The additional analysis as required by R.I. Gen. Laws § 44-48.2-4(1) shall include, but not be limited to the following items as indicated in R.I. Gen. Laws § 44-48.2-5(a):
1) A baseline assessment of the tax incentive, including, if applicable, the number of aggregate jobs associated with the taxpayers receiving such tax incentive and the aggregate annual revenue that such taxpayers generate for the state through the direct taxes applied to them and through taxes applied to their employees;
2) The statutory and programmatic goals and intent of the tax incentive, if said goals and intentions are included in the incentive's enabling statute or legislation;
3) The number of taxpayers granted the tax incentive during the previous twelve-month (12) period;
4) The value of the tax incentive granted, and ultimately claimed, listed by the North American Industrial Classification System (NAICS) Code associated with the taxpayers receiving such benefit, if such NAICS Code is available;
5) An assessment and five-year (5) projection of the potential impact on the state's revenue stream from carry forwards allowed under such tax incentive;
6) An estimate of the economic impact of the tax incentive including, but not limited to: i. A cost-benefit comparison of the revenue forgone by allowing the tax incentive
compared to tax revenue generated by the taxpayer receiving the credit, including direct taxes applied to them and taxes applied to their employees;
ii. An estimate of the number of jobs that were the direct result of the incentive; and iii. A statement by the Chief Executive Officer of the Commerce Corporation, as to
whether, in his or her judgment, the statutory and programmatic goals of the tax benefit are being met, with obstacles to such goals identified, if possible;
7) The estimated cost to the state to administer the tax incentive if such information is available;
8) An estimate of the extent to which benefits of the tax incentive remained in state or flowed outside the state, if such information is available;
9) In the case of economic development tax incentives where measuring the economic impact is significantly limited due to data constraints, whether any changes in statute would facilitate data collection in a way that would allow for better analysis;

New Qualified Jobs Incentive Act
Economic Development Tax Incentive Evaluation 8
10) Whether the effectiveness of the tax incentive could be determined more definitively if the General Assembly were to clarify or modify the tax incentive's goals and intended purpose;
11) A recommendation as to whether the tax incentive should be continued, modified, or terminated; the basis for such recommendation; and the expected impact of such recommendation on the state's economy;
12) The methodology and assumptions used in carrying out the assessments, projections and analyses required pursuant to subdivisions (1) through (8) of this section.
The current report is one part of a series of reports for each one of the tax credits to be analyzed according to R.I. Gen. Laws § 44-48.2-3(1). This report concerns R.I. Gen. Laws § 44-48.3 entitled “New Qualified Jobs Incentive Act” (NQJIA) and measures the economic impact associated with the tax incentive during tax years 2016 through 2018. This analysis is performed at the micro level using information provided by Taxation. This report is divided into five sections. Section I provides a detailed description of the tax incentive and its statutory programmatic goals and intent. Section II presents some background regarding this tax incentive. Section III presents a description of the data provided and used in the analysis by ORA. Section IV assesses the economic impact generated under the NQJIA program. Section V discusses relevant policy recommendations that could help in the decision process as to whether the tax credit should be continued, modified, or terminated.
1. Description of the Incentive The New Qualified Jobs Incentive Act program provides a tax credit against the business corporation tax (R.I. Gen. Laws Chapter 44-11), the public service corporation tax (R.I. Gen. Laws Chapter 44-13), the taxation of banks (R.I. Gen. Laws Chapter 44-14), the taxation of insurance companies (R.I. Gen. Laws Chapter 44-17), and the personal income tax (R.I. Gen. Laws Chapter 44-30) to qualifying businesses for each new full-time job created. The minimum number of new full-time jobs required for an applicant to be eligible for this tax credit is:
• At least 10 new full-time jobs for a business operating in a targeted industry that employs at most 100 employees
• At least 10% of the business’s existing total employment or at least 100 new full-time jobs for a business operating in a targeted industry that employs more than 100 employees.
• At least 20 new full-time jobs for a business operating in a non-targeted industry that employs at most 200 employees.
• At least 10% of the business’s existing total employment or at least 100 new full-time jobs for a business operating in a non-targeted industry that employs more than 200 employees.
Each full-time employee must work at least 35 hours a week and must have wages that are subject to personal income tax withholding. The targeted industries under the New Qualified Jobs Incentive Act program are: Biomedical Innovation, IT/Software, Cyber-Physical Systems, Data Analytics, Defense Shipbuilding and Maritime, Advanced Business Services, Design, Food, and

New Qualified Jobs Incentive Act
Economic Development Tax Incentive Evaluation 9
Custom Manufacturing, Transportation, Distribution, and Logistics, and Arts, Education, Hospitality, and Tourism.6
Administered primarily by the Rhode Island Commerce Corporation (CommerceRI), the base amount of this tax credit is $2,500 annually per eligible position, however, the credit can go up to $7,500 annually per eligible position if the business is located in a Hope Community7; or if the business is in a targeted industry; or if the business is located within a transit oriented development area8; or if the business is an out-of-state business but relocating one or more of its units to Rhode Island.
For applications approved by CommerceRI prior to July 1, 2019, the amounts of tax credits cannot exceed the reasonable W-2 withholding received by the State in that year for each new full-time job created by the recipient.9 If the amount of the tax credit exceeds the business's total tax liability for the year in which the credit is allowed, the excess amount may be carried forward and applied against the taxes imposed for the succeeding four years. In addition, the tax credit can be redeemed for cash in whole or in part for 90% of the value of the tax credit.
When applying for the New Qualified Jobs Incentive Act, a business’s Chief Executive Officer or an equivalent officer shall attest under oath that:
• any projected creation of new full-time jobs would not occur, or would not occur in the state of Rhode Island, but for the provision of tax credits under the program;
• the business will create new full-time jobs in an amount equal to or greater than what is required;
• information submitted to the commerce corporation is accurate and complete. Furthermore, The New Qualified Jobs Incentive Act includes “claw back” provisions in case a business fails to live up to its job creation promises which may result in CommerceRI revoking any award of tax credits in their entirely and, under certain circumstances, requiring the payment to the State of up to 20% of all tax benefits granted calculated from the date of the incentive agreement entered into by the business and CommerceRI. The program is set to sunset on December 31, 2020.10 An application form for this program is attached in Appendix A.
2. Statutory and Programmatic Goals and Intent of the Tax Incentive According to on R.I. Gen. Laws § 44-48.3-2, the general assembly finds and declares that:
6 https://commerceri.com/incentives/tax-credits-and-financing/ 7 R.I. Gen. Laws § 44-48.3-3(8) defines a Hope Community as “municipalities with a percentage of families below the poverty level that is greater than the percentage of families below the poverty level for the state as a whole as determined by the United States Census Bureau's most recent American Community Survey.” 8 R.I. Gen. Laws § 44-48.3-3(16) defines a transit oriented development area as “an area in proximity to mass-transit infrastructure including, but not limited to, an airport, rail or intermodal facility that will be further defined by regulation of the commerce corporation in consultation with the Rhode Island department of transportation.” 9 For applications approved after July 1, 2019, the amounts of tax credits cannot exceed 75% of the reasonable W-2 withholding. 10 The FY 2021 enacted budget (2020 H-7171 Substitute A) signed into law by Governor Raimondo on December 18, 2020 extended the sunset date for this economic development tax incentive to June 30, 2021.

New Qualified Jobs Incentive Act
Economic Development Tax Incentive Evaluation 10
a) Due to long-term and short-term negative economic trends in Rhode Island, businesses in the state have found it difficult to make investments that would stimulate economic activity and create new jobs. This situation has contributed to a rate of unemployment in Rhode Island that is higher than our neighbors and among the highest in the nation. Consequently, a need exists to promote the creation of new jobs, attract new business and industry, and stimulate growth in businesses that are prepared to make meaningful investment and foster job creation in Rhode Island.
b) Through the establishment of a jobs incentive program, Rhode Island can take steps to stimulate business expansion and attraction, create well-paying jobs for its residents, and generate revenues for necessary state and local governmental services.

New Qualified Jobs Incentive Act
Economic Development Tax Incentive Evaluation 11
Part II: Benchmarking and Background The benchmarking and background section provides information useful for understanding how the New Qualified Jobs Incentive Act program functions and the economic environment in which it operates. This section provides some information on the availability of similar tax incentives in neighboring states, as well as discussion of local economic factors that may be related to the program. Where appropriate, this section provides data on Rhode Island, other New England states, and the United States. Data generally are compiled from public sources such as the U.S. Department of Labor, Bureau of Labor Statistics, U.S. Department of Commerce, Census Bureau and the U.S. Department of Treasury, Internal Revenue Service.
The federal government offers the Work Opportunity Tax Credit to employers for hiring individuals from certain targeted groups who have consistently faced significant barriers to employment.11 In 2010, a limited Job Creation Tax Credit (JCTC) was part of the Hiring Incentives to Restore Employment (HIRE) Act, which allowed employers to take a payroll tax credit equal to the employer portion of the Social Security Tax, which is 6.2% of wages, when they hired certain new employees after February 3, 2010 and before January 1, 2011. 12 In addition, employers received a general business income tax credit equal to the lesser of $1,000 or 6.2% of wages paid to the new employee over the 52-week period, if the employer continued to employ the new hire for at least 52 weeks. A second JCTC was part of President Obama’s 2011 proposed American Jobs Act that would have offered a tax credit of $4,000 for hiring long-term unemployed workers, defined as those who have been out of work for more than six months, but the legislation was not passed by Congress.
According to a 2016 study by the Federal Reserve Bank of San Francisco13 nearly half of U.S. states have enacted permanent, broad-based job creation tax credits since 1995, with many of these states located in the eastern United States.14 All states in New England have offered some type of incentive to employers for creating new jobs in the state.
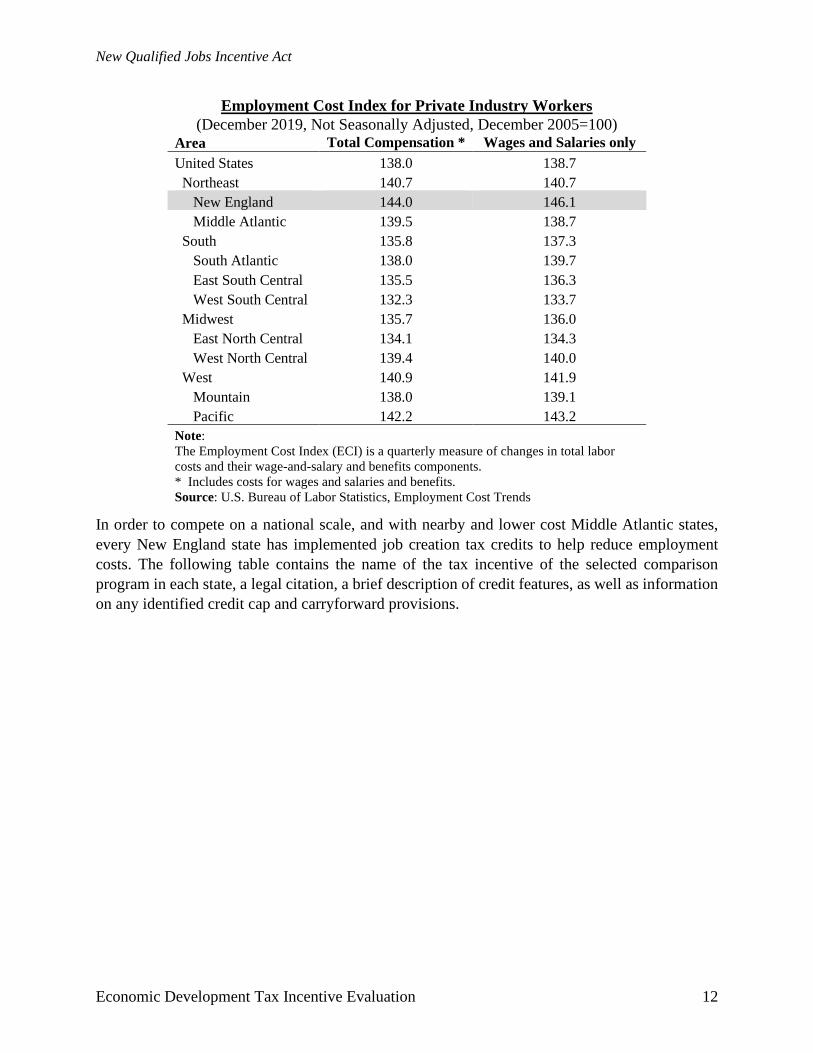
The Employment Cost Index (ECI) is a quarterly economic measure detailing the changes in the costs of labor for businesses in the United States. As is evident from the table below, New England has the highest ECI for total compensation, which includes wages and salaries and benefits (i.e., paid leave, supplementary pay, insurance, retirement and savings and legally required benefits). The higher ECI is largely driven by wages and salaries, which is similarly elevated in New England.
11 This tax credit is different from the New Qualified Jobs Incentive Act program offered by Rhode Island, which aims to encourage the creation of new jobs without regard to the individuals that may fill those jobs. 12 Eligible employees were those who have either been unemployed for at least 60 days prior to hire or worked fewer than 40 hours for another employer during the previous 60 days; earn less than $106,000 per year; are not related to the employer; and do not displace a current employee. 13 Chirinko, Robert S., Daniel J. Wilson. 2016. “Job Creation Tax Credits, Fiscal Foresight, and Job Growth: Evidence from U.S. States.” Federal Reserve Bank of San Francisco Working Paper 2010-25. https://www.frbsf.org/economic-research/publications/working-papers/2010/25/ 14 Connecticut, Georgia, Illinois, Indiana, Maine, Maryland, Massachusetts, Michigan, North Carolina, Ohio, Pennsylvania, Rhode Island, Tennessee, Vermont, Virginia, and West Virginia.
New Qualified Jobs Incentive Act
Economic Development Tax Incentive Evaluation 12
Employment Cost Index for Private Industry Workers (December 2019, Not Seasonally Adjusted, December 2005=100)
Area Total Compensation * Wages and Salaries only United States 138.0 138.7 Northeast 140.7 140.7 New England 144.0 146.1 Middle Atlantic 139.5 138.7 South 135.8 137.3 South Atlantic 138.0 139.7 East South Central 135.5 136.3 West South Central 132.3 133.7 Midwest 135.7 136.0 East North Central 134.1 134.3 West North Central 139.4 140.0 West 140.9 141.9 Mountain 138.0 139.1 Pacific 142.2 143.2 Note: The Employment Cost Index (ECI) is a quarterly measure of changes in total labor costs and their wage-and-salary and benefits components. * Includes costs for wages and salaries and benefits. Source: U.S. Bureau of Labor Statistics, Employment Cost Trends
In order to compete on a national scale, and with nearby and lower cost Middle Atlantic states, every New England state has implemented job creation tax credits to help reduce employment costs. The following table contains the name of the tax incentive of the selected comparison program in each state, a legal citation, a brief description of credit features, as well as information on any identified credit cap and carryforward provisions.

New Qualified Jobs Incentive Act
Economic Development Tax Incentive Evaluation 13
New Qualified Jobs Incentive Act in Rhode Island and Selected Comparison States Rhode Island Connecticut Maine Massachusetts New Hampshire Vermont Credit Name New Qualified Jobs
Incentive Act Job Expansion Tax Credit
Jobs and Investment Tax Credit
Economic Development Incentive Program Credit
Coos County Job Creation Tax Credit
Vermont Employment Growth Incentive Program
Statutory Reference
R.I. Gen. Laws Chapter 44-48.3
Conn. Gen. Stat. §12-217pp
Me. Rev. Stat. Ann tit. 36, §5215
Mass. Gen. Laws ch. 63, § 38N and Mass. Gen Laws ch 23A, § 3C
NH Rev Stat § 77-E:3-c 32 V.S.A. chapter 105 §3325-3342
Credit Features
Eligible businesses that create new full-time jobs in either a targeted industry or non-targeted industry can claim this credit.
An eligible taxpayer may be allowed a credit for each new, qualifying or veteran employee hired after January 1, 2012, and prior to January 1, 2014.
A taxpayer that makes a qualified investment of at least $5,000,000 in ME may claim this credit if at least 100 new jobs are attributable to the investment in the 24-month period following the date the property was placed in service.
Businesses designated as certified job creation projects may receive a credit of up to $5,000 per job created.
Businesses that locate or expand in Coos County may claim a tax credit for newly created jobs with an hourly wage of at least 150% of the state minimum hourly wage.
This incentive provides cash payments to authorized businesses who meet performance requirement. An economic model calculates the revenue benefits and costs to the State to determine the total amount of incentive.
Cap From $2,500 annually, up to $7,500 annually, but shall not exceed 75% of the reasonable W-2 withholding received by RI for each new full-time job created
$500 per month for each new employee, or $900 per month for each qualifying or veteran employee
Up to $500,000 or the total amount of tax liability otherwise due
Up to $5,000 per job created but the maximum credit allowed in a tax year cannot exceed 50% of the tax liability
$750 per job, per year for newly created jobs with an hourly wage of at least 150% of the state minimum hourly wage or $1,000 per job, for jobs with an hourly wage of at least 200% of the state minimum hourly wage
The value of each payment is based on the revenue return generated to the State by prospective qualifying jobs, payroll creation, and capital investments
Carryforward Up to 4 years None Up to 7 years Up to 10 years, but not more than 5 years after the project’s certification ends
Up to 5 years None
Source: http://webserver.rilin.state.ri.us/Statutes/TITLE44/44-48.3/INDEX.HTM
https://www.cga.ct.gov/current/pub/chap_208.htm#sec_12-217kk
https://legislature.maine.gov/statutes/36/title36sec5215.html
https://malegislature.gov/Laws/GeneralLaws/PartI/TitleIX/Chapter63/Section38N and https://malegislature.gov/Laws/GeneralLaws/PartI/TitleII/Chapter23A/Section3C
http://www.gencourt.state.nh.us/rsa/html/V/77-E/77-E-3-c.htm
https://legislature.vermont.gov/statutes/chapter/32/105
Note: Credit characteristics reflects current policy as identified by ORA in January 2020. This table presents a single comparison credit program for each comparison state determined by ORA to be most like the Rhode Island New Qualified Jobs Incentive Act.

New Qualified Jobs Incentive Act
Economic Development Tax Incentive Evaluation 14
The table reveals that all comparison states offer some type of credit aimed at reducing the marginal cost of labor to incite job creation that might otherwise take place in other states or on a smaller scale. The longer carryforward terms Massachusetts and Maine reflect the fact that these states are also targeting capital investment. It is also interesting to note that many states include a provision that the value of the credit cannot exceed the tax liability otherwise due as protection against revenue loss.
Employment in Rhode Island has recovered from losses during the 2007-2009 recession, surpassing its prerecession peak in mid-2017. Since the recovery in Rhode Island began around mid-2010, year-over-year job growth has averaged 1.0%, slightly below its average from 1993 to 2007.
Over the last nine years, Rhode Island employment growth has consistently underperformed regional peers such as Massachusetts but has fared better against Connecticut, particularly since 2012. However, job gains have kept pace with the regional average. The New Qualified Jobs Incentive Act program may help to support stronger job growth in the state by encouraging more hiring in the near-term.
Sturdy employment gains, in addition to a tightening labor market, have translated into stronger wage growth. In Rhode Island, growth in average hourly earnings for all private employees since 2010 has outpaced growth in Connecticut, New Hampshire and Vermont, and is only slightly below the national average. Rhode Island average hourly earnings did not perform as well in the 2015 to 2019 period but was not far behind growth in New Hampshire and outpaced earnings growth in Vermont.
-5.0%
-4.0%
-3.0%
-2.0%
-1.0%
0.0%
1.0%
2.0%
3.0%
2005 2006 2007 2008 2009 2010 2011 2012 2013 2014 2015 2016 2017 2018 2019 2020
Total Non-Farm Employment4-qrt moving average, Year-ago percent change
(2005Q1 - 2020Q1)
Rhode Island Massachusetts
Connecticut New England
Source: U.S. Bureau of Labor Statistics

New Qualified Jobs Incentive Act
Economic Development Tax Incentive Evaluation 15
Growth in Average Hourly Earnings of All Private Employees (Dollars per Hour, Percent Change)
Time Range Rhode Island Massachusetts Connecticut
New Hampshire Vermont Maine U.S.
2010-2019 25.5% 29.2% 20.1% 21.0% 14.1% 29.4% 26.2% 2015-2019 12.0% 15.8% 16.6% 12.2% 10.5% 15.0% 14.3% Source: U.S. Bureau of Labor Statistics
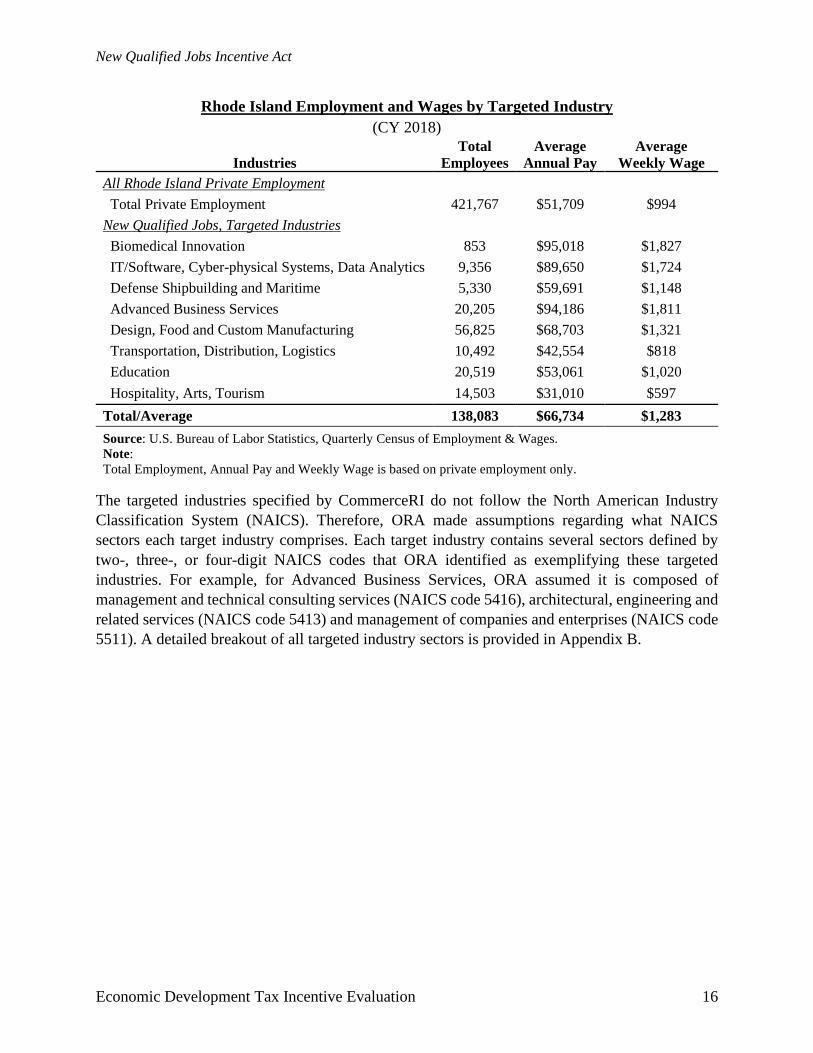
The New Qualified Jobs Incentive Act program is designed to give priority to specific targeted industries,15 and allows a higher credit amount for jobs created in industrial design16 and scientific research and development.17 Many of the targeted industries pay an above average wage, which could help to boost wage growth and attract workers to the state.
The table below shows that industries such as biomedical innovation, and advanced business services garner above average wages compared to the average wages paid in total private employment in Rhode Island. The transportation, distribution and logistics industry, as well as hospitality, arts and tourism, pay a below average wage, but developing these important industries can help to attract new businesses and people to the state by cultivating a more advanced logistical network and expanding local amenities.
15 “Targeted industry” means any advanced, promising or otherwise prioritized industry identified in the economic development vision and policy promulgated under R.I. Gen. Laws § 42-64.17-1 or, until such time as any such economic development vision and policy is promulgated, as identified by the Corporation from time-to-time and published on the Corporation’s website. 16 “Industrial design” means the profession of designing products to optimize the function, value, and appearance for the benefit of the user of the product and/or the manufacturer or creator of the product. 17 “Scientific research and development” means conducting research and experimental development in the physical, engineering, and life sciences, including but not limited to agriculture, electronics, biology, botany, biotechnology, computers, chemistry, food, fisheries, forests, geology, health, manufacturing, mathematics, medicine, oceanography, pharmacy, physics, veterinary, and other allied subjects.
New Qualified Jobs Incentive Act
Economic Development Tax Incentive Evaluation 16
Rhode Island Employment and Wages by Targeted Industry (CY 2018)
Industries Total
Employees Average
Annual Pay Average
Weekly Wage All Rhode Island Private Employment
Total Private Employment 421,767 $51,709 $994 New Qualified Jobs, Targeted Industries
Biomedical Innovation 853 $95,018 $1,827 IT/Software, Cyber-physical Systems, Data Analytics 9,356 $89,650 $1,724 Defense Shipbuilding and Maritime 5,330 $59,691 $1,148 Advanced Business Services 20,205 $94,186 $1,811 Design, Food and Custom Manufacturing 56,825 $68,703 $1,321 Transportation, Distribution, Logistics 10,492 $42,554 $818 Education 20,519 $53,061 $1,020 Hospitality, Arts, Tourism 14,503 $31,010 $597 Total/Average 138,083 $66,734 $1,283 Source: U.S. Bureau of Labor Statistics, Quarterly Census of Employment & Wages. Note: Total Employment, Annual Pay and Weekly Wage is based on private employment only.
The targeted industries specified by CommerceRI do not follow the North American Industry Classification System (NAICS). Therefore, ORA made assumptions regarding what NAICS sectors each target industry comprises. Each target industry contains several sectors defined by two-, three-, or four-digit NAICS codes that ORA identified as exemplifying these targeted industries. For example, for Advanced Business Services, ORA assumed it is composed of management and technical consulting services (NAICS code 5416), architectural, engineering and related services (NAICS code 5413) and management of companies and enterprises (NAICS code 5511). A detailed breakout of all targeted industry sectors is provided in Appendix B.
New Qualified Jobs Incentive Act
Economic Development Tax Incentive Evaluation 17
Part III: Report Data Description
The analysis of the New Qualified Jobs Incentive Act in this report required an analysis of micro-level taxpayer data. ORA has encountered some challenges in the past related to data access. In order to gain access to data while respecting confidentiality concerns, ORA entered into Memoranda of Understanding (MOU) with the Rhode Island Department of Revenue, Division of Taxation (Taxation), Rhode Island Department of Labor and Training (DLT), and Rhode Island Commerce Corporation (CommerceRI). These MOUs sought to preserve the confidentiality of individually identifiable taxpayers consistent with the statutory mandates regarding secrecy and confidentiality of taxpayer information. In this context, ORA relied on data provided by credit recipients to Taxation for tax years 2016, 2017, and 2018, to the extent such information were provided, as required by Rhode Island General Law § 44-48.2-5(b). The data provided to ORA consisted of the following:
Tax credit amounts used by credit recipients provided by Taxation for tax years 2016 through 2018;
New Qualified Jobs Incentive Act applications provided by CommerceRI; Withholding tax payment records on file provided by Taxation in each tax year subject to
the current analysis; Cost of administration of the tax incentive provided by Taxation and CommerceRI.
ORA made no attempt to verify the accuracy of the data provided and made minimal corrections to the data in order to be able to execute specific calculations for the report. The data included in this report are unaudited and reported as compiled.
The focus of this report is on the period encompassing tax years 2016 through 2018. Some tables include additional data outside this period when additional years of data were available and where ORA determined these additional data to be informative, timely, and reliable.
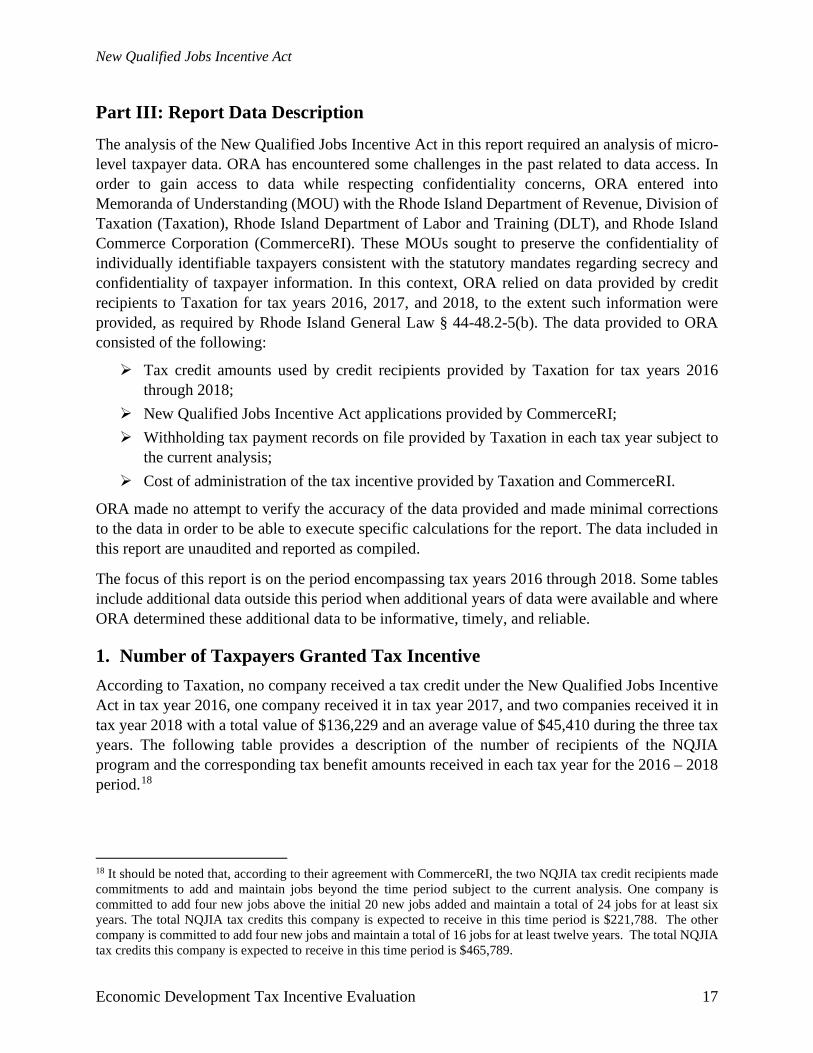
1. Number of Taxpayers Granted Tax Incentive According to Taxation, no company received a tax credit under the New Qualified Jobs Incentive Act in tax year 2016, one company received it in tax year 2017, and two companies received it in tax year 2018 with a total value of $136,229 and an average value of $45,410 during the three tax years. The following table provides a description of the number of recipients of the NQJIA program and the corresponding tax benefit amounts received in each tax year for the 2016 – 2018 period.18
18 It should be noted that, according to their agreement with CommerceRI, the two NQJIA tax credit recipients made commitments to add and maintain jobs beyond the time period subject to the current analysis. One company is committed to add four new jobs above the initial 20 new jobs added and maintain a total of 24 jobs for at least six years. The total NQJIA tax credits this company is expected to receive in this time period is $221,788. The other company is committed to add four new jobs and maintain a total of 16 jobs for at least twelve years. The total NQJIA tax credits this company is expected to receive in this time period is $465,789.

New Qualified Jobs Incentive Act
Economic Development Tax Incentive Evaluation 18
New Qualified Jobs Incentive Act Recipients (Tax Years 2016 – 2018)
Tax Year
Number of Recipients
Total Benefit Received
2016 0 $0 2017 1 $40,187 2018 2 $96,042 Total 2 $136,229 Average 1 $68,115 Source: Division of Taxation Note: The total number of recipients represents the sum of distinct companies receiving the credit in tax years 2016 through 2018.
Due to the ramping up of the program in TY 2017, ORA used the TY 2018 figure of $96,042 to model the economic and fiscal impact of the program. ORA assumed that this will better reflect the full year impact of the program more accurately for the TY 2016 – TY 2018 period.
2. Value of Tax Incentive Granted by NAICS Code During tax years 2016 through 2018, the total amount of the NQJIA tax benefit used was $136,229. ORA matched each recipient firm to its corresponding industry code according to the North American Industry Classification System (NAICS). The following table depicts the amount of the NQJIA tax benefit received by firms in each industry during tax years 2016 through 2018:
New Qualified Jobs Incentive Act Amount by NAICS Industry (Tax Years 2016 – 2018)
Industry Description (NAICS Code) Three-Year Total Electrical equipment, appliance, and component manufacturing (335) $85,357 Wholesale Trade (42) $50,871 All Industries $136,229 Source: Assignment of beneficiary firms into NAICS classifications based on data provided by the Division of Taxation.
In the tax years 2016 through 2018, recipients of the New Qualified Jobs Incentive Act credit operated in the electrical equipment, appliance, and component manufacturing industry and wholesale trade industry. Over the three tax years, recipient firms in the electrical equipment, appliance, and component manufacturing industry have received a total benefit of $85,357. In the same time period, recipients in the wholesale trade industry have received a total of $50,871.
3. Cost of Administration ORA surveyed Taxation and CommerceRI to ascertain the cost for the administration of the New Qualified Jobs Incentive Act. The table below provides information on the cost incurred by both entities during tax years 2016 through 2018 to administer this tax incentive.

New Qualified Jobs Incentive Act
Economic Development Tax Incentive Evaluation 19
“New Qualified Jobs Incentive Act” Cost of Administration (Tax Years 2016 – 2018)
Cost-Incurring Entity TY 2016 TY 2017 TY 2018 Total Average Taxation * $ 1,634 $ 1,634 $ 6,537 $ 9,805 $ 3,268 CommerceRI $106,839 $215,659 $141,501 $463,999 $154,666 Total $108,473 $217,293 $148,038 $473,804 $157,935 Source: Division of Taxation and Rhode Island Commerce Corporation. Note: * Taxation did not track hours spent on the administration of the NQJIA program for Tax Years 2016 and 2017. If
an estimate is necessary, a reasonable assumption is that the Division of Taxation spent at least 25% of the estimate reported for Tax Year 2018 (Tax Year 2018 estimate is comprehensive).
4. Number of Aggregate Jobs Based on wages and employment data submitted by the New Qualified Jobs Incentive Act recipients to Taxation, ORA was able to compile the total number of employees for each recipient firm. The following table provides a description of the employment under the NQJIA program in tax years 2016 through 2018 by residency status:
Employees of NQJIA-Beneficiary Firms: Identified Tax Filings by Residency Status
(Tax Years 2016 – 2018) Residency TY 2016 TY 2017 TY 2018 Total Rhode Island 0 8 19 19 Out of State 0 21 26 26 Total Employees Reported 0 29 45 45 Source: Division of Taxation
Recipients of the incentive added 29 new employees in 2017 and 16 new employees in 2018, for a total of 45 new employees in the state of Rhode Island over the course of two years. Of these newly hired employees, 42.2% are Rhode Island residents and 57.8% resided outside of Rhode Island in TY 2018.
5. Direct Taxes Paid by Recipients
Due to statutory confidentiality mandates under R.I. Gen. Laws §§ 44-1-14, 44-19-30, 44-11-21, 44-14-23 and 44-30-95(c) and the risk of disclosure of taxpayer information, the Division of Taxation is unable to approve disclosure of information by ORA as required by R.I. Gen. Laws § 44-48.2-5(a)(1) as it pertains to the “the aggregate annual revenue that such taxpayers generate for the state through the direct taxes applied to them.”
6. Direct Taxes Paid by Recipients’ Employees Taxation provided ORA with data on personal income tax (PIT) paid by all the employees of the NQJIA beneficiary firms for tax years 2016 through 2018. The following table describes the breakdown of this information by taxpayer’s residency status.

New Qualified Jobs Incentive Act
Economic Development Tax Incentive Evaluation 20
New Qualified Jobs Incentive Act Personal Income Taxes Paid by Recipients
(Tax Years 2016 – 2018) TY 2016 ⁑ TY 2017 TY 2018 Average RI Residents
Count of Taxpayers 0 8 19 14 Taxes Paid * $0 $2,709 $18,602 $10,656 Avg Taxes Paid $0 $339 $979 $659 RI Non-Residents
Count of Taxpayers 0 21 26 24 Taxes Paid ^ $0 $13,588 $30,586 $22,087 Avg Taxes Paid $0 $647 $1,176 $912 Total
Count of Taxpayers 0 29 45 37
Taxes Paid $0 $16,297 $49,188 $32,743 Avg Taxes Paid $0 $562 $1,093 $828 Source: Division of Taxation Note: ⁑ No recipients in 2016 * Taxes Paid for RI Residents are calculated by dividing the Federal AGI by Wage data for the employees of the Credit Recipients and applying the calculated ratio to "Total tax and Contributions" minus "Property Tax Credit" minus "RI earned income credit" minus "Lead Pain Credit" ^ Taxes Paid for Non-Residents are calculating by dividing the Federal AGI by Wage data for the employees of the Credit Recipients and applying the calculated ratio to "Total Tax and Contributions" minus "RI earned income credit"
Using the information above on the total amount NQJIA credits received and the total number of jobs created that generated these NQJIA tax credit amounts, ORA calculated the average NQJIA total credit amount per job:
New Qualified Jobs Incentive Act Average Total Credit Amount per Recipient
(Tax Years 2016 – 2018) TY 2016 ⁑ TY 2017 TY 2018 Average Total
Count of Taxpayers 0 29 45 37 Total Amount 0 $40,187 $96,042 $68,115 Average Amount 0 $1,386 $2,134 $1,760 Source: Division of Taxation
A comparison of the average total credit amount per job and the average taxes paid per job shows that the average total credit amount granted exceeds the average taxes paid by recipient employees in each year, as well as on average for the two tax years and in total over the two tax years. For

New Qualified Jobs Incentive Act
Economic Development Tax Incentive Evaluation 21
example, in TY 2017, the average total credit amount per job was $1,386 vs. average taxes paid per job of $562, a difference of $824 more in NQJIA tax credits vs. Rhode Island tax liability. In TY 2018, the same figures are $2,134, $1,093 and $1,041, respectively. Thus, in TY 2017, the average total credit amount per job received was 146.6% more than average taxes paid per job. In TY 2018 the average total credit amount per job received was 95.3 % more than average taxes paid per job.
7. Additional Data Analysis • New Qualified Jobs Incentive Act Program Awardee Characteristics
The sections above discuss NQJIA tax credit recipients. However, not all business that were awarded the New Qualified Jobs Incentive Act tax credit have claimed the credit. As of the May 2020 Revenue Estimating Conference, a total of 38 businesses had received initial approval for the receipt of NQJIA tax credits, but eight of these awardees had made insufficient progress with respect to their incentive agreements and have had their NQJIA tax credit awards withdrawn.19 A complete list of New Qualified Jobs Incentive Act tax credit awardees is presented below:
Project Name Total Tax Credit Amount Projected Number of Jobs Infinity Meat Solutions, LLC. $9,484,000 702 Infosys Limited $8,500,000 500 Immunex RI Corporation $6,000,000 146 General Electric Company $4,591,700 300 Johnson & Johnson Services, Inc. $4,425,860 75 Rubius Therapeutics, Inc. $3,715,000 154 Ocean State Jobbers, Inc. $3,230,190 125 eMoney Holdings, LLC $3,162,196 100 Virgin Pulse, Inc. $2,546,212 292 VistaPrint Corporate Solutions, Inc. $2,244,546 125 Magellan HRSC, Inc. $2,138,660 75 GEV $1,930,000 123 United Natural Foods, Inc. $1,873,802 150 smartShift $1,693,500 43 Finlay Extracts & Ingredients USA, Inc. $1,354,105 73 Collette Travel Service, Inc. $1,300,000 50 iXblue Defense Systems, Inc. $1,032,000 22 Gotham Greens Holdings, LLC $934,610 68 Boston Energy $866,250 52 Aretec $800,000 40 Granite Telecommunications, LLC $779,464 50 RESH $735,000 41 Response Tech $675,000 37 Custom & Miller Box $612,000 42 SenTec $518,250 17 Change Healthcare $480,000 27
19 Based on records kept by the Office of Management and Budget that are accessible to the Office of Revenue Analysis, the Rhode Island Commerce Corporation did not provide updated written testimony on the New Qualified Jobs Incentive Act program.

New Qualified Jobs Incentive Act
Economic Development Tax Incentive Evaluation 22
Project Name Total Tax Credit Amount Projected Number of Jobs Surplus Solutions, LLC(3) $465,789 16 Alliance Paper Company, Inc. $296,790 20 Advertising Ventures $260,000 10 Lexington Lighting Group, LLC(4) $221,788 24 Agoda Travel Operations USA, Inc.(1) - 200 AT Cross Company(1) - 35 Epiq Systems, Inc.(2) - 25 Greystone of Lincoln, Inc. - 25 Ivory Ella, LLC. - 30 Trade Area Systems, Inc.(1) - 28 Whiting & Davis, LLC.(2) - 15 Xeros, Inc. (1) - 25 Total $66,866,712 3,882 Notes: 1.) Award not anticipated based on updated project status. 2.) TBD 3.) Certification approved figures for the first Taxable Year. 4.) Certification approved figures for the first and second Taxable Years. Source: Rhode Island Commerce Corporation, May 2020 Revenue Estimating Conference Testimony (total estimated tax credit amount); https://commerceri.com/incentives/tax-credits-and-financing/ (projected number of jobs)
ORA requested data from CommerceRI on the awardees for the period of study, tax years 2016 to 2018, and received the application data provided to CommerceRI by the 32 projects that were awarded the NQJIA tax credit during that time. It should be noted that while the 32 projects ORA received data for are represented in the table above, several are among the eight at the bottom of the list that have made insufficient progress with respect to their incentive agreements and have had their NQJIA tax credit awards withdrawn. There are also projects in the list above that were awarded the NQJIA tax credit after 2018. ORA analyzed the data on the 32 projects provided by CommerceRI to gain a better understanding of total awardee characteristics.
When businesses apply for the NQJIA program, they must provide details about the company and the job creation/expansion proposed. Based on this information, awardees of the tax benefit can receive a higher tax credit if they meet certain criteria. The base amount of the tax credit is $2,500 annually per eligible position, however, the credit can go up to $7,500 annually per eligible position if the business is located in a Hope Community; or if the business is in a targeted industry; or if the business is located within a transit oriented development area; or if the business is an out-of-state business but relocating one or more of its units to Rhode Island.
An analysis of the geographical distribution of total awardees of the New Qualified Jobs Incentive Act tax benefit shows job expansions in 10 of 39 municipalities. More than half of the total awards were for job creations/expansions in and around Providence. This is not particularly surprising given that Providence is the largest city in the state and is also a Hope Community. Thus, the amount of NQJIA credit awarded per job for job creations/expansions located in Providence could be up to three times greater than for those located in, say North Kingstown, all other things equal simply because of location.

New Qualified Jobs Incentive Act
Economic Development Tax Incentive Evaluation 23
New Qualified Jobs Incentive Act: Location Map of Total Awardees
Municipality AwardeesProvidence 13North Kingstown 4East Providence 3Pawtucket 3Lincoln 2Smithfield 1Westerly 1West Greenwich 1Middleton 1Lincoln, Woonsocket 1Woonsocket 1Providence, Lincoln 1Total Awardees 32Source: Rhode Island Commerce Corporation

New Qualified Jobs Incentive Act
Economic Development Tax Incentive Evaluation 24
As shown in the map and table above, of the 32 job creations/expansion projects that were awarded the New Qualified Jobs Incentive Act, 13 were based solely in Providence, and one in Providence and Lincoln.
Details from the NQJIA applications give a good picture of the corporate structures of the businesses applying for the tax credit and the job creations/expansions they are undertaking. The awardees represent a variety of corporate structures and industries.
Of the 32 applicants that were authorized the New Qualified Jobs Incentive Act tax credit in the study period, tax years 2016 to 2018, 46.9% are C-Corporations, 34.4% are Limited Liability Companies (LLC) 15.6% are S-corporations.
The New Qualified Jobs Incentive Act provides additional funds to businesses that are expanding in Rhode Island from out of state. Despite this enticement, 59.4%, of businesses awarded the incentive already have operations in the state, while 40.6%, of total awardees are out-of-state businesses that are locating new operations in the state, as depicted in the chart below.
15
11
6
-
2
4
6
8
10
12
14
16
C-Corporation LLC S-Corporation
Num
ber o
f Aw
arde
es
Business Structure
New Qualified Jobs Incentive Act: Descriptive Statistics: Business Structure of Awardees
Source: Rhode Island Commerce Corporation

New Qualified Jobs Incentive Act
Economic Development Tax Incentive Evaluation 25
The NQJIA program offers a similar increase in funding for businesses that are expanding in a Hope Community (municipalities where the family poverty rate exceeds that of the state as a whole). A total of 56.3% of businesses awarded the tax credit are expanding operations in a Hope Community.
The New Qualified Jobs Incentive Act is also designed to give priority to specific targeted industries. As shown in the chart below, 81.3% of all awardees were in targeted industries.
Out-of-State Business:
13In-State Business:
19
New Qualified Jobs Incentive Act:Descriptive Statistics: Awardee Origin
Source: Rhode Island Commerce Corporation
18
14
-
2
4
6
8
10
12
14
16
18
20
Hope Community Outside Hope Community
Num
ber o
f Aw
arde
es
New Qualified Jobs Incentive Act:Descriptive Statistics: Awardees in Hope Communities
Source: Rhode Island Commerce Corporation

New Qualified Jobs Incentive Act
Economic Development Tax Incentive Evaluation 26
Of all business awarded tax credits under the New Qualified Jobs Incentive Act, the largest share was in manufacturing, representing 37.5%. The next largest share was in professional, scientific, and technical services, at 28.1%. The remaining 34.4% is distributed somewhat unevenly among the remaining eight industries.
New Qualified Jobs Incentive Act: Descriptive Statistics: Awardees by Industry
Industry Number Share Manufacturing 12 37.5% Professional, Scientific, and Technical Services 9 28.1% Wholesale Trade 3 9.4% Information 2 6.3% Administrative and Support and Waste Management and Remediation Services 1 3.1% Agriculture, Forestry, Fishing and Hunting 1 3.1% Finance and Insurance 1 3.1% Other Services (except Public Administration) 1 3.1% Retail Trade 1 3.1% Utilities 1 3.1% Total 32 100.0% Source: Rhode Island Commerce Corporation
The number of jobs created, and the expected median wage of the jobs created differs among awardees. The minimum number of newly created jobs required to receive the incentive varies depending on the current number employees in the state and if the business is in a target industry. A business planning to add fewer than 10 new jobs in Rhode Island is not eligible for the incentive.
New Qualified Jobs Incentive Act:Descriptive Statistics: Number of Awardees in Targeted Industries
Not In Targeted Industry: 6
In TargetedIndustry: 26
Source: Rhode Island Commerce Corporation

New Qualified Jobs Incentive Act
Economic Development Tax Incentive Evaluation 27
A total of 68.8% of businesses awarded the New Qualified Jobs Incentive Act tax credit are planning to add between 10 and 100 jobs, while 21.9%, of awarded businesses plan to add between 101 and 200 jobs. Only 9.4% of awardees plan to add more than 200 jobs.
Businesses applying for the New Qualified Jobs Incentive Act tax benefits must report the median wage of the jobs that will be created. Of the awarded expansion projects, 75.0% of businesses plan to offer a median wage of less than $75,000, with 37.5% of all awarded businesses offering a median wage between $25,000 and $50,000 and 37.5% of businesses offering a median wage between $50,000 and $75,000. The remaining 25% of awarded businesses will create new jobs that pay a median wage above $75,000.
22
7
1 1 1 -
5
10
15
20
25
10-100 101-200 201-300 401-500 701-800
Num
ber o
f Aw
arde
es
Number of Jobs Created
New Qualified Jobs Incentive Act:Descriptive Statistics: Awardees by Number of Jobs Created
Source: Rhode Island Commerce Corporation
12
12
4
3
1
0 2 4 6 8 10 12 14
$25,000-$50,000
$50,000-$75,000
$75,000-$100,000
$100,000-$125,000
$125,000-$150,000
Number of Jobs Created
Med
ian
Wag
e ($
)
New Qualified Jobs Incentive Act:Descriptive Statistics: Awardees by Median Wage
Source: Rhode Island Commerce Corporation, U.S. Bureau of Labor Statistics
Rhode Island Median Hourly Wage (2018): $20.11Rhode Island Annual Median Wage (2018): $42,040

New Qualified Jobs Incentive Act
Economic Development Tax Incentive Evaluation 28
The median salary, location, and industry all contribute to the overall incentive awarded per newly created job.
As is observable in the bar chart above, most businesses that applied and were authorized to receive the New Qualified Jobs Incentive Act tax credit are eligible to receive a credit at or near the maximum incentive amount of $7,500. This chart represents authorized tax credits; actual tax credits are calculated based on W-2 withholdings for eligible individuals in created jobs and may vary from authorized amounts.
The total credit authorized, based on the credit per job awarded and number of jobs expected to be created, averaged $761,319 for the 32 businesses that were awarded the New Qualified Jobs Incentive Act tax benefits. Fifty percent of businesses are eligible to receive an award of between $100,000 and $500,000, while a further 40.6% are eligible for a total incentive of between $500,000 and $2,000,000.
1 20
29
0
5
10
15
20
25
30
35
$2,800 to $3,975 $3,976 to $5,150 $5,151 to $6,325 $6,326 to $7,500
Num
ber o
f Aw
arde
es
Credit Per Job
New Qualified Jobs Incentive Act:Credit Per Job
(Tax Years 2016-2018)
Source: Rhode Island Commerce Corporation

New Qualified Jobs Incentive Act
Economic Development Tax Incentive Evaluation 29
• New Qualified Jobs Incentive Act Program Tax Credit Utilizer Characteristics
Pursuant to R.I. Gen. Laws § 44-48.3-3(6), an eligible job under the NQJIA program must earn no less than the median hourly wage as reported by the U.S. Bureau of Labor Statistics (BLS) for the state of Rhode Island. The rules and regulations implemented by CommerceRI that govern the New Qualified Jobs Incentive Act specify that a business with new full-time jobs reporting a median salary in excess of 110% of the existing median hourly wage, receives an increase of $300 per year for each ten percent by which the median salary levels exceeds the existing median hourly wage20.
In addition, Taxation verified the agreements that CommerceRI has with each New Qualified Jobs Incentive Act awardee. This verification includes:
• Satisfying the job creation count needed as of the Eligibility Commencement Date, • Having New Full-Time Jobs in RI working at least 35 hours per week, • Meeting the wage requirement outlined in the Agreement, • Maintaining the requisite number of New Full-Time Jobs for the Taxable Year, • Ensuring the Credit is calculated in accordance with the Agreement, • Ensuring the Credit is not more than the Rhode Island withholding for the Taxable Year.
ORA analyzed data provided by Taxation on employment and wages paid to the employees of the NQJIA program recipients. In TY 2016 through TY 2018 there were two businesses that had been awarded NQJIA tax credits who claimed the credits based on their agreement with CommerceRI.
20 https://rules.sos.ri.gov/regulations/part/870-30-00-4
1
0
1
0
5
8
5
11
1
0 2 4 6 8 10 12
>$5,000,000
$4,000,000-$5,000,000
$3,000,000-$4,000,000
$2,000,000-$3,000,000
$1,000,000-$2,000,000
$500,000-$1,000,000
$250,000-$500,000
$100,000-$250,000
<$100,000
Number of Awardees
Tota
l Cre
dit A
war
ded
New Qualified Jobs Incentive Act:Descriptive Statistics: Total Credit Awarded
Source: Rhode Island Commerce Corporation

New Qualified Jobs Incentive Act
Economic Development Tax Incentive Evaluation 30
Employees of NQJIA-Beneficiary Firms: Descriptive Statistics: Industry and Wages of Newly Created Jobs
(Tax Years 2016-2018)
NAICS Industry Description Tax Year Number of Jobs
Sum of Wages
Average Wage
Median Wage
Electrical equipment, appliance, and component manufacturing 2017 29 $1,053,264 $36,319 $43,460
Electrical equipment, appliance, and component manufacturing 2018 28 $1,180,917 $42,176 $43,918
Wholesale Trade 2018 17 $1,606,532 $94,502 $66,229
Source: Division of Taxation
In 2017, there were 29 employees working for a single New Qualified Jobs Incentive Act beneficiary, all of which were in the electrical equipment, appliance, and component manufacturing industry. In 2018, a total of 45 employees were working for two firms that received the New Qualified Jobs Incentive Act tax credit, with 28 in the electrical equipment, appliance, and component manufacturing industry and 17 in the wholesale trade industry.
Employees working for the NQJIA recipient firm that is classified as operating in the wholesale trade industry receive an average wage of $94,502. The median wage earned at this NQJIA recipient firm was $66,229 in 2018, which is 157.6% of the annual median wage of $42,037 in 2018 for all occupations in Rhode Island.21 Employees of the NQJIA recipient firm that is classified as operating in the electrical equipment, appliance, and component manufacturing industry earned an average wage of $36,319 in 2017 and $42,176 in 2018. The median wage for the employees at this NQJIA recipient firm was $43,460 in 2017 and $43,918 in 2018, which are 107.4% and 104.5% of the annual median wage for the state, respectively22. In 2018, across both industries, the average wage was $61,934.
In order to protect taxpayer confidentiality, Taxation is unable to disclose information pertaining to withholding amounts of the qualified jobs. However, Taxation, informed ORA that the average qualified job had an 8% higher amount of Rhode Island income tax withholding than the amount of credit issued for tax year 2018.
21 According to the U.S. Bureau of Labor Statistics’ May 2018 State Occupational Employment and Wage Estimates for Rhode Island the median hourly wage for all occupations in Rhode Island was $20.21. Assuming a 40-hour work week and 52 weeks in a year, ORA calculated an annual median wage of $42,037. The U.S. Bureau of Labor Statistics’ May 2018 State Occupational Employment and Wage Estimates is the Labor Department’s only publicly released data set that reports median wages for states. 22 According to the U.S. Bureau of Labor Statistics’ May 2017 State Occupational Employment and Wage Estimates for Rhode Island the median hourly wage for all occupations in Rhode Island was $19.45. Assuming a 40-hour work week and 52 weeks in a year, ORA calculated an annual median wage of $40,456.

New Qualified Jobs Incentive Act
Economic Development Tax Incentive Evaluation 31
Part IV: Evaluation of the Economic Impact of the Tax Credit This section of the report addresses two major objectives defined in R.I. Gen. Laws § 44-48.2-5: first, to provide a projection of the potential impact of the “New Qualified Jobs Incentive Act” on state revenues from projected future use and carryforward amounts of unused credits; and, second, to produce a breakeven cost-benefit analysis that can determine the net impact on state revenues resulting from the tax incentive.
1. Assessment and Five-Year Projection of Revenue As of the initial production of this report in June 2020, the NQJIA program had a sunset date of December 31, 2020, meaning that no new credits could be authorized after this date.23 However, it is anticipated that tax credit usage activity will continue beyond this date as this tax credit is awarded over multiple years. In fact, during their testimony at the May 2020 Revenue Estimating Conference (REC), CommerceRI provided an estimated New Qualified Jobs Incentive Act tax credits projection by fiscal year starting in FY 2017 through FY 2032.
It should be noted that the TY 2017 NQJIA tax credit amount provided to ORA by Taxation was included in the FY 2019 NQJIA credit amount reported by CommerceRI at the May 2020 REC. Similarly, the TY 2018 credit amount provided to ORA by Taxation was included in the FY 2020 NQJIA tax credit amount reported by CommerceRI at the May 2020 REC. ORA subtracted from the CommerceRI projections for FY 2019 and FY 2020, the actual TY 2017 and TY 2018 tax credit amounts used as provided by Taxation in order to capture the unused amounts of the NQJIA tax credits that are still available from FY 2019 and FY 2020. ORA then used the CommerceRI projection to construct a 5-year projection for NQJIA tax credit amounts that would be assigned in future tax years assuming that the tax year and fiscal year correspond directly to one another (i.e. TY 2019 = FY 2019, TY 2020 = FY 2020, etc.).
The following table provides the distribution of the anticipated amount of the NQJIA tax credits to be issued in each tax year.
“New Qualified Jobs Incentive Act” Revenue Forgone Projections
Tax Year Credit Amount 2019 $89,947 2020 $1,670,345 2021 $2,528,135 2022 $4,402,420 2023 $6,226,964
Source: ORA calculations based on data provided by Taxation and CommerceRI
23 The FY 2021 enacted budget (2020 H-7171 Substitute A) signed into law by Governor Raimondo on December 18, 2020 extended the sunset date for this economic development tax incentive to June 30, 2021.

New Qualified Jobs Incentive Act
Economic Development Tax Incentive Evaluation 32
2. Rhode Island Commerce Corporation Economic Impact Analysis
The Rhode Island Commerce Corporation had an economic impact analysis conducted for each New Qualified Jobs Incentive Act awardee. This analysis was produced by Appleseed, a consulting firm with more than twenty years of experience in economic impact analysis.24
ORA summarized Appleseed’s analysis on the New Qualified Jobs Incentive Act recipients included in the current report. Due to taxpayer confidentiality, ORA will refer to these two credit recipients as Company A (NAICS 335) and Company B (NAICS 42).
• Company A (NAICS 335)
According to information published by CommerceRI, this company specializes in the production of standardized LED lighting for commercial and institutional use, and custom-designed decorative LED lighting for residential customers. The economic impact analysis produced by Appleseed for this company assumes that: 20 jobs are directly added to the Rhode Island economy in 2017 and a total of 24 jobs are
directly added by 2021; The median earning of these jobs is approximately $45,500; The total value of the NQJIA tax credit amount is $219,225; The tax credit will be claimed over five years.
It is unclear from the Appleseed analysis how many of the direct jobs would be filled by Rhode Islanders but, based on date from Taxation, we know that 57.8% of the total jobs eligible for the NQJIA tax credits are held by non-residents. Applying this percentage to the number of TY 2017 direct jobs used by Appleseed implies that eight of these jobs would be filled by Rhode Island residents.
The following table Summarizes the economic and fiscal results as reported by Appleseed:
Impact TY 2017 TY 2021 Total Employment* 25 31 Earnings ($000) $1,445 $1,769 Value Added ($000) $2,193 $2,686 Output ($000) $4,720 $5,782 Total Taxes by Component Personal Income Taxes $54,000 $66,000 Sales and Use Taxes $24,000 $29,000 Business Corporation Taxes $7,000 $9,000 Source: CommerceRI report available at https://commerceri.com/wp-content/uploads/2018/04/Commerce-Corporation-Incentive-Programs-FY2017.pdf Notes: * Total employment represents the sum of direct and indirect jobs.
24 These economic impact analyses are publicly available on CommerceRI’s website at https://commerceri.com/wp-content/uploads/2018/04/Commerce-Corporation-Incentive-Programs-FY2017.pdf

New Qualified Jobs Incentive Act
Economic Development Tax Incentive Evaluation 33
The results presented in the table above imply that the personal income tax generated per job is equal to $2,160 (i.e., $54,000 / 25) under Appleseed's analysis. Using the TY 2019 Personal Income Tax (PIT) simulation model, ORA calculated that a single taxpayer with a Federal Adjusted Gross Income (AGI) of $45,500, with no dependents and subject to a tax rate of 3.75% would pay $1,224 in Rhode Island income taxes, or $936 per job less than projected by Appleseed. With respect to sales and use taxes, Appleseed estimates that each job will generate taxable Rhode Island sales of $13,714 (i.e. $24,000 / 25 / 0.07). This implies that 30.1% of each employee’s gross income would be spent on taxable goods and services each year (i.e., $13,714 / $45,500).
• Company B (NAICS 42)
According to information published by CommerceRI, this company is a firm that buys and sells used laboratory and biotechnology industry equipment. The economic impact analysis produced by Appleseed for this company assumes that: A total of 16 jobs are directly added to the Rhode Island economy in 2018; The median earning of these jobs is approximately $51,000; The total value of the NQJIA credit amount is $454,681; The tax credit will be claimed over ten years.
It is unclear from the Appleseed analysis how many of the direct jobs would be filled by Rhode Islanders but, based on date from Taxation, we know that 57.8% of the total jobs eligible for the NQJIA tax credits are held by non-residents. Applying this percentage to the number of TY 2017 direct jobs used by Appleseed implies that seven of these jobs would be filled by Rhode Island residents.
The following table summarizes the economic and fiscal results as reported by Appleseed:
Impact TY 2018 Total Employment* 24 Earnings ($M) $1.8 Value Added ($M) $3.2 Output ($M) $4.9 Total Taxes by Component Personal Income Taxes $69,000 Sales and Use Taxes $30,000 Business Corporation Taxes $9,000 Source: CommerceRI report available at https://commerceri.com/wp-content/uploads/2018/04/Commerce-Corporation-Incentive-Programs-FY2017.pdf Notes: * Total employment represents the sum of direct and indirect jobs.
The results presented in the table above imply that the personal income tax generated per job is equal to $2,875 (i.e., $69,000 / 24) under Appleseed's analysis. Using the TY 2019 Personal Income Tax (PIT) simulation model, ORA calculated that a single taxpayer with a Federal Adjusted Gross Income (AGI) of $51,000, with no dependents and subject to a tax rate of 3.75% would pay $1,431 in Rhode Island taxes, or less than half the projected income tax payment per

New Qualified Jobs Incentive Act
Economic Development Tax Incentive Evaluation 34
job produced by Appleseed. With respect to sales and use taxes, Appleseed estimates that each job will generate taxable sales of $17,857 (i.e. $30,000 / 24 / 0.07). This implies that 35.0% of each employee’s gross income would be spent on taxable goods and services each year (i.e., $17,857 / $51,000).
3. “Breakeven” Cost-Benefit Analysis • Introduction to the “Breakeven” Cost-Benefit Analysis Methodology
Pursuant to R.I. Gen. Laws § 44-48.2-5(6), ORA conducted a “breakeven” cost-benefit analysis to measure the fiscal impacts on the state economy resulting from the NQJIA program under a variety of assumptions. To provide additional insight, ORA also produced breakeven analyses with respect to employment and Rhode Island gross domestic product (GDP).
To execute these cost-benefit analyses, ORA utilized Regional Economic Models, Incorporated’s (REMI) 70-sector model of the Rhode Island economy via the REMI Tax-PI software platform to produce estimates of the total economic effects of the tax credits issued in tax years 2016 through 2018.25 The dynamic capabilities of the REMI Tax-PI model allows one to estimate the impacts of exogenous shocks to the state’s economy, including changes to public policy, shifts in consumer behavior and demand, and developments in industry. The REMI Tax-PI operationalizes these insights by augmenting REMI’s base economic and demographic model, PI+, with a module that allows the user to enter a state’s customized budget, in order to run fiscal and economic forecasts. Specifically, for each budget item, one can choose an “Indicator”, which is the economic or demographic driver of that budget item (e.g., personal income for personal income tax revenue, or age 5-18 population for K-12 education spending), and a “Policy Variable”, which is the economic or demographic change associated with a change to the structure of that budget item (e.g., a change in consumer prices for a change in the sales tax).
The analysis is based on self-reported firm-level data on employment and wages provided by CommerceRI, Taxation and publicly available historical data on the regional and national economies. Direct benefits are input into the REMI model as policy variables simulating changes in industry sales, exogenous final demand, employment, and compensation or wages. ORA assigned the TY 2018 New Qualified Jobs Tax Incentive Act amount of $90,041 as the cost of the incentive. The benefits were input in the REMI Tax-PI model as changes in employment and compensation in the electrical equipment, appliance, and component manufacturing industry and the wholesale trade industry.
The “breakeven” approach developed for this report allows a reader to assume that the NQJIA leveraged various levels of economic activity required of recipient firms to receive a tax credit. This assumption means that some varying portion of the economic activity required of recipient firms to receive a tax incentive would not have occurred in the absence of the tax incentive. Under this assumption, firms made some portion of their long-term production decisions based on the
25 Detailed documentation on the REMI Tax-PI v2.3.1 model employed in this analysis is available at: http://www.remi.com/resources/documentation

New Qualified Jobs Incentive Act
Economic Development Tax Incentive Evaluation 35
availability of an incentive over time, and removal of that tax benefit in a particular year would undo all such decisions.
• Modeling Costs
ORA assumed that the tax incentive is funded by an equivalent reduction in state government spending – that is, when the state government forgoes revenue by allowing a tax credit, there are fewer funds available for other spending priorities. ORA modeled these adjustments based on a comprehensive historical analysis of Rhode Island general fund expenditures for fiscal year 2018, which represent the most recent expenditure data at the time of the analysis. ORA compiled all state general fund expenditures and assumed that the level of these expenditures could be adjusted to maintain a balanced general fund budget. The breakdown of general fund expenditures by category is shown in the following table:
Rhode Island General Fund Expenditures by NAICS (Fiscal Year 2018)
Industry Description NAICS Code Percent of Total
Ambulatory Healthcare Services 621 32.1%
Educational Services 61 30.5%
State Wages, Salary, and other Compensation
n/a (entered as “state/local govt.
compensation” and “employment”) 25.6%
Social Assistance 624 2.9%
Local Government Spending
n/a (entered as “local government
spending”) 2.9%
Professional, Scientific, and Technical Services 54 1.4%
Administrative and Support Services 561 1.5%
Wholesale Trade 42 0.6%
Remaining/Other 19 additional industries, and non-residential capital investment 2.6%
Total: 100.0% Source: ORA analysis of Rhode Island FY 2018 general fund expenditure data.
In addition, ORA decomposed the FY 2018 general fund expenditures data to look at spending by each state government agency, then ORA combined these agencies into different groups based on their functions and duties. The following table describes this breakdown:

New Qualified Jobs Incentive Act
Economic Development Tax Incentive Evaluation 36
Rhode Island General Fund Expenditures by Agency Groups (Fiscal Year 2018)
Agency Groups * Percent of Total Elementary and Secondary Education 38.80% Health Care Services (Medicaid) 37.78% Behavioral Health and State Hospitals 5.15% Children, Youth and Families 4.94% Health and Human Services (Non-Medicaid) 2.78% Higher Education 2.72% General Government 2.31% Corrections 1.81% Economic Development 1.52% Courts 0.69% Public Safety 0.50% Elected Officials 0.46% Environment 0.45% Other 0.10% Grand Total 100.00% Source: ORA analysis of Rhode Island general fund expenditure data. Note: *Breakdown of these groups can be found in Appendix C.
• Modeling Benefits
To model the benefits of the New Qualified Jobs Incentive Act, ORA examined the intended purpose and goals defined in the program’s governing statute. As stated in R.I. Gen. Laws § 44-48.3-2, the objective of this program is largely focused on the creation of new jobs and the attraction of new businesses and industries that would generate revenues for state and local governmental services.
To address the program’s objectives, ORA modeled this tax benefit as a commensurate increase in industry employment and compensation. In the REMI model, an “Industry Employment (Exogenous Production)” policy variable affects the industries that provide the goods or services demanded. This policy variable assumes that employment is related to exogeneous sources of demand, thus, the employment loss/gain will not be offset by local firms. In the case of the New Qualified Jobs Incentive Act program, this policy variable assumes that the employees of the program’s beneficiary-firms represent net new jobs to the Rhode Island economy. Hence, the analysis assumes that the availability of the NQJIA tax credit impacted the recipient firms’ decisions to undertake major investments in Rhode Island, by providing cost savings that tipped the balance in favor of locating a business in Rhode Island vs. some alternative location.
To apply the changes in industry employment and compensation discussed above, ORA matched each recipient firm to its corresponding industry code according to the North American Industry Classification System (NAICS) in order to accurately simulate direct shocks to the Rhode Island economy with the REMI model. As noted above, two sectors were selected: “Electrical equipment, appliance, and component manufacturing” (NAICS 335) and “Wholesale trade” (NAICS 42).

New Qualified Jobs Incentive Act
Economic Development Tax Incentive Evaluation 37
• The “Breakeven” Approach
A fundamental challenge in evaluating economic development incentives is determining the extent to which an incentive stimulated or attracted new economic activity rather than subsidized economic activity that would have been largely present even in the absence of the incentive. On one hand, the availability of a tax incentive might have a decisive influence on a firm’s production decision. In this case it might be appropriate for an evaluator to attribute all the firm’s economic activity to the incentive. On the other hand, an incentive program may simply reward or subsidize behavior that likely would have occurred anyway. In this case the tax credit might have an impact on a firm’s marginal productivity, but it would be inappropriate to attribute the full economic activity of the firm solely to the availability of the tax incentive. Real world conditions often make it difficult or impossible for an evaluator to assess where on this continuum the impact of any given tax incentive falls.
In this context, ORA conducted a breakeven analysis. This analysis allows for the evaluation of an incentive program’s performance under a wide range of assumptions regarding the level of economic activity that would have taken place if the program had not been available. Furthermore, the breakeven analysis specifies the proportion of economic activity associated with the incentive program recipients that one must assume to have been attributable to the incentive program in order for the total benefits to equal its total costs, where benefits and costs are measured as the impact on state general revenues (i.e., the condition that must be satisfied for the incentive program to “pay for itself”).
The breakeven percentage should be interpreted as follows: if the reader believes the assumption to be plausible, that at least the amount of economic activity implied by the breakeven percentage can be attributed to the availability of the tax incentive, then one can infer that the incentive has a net positive impact on state general revenues. In the opposite case, if the reader believes that the amount of economic activity attributable to the tax incentive was less than the level implied by the breakeven percentage, then one can infer that the incentive had a net negative impact on state general revenues. Holding other factors equal, a lower breakeven percentage is more desirable than a higher breakeven percentage if the goal of an incentive program is to cost the state as little revenue as possible. A tax incentive program fails to breakeven when the breakeven percentage is greater than 100%. This implies that even if 100% of the economic activity associated with the incentive recipient was assumed to have taken place strictly because of the incentive’s availability, a net negative impact on state general revenues would have resulted.
The following chart provides results of the breakeven analysis with respect to Rhode Island general revenues:

New Qualified Jobs Incentive Act
Economic Development Tax Incentive Evaluation 38
A breakeven percentage of 38.0% can be interpreted to mean that if one assumes that 38.0% or more of the employment associated with NQJIA recipient firms would not have been located in the state if not for the availability of the NQJIA tax credit, then the tax credit “pays for itself” in terms of state general revenues. The breakeven percentage can also be considered in terms of jobs. If at least 17 employees of NQJIA-beneficiary firms, or 38.0% of the average reported employment of 45 jobs, can be attributed solely to the availability of the tax credit, then this cost-benefit analysis suggests that the credit “pays for itself” in terms of state general revenues.
One of the difficulties in analyzing any economic development tax incentive is determining the extent to which the tax incentive impacts a recipient’s decision to locate jobs in one place vs. another. ORA tested a variety of assumptions regarding the level of activity taking place in Rhode Island that must be attributable to the NQJIA program for the program to generate more in state general revenues than the cost of the incentive. A 2018 report from the W.E. Upjohn Institute for Employment Research suggests that the value of a typical economic development tax incentive in the first year of award is equal to approximately 7% of a firm’s total wages.26 ORA notes that the average compensation paid to NQJIA recipient’s employees in 2018 was $61,943 and that 7% of this average compensation paid is $4,336 which is the per job incentive amount necessary to impact
26 Bartik, Timothy J. 2018. "Who Benefits from Economic Development Incentives? How Incentive Effects on Local Incomes and the Income Distribution Vary with Different Assumptions about Incentive Policy and the Local Economy." Upjohn Institute Technical Report No. 18-034. Kalamazoo, MI: W.E. Upjohn Institute for Employment Research. https://doi.org/10.17848/tr18-034
$155.8 $136.4 $113.3
$90.3 $59.6
$36.4 $5.7
($25.1)($48.0)
($71.2)($101.9)
-$150-$100-$50
$0$50
$100$150$200$250$300$350
0% 10% 20% 30% 40% 50% 60% 70% 80% 90% 100%
Ave
rage
Ann
ual R
I Net
Gen
eral
Rev
enue
s Im
pact
(T
hous
ands
$)
Percentage of Benefits Assumed Attributable to Tax Incentive
New Qualified Jobs Incentive Act:Rhode Island Net General Revenue Breakeven Analysis
(Average Annual RI Net General Revenue Impact, TY 2018)
Notes: Label accompanying each marker refers to net general revenue impact resulting from a cost-benefit analysis assuming the labeled percentage of New Qualified Jobs Incentive Act benefits. Net General revenue impact is equal to the revenue impact resulting from the direct, indirect, and induced effects in addition to the cost of paying back the direct cost of the tax credit.
Source: ORA calculations utilizing REMI Tax-PI
General Revenue Breakeven Percentage: 38.0%
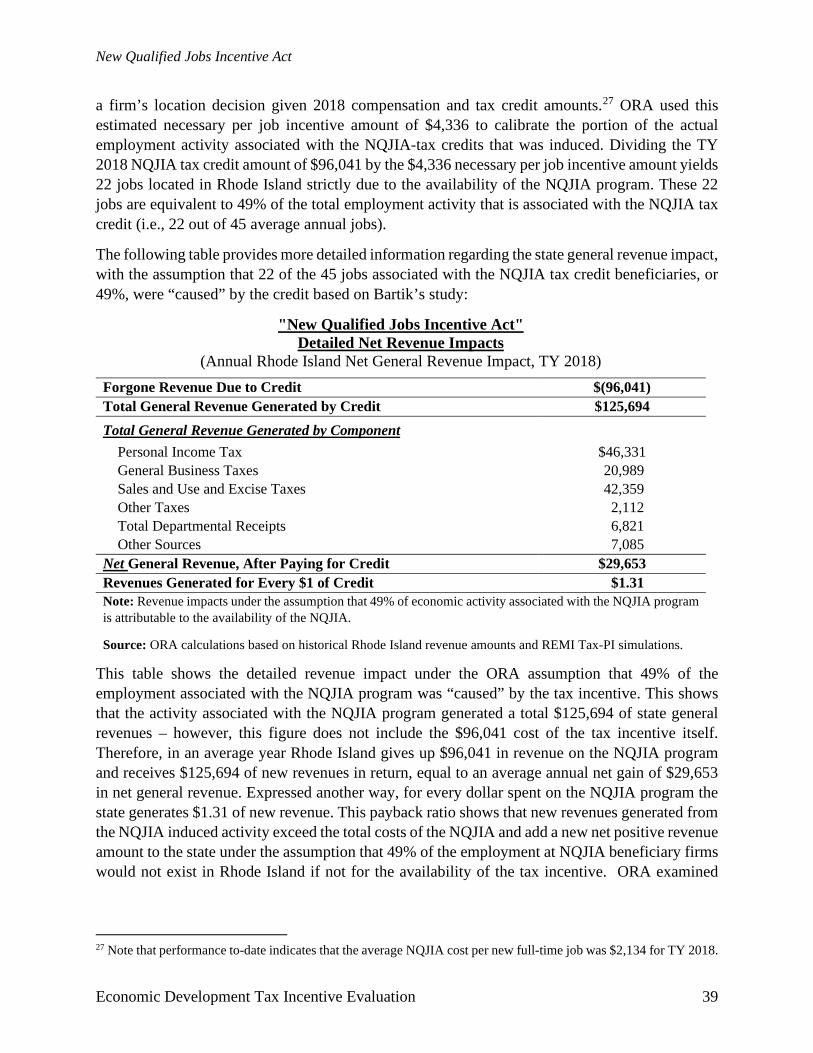
New Qualified Jobs Incentive Act
Economic Development Tax Incentive Evaluation 39
a firm’s location decision given 2018 compensation and tax credit amounts.27 ORA used this estimated necessary per job incentive amount of $4,336 to calibrate the portion of the actual employment activity associated with the NQJIA-tax credits that was induced. Dividing the TY 2018 NQJIA tax credit amount of $96,041 by the $4,336 necessary per job incentive amount yields 22 jobs located in Rhode Island strictly due to the availability of the NQJIA program. These 22 jobs are equivalent to 49% of the total employment activity that is associated with the NQJIA tax credit (i.e., 22 out of 45 average annual jobs).
The following table provides more detailed information regarding the state general revenue impact, with the assumption that 22 of the 45 jobs associated with the NQJIA tax credit beneficiaries, or 49%, were “caused” by the credit based on Bartik’s study:
"New Qualified Jobs Incentive Act" Detailed Net Revenue Impacts
(Annual Rhode Island Net General Revenue Impact, TY 2018) Forgone Revenue Due to Credit $(96,041) Total General Revenue Generated by Credit $125,694 Total General Revenue Generated by Component Personal Income Tax $46,331 General Business Taxes 20,989 Sales and Use and Excise Taxes 42,359 Other Taxes 2,112 Total Departmental Receipts 6,821 Other Sources 7,085 Net General Revenue, After Paying for Credit $29,653 Revenues Generated for Every $1 of Credit $1.31 Note: Revenue impacts under the assumption that 49% of economic activity associated with the NQJIA program is attributable to the availability of the NQJIA.
Source: ORA calculations based on historical Rhode Island revenue amounts and REMI Tax-PI simulations.
This table shows the detailed revenue impact under the ORA assumption that 49% of the employment associated with the NQJIA program was “caused” by the tax incentive. This shows that the activity associated with the NQJIA program generated a total $125,694 of state general revenues – however, this figure does not include the $96,041 cost of the tax incentive itself. Therefore, in an average year Rhode Island gives up $96,041 in revenue on the NQJIA program and receives $125,694 of new revenues in return, equal to an average annual net gain of $29,653 in net general revenue. Expressed another way, for every dollar spent on the NQJIA program the state generates $1.31 of new revenue. This payback ratio shows that new revenues generated from the NQJIA induced activity exceed the total costs of the NQJIA and add a new net positive revenue amount to the state under the assumption that 49% of the employment at NQJIA beneficiary firms would not exist in Rhode Island if not for the availability of the tax incentive. ORA examined
27 Note that performance to-date indicates that the average NQJIA cost per new full-time job was $2,134 for TY 2018.

New Qualified Jobs Incentive Act
Economic Development Tax Incentive Evaluation 40
additional possible scenarios varying the percentages of benefits assumed attributable to the tax incentive. Results of these analyses are provided in Appendix D.
The breakeven framework can also be extended to Rhode Island employment and Rhode Island GDP. In these contexts, the breakeven percentage can be interpreted as the percentage of economic activity associated with NQJIA-recipient firms assumed to be attributable to the availability of the tax incentive. With respect to GDP, it is the percentage of economic activity that is necessary to offset the GDP loss resulting in the reduction in government spending necessary to fund the credit. With respect to employment, it is the percentage of economic activity that is necessary to offset the employment loss resulting in the reduction in government spending necessary to fund the credit
The following chart shows the results of a breakeven analysis with respect to employment.
The employment breakeven percentage of 2.0% implies that the NQJIA program has a net positive impact on Rhode Island employment if at least 2.0% of economic activity associated with the NQJIA-recipient firms would not have occurred but for the availability of the tax incentive. A detailed employment breakdown (e.g., direct, indirect, and induced jobs) is provided in Appendix D.
The following chart shows the results of a breakeven analysis with respect to Rhode Island gross domestic product (RI GDP).
88 79
71 63
53 45
35 24
16 8
(2)
-100
102030405060708090
100
0% 10% 20% 30% 40% 50% 60% 70% 80% 90% 100%
Ave
rage
Ann
ual J
ob Im
pact
Percentage of Benefits Assumed Attributable to Tax Incentive
New Qualified Jobs Incentive Act:Employment Breakeven Analysis
(Average Annual Jobs Impact, TY 2018)
Notes: Label accompanying each marker refers to net job impact resulting from a cost-benefit analysis assuming the labeled percentage of New Qualified Jobs Incentive Act benefits. Employment is equal to the revenue impact resulting from the direct, indirect, and induced effects in addition to the cost of paying back the direct cost of the tax credit.
Source: ORA calculations utilizing REMI Tax-PI
Employment Breakeven
Percentage: 2.0%

New Qualified Jobs Incentive Act
Economic Development Tax Incentive Evaluation 41
The RI GDP breakeven percentage of 2.0% implies that the NQJIA program has a net positive impact on RI GDP if at least 2.0% of economic activity associated with the NQJIA-recipient companies would not have occurred but for the availability of the tax incentive. The results of additional GDP breakeven scenarios in which the input parameters are varied to provide the reader with additional possible breakeven analysis outcomes are provided in Appendix D.
$11.5 $10.3
$9.3 $8.2
$6.9 $5.9
$4.5 $3.2
$2.1 $1.1
($0.2)
($2)
$0
$2
$4
$6
$8
$10
$12
$14
0% 10% 20% 30% 40% 50% 60% 70% 80% 90% 100%Ave
rage
Ann
ual R
I GD
P Im
pact
(Mill
ions
$)
Percentage of Benefits Assumed Attributable to Tax Incentive
New Qualified Jobs Incentive Act:Rhode Island Gross Domestic Product (RI GDP) Breakeven Analysis
(Average Annual RI GDP Impact, TY 2018)
Notes: Label accompanying each marker refers to net RI GDP impact resulting from a cost-benefit analysis assuming the labeled percentage of New Qualified Jobs Incentive Act benefits. RI GDP is equal to the revenue impact resulting from the direct, indirect, and induced effects in addition to the cost of paying back the direct cost of the tax credit.
Source: ORA calculations utilizing REMI Tax-PI
GDP Breakeven Percentage: 2.0%

New Qualified Jobs Incentive Act
Economic Development Tax Incentive Evaluation 42
Part V: Discussion and Recommendations
1. Statement by the CEO of the Commerce Corporation The Secretary of Commerce, who serves as Chief Executive Officer of the Rhode Island Commerce Corporation pursuant to R.I. Gen. Laws 42-64-1.1(b), provided the following statement pursuant to R.I. Gen. Laws § 44-48.2-5(a)(6)(iii):
Statement from the CEO of the Commerce Corporation: The Qualified Jobs Incentive Tax Credit program aims to spur the creation of high-quality, well-paying jobs in Rhode Island. ORA’s analysis of the program’s earliest results, combined with the program’s strong taxpayer protections and overall performance, indicate that this tool is generating significant returns to the state by increasing state tax revenue, the number of jobs in the state, and the state’s GDP. The preliminary findings of the report’s break-even analysis are important to be considered in the context of the program’s required “but-for” analysis. This report projects that the state benefits if a mere 2% (in the case of employment and GDP) or 38% (in terms of state general revenues) of increases are attributed to the program – which is very encouraging. It is important to note that the Qualified Jobs tax credit program requires an executive of the company to certify that the jobs would not be created without the tax incentive. Additionally, applications undergo risk and impact assessments prior to the recommendation of any project to the Corporation’s Board for approval. Because the statutory requirements for this ORA report obligate the review of program data from only 2016 through 2018, its scope is limited, and we agree with the ORA finding that additional analysis is merited going forward. However, because of the program’s taxpayer protections, results will only improve over time. For example, the Qualified Jobs program pays for performance by issuing tax credits only after a job has been created and has paid income tax for at least one full taxable year. This ensures that Rhode Island tax dollars are protected should a recipient ultimately be unable to meet its job creation targets. Additionally, by limiting the duration a company can receive the tax credit to a maximum of ten years and requiring the job to be in place for 20% longer than the period for which the credits are earned, the program limits the risk that the subsidy would need to continue in order to maintain the new jobs. These taxpayer protections improve the value to taxpayers in ways that are not taken into account in ORA’s analysis. For example, even in the timeframe examined by ORA, several additional companies had already created jobs as a result of the program and were generating new taxes. These were not analyzed because ORA examined only those companies that actually received tax credits during the time period in question. Additionally, ORA’s analysis does not consider important factors such as construction period contributions. These same points and others apply to other aspects of ORA’s analysis. In some sections, for example, the full range of tax streams generated by a business is not analyzed. We look forward to continuing the dialogue with ORA about how best to characterize and contextualize the program’s results. The ORA recommendations suggesting minor modifications to the method of industry data collection (more clearly articulating the median wage data used and ensuring the regulations

New Qualified Jobs Incentive Act
Economic Development Tax Incentive Evaluation 43
reflect the current statutory job credit maximum) are welcome. We recognize the value in ensuring that program information can be even more clearly interpreted and analyzed. We also welcome the feedback on the cost of administering the program. While the finding delineates the administrative costs incurred during FY 2017 and FY 2018, we would expect administrative costs to remain relatively constant during the administration period of the program even while the value of the tax credits issued increases over the coming years. This implies that, as the program ramps up, the administrative costs as a percent of tax credit issuance will decline dramatically. Future analysis may better reflect the administrative costs of the program as a percentage of total program costs. Encouraging the creation of high-quality, good-paying jobs is important to the state’s mission to grow a more resilient, thriving economy. The Qualified Jobs program is showing great signs of success, and we anticipate that future analysis will further demonstrate the effectiveness of the program and its value to our state’s economy.
2. ORA Recommendations
Finding #1: Tax years 2016 through 2018 show low usage of the New Qualified Jobs Incentive Act. CommerceRI credit projections show a significant credit usage in future years.
Related Recommendations: Given that few businesses claimed the tax credit, it is too early to determine if the program
has achieved the intended goals and objectives. A second round of this tax incentive evaluation would better indicate whether the program achieved the goals and objectives set in the governing statute.
Discussion Supporting Finding #1:
According to CommerceRI’s testimony at the May 2020 Revenue Estimating Conference (REC), a total of 38 companies were awarded New Qualified Jobs Incentive Act tax credits. As of tax year 2018, two companies utilized NQJIA tax credits that had been awarded to them with a total number of jobs created of 45.28 ORA assumes that low utilization of the NQJIA tax credit is due to the program being at an early stage. In fact, according to CommerceRI testimony at the May 2020 REC, significant credit usage is projected in the coming years. Therefore, ORA anticipates that the second round of this tax incentive evaluation would better indicate whether the program achieved the goals and objectives set in the governing statute. ORA recommends that rather than only specifying an exact time frame in which a first incentive evaluation be executed as is contained in R.I. Gen. Laws § 44-48.2-4(a)(2), consideration be given to providing the option that a first
28 According to the company profiles on the CommerceRI website (https://commerceri.com/incentives/tax-credits-and-financing/qualified-jobs-incentive-advertising-ventures-inc/), a total of 3,882 jobs were expected to be provided by the 38 firms that have been awarded NQJIA tax credits. This number has been reduced by 383 jobs, to 3,499 expected jobs, due to the six firms that are no longer eligible for the tax credit.

New Qualified Jobs Incentive Act
Economic Development Tax Incentive Evaluation 44
evaluation of a new tax incentive be completed upon the accumulation of a sufficient amount of data.
Finding #2: The Targeted Industries specified in Attachment 9-1 of the New Qualified Jobs Incentive Act application form do not follow the North American Industry Classification System (NAICS). While this industry breakdown may be suitable for statutory compliance, it is inadequate for an economic analysis.
Related Recommendations:
ORA recommends that the industry in which a program awardee operates should be designated based on the North American Industry Classification System in order to help evaluators conduct an economic analysis.
Discussion Supporting Finding #2:
An important part of a tax incentive evaluation is the understanding of the economic environment in which the tax incentive program operates. For each economic impact analysis conducted, ORA usually compiles data on wages and employment from a variety of sources to help provide a reader with a solid context to the analysis. Most of this data, if not all of it, is categorized according to the North American Industry Classification System (NAICS). Looking at the eligibility criteria of the New Qualified Jobs Incentive Act, it appears that the program encourages the creation of jobs in certain fields and industries as an extra credit bonus is offered to businesses engaged in one of the business activities mentioned in the “Description of the Incentive” section above. Even though applicants provide their industry and the NAICS codes for the jobs created in sections 1 and 2 of the application, the industry description of the targeted industries in Attachment 9-1 of the application form is not clear enough as it does not indicate specific NAICS-based sectors or codes. Therefore, it is difficult to determine if the industry/NAICS code indicated by a program applicant falls under the targeted industries specified in the application form. ORA recommends that the program’s targeted industries be designated according to the North American Industry Classification System in order to facilitate economic impact analysis of the tax incentive.
Finding #3: The New Qualified Jobs Incentive Act application form does not indicate the Rhode Island median wage, instead program applicants are asked to provide this information.
Related Recommendations: ORA recommends that information on the Rhode Island median wage be provided on the
program’s application form to avoid any data inconsistency.
Discussion Supporting Finding #3:
According to R.I. Gen. Laws § 44-48.3-3 (6), an eligible job under the NQJIA program must earn no less than the median hourly wage as reported by the U.S. Bureau of Labor Statistics (BLS) for the state of Rhode Island. Furthermore, CommerceRI rules and regulations indicate that, in
New Qualified Jobs Incentive Act
Economic Development Tax Incentive Evaluation 45
addition to the $2,500 base credit amount, a business can qualify for another $300 per job created for each 10 percent by which the median salary of the newly created job exceeds the Rhode Island median hourly wage. ORA reviewed the NQJIA applications provided by CommerceRI and found applicants that provided incorrect state median wage information. In fact, the NQJIA application form contains inconsistency and a lack of clarity with respect to the wage information. First, in the “Tax Credit Amount Worksheet” section, the median Rhode Island wage is an empty field that is left up to the applicant to answer. ORA recommends that this information already be specified on the NQJIA application form in order to ensure data accuracy. Second, the “Job Creation Information” section of the form requires the applicant to provide an annual median wage of the new jobs to be created, while the “Tax Credit Amount Worksheet” section states that the median wage of these jobs should exceed 110% of the median hourly wage for RI. To avoid any confusion, ORA recommends that the application form be consistent and make it clear to the applicant whether the median wage is measured on an hourly basis or annual basis. Last, although the maximum tax credit amount authorized would not vary in the specific cases analyzed, ORA recommends the amendment of R.I. Gen. Laws § 44-48.3-6(c) to incorporate the $300 bonus that a business can claim if they add jobs that are paid a median wage that is 110% higher than the Rhode Island median wage at the time of the application to be consistent with the existing statutorily mandated credits amounts.
Finding #4: The per job credit cap stated by Rhode Island Commerce Corporation rules and regulations 870-RICR-30-00-4.13(B) is different from the one contained in R.I. Gen. Laws § 44-48.3-6(e).
Related Recommendations: ORA recommends that CommerceRI amends its rules and regulations to reflect the per
job credit cap provided in the governing statute of the New Qualified Jobs Incentive Act.
Discussion Supporting Finding #4:
R.I. Gen. Laws § 44-48.3-6 (e) states that “for each application approved by the commerce corporation prior to July 1, 2019, the amount of tax credits available to be obtained by the business annually shall not exceed the reasonable W-2 withholding received by the state for each new full-time job created by a business for applications received by the commerce corporation. For each application approved by the commerce corporation after July 1, 2019, the amount of tax credits available to be obtained by the business annually shall not exceed seventy-five percent (75%) of the reasonable W-2 withholding received by the state for each new full-time job created by a business for applications received by the commerce corporation”. However, under CommerceRI rules and regulations, the “Determination of Tax Credit Amount” section states that the amount of tax credits available to be obtained by the applicant for any year shall not exceed the reasonable W-2 withholding received by the state in that year for each new full-time job created by the applicant regardless of when the application was approved. ORA recommends that CommerceRI amends its rules and regulations to be consistent with what is provided under the program’s governing statute.

New Qualified Jobs Incentive Act
Economic Development Tax Incentive Evaluation 46
Finding #5: The cost of administration represents a significant portion of the tax benefit delivered to taxpayers.
Related Recommendations:
ORA recommends altering the New Qualified Jobs Incentive Act statute to reduce the relatively high cost of administration.
Discussion Supporting Finding #5:
A best practice of tax incentive design is to minimize its cost of administration. The TY 2018 annual revenue forgone as a result of the “New Qualified Jobs Incentive Act” program was $96,042. The TY 2018 annual total cost of administration reported by the Division of Taxation and Commerce Corporation over this same time period was $148,038. Therefore, the cost to administer the program represents 60.7% of the total cost to the state (i.e., $148,038 / ($96,042 + $148,038). Although the cost of administration of the NQJIA program is significant in TY 2018, the cost to administer the program was even higher in TY 2017 at $217,293. For the period TY 2016 – TY 2018 the average cost to administer the program was $157,935 versus $148,038 in TY 2018.
The significant amount of administrative cost of the NQJIA program could be because the determination of who receives the benefit award is a complicated and time-intensive process, especially during the initial phases of the program’s implementation. It is anticipated that as NQJIA tax credit usage increases, the cost of administration will likely decrease as a percentage of the total cost to the state. However, CommerceRI, in conjunction with the General Assembly, should explore refinements to the eligibility criteria that make it less cumbersome to determine whether an applicant to the program will receive a credit.
In addition, the cost of administration is not only associated with the recipients of the tax credit, but also covers the lifecycle of the tax credit authorization process, meaning all the steps from application to credit issuance. In the case of the TY 2016 – 2018 period, a total of 38 companies were considered for NQJIA tax credits with 32 companies being awarded $66.9 million in NQJIA tax credits. Therefore, if the awarded tax credit amount is used instead of the issued tax credit amount, the percentage of cost of administration would be substantially lower at 0.2%. This calculation assumes, however, that no additional administrative costs would be incurred beyond the TY 2016 – TY 2018 period, an unlikely event.
3. ORA Conclusion and Overall Recommendation R.I. Gen. Laws § 44-48.2-5(a) (11) requires the Office of Revenue analysis to make a recommendation “as to whether the tax incentive should be continued, modified, or terminated.” At this time, given the relative low usage of the New Qualified Jobs Incentive Act tax benefit in the start-up phase of the program, the Office of Revenue Analysis recommends that the New Qualified Jobs Incentive Act be maintained but also be modified according to the recommendations described in the previous section. ORA believes it to be unwise to extend the

New Qualified Jobs Incentive Act
Economic Development Tax Incentive Evaluation 47
sunset date of the program beyond one year until ORA can re-evaluate the NQJIA program at higher rates of utilization of the credits.
It is important to recognize, however, that the New Qualified Jobs Incentive Act program as it is currently constituted conflicts with the good tax policy principals of horizontal and vertical equity in the treatment of program participants. The conflict with the principle of vertical equity resides in the fact that the New Qualified Jobs Incentive Act program provides tax relief to companies that create new jobs without regard to the financial wherewithal of the company receiving the incentive. Thus, small local businesses receive the same tax incentive amount on a per job basis as large multi-state or multi-national corporations, despite the latter’s substantially higher overall revenues, and thus greater financial capability to pay for its new jobs. This inequity is tempered somewhat by requiring businesses with more than a specified number of employees to add a greater number of total employees to qualify for the New Qualified Jobs Incentive Act program. On the percentage of total jobs required to be added, however, businesses with fewer than 100 or 200 employees face higher employment hurdles than larger businesses. For example, a company in a targeted industry with 25 employees must add 10 new employees, or 40% of its labor force, to qualify for the NQJIA tax credit whereas a company in a targeted industry with 101 employees need only add 10 employees to qualify for the NQJIA tax credit. This criterion clearly favors larger, presumably “wealthier” employers over smaller ones. One possible solution to this latter issue would be to eliminate the criteria that a minimum number of jobs must be added to qualify for the NQJIA tax credits and that a percentage of current total jobs criteria be employed.
Horizontal equity is compromised by several of the program’s requirements. By design of the program, all new jobs added are not valued equally in terms of the amount of the per job credit a participating company receives. Businesses that operate in targeted industries face lower minimum job thresholds in order to receive the tax credits than businesses that do not operate in a targeted industry. Further, businesses that either operate in targeted industries, or located in a Hope Community or within a transit-oriented development district or are relocating a business unit from out of state receive greater per job subsidies than firms who participate in the program but do not meet these stipulations. The objectives the New Qualified Jobs Incentive Act program is trying to address with these provisions are laudable, but they are not objectives that are specifically noted in Rhode Island General Laws § 44-48.3-2. The long-term economic impact from the NQJIA program could be enhanced if the differential in the per job credit amount were reduced.29
As currently configured, there is a risk that once the enhanced NQJIA tax credits are exhausted firms in favored industries or areas or relocating from out-of-state could significantly reduce operations in the state unless the higher per job subsidy is maintained Even though firms approved to receive NQJIA tax credits are required to maintain the agreed upon jobs for 20% longer than the time period over which the tax credits are received, the claw back provisions in R.I. Gen. Laws §§ 44-48.3-5(a)(7) – 44-48.3-5(a)(8) allow for these same firms to reduce agreed upon jobs by up
29 The actual credit amount available to NQJIA program applicants has been reduced to 75% of withholding taxes paid by employees in jobs for which the tax credit was received effective for applications approved after July 1, 2019. Although this change to the program lowers the overall credit amount, it does not change the fact that credit differentials exist between approved businesses depending on their location in the state or the industry they operate in.

New Qualified Jobs Incentive Act
Economic Development Tax Incentive Evaluation 48
to 20% “in the last tax period prior to the credit amount approval” without losing any future credit amounts or up to 50% without a loss of future credits if the business is operating in the commitment period, the period that is 20% longer than the length of time that the business received NQJIA tax credits.

New Qualified Jobs Incentive Act
Economic Development Tax Incentive Evaluation 49
APPENDICES Appendix A: New Qualified Jobs Incentive Act Application Form

New Qualified Jobs Incentive Act
Economic Development Tax Incentive Evaluation 50

New Qualified Jobs Incentive Act
Economic Development Tax Incentive Evaluation 51

New Qualified Jobs Incentive Act
Economic Development Tax Incentive Evaluation 52

New Qualified Jobs Incentive Act
Economic Development Tax Incentive Evaluation 53
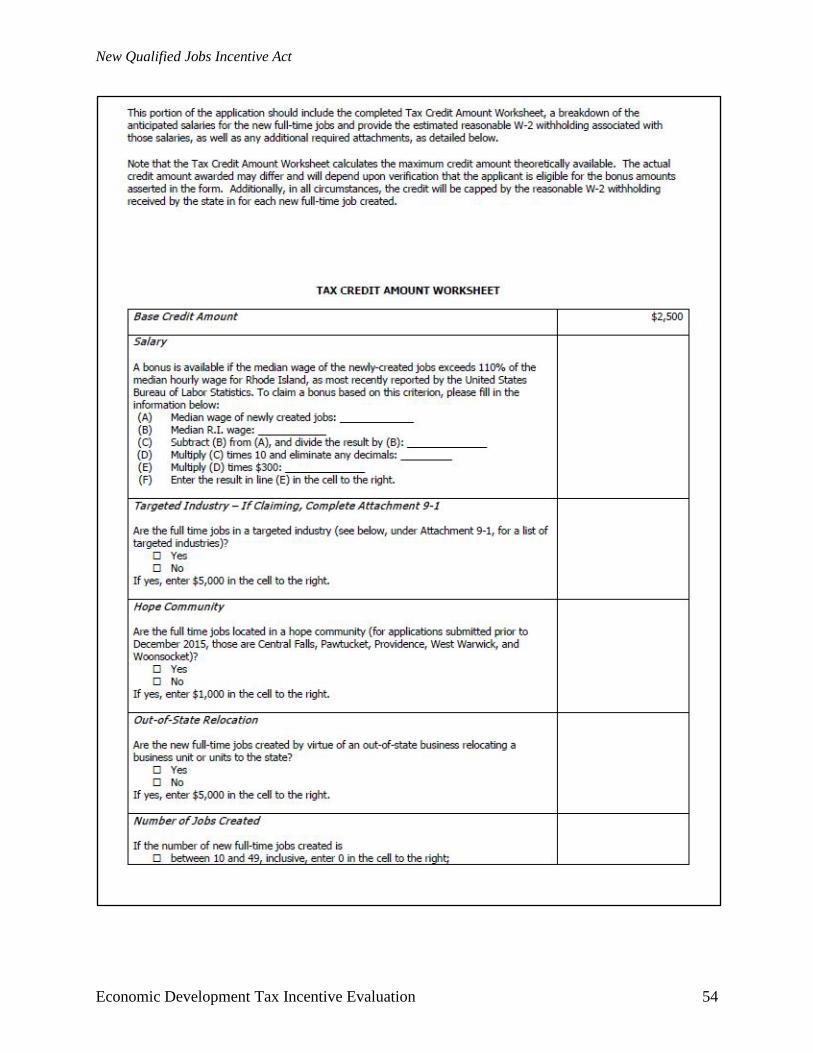
New Qualified Jobs Incentive Act
Economic Development Tax Incentive Evaluation 54

New Qualified Jobs Incentive Act
Economic Development Tax Incentive Evaluation 55

New Qualified Jobs Incentive Act
Economic Development Tax Incentive Evaluation 56

New Qualified Jobs Incentive Act
Economic Development Tax Incentive Evaluation 57

New Qualified Jobs Incentive Act
Economic Development Tax Incentive Evaluation 58

New Qualified Jobs Incentive Act
Economic Development Tax Incentive Evaluation 59
Appendix B: Breakdown of Targeted Industries by Specific NAICS Codes Rhode Island Employment and Wages by Target Industry (TY 2018)
Target Industry NAICS
code Industry Total
Employees Average
Annual Pay Average
Weekly Wage Biomedical Innovation 5417 Scientific research and development services 853 $95,018 $1,827
IT/Software, Cyber-physical systems, Data
5415 Computer systems design and related services 7,439 $93,054 $1,789 5112 Software publishers 755 $128,104 $2,464 5182 Data processing, hosting and related services 559 $97,428 $1,874 5191 Web search portals and internet publishing 603 $40,014 $770
Defense shipbuilding and maritime 3366 Ship and boat building 5,330 $59,691 $1,148
Advanced business services 5416 Management and technical consulting services 2,811 $83,510 $1,606 5413 Architectural, engineering, and related services 4,080 $77,823 $1,497 5511 Management of companies and enterprises 13,314 $121,224 $2,331
Design, food and custom manufacturing
5414 Specialized design services 468 $64,763 $1,245 3399 Other miscellaneous manufacturing 3,874 $45,604 $877 3345 Electronic instrument manufacturing 2,514 $84,364 $1,622 3391 Medical equipment and supplies manufacturing 1,221 $77,574 $1,492 3359 Other electrical equipment and component mfg. 660 $77,332 $1,487 3252 Resins & synthetic rubbers 411 $64,286 $1,236 3344 Semiconductors 592 $64,659 $1,243 3254 Pharmaceuticals 1,196 $117,724 $2,264 3259 Miscellaneous chemicals 838 $74,107 $1,425 3279 Stone & mineral products 399 $65,106 $1,252 722 Food services and drinking places 44,652 $20,210 $389
Transportation, distribution, logistics 48-49 Transportation and warehousing 10,492 $42,554 $818 Education 61 Educational services 20,519 $53,061 $1,020
Hospitality, Arts, Tourism 71 Arts, entertainment, and recreation 9,075 $30,356 $584 721 Accommodation 5,428 $31,664 $609
Total/Average 138,083 $71,218 $1,370 Source: Bureau of Labor Statistics, Quarterly Census of Employment & Wages Note: Total Employment, Annual Pay and Weekly Wage is based on Private employment only.

New Qualified Jobs Incentive Act
Economic Development Tax Incentive Evaluation 60
Appendix C: Agency Groups Breakdown
ORA Categorization Agency Name
•Department of Behavioral Healthcare, Developmental Disabilities, and Hospitals
•Office of the Mental Health Advocate
Behavioral Health and State Hospitals
•Department of Children, Youth, and Families•Office of the Child AdvocateChildren, Youth, and Families
•Department of CorrectionsCorrections
•Judicial Department - Constitution•Office of Public DefenderCourts
•Department of Business Regulation•Department of Labor and Training•Executive Office of Commerce
Economic Development
•Department of Attorney General•General Assembly•Office of Lieutenant Governor•Office of the Governor•Seretary of State•Treasury Department
Elected Officals
•Coastal Resources Management Council•Department of Environmental ManagementEnvironment

New Qualified Jobs Incentive Act
Economic Development Tax Incentive Evaluation 61
ORA Categorization Agency Name
•Department of Administration•Department of RevenueGeneral Government
•Department of Health•Department of Human ServicesHealth and Human Services
•Executive Office of Health and Human ServicesHealth Services
•Community College of Rhode Island•Office of the Postsecondary Commissioner•Rhode Island Atomic Energy Commission•Rhode Island College•University of Rhode Island
Higher Education
•Board of Elections•Commission on the Deaf & Hard of Hearing•Govrnor's Commission on Disabilities•Historical Preservation and Heritage Commission•Rhode Island Commission for Human Rights•Rhode Island Council of the Arts•Rhode Island Ethics Commission
Other
•Elementary and Secondary EducationPublic Education
•Department of Public Safety•Military Staff•Rhode Island Emergency Management Agency•State Fire Marshal
Public Safety

New Qualified Jobs Incentive Act
Economic Development Tax Incentive Evaluation 62
Appendix D: Additional Breakeven Scenarios The following table presents a sensitivity analysis of the New Qualified Jobs Incentive Act. ORA ran different economic scenarios across which the input parameters are being varied accordingly to provide the reader with additional possible breakeven analysis outcomes.
“New Qualified Jobs Incentive Act” Detailed Net Economic & Revenue Impacts
Policy Variable Percentage Assumed Industry Employment 0% 10% 20% 30% 40% 50% 60% 70% 80% 90% 100% Economic & Revenue Impacts Calculated Total Employment (Count) -2 8 16 24 35 45 53 63 71 79 88 Direct Employment 0 5 9 14 18 23 27 32 36 41 45 Indirect Employment 0 2 3 5 6 8 10 12 13 15 16 Induced Employment -2 2 4 6 10 14 16 20 22 24 26 Total GDP ($000) $(190) $1,137 $2,140 $3,211 $4,539 $5,866 $6,868 $8,196 $9,267 $10,269 $11,466 Generated Revenues by Component ($000)
Personal Income Tax (2.3) 9.1 17.7 26.0 37.4 48.9 57.4 68.8 77.2 85.7 92.1 General Business Taxes (0.6) 4.4 8.2 12.1 17.1 22.2 25.9 31.0 34.9 38.6 42.5
Sales and Use Taxes (2.1) 8.3 16.1 23.8 34.2 44.7 52.5 62.9 70.5 78.4 84.2 Other Taxes (0.1) 0.4 0.8 1.2 1.7 2.2 2.6 3.1 3.5 3.9 4.2
Total Departmental Receipts (0.4) 1.3 2.6 3.9 5.5 7.1 8.5 10.1 11.4 12.7 14.2 Other Sources (0.4) 1.3 2.7 4.0 5.7 7.4 8.8 10.5 11.8 13.2 14.7
Cost of Incentive ($000) $(96.0) $(96.0) $(96.0) $(96.0) $(96.0) $(96.0) $(96.0) $(96.0) $(96.0) $(96.0) $(96.0) Total Net Revenues ($000) * $(101.9) $(71.2) $(48.0) $(25.1) $5.7 $36.4 $59.6 $90.3 $113.3 $136.4 $155.8 Source: ORA calculations based on historical Rhode Island revenue amounts and REMI Tax-PI simulations. Note: * The total net revenues represent the difference between the sum of generated revenues and the cost of the tax incentive.

New Qualified Jobs Incentive Act
Economic Development Tax Incentive Evaluation 63