economic drivers - ctbuh web shop · skyscrapers around the world: comparisons with china 7.1...
TRANSCRIPT

Since China embarked on its economic reforms nearly four decades ago, Chinese cities have witnessed profound growth in size and scale. As the country transformed its economy, urbanization took root as millions of rural emigrants moved to the city, refl ected in the commensurate rise of skylines to house growing urban populations, as well as nascent business districts. The resulting cityscapes are littered with immense quantities of skyscrapers, a testament to China’s economic might. While China’s investment in skyscrapers has been nothing short of spectacular, little, in fact, has been investigated about their construction.
Through economic analysis, this report endeavors to test several hypotheses with the goal of investigating the underlying factors driving skyscraper construction. China’s unique economic system creates a number of incentives for skyscraper development, potentially complicating matters beyond traditional economic fundamentals of supply and demand. Further complicating factors include the social and political benefi ts of skyscraper development as well as the symbolic role that skyscrapers can play in building identities for cities.
In order to analyze the various factors impacting skyscraper construction, this research utilizes an exhaustive data set of skyscrapers completed from 1980 to 2014 in 74 cities throughout China. Various regression models were implemented to test for the degree to which skyscraper construction patterns are based on economic fundamentals versus the competitive desire to standout or call attention to respective cities.
The resulting conclusions off er compelling arguments for China’s unprecedented skyscraper construction and provide evidence for a strong economic rationale behind China’s skyscraper growth. In doing so, this report lays the groundwork for additional investigations into the necessary role of the skyscraper in China’s urbanization.
Jason Barr & Jingshu Luo
Economic DriversSkyscrapers in China
CTBUH Research Report

Bibliographic Reference: Barr, J. & Luo, J. (2017) Economic Drivers: Skyscrapers in China. Chicago: Council on Tall Buildings and Urban Habitat.
Principal Researchers / Authors: Jason Barr & Jingshu LuoEditorial Support: Benjamin MandelEditorial and Directional Input: Antony Wood Layout: Kristen Dobbins
© 2017 Council on Tall Buildings and Urban Habitat
Printed in the USA
The right of the Council on Tall Buildings and Urban Habitat to be identified as author of this work has been asserted by them in accordance with sections 77 and 78 of the Copyright, Designs and Patents Act 1988.
All rights reserved. Apart from any fair dealing for the purposes of private study, research, criticism or review as permitted under the Copyright Act, no part of this publication may be reproduced, stored in a retrieval system or transmitted in any form by any means, electronic, mechanical, photocopying, recording or otherwise, without the written permission of the publisher.
Trademark notice: Product or corporate names may be trademarks or registered trademarks, and are used only for identification and explanation without intent to infringe.
Library of Congress Cataloging-in-Publication DataA catalog record has been requested for this book
ISBN: 978-0-939493-55-5
CTBUH HeadquartersThe Monroe Building104 South Michigan Avenue, Suite 620 Chicago, IL 60603, USAPhone: +1 (312) 283-5599Email: [email protected] www.skyscrapercenter.com
CTBUH Asia HeadquartersCollege of Architecture and Urban Planning (CAUP)Tongji University1239 Si Ping Road, Yangpu DistrictShanghai 200092, China Phone: +86 21 65982972Email: [email protected]
CTBUH Research OfficeIuav University of Venice Dorsoduro 200630123 Venice, ItalyPhone: +39 041 257 1276 Email: [email protected] CTBUH Academic OfficeS. R. Crown HallIllinois Institute of Technology 3360 South State StreetChicago, IL 60616Phone: +1 (312) 567 3487Email: [email protected]
Front Cover: Clockwise from top left: Nanjing International Youth Cultural Centre, Nanjing © Daniel Safarik; Two International Finance Centre, Hong Kong © Terri Meyer Boake; CCTV Headquarters, Beijing © Anni Rao; Jin Mao Tower, Shanghai © Tansri Muliani
Principal Researchers / AuthorsJason Barr, Professor, Rutgers University-Newark
Jingshu Luo, Ph.D candidate, Temple University
Research Coordinator & PublisherCouncil on Tall Buildings and Urban Habitat
Research SponsorSun Hung Kai Properties
About the CTBUH Research Seed Funding Program
This project was made possible through the CTBUH International Research Seed Funding initiative, which was created to assist researchers in developing projects and
ideas to a level to secure additional, more significant funding. The program makes an annual award of US$20,000, facilitated by a generous donation from an external
organization. The winner is chosen by the CTBUH Expert Peer Review Panel.
See more at http://ctbuh.org/ResearchSeedFunding

4 |
Executive Summary
Introduction
Land Allocation and Urban Growth
The Economics of Skyscrapers
3.1 A Brief History of the Skyscraper3.2 Benchmarking “Tall”3.3 Studies of Skyscraper Economics
Skyscrapers in China
4.1 A History of Skyscraper Construction in China4.1.1 Shanghai4.1.2 Hong Kong4.1.3 Shenzhen4.1.4 Guangzhou4.1.5 Smaller Cities
4.2 Skyscraper Construction Patterns Across China:A Look at the Data
Hypotheses About China’s Skyscraper Construction
7
16
18
20
202425
28
28293030313233
36
Contents
4.0
5.0
1.0
2.0
3.0

| 5
Data and Regression Models
6.1 The Data6.2 Results
Skyscrapers Around the World: Comparisons with China
7.1 Demand for Skyscrapers Around the World7.2 The Supply Side: Construction Costs
Conclusion
Appendices
9.1 Appendix A: Data Sources and Preparation9.2 Appendix B: Statistics and Regression Results for Data
on Chinese Cities9.3 Appendix C: Results for Skyscrapers Around the World
BibliographyAbout the Research PartnersAbout the AuthorsCTBUH Organization & Members
38
3839
42
4446
48
50
5051
56
58606162
Contents
6.0
7.0
8.0
9.0

Executive Summary | 7
Executive Summary
Introduction
Since 1978, when the Chinese government instituted its economic reforms, China has seen rapid economic and industrial development. Part and parcel with this economic change has been the dramatic growth of China’s cities. As a result, new skylines have been born. While China’s investment in skyscrapers has been nothing short of spectacular, little, in fact, has been investigated about their construction. Using newly collected data on skyscraper completions throughout China, this report performs statistical analyses to study the possible causes for China’s embrace of the tall building.1 In particular this report investigates how much of their frequencies and heights are driven by underlying economic fundamentals versus other sociological and/or political factors.
First, the report investigates the history of skyscraper construction and provides benchmarks for “tall” since World War II. Next, it provides theories and evidence on the growth of skyscrapers in cities throughout China. Lastly, the study provides theories and evidence on the economics of skyscraper construction around the world.
Land Allocation in China
In order to understand the economics of skyscraper construction in China, one must first understand the unique process of land allocation in the country:
• Land allocation reforms in China in the 1980s separated land-use rights and land ownership.
• In 1998, the Constitution was amended to allow local governments to lease out the land-use rights for fixed periods, while ownership of the land itself remained with the municipal governments (Zhang, 2000).
1 See CTBUH Height Criteria at http://ctbuh.org/criteria for a full definition of what constitutes a tall building.

8 | Executive Summary
• Governments lease land through tender, auction, or negotiation. However, in regard to skyscrapers, substantial amounts of urban land have been leased out through direct negotiation between the developer and municipal officials (Cao, Feng, and Tao, 2008).
• For land leased out for skyscrapers, local governments tend to set the project parameters, such as the minimum height of the building or the capital requirements.
• Government officials are often in the driver’s seat, steering skyscraper construction toward municipal goals.
The Economics of Skyscrapers
Beyond the specifics of land allocation in China, it is also important to understand how basic economic principals are applied to tall buildings, beginning with a history of the typology.
History
• One reason why the skyscraper emerged at the end of the 19th century in the United States was the rising demand for office space in America’s urban business districts.
• Elevator technology was key in making the skyscraper possible, and over the past century and a half, vertical transport speeds have improved dramatically.
0
200
400
600
800
Hei
gh
t (m
eter
s) /
Spee
d (m
eter
s p
er m
inut
e)
1000
1200
1885 1905 1925 1945 1965 1985 2005
Figure 0.1. (Orange line): Elevator speeds from 1885 to the present (meters per minute). (Black line): Height of the world’s tallest buildings (meters) from 1885. The dashed black line is to the height of Jeddah Tower, currently under construction. Source: See Appendix A.3

16 | Introduction
Introduction
Since 1978, when the Chinese government instituted its economic reforms, China has seen rapid economic and industrial development. Part and parcel with this economic change has been the dramatic growth of China’s cities. The massive movement of agricultural workers to cities seeking employment in the manufacturing and service sectors represents perhaps the largest internal migration within any a country in world history (Ren, 2013). In 1979, about 18.6% of residents lived in urban areas; by 2014 that figure was about 54.4% (World Bank, 2015).
Commensurate with this rapid rise in urbanization has been the growth of China’s real estate stock. The influx of residents to urban areas has generated the need to house these residents, as well as firms in the rising service sector. As a result, new skylines have been born (see Figure 1.1). While China’s investment in skyscrapers has been nothing short of spectacular, little, in fact, has been investigated about their construction.
What makes Chinese skyscraper construction all the more interesting is that, unlike most Western countries, China does not have a free market in urban land. The land is owned by the respective municipal governments, who sell the development rights. That is to say, the Chinese municipal governments offer ground leases for extended periods of time, such as 50 or 70 years, in exchange for ground rents. Municipal governments use the money collected to fund government operations and infrastructure investments. As such, they have a direct incentive to generate as much income as possible from ground leases.
It is within this context that this research report explores skyscraper construction in China, with the goal of testing several hypotheses. The report seeks to investigate how much of their frequencies and heights are driven by the underlying economic fundamentals versus other sociological and/or political factors. Skyscrapers, because of their size and the quantity of resources needed to create them, can be used for additional purposes beyond simply housing economic activity. Skyscrapers can advertise to the world that a city is “open for business.” In addition, in China, the incentives for skyscraper building seem more dramatic given that municipal officials appear to have several motivations to promote them.
First, as mentioned above, officials aim to maximize revenues from the sale of land-use rights, as a means to increase expenditures on public goods and infrastructure. Second, because Chinese politics is still structured around one party, promotion decisions within the different layers of government are made by party leaders. These leaders evidently value “getting things done” and promote officials who can produce large projects or promote rapid economic development (Yu et al., 2016).
Within this context, however, is the supply issue. Building space across cities is, presumably, substitutable; as a result, if one city goes on a buildings spree, it will lower the price of building space
Figure 1.1. Shanghai’s Pudong area has developed rapidly in only a few decades. The upper photo shows Pudong in 1987, while below is the same area in 2016. © Reuters/pjt56 (cc-by-sa)
1.0

Introduction | 17
1 Unfortunately, the sources that provide information on skyscrapers do not provide year of completion for about 10% of the buildings. Also, if a building is not reported on one of the several websites that were used to collect data then its existence has not been recorded. See Section 6 for more discussion on this.2 This height threshold is made for simplicity for the purposes of this research. Work in New York and Chicago by Barr shows that small changes in the cutoff do not dramatically alter the regressions results.
and can potentially draw economic activity away from other cities – reducing the incentives for construction there.
One aim of this study is to test whether skyscrapers in China are “strategic complements” or “strategic substitutes.” A strategic complement is a good where one provider increases the amount produced as a response to a rival’s production of the good. A strategic substitute is where a producer reduces production as the response to a rival’s increased production (Barr, 2013). If skyscrapers in China are strategic complements, it suggests market players are trying to outdo each other to draw attention or resources to their respective cities. If strategic substitutes, it suggests that the net effect of skyscraper construction is more firmly rooted in the fundamentals of supply and demand, since the market “punishes” those who overbuild for non-profit maximization purposes. A priori, there is no reason to believe one effect is more important than the other.
To test these theories, this project has collected a new data set on skyscraper construction in China. The skyscraper database includes building information up to 2014 for 74 cities throughout Mainland China, Hong Kong, Macau, and Taiwan. First, data was collected for nearly
all recorded 100-plus-meter buildings in each city.1 In this report, the focus is only on buildings that are 100 meters or taller.2
As control variables, data was collected on supply and demand variables that might affect their construction. Using this data set, several regression models were implemented to test for the degree to which skyscraper construction patterns are based on economic fundamentals versus the competitive desire to stand out or call attention to respective cities.
The dependent variables of interest are the annual number of skyscraper completions each year for each city; the height of the tallest building completed in each city, each year; the reigning tallest building in each city, each year; and finally a so-called dummy variable that
takes the value of one if there is a building that is completed in a city-year greater than 200 meters (about 57 stories, on average), or zero otherwise. 200 meters is the chosen cutoff for a “very tall” structure (see Section 6 for more details).
This report proceeds as follows: Section 2 discusses the land allocation process in China. Following that, Section 3 discusses the history of skyscrapers and research on their economics. Section 4 turns to the history of skyscrapers in China. Next, Section 5 discusses the hypotheses about the market for skyscrapers in China that are to be tested. Section 6 then discusses the data set and the results of the statistical tests. Section 7 then compares Chinese skyscraper construction to that of other countries around the world. Finally, Section 8 offers some concluding remarks.
“While China’s investment in skyscrapers has been nothing short of spectacular, little, in fact, has been investigated about their construction.”

20 | The Economics of Skyscrapers
The Economics of Skyscrapers
3.1 A Brief History of the Skyscraper
The skyscraper evolved in the United States beginning in the late 1880s. The Home Insurance Building, completed in 1885 in Chicago, is often considered the first true skyscraper because of its use of an iron skeletal design (see Figure 3.1). It was only 10 stories, but, for the first time, the building walls themselves did not need to bear the load of the structure. Now iron or steel framing would do the work. This was important because masonry load-bearing walls, especially at the ground level, had to have increased thickness in order bear the weight of
the higher floors. This meant that the lower floors would have much less rentable space, rendering the project unprofitable. Iron and steel framing obviated the problem and eliminated a key economic barrier to building height.
But building height must be accompanied by efficient and safe vertical transport. As a result, elevator technology was also key in making the skyscraper possible. Over the past century and a half, vertical transport speeds have improved dramatically. The earliest elevators in the mid-19th
0
200
400
600
800
Hei
gh
t (m
eter
s) /
Spee
d (m
eter
s p
er m
inut
e)
1000
1200
1885 1905 1925 1945 1965 1985 2005
Figure 3.2. (Orange line): Elevator speeds from 1885 to the present (meters per minute). (Black line): Height of world’s tallest buildings (meters) from 1885. The dashed black line is to the height of Jeddah Tower, currently under construction. Source: See Appendix A.3
3 The world’s tallest buildings are listed in The Skyscraper Center. See Appendix A.3 for the list of elevator speeds and sources.
century could lift people at a rate of 12 meters (about three floors) per minute. Today, the Shanghai Tower (2015) can bring people to any of its 128 floors at a top speed of 1,230 meters per minute. Figure 3.2 shows the growth of elevator speeds over the past 150 years for the world’s tallest buildings.3 In fact, the average growth in speeds has been about 2.8% per year. On the same graph is the height of the world’s tallest building at the year of its completion. Though whether elevator speed is a cause or effect of the world’s tallest building is an issue for further study, it is clear that the two go hand-in-hand.
Figure 3.1. The Home Insurance Building, Chicago, is considered the first skyscraper.
3.0
The Economics of Skyscrapers | 21
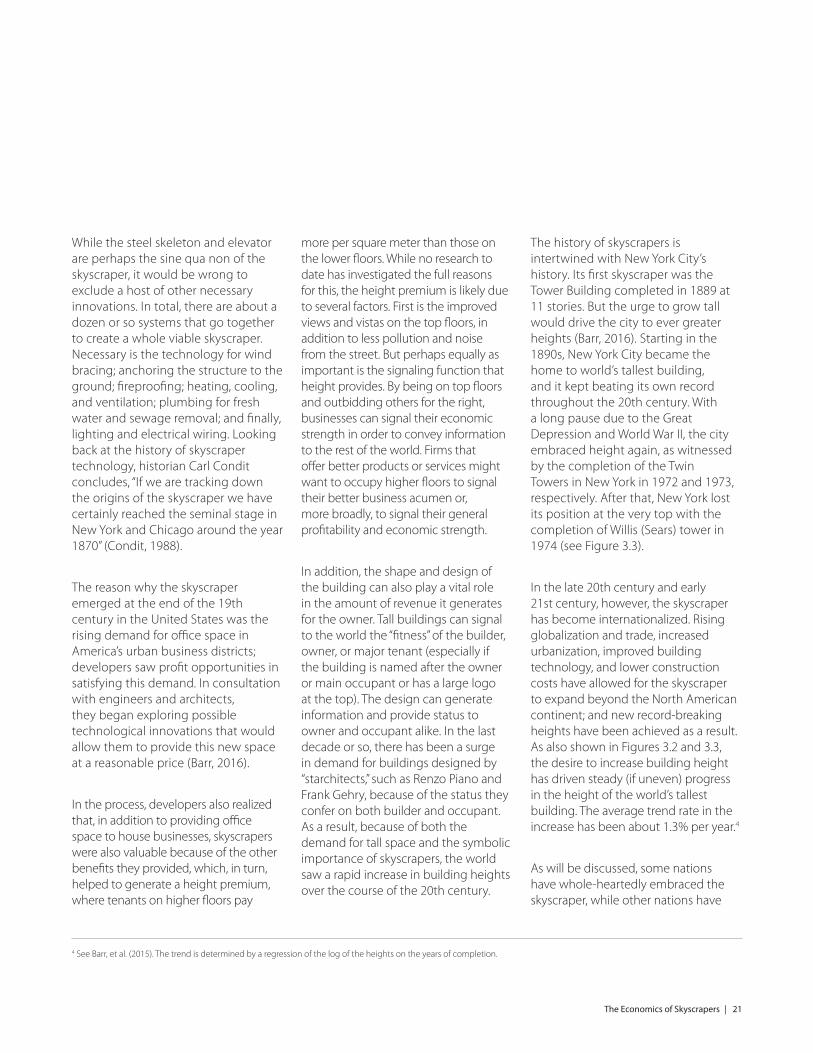
While the steel skeleton and elevator are perhaps the sine qua non of the skyscraper, it would be wrong to exclude a host of other necessary innovations. In total, there are about a dozen or so systems that go together to create a whole viable skyscraper. Necessary is the technology for wind bracing; anchoring the structure to the ground; fireproofing; heating, cooling, and ventilation; plumbing for fresh water and sewage removal; and finally, lighting and electrical wiring. Looking back at the history of skyscraper technology, historian Carl Condit concludes, “If we are tracking down the origins of the skyscraper we have certainly reached the seminal stage in New York and Chicago around the year 1870” (Condit, 1988).
The reason why the skyscraper emerged at the end of the 19th century in the United States was the rising demand for office space in America’s urban business districts; developers saw profit opportunities in satisfying this demand. In consultation with engineers and architects, they began exploring possible technological innovations that would allow them to provide this new space at a reasonable price (Barr, 2016).
In the process, developers also realized that, in addition to providing office space to house businesses, skyscrapers were also valuable because of the other benefits they provided, which, in turn, helped to generate a height premium, where tenants on higher floors pay
more per square meter than those on the lower floors. While no research to date has investigated the full reasons for this, the height premium is likely due to several factors. First is the improved views and vistas on the top floors, in addition to less pollution and noise from the street. But perhaps equally as important is the signaling function that height provides. By being on top floors and outbidding others for the right, businesses can signal their economic strength in order to convey information to the rest of the world. Firms that offer better products or services might want to occupy higher floors to signal their better business acumen or, more broadly, to signal their general profitability and economic strength.
In addition, the shape and design of the building can also play a vital role in the amount of revenue it generates for the owner. Tall buildings can signal to the world the “fitness” of the builder, owner, or major tenant (especially if the building is named after the owner or main occupant or has a large logo at the top). The design can generate information and provide status to owner and occupant alike. In the last decade or so, there has been a surge in demand for buildings designed by “starchitects,” such as Renzo Piano and Frank Gehry, because of the status they confer on both builder and occupant. As a result, because of both the demand for tall space and the symbolic importance of skyscrapers, the world saw a rapid increase in building heights over the course of the 20th century.
The history of skyscrapers is intertwined with New York City’s history. Its first skyscraper was the Tower Building completed in 1889 at 11 stories. But the urge to grow tall would drive the city to ever greater heights (Barr, 2016). Starting in the 1890s, New York City became the home to world’s tallest building, and it kept beating its own record throughout the 20th century. With a long pause due to the Great Depression and World War II, the city embraced height again, as witnessed by the completion of the Twin Towers in New York in 1972 and 1973, respectively. After that, New York lost its position at the very top with the completion of Willis (Sears) tower in 1974 (see Figure 3.3).
In the late 20th century and early 21st century, however, the skyscraper has become internationalized. Rising globalization and trade, increased urbanization, improved building technology, and lower construction costs have allowed for the skyscraper to expand beyond the North American continent; and new record-breaking heights have been achieved as a result. As also shown in Figures 3.2 and 3.3, the desire to increase building height has driven steady (if uneven) progress in the height of the world’s tallest building. The average trend rate in the increase has been about 1.3% per year.4
As will be discussed, some nations have whole-heartedly embraced the skyscraper, while other nations have
4 See Barr, et al. (2015). The trend is determined by a regression of the log of the heights on the years of completion.
28 | Skyscrapers in China
China1
32
3
1
4
8
66
8
12 1213
14
20 20
13
16
22
25
19
36
21
63
68
84
Middle East12
11
9 910
11
17
23
15
6
11
87
33
Europe34
3
5
112
3
111112
1
43
2
8
USA2 222
43
76
7
34
21
211
2
54 4
5
2
5
7
98
9
5
23
12
45
23
9
233
112 2
1
43
1 11 1
North America1
54
778
221
6
44
2
5
21
2111
11
6
11
8
3
65
4
6
10
5
23
12
334
3
9
233
12
12
11
43
1 11 1
1
3
China Current Total: 510
USA Current Total: 182
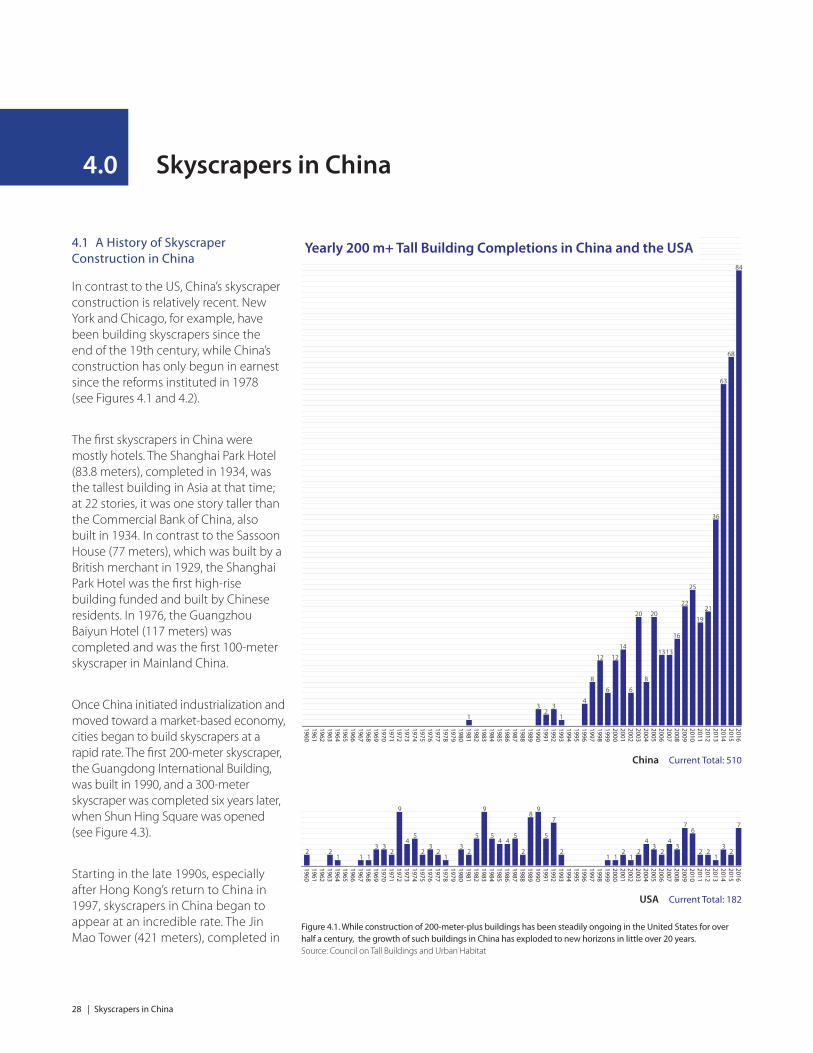
Yearly 200 m+ Tall Building Completions in China and the USA
Skyscrapers in China
4.1 A History of Skyscraper Construction in China
In contrast to the US, China’s skyscraper construction is relatively recent. New York and Chicago, for example, have been building skyscrapers since the end of the 19th century, while China’s construction has only begun in earnest since the reforms instituted in 1978 (see Figures 4.1 and 4.2).
The first skyscrapers in China were mostly hotels. The Shanghai Park Hotel (83.8 meters), completed in 1934, was the tallest building in Asia at that time; at 22 stories, it was one story taller than the Commercial Bank of China, also built in 1934. In contrast to the Sassoon House (77 meters), which was built by a British merchant in 1929, the Shanghai Park Hotel was the first high-rise building funded and built by Chinese residents. In 1976, the Guangzhou Baiyun Hotel (117 meters) was completed and was the first 100-meter skyscraper in Mainland China.
Once China initiated industrialization and moved toward a market-based economy, cities began to build skyscrapers at a rapid rate. The first 200-meter skyscraper, the Guangdong International Building, was built in 1990, and a 300-meter skyscraper was completed six years later, when Shun Hing Square was opened (see Figure 4.3).
Starting in the late 1990s, especially after Hong Kong’s return to China in 1997, skyscrapers in China began to appear at an incredible rate. The Jin Mao Tower (421 meters), completed in
Figure 4.1. While construction of 200-meter-plus buildings has been steadily ongoing in the United States for over half a century, the growth of such buildings in China has exploded to new horizons in little over 20 years. Source: Council on Tall Buildings and Urban Habitat
4.0

Skyscrapers in China | 29
1999 in Shanghai, was ranked as the fourth tallest building in the world at that time, and brought China into the 400-meter era (see Figure 4.4). In 2008, the skyline of Shanghai reached a new milestone, with the completion of the Shanghai World Financial Center (492 meters). In 2015, the 128-story Shanghai Tower was finished; at 632 meters, it is the world’s second-tallest building as of 2017.
Currently, China leads the world in skyscraper construction. In 2016, of the 128 skyscrapers of at least 200 meters completed throughout the world that year, 84 are in China. Additionally, with 11 completions, the city of Shenzhen alone added more 200-plus-meter skyscrapers to its skyline in 2016 than any country besides China (Gabel et al., 2017). Under construction is the 636-meter megatall Wuhan Greenland Center, which will have 125 floors and is expected to complete as the world’s second-tallest building.
4.1.1 Shanghai
Shanghai today is arguably China’s leading skyscraper city. The Pudong New Area, located east of the Huangpu River, is home to the Lujiazui Finance and Trade Zone, the Shanghai Stock Exchange, and many of Shanghai’s tallest structures, such as the Oriental Pearl Tower (a 468-meter TV antenna / observation deck), the Jin Mao Tower, the Shanghai World Financial Center, and the Shanghai Tower. In 2016, Disney opened its Shanghai theme park there, the first Disney park on the Mainland.
Sum
of
Hei
ght
s (m
)
Num
ber
0
10
20
30
80
90
0
1,000
2,000
3,000
19,000
20,000
Total Number (Total = 128)
Sum of Heights (Total = 30,301 m)
Note: One tall building 200 m+ in height was also completed during 2016 in these countries: Azerbaijan; Bahrain; Japan; Kuwait; Mexico; Poland; Russia; Saudi Arabia
2016 Completions: 200 m+ Buildings by Country
Total Number of Countries = 19
2
440
2
4 4 445
2
497
918 855
1,345
2
467
Australia
7
1,650
USA
84
20,081
China UAESingaporeThailandQatarPhilippines Malaysia
5
1,148
IndonesiaSouth Korea
6
2
556
Figure 4.2. In 2016, China dominated the total number of 200-meter-plus completions with 84 out of 128 worldwide, or two-thirds of all completed in that year. Source: Council on Tall Buildings and Urban Habitat
Figure 4.3. Shun Hing Square (384 meters, 1996) was the first supertall in Shenzhen. © Marshall Gerometta
Figure 4.4. Jin Mao Tower, Shanghai (421 meters, 1999) was China’s first 400-plus-meter building. © Shizao (cc-by-sa)
Sum
of
Hei
ght
s (m
)
Num
ber
0
10
20
30
80
90
0
1,000
2,000
3,000
19,000
20,000
Total Number (Total = 128)
Sum of Heights (Total = 30,301 m)
Note: One tall building 200 m+ in height was also completed during 2016 in these countries: Azerbaijan; Bahrain; Japan; Kuwait; Mexico; Poland; Russia; Saudi Arabia
2016 Completions: 200 m+ Buildings by Country
Total Number of Countries = 19
2
440
2
4 4 445
2
497
918 855
1,345
2
467
Australia
7
1,650
USA
84
20,081
China UAESingaporeThailandQatarPhilippines Malaysia
5
1,148
IndonesiaSouth Korea
6
2
556

38 | Data and Regression Models
Data and Regression Models
6.1 The Data
A data set was constructed on skyscrapers and related economic variables to test the hypotheses discussed in the previous section, using regression analysis (the data sources and the descriptive statistics are given in the appendices). A brief account of the data is given here; more details about data processing and analysis can be found in a more technical version of this report (Barr and Luo, 2017). Building data was collected on all recorded skyscraper completions in 74 cities in Mainland China, Hong Kong, Macau, and Taiwan up to 2014. For each building, the city, the year of completion, and the height is included. Note, however, that in the statistical results presented here, the various regressions included only between 51 and 63 cities depending on the available data that could be collected to test the different hypotheses.
From this data, several dependent variables were created. First is the number of 100-plus-meter completions in each city, each year; second is the height of the tallest building completed each year in each city; third is the current tallest building in each city, each year; and fourth is a binary variable that takes on the value of one if a 200-meter building was constructed in a city in a given year, or zero otherwise. This last variable will allow for an estimation of the probability that a very tall building will be completed.
200 meters (about 57 stories) was chosen in this case as a measure of very tall building because it represents a
reasonable balance between tradeoffs relative to building height cutoffs. Building heights below 200 meters may not be considered sufficiently tall to be defined as a “very tall” building; yet raising the threshold to 250 meters or 300 meters introduces problems in the statistical analysis because as one raises the cutoff, the number of buildings above that cutoff decreases rapidly. This then creates a problem where some cities never achieve the cutoff, making it difficult to get meaningful results.
Regarding the data set, building information was taken on skyscrapers from five websites (three from the US and two from China – See Appendix A), and attempts were made to create a database of all 100-meter or taller buildings in China. It is likely, however, that a significant number of buildings were not listed on one of these websites, especially for buildings that are between 100 and 150 meters. In the end, it was decided to perform the statistical analysis with buildings that are 100 meters or taller, despite the fact that the database might not be complete.
The reasons are as follows. First, the statistical analysis is based on the use of four dependent variables and only the completions count is likely to be sensitive to the 100-meter cutoff. The variables for tallest building completed each year, the tallest current building, and the yes/no variable for a 200-meter or taller building are not likely to be altered very much if some 100-meter buildings are missing. Second, this report is aimed at testing hypotheses and studying building patterns in cities throughout China. Despite possibly
having missing data, the buildings that are in the database likely reflect the building patterns across these cities. Since skyscrapers are large structures and concentrated in the largest cities, there is no reason to believe that data is systematically missing from some cities rather than others; as a result, the data set appears to be sufficiently large and representative to enable for a testing of the hypotheses discussed.
In order to investigate the theories described above, a number of other variables were collected. The first set consists of the regional population of each city each year, the regional gross city product (GCP), and the fraction of GCP in a city that comes from the service sector. These three variables are used for testing H1 (Economic Fundamentals).
Regarding testing H2 (Municipal Finances), two variables are used to measure government budgets. First is the total municipal government expenditures in a given year, and the second variable is a budget deficit “dummy” variable that takes on the value of one if expenditures exceed revenues in a given year or zero otherwise. These two variables aim to see if cities with high expenditures and/or deficits are likely to promote skyscrapers to increase development and thus increase land-rights sales, all else equal.
Regarding H3 (Potential Misconduct of Public Officials), this report has included data discussed in Zhu (2012) but collected by Guang Zhang of Xiamen University. The variable is
6.0

Data and Regression Models | 39
the number of measured incidents of misconduct that were found in each city each year by the central government in its prosecution of corruption. Here, the aim is to see if cities with more intensive official involvement are likely to have more skyscrapers, all else equal.
To test H4 (Reputation Building), this research uses data collected by Yu, Zhou, and Zhu (2016), which is the average age of city leaders (local party chiefs and mayors) in each city-year. Since local officials must retire by 65, this study hypothesizes a negative relationship between officials’ ages and skyscraper construction, since younger leaders must produce results if they are going to be promoted within the system. Since their data ends before 2005, this report added to the data up to 2014 (see Appendix A for more information).
Regarding H5 (Urban Advertising), to advertise means to build more or taller than economic fundamentals would suggest, controlling for the other factors. In this case, this study tries to explore how city size affects skyscraper construction patterns by looking at two variables. The first is a quadratic form of city population to see if it has a u-shape or inverted-u shape with respect to the skyscraper measures. A u-shape would suggest smaller cities seek to stand out relative to moderate size cities; an inverted u-shape means middle-size cities build more or taller. The second variable investigated is what is called the city “Fixed Effect.” In short, using regression analysis, this study looks at the differences in skyscraper patterns for each city that are constant (relative to
the other cities) and controlling for the other factors mentioned above. The idea is to look at the size of the fixed effects across China to see if they suggest which cities are more likely to engage in skyscraper construction than others.
To test H6 (Rival Cities), this study employs the statistical method known as spatial autocorrelation regression (SAR). The idea is to see if changes in building patterns in one city positively or negatively affect building patterns in other cities. The SAR method allows for “connecting” cities in different ways, such as by their geographic distances from each other or based on the relative difference in the population or GCPs. The idea is to see if cities with similar sizes or are geographically close to each other are more likely to add height
when their rival cities do. More about this is discussed in Appendix B.
6.2 Results
Several regressions were run to test the different theories; regression tables are given in Appendix B. Generally speaking, the models were implemented using ordinary least squares regression with the inclusion of city dummy variables, as well as year dummy variables. Each of the independent variables discussed above were “lagged” two years. That is to say, this study investigated how skyscraper construction patterns were influenced by things like population and GCP two years prior, since there is a long lag between when construction decisions are made and when a building is completed (Barr, 2010).
“The data strongly supports the theory that skyscraper construction patterns are largely a rational economic phenomenon.”
42 | Skyscrapers Around the World: Comparisons with China
Skyscrapers Around the World: Comparisons with China
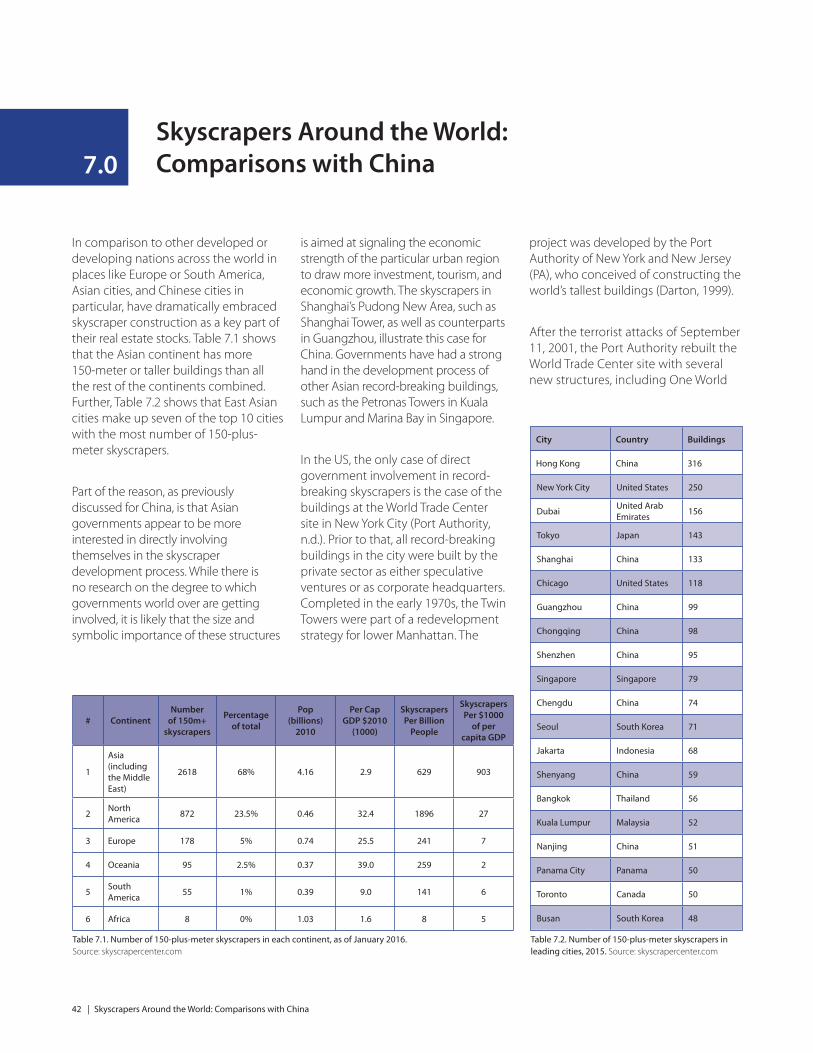
In comparison to other developed or developing nations across the world in places like Europe or South America, Asian cities, and Chinese cities in particular, have dramatically embraced skyscraper construction as a key part of their real estate stocks. Table 7.1 shows that the Asian continent has more 150-meter or taller buildings than all the rest of the continents combined. Further, Table 7.2 shows that East Asian cities make up seven of the top 10 cities with the most number of 150-plus-meter skyscrapers.
Part of the reason, as previously discussed for China, is that Asian governments appear to be more interested in directly involving themselves in the skyscraper development process. While there is no research on the degree to which governments world over are getting involved, it is likely that the size and symbolic importance of these structures
is aimed at signaling the economic strength of the particular urban region to draw more investment, tourism, and economic growth. The skyscrapers in Shanghai’s Pudong New Area, such as Shanghai Tower, as well as counterparts in Guangzhou, illustrate this case for China. Governments have had a strong hand in the development process of other Asian record-breaking buildings, such as the Petronas Towers in Kuala Lumpur and Marina Bay in Singapore.
In the US, the only case of direct government involvement in record-breaking skyscrapers is the case of the buildings at the World Trade Center site in New York City (Port Authority, n.d.). Prior to that, all record-breaking buildings in the city were built by the private sector as either speculative ventures or as corporate headquarters. Completed in the early 1970s, the Twin Towers were part of a redevelopment strategy for lower Manhattan. The
# ContinentNumber
of 150m+ skyscrapers
Percentage of total
Pop (billions)
2010
Per Cap GDP $2010
(1000)
Skyscrapers Per Billion
People
Skyscrapers Per $1000
of per capita GDP
1
Asia (including the Middle East)
2618 68% 4.16 2.9 629 903
2North America
872 23.5% 0.46 32.4 1896 27
3 Europe 178 5% 0.74 25.5 241 7
4 Oceania 95 2.5% 0.37 39.0 259 2
5South America
55 1% 0.39 9.0 141 6
6 Africa 8 0% 1.03 1.6 8 5
City Country Buildings
Hong Kong China 316
New York City United States 250
DubaiUnited Arab Emirates
156
Tokyo Japan 143
Shanghai China 133
Chicago United States 118
Guangzhou China 99
Chongqing China 98
Shenzhen China 95
Singapore Singapore 79
Chengdu China 74
Seoul South Korea 71
Jakarta Indonesia 68
Shenyang China 59
Bangkok Thailand 56
Kuala Lumpur Malaysia 52
Nanjing China 51
Panama City Panama 50
Toronto Canada 50
Busan South Korea 48
Table 7.1. Number of 150-plus-meter skyscrapers in each continent, as of January 2016. Source: skyscrapercenter.com
Table 7.2. Number of 150-plus-meter skyscrapers in leading cities, 2015. Source: skyscrapercenter.com
project was developed by the Port Authority of New York and New Jersey (PA), who conceived of constructing the world’s tallest buildings (Darton, 1999).
After the terrorist attacks of September 11, 2001, the Port Authority rebuilt the World Trade Center site with several new structures, including One World
7.0


Since China embarked on its economic reforms nearly four decades ago, Chinese cities have witnessed profound growth in size and scale. As the country transformed its economy, urbanization took root as millions of rural emigrants moved to the city, refl ected in the commensurate rise of skylines to house growing urban populations, as well as nascent business districts. The resulting cityscapes are littered with immense quantities of skyscrapers, a testament to China’s economic might. While China’s investment in skyscrapers has been nothing short of spectacular, little, in fact, has been investigated about their construction.
Through economic analysis, this report endeavors to test several hypotheses with the goal of investigating the underlying factors driving skyscraper construction. China’s unique economic system creates a number of incentives for skyscraper development, potentially complicating matters beyond traditional economic fundamentals of supply and demand. Further complicating factors include the social and political benefi ts of skyscraper development as well as the symbolic role that skyscrapers can play in building identities for cities.
In order to analyze the various factors impacting skyscraper construction, this research utilizes an exhaustive data set of skyscrapers completed from 1980 to 2014 in 74 cities throughout China. Various regression models were implemented to test for the degree to which skyscraper construction patterns are based on economic fundamentals versus the competitive desire to standout or call attention to respective cities.
The resulting conclusions off er compelling arguments for China’s unprecedented skyscraper construction and provide evidence for a strong economic rationale behind China’s skyscraper growth. In doing so, this report lays the groundwork for additional investigations into the necessary role of the skyscraper in China’s urbanization.
Jason Barr & Jingshu Luo
Economic DriversSkyscrapers in China
CTBUH Research Report