economic eport economic performance and prospects · intermediate services group comprising finance...
TRANSCRIPT

25
Overview
G r o w t h d r i v e n b y s t r o n g d o m e s t i c demand…
Growth prospects for the Malaysian economy remain favourable in 2007, despite uncertainty
in the global economic environment. Strong domestic economic fundamentals will enable the economy to grow at 6.0% in 2007 (2006: 5.9%). On the supply side, output growth is supported by expansion in all sectors of the economy. The services sector is envisaged to contribute significantly to real Gross Domestic Product (GDP) growth, led by robust household spending and buoyant business activity. The manufacturing sector is expected to pick up in the second half of the year on the back of an anticipated recovery in global electronics demand. The agriculture sector will continue to expand, supported by higher output of food commodities. The scheduled implementation of Ninth Malaysia Plan (9MP) projects and improvement in the property market will further boost the construction sector. Output growth of the mining sector is envisaged to turn positive, with increased crude oil production in the second half of the year. On the demand side, growth will be driven by resilient domestic demand of both private and public sectors, largely due to stronger consumer sentiment and business confidence as well as higher Government spending.
On the external front, Malaysia is expected to record a smaller trade surplus, as import growth picks up momentum in line with increased domestic economic activity. Supported by the increase in
inflows of foreign direct investment (FDI), higher tourist arrivals and sustained export earnings, the overall balance of payments (BOP) position is expected to remain strong. Per capita income is envisaged to grow by 7.2% to RM22,345 (2006: 9.9%; RM20,841), while per capita income in terms of Purchasing Power Parity (PPP), is expected to increase by 13.9% to USD13,289 in 2007 (2006: 13.0%; USD11,663).
Sectoral Performance
Services Sector
Services continues to drive GDP growth…
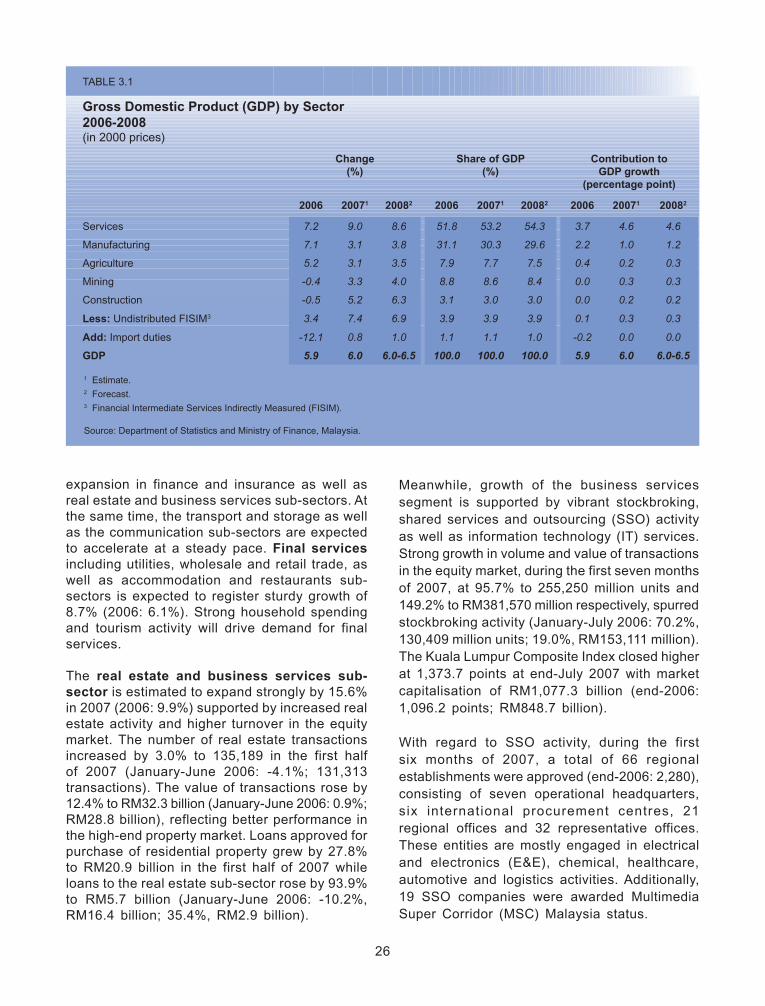
Value added of all sectors in the economy is expected to record positive growth, led by the services sector, as shown in Table 3.1. In 2007, the services sector is expected to register solid growth of 9.0% (2006: 7.2%), exceeding the overall expansion of the economy. Growth in the sector is projected to surpass that of the manufacturing sector and contribute 4.6 percentage points to GDP growth (2006: 3.7 percentage points). This reflects a gradual shift in the structure of the Malaysian economy, from manufacturing to services.
Growth in the services sector is led by the intermediate services group comprising finance and insurance, real estate and business services, transport and storage as well as communication sub-sectors. The intermediate services group is estimated to grow at a faster pace of 10.6% in 2007 (2006: 7.6%), underpinned by double-digit
3 Economic Performance and Prospects
Economic Report 2007/2008
26
expansion in finance and insurance as well as real estate and business services sub-sectors. At the same time, the transport and storage as well as the communication sub-sectors are expected to accelerate at a steady pace. Final services including utilities, wholesale and retail trade, as well as accommodation and restaurants sub-sectors is expected to register sturdy growth of 8.7% (2006: 6.1%). Strong household spending and tourism activity will drive demand for final services.
The real estate and business services sub-sector is estimated to expand strongly by 15.6% in 2007 (2006: 9.9%) supported by increased real estate activity and higher turnover in the equity market. The number of real estate transactions increased by 3.0% to 135,189 in the first half of 2007 (January-June 2006: -4.1%; 131,313 transactions). The value of transactions rose by 12.4% to RM32.3 billion (January-June 2006: 0.9%; RM28.8 billion), reflecting better performance in the high-end property market. Loans approved for purchase of residential property grew by 27.8% to RM20.9 billion in the first half of 2007 while loans to the real estate sub-sector rose by 93.9% to RM5.7 billion (January-June 2006: -10.2%, RM16.4 billion; 35.4%, RM2.9 billion).
Meanwhile, growth of the business services segment is supported by vibrant stockbroking, shared services and outsourcing (SSO) activity as well as information technology (IT) services. Strong growth in volume and value of transactions in the equity market, during the first seven months of 2007, at 95.7% to 255,250 million units and 149.2% to RM381,570 million respectively, spurred stockbroking activity (January-July 2006: 70.2%, 130,409 million units; 19.0%, RM153,111 million). The Kuala Lumpur Composite Index closed higher at 1,373.7 points at end-July 2007 with market capitalisation of RM1,077.3 billion (end-2006: 1,096.2 points; RM848.7 billion).
With regard to SSO activity, during the first six months of 2007, a total of 66 regional establishments were approved (end-2006: 2,280), consisting of seven operational headquarters, six international procurement centres, 21 regional offices and 32 representative offices. These entities are mostly engaged in electrical and electronics (E&E), chemical, healthcare, automotive and logistics activities. Additionally, 19 SSO companies were awarded Multimedia Super Corridor (MSC) Malaysia status.
TABLE 3.1
Gross Domestic Product (GDP) by Sector2006-2008(in 2000 prices)
Change(%)
Share of GDP(%)
Contribution toGDP growth
(percentage point)
2006 20071 20082 2006 20071 20082 2006 20071 20082
Services 7.2 9.0 8.6 51.8 53.2 54.3 3.7 4.6 4.6
Manufacturing 7.1 3.1 3.8 31.1 30.3 29.6 2.2 1.0 1.2
Agriculture 5.2 3.1 3.5 7.9 7.7 7.5 0.4 0.2 0.3
Mining -0.4 3.3 4.0 8.8 8.6 8.4 0.0 0.3 0.3
Construction -0.5 5.2 6.3 3.1 3.0 3.0 0.0 0.2 0.2
Less: Undistributed FISIM3 3.4 7.4 6.9 3.9 3.9 3.9 0.1 0.3 0.3
Add: Import duties -12.1 0.8 1.0 1.1 1.1 1.0 -0.2 0.0 0.0
GDP 5.9 6.0 6.0-6.5 100.0 100.0 100.0 5.9 6.0 6.0-6.5
1 Estimate.2 Forecast.3 Financial Intermediate Services Indirectly Measured (FISIM).
Source: Department of Statistics and Ministry of Finance, Malaysia.

27
As for IT services, as at end-July 2007 there are 1,875 MSC Malaysia status companies, of which 1,394 are Malaysian owned, while 92 are multinational companies (MNCs). During the first seven months of 2007, a total of 147 new MSC Malaysia status companies were approved (January-July 2006: 131 new companies). These companies are expected to create 9,775 jobs with total investment of RM1.8 billion by the third year of operations. In terms of technology, the new companies are involved in creative multimedia (16.3%), application software (40.1%), mobility, embedded software and hardware (19.0%) as well as internet-based business (10.2%). The roll-out of MSC Malaysia to the Northern, Southern and other economic corridors is expected to further boost the business services sub-sector.
The finance and insurance sub-sector is expected to expand by 10.7% in 2007 (2006: 7.7%). Growth will be supported by steady financing activity for consumer credit and business investment, and new range of products and services for retirement savings, investment
and insurance. The growth in Islamic financing will also have a favourable impact on the sub-sector’s performance as industry players expand their business, benefitting from a growing pool of domestic savings and the positioning of the country as a major Islamic financial hub. As at end-June 2007, total loans outstanding of the banking system grew by 6.0% to RM614 billion (end-2006: 6.3%; RM593 billion), with loans to small and medium enterprises (SMEs) and households comprising 17.4% and 56.1%, respectively (end-June 2006: 17.5%; 55.5%). Increased product innovation as well as higher interest and fee-based income boosted the banking system. Meanwhile, growth of the sub-sector was also supported by increased insurance activity led by strong demand for investment-linked as well as medical and health insurance products.
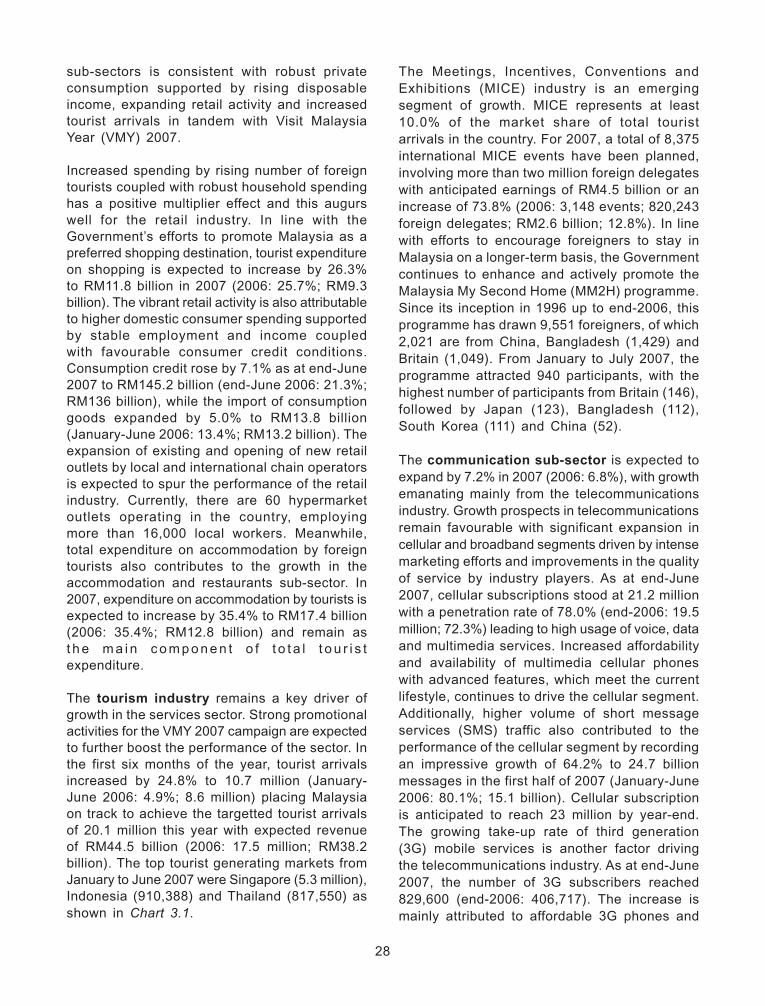
Growth of the wholesale and retail trade sub-sector is envisaged to strengthen by 11.6% in 2007 (2006: 7.1%), while the accommodation and restaurants sub-sector is expected to grow by 9.4% (2006: 6.0%). The strong growth in both
TABLE 3.2
Services Sector Performance2006-2008(in 2000 prices)
Change(%)
Share of GDP(%)
2006 20071 20082 2006 20071 20082
Intermediate Services
Transport and storage 5.2 7.6 7.8 3.6 3.7 3.7
Communication 6.8 7.2 7.7 3.7 3.8 3.8
Finance and insurance 7.7 10.7 9.2 10.2 10.7 11.0
Real estate and business services 9.9 15.6 9.8 4.6 5.0 5.1
Final Services
Utilities (electricity, water and gas) 5.2 4.6 5.0 3.1 3.0 3.0
Wholesale and retail trade 7.1 11.6 10.0 11.6 12.2 12.6
Accommodation and restaurants 6.0 9.4 9.5 2.2 2.3 2.3
Other services 4.7 5.0 5.9 5.8 5.7 5.7
Government services 9.8 4.6 8.6 7.1 7.0 7.1
Total 7.2 9.0 8.6 51.8 53.2 54.3
1 Estimate.2 Forecast.
Source: Department of Statistics and Ministry of Finance, Malaysia.
28
sub-sectors is consistent with robust private consumption supported by rising disposable income, expanding retail activity and increased tourist arrivals in tandem with Visit Malaysia Year (VMY) 2007.
Increased spending by rising number of foreign tourists coupled with robust household spending has a positive multiplier effect and this augurs well for the retail industry. In line with the Government’s efforts to promote Malaysia as a preferred shopping destination, tourist expenditure on shopping is expected to increase by 26.3% to RM11.8 billion in 2007 (2006: 25.7%; RM9.3 billion). The vibrant retail activity is also attributable to higher domestic consumer spending supported by stable employment and income coupled with favourable consumer credit conditions. Consumption credit rose by 7.1% as at end-June 2007 to RM145.2 billion (end-June 2006: 21.3%; RM136 billion), while the import of consumption goods expanded by 5.0% to RM13.8 billion (January-June 2006: 13.4%; RM13.2 billion). The expansion of existing and opening of new retail outlets by local and international chain operators is expected to spur the performance of the retail industry. Currently, there are 60 hypermarket outlets operating in the country, employing more than 16,000 local workers. Meanwhile, total expenditure on accommodation by foreign tourists also contributes to the growth in the accommodation and restaurants sub-sector. In 2007, expenditure on accommodation by tourists is expected to increase by 35.4% to RM17.4 billion (2006: 35.4%; RM12.8 billion) and remain as t h e m a i n c o m p o n e n t o f t o t a l t o u r i s t expenditure.
The tourism industry remains a key driver of growth in the services sector. Strong promotional activities for the VMY 2007 campaign are expected to further boost the performance of the sector. In the first six months of the year, tourist arrivals increased by 24.8% to 10.7 million (January-June 2006: 4.9%; 8.6 million) placing Malaysia on track to achieve the targetted tourist arrivals of 20.1 million this year with expected revenue of RM44.5 billion (2006: 17.5 million; RM38.2 billion). The top tourist generating markets from January to June 2007 were Singapore (5.3 million), Indonesia (910,388) and Thailand (817,550) as shown in chart 3.1.
The Meetings, Incentives, Conventions and Exhibitions (MICE) industry is an emerging segment of growth. MICE represents at least 10.0% of the market share of total tourist arrivals in the country. For 2007, a total of 8,375 international MICE events have been planned, involving more than two million foreign delegates with anticipated earnings of RM4.5 billion or an increase of 73.8% (2006: 3,148 events; 820,243 foreign delegates; RM2.6 billion; 12.8%). In line with efforts to encourage foreigners to stay in Malaysia on a longer-term basis, the Government continues to enhance and actively promote the Malaysia My Second Home (MM2H) programme. Since its inception in 1996 up to end-2006, this programme has drawn 9,551 foreigners, of which 2,021 are from China, Bangladesh (1,429) and Britain (1,049). From January to July 2007, the programme attracted 940 participants, with the highest number of participants from Britain (146), followed by Japan (123), Bangladesh (112), South Korea (111) and China (52).
The communication sub-sector is expected to expand by 7.2% in 2007 (2006: 6.8%), with growth emanating mainly from the telecommunications industry. Growth prospects in telecommunications remain favourable with significant expansion in cellular and broadband segments driven by intense marketing efforts and improvements in the quality of service by industry players. As at end-June 2007, cellular subscriptions stood at 21.2 million with a penetration rate of 78.0% (end-2006: 19.5 million; 72.3%) leading to high usage of voice, data and multimedia services. Increased affordability and availability of multimedia cellular phones with advanced features, which meet the current lifestyle, continues to drive the cellular segment. Additionally, higher volume of short message services (SMS) traffic also contributed to the performance of the cellular segment by recording an impressive growth of 64.2% to 24.7 billion messages in the first half of 2007 (January-June 2006: 80.1%; 15.1 billion). Cellular subscription is anticipated to reach 23 million by year-end. The growing take-up rate of third generation (3G) mobile services is another factor driving the telecommunications industry. As at end-June 2007, the number of 3G subscribers reached 829,600 (end-2006: 406,717). The increase is mainly attributed to affordable 3G phones and

29
innovative offerings. On the other hand, the number of fixed line subscribers grew marginally by 0.3% to 4.4 million (end-June 2006: -0.3%; 4 .3 mi l l ion) , fo l lowing the migrat ion of traditional f ixed l ine customers to mobile services.
As at end-June 2007, the internet dial-up subscriber base grew by 3.6% to 3.9 million (end-June 2006: 4.5%; 3.7 million) and is expected to reach four million by year-end. Consequently, the broadband subscriber base expanded by 68.4% to 1.1 million with a penetration rate of 4.1% (end-June 2006: 84.9%; 653,100; 2.5%). Service providers are continuously deploying broadband infrastructure and services to sub-urban and rural areas as well as introducing new attractive packages to increase the broadband take-up rate. Wireless internet adoption is on the rise with the number of hotspots nationwide rising steadily to 1,463 as at end-June 2007 (end-June 2006: 1,320). The award of four World Interoperability for Microwave Access (WiMAX) licences in March 2007 enables new players to provide wider coverage and broad bandwidth
suited for both rural and urban areas, which is expected to further boost the broadband penetration rate. These improvements are in line with the Government’s effort to increase the national residential broadband penetration rate to 50.0% by 2010 and thereby narrowing the digital divide.
Although electronic media is widely used today, conventional mail remains a relevant medium of communication. The overall mail (ordinary and registered letters and parcels) volume handled by Pos Malaysia Berhad (PMB) grew by 7.8% to 652 million items in the first six months of 2007 (January-June 2006: -2.9%; 605 million). Letter mail increased by 8.0% to 639.7 million items (January-June 2006: -2.6%; 592.2 million) while the parcel segment declined by 11.9% to 587,977 items (January-June 2006: 12.0%; 667,161). Despite the decline during the first half of the year, the parcel segment is anticipated to pick up in the second half to record positive growth of 8.9% to 1.4 million items in 2007 (2006: 5.9%; 1.3 million), largely due to increased activity, consistent with the

30
CONTRIBUTION OF TOURISM TO MALAYSIA’S ECONOMIC GROWTH
INTRODUCTION
Tourism, one of the world’s largest and fastest growing industries, accounted for 10.3% of world Gross Domestic Product (GDP) and provided 234 million jobs or 8.2% of total employment, worldwide in 2006. The United Nations World Tourism Organisation (UNWTO) forecast international tourist arrivals worldwide to reach 1.1 billion by the year 2010. Past trends show that traditionally 80.0% of international travel takes place within the same region. In recent years, long-haul travel has increased, a development which Malaysia can leverage on to increase its share of tourist arrivals and receipts.
DEvELOPMENT OF TOURISM INDUSTRY IN MALAYSIA
The tourism industry has contributed significantly to the Malaysian economy over the last 30 years, particularly in terms of foreign exchange earnings and job creation. The sector has evolved from one that served domestic and regional tourists in the 1970s to cater for mass tourism in the 1980s. Since the 1990s, greater emphasis has been given to segment the tourism market, including developing niche products to increase the volume of high-spending tourists as well as attract long-haul tourists.
In promoting the industry, the private sector has been encouraged to develop tourism products to meet market demand, while the Government complements private initiatives by providing infrastructure and facilities. The emphasis is on improving existing resources as well as developing more interesting travel and tour products of high quality which provide value-for-money. Among the measures taken over the years to encourage private sector efforts to develop tourism, include the setting up of two specific tourism funds, namely, the Tourism Infrastructure Fund and SME Tourism Fund. These funds are aimed at meeting the increased demand for easier financing of new tourism projects as well as to expand and upgrade existing tourism infrastructure and amenities.
To increase participation of the local population in tourism-related economic activities, the Government has initiated the Homestay programme and Student Tourism Clubs. The Silver Hair programme was replaced with the Malaysia My Second Home (MM2H) programme in 2002 to encourage foreign participants to extend their stay in the country. To improve service standards of frontliners in the industry, the Government initiated training courses such as ‘Think Tourism’, `Eco-Host’ and `Mesra Malaysia’.
Meanwhile, sustainable tourism development will be promoted and this is reflected in the recognition given by the United Nations Educational Scientific and Cultural Organisation (UNESCO) declaring Langkawi as a geopark on June 1, 2007, the first in Southeast Asia and 52nd in the world. Langkawi is the only geopark in the world, comprising 99 islands with duty-free status.
CONTRIBUTION OF TOURISM TO ECONOMIC GROWTH
Tourist receipts and contribution to GDP
The tourism industry has performed favourably. Tourist arrivals have increased almost 15-fold from 1.2 million in 1974 to 17.5 million in 2006. Likewise, gross earnings have also increased to RM38.2 billion in 2006, accounting for 6.7% of nominal GDP. Given that Visit Malaysia Year (VMY) 2007 campaign has been well-received as reflected in higher tourist arrivals in the first six months of the year, it is anticipated that gross receipts would increase further and contribute to 7.1% of GDP in 2007.
31
2000 2001 2002 2003 2004 2005 2006 20071 20082
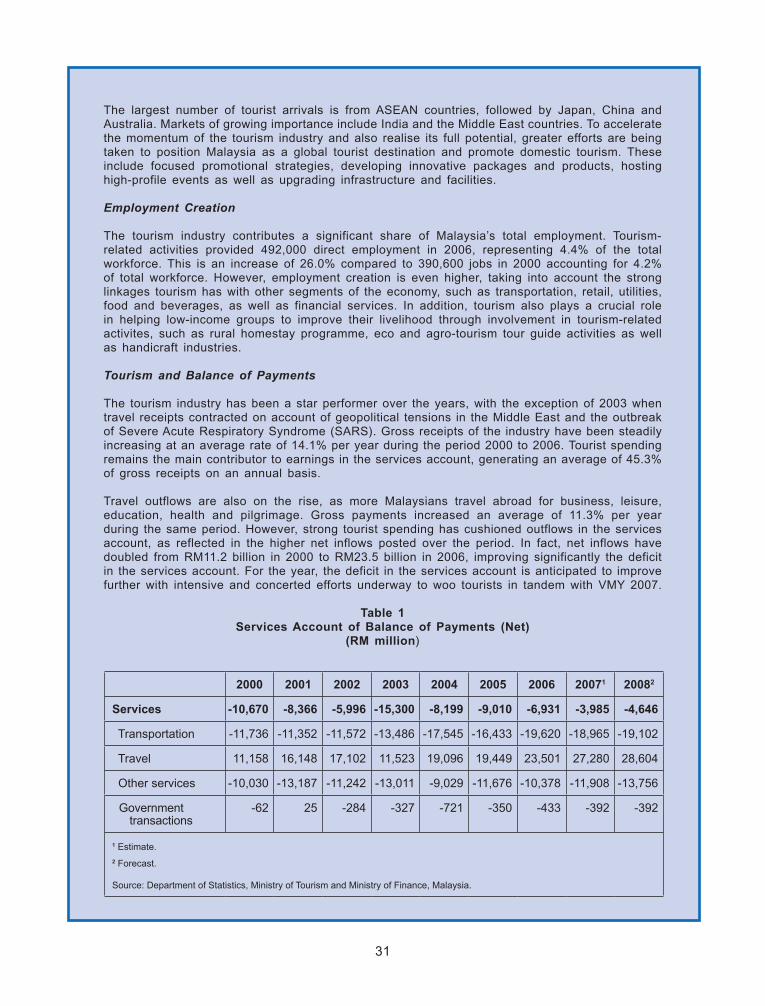
Services -10,670 -8,366 -5,996 -15,300 -8,199 -9,010 -6,931 -3,985 -4,646
Transportation -11,736 -11,352 -11,572 -13,486 -17,545 -16,433 -19,620 -18,965 -19,102
Travel 11,158 16,148 17,102 11,523 19,096 19,449 23,501 27,280 28,604
Other services -10,030 -13,187 -11,242 -13,011 -9,029 -11,676 -10,378 -11,908 -13,756
Government transactions
-62 25 -284 -327 -721 -350 -433 -392 -392
1 Estimate.
2 Forecast.
Source: Department of Statistics, Ministry of Tourism and Ministry of Finance, Malaysia.
The largest number of tourist arrivals is from ASEAN countries, followed by Japan, China and Australia. Markets of growing importance include India and the Middle East countries. To accelerate the momentum of the tourism industry and also realise its full potential, greater efforts are being taken to position Malaysia as a global tourist destination and promote domestic tourism. These include focused promotional strategies, developing innovative packages and products, hosting high-profile events as well as upgrading infrastructure and facilities.
Employment Creation
The tourism industry contributes a significant share of Malaysia’s total employment. Tourism-related activities provided 492,000 direct employment in 2006, representing 4.4% of the total workforce. This is an increase of 26.0% compared to 390,600 jobs in 2000 accounting for 4.2% of total workforce. However, employment creation is even higher, taking into account the strong linkages tourism has with other segments of the economy, such as transportation, retail, utilities, food and beverages, as well as financial services. In addition, tourism also plays a crucial role in helping low-income groups to improve their livelihood through involvement in tourism-related activites, such as rural homestay programme, eco and agro-tourism tour guide activities as well as handicraft industries.
Tourism and Balance of Payments
The tourism industry has been a star performer over the years, with the exception of 2003 when travel receipts contracted on account of geopolitical tensions in the Middle East and the outbreak of Severe Acute Respiratory Syndrome (SARS). Gross receipts of the industry have been steadily increasing at an average rate of 14.1% per year during the period 2000 to 2006. Tourist spending remains the main contributor to earnings in the services account, generating an average of 45.3% of gross receipts on an annual basis.
Travel outflows are also on the rise, as more Malaysians travel abroad for business, leisure, education, health and pilgrimage. Gross payments increased an average of 11.3% per year during the same period. However, strong tourist spending has cushioned outflows in the services account, as reflected in the higher net inflows posted over the period. In fact, net inflows have doubled from RM11.2 billion in 2000 to RM23.5 billion in 2006, improving significantly the deficit in the services account. For the year, the deficit in the services account is anticipated to improve further with intensive and concerted efforts underway to woo tourists in tandem with VMY 2007.
Table 1 Services Account of Balance of Payments (Net)
(RM million)
32
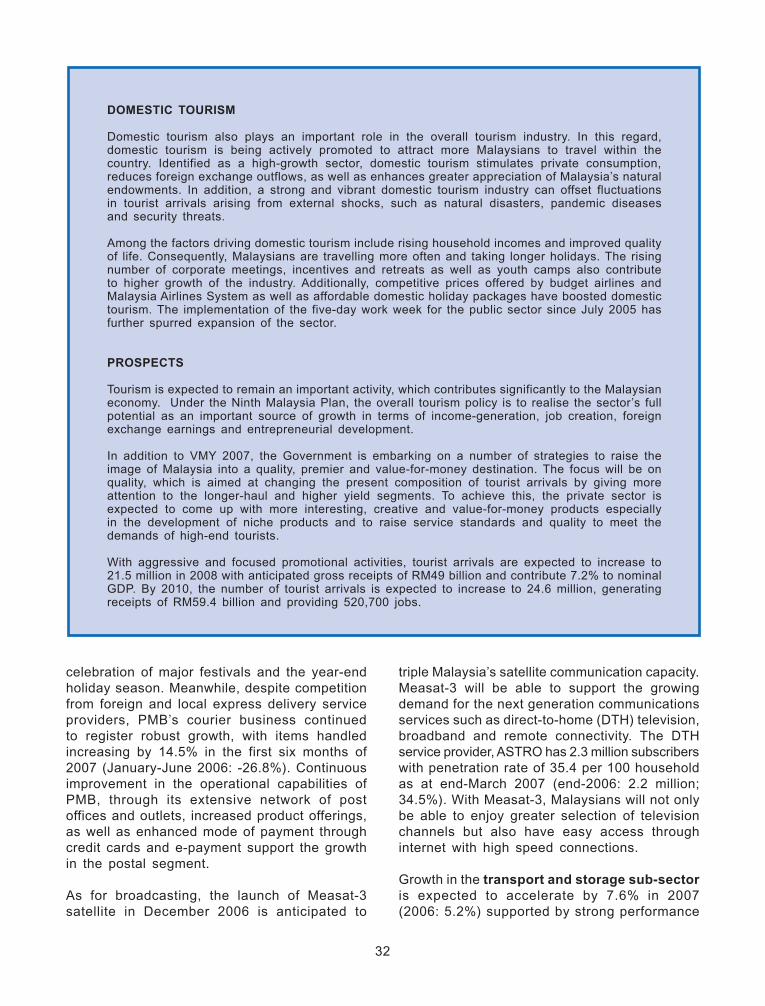
DOMESTIC TOURISM
Domestic tourism also plays an important role in the overall tourism industry. In this regard, domestic tourism is being actively promoted to attract more Malaysians to travel within the country. Identified as a high-growth sector, domestic tourism stimulates private consumption, reduces foreign exchange outflows, as well as enhances greater appreciation of Malaysia’s natural endowments. In addition, a strong and vibrant domestic tourism industry can offset fluctuations in tourist arrivals arising from external shocks, such as natural disasters, pandemic diseases and security threats.
Among the factors driving domestic tourism include rising household incomes and improved quality of life. Consequently, Malaysians are travelling more often and taking longer holidays. The rising number of corporate meetings, incentives and retreats as well as youth camps also contribute to higher growth of the industry. Additionally, competitive prices offered by budget airlines and Malaysia Airlines System as well as affordable domestic holiday packages have boosted domestic tourism. The implementation of the five-day work week for the public sector since July 2005 has further spurred expansion of the sector.
PROSPECTS
Tourism is expected to remain an important activity, which contributes significantly to the Malaysian economy. Under the Ninth Malaysia Plan, the overall tourism policy is to realise the sector’s full potential as an important source of growth in terms of income-generation, job creation, foreign exchange earnings and entrepreneurial development.
In addition to VMY 2007, the Government is embarking on a number of strategies to raise the image of Malaysia into a quality, premier and value-for-money destination. The focus will be on quality, which is aimed at changing the present composition of tourist arrivals by giving more attention to the longer-haul and higher yield segments. To achieve this, the private sector is expected to come up with more interesting, creative and value-for-money products especially in the development of niche products and to raise service standards and quality to meet the demands of high-end tourists.
With aggressive and focused promotional activities, tourist arrivals are expected to increase to 21.5 million in 2008 with anticipated gross receipts of RM49 billion and contribute 7.2% to nominal GDP. By 2010, the number of tourist arrivals is expected to increase to 24.6 million, generating receipts of RM59.4 billion and providing 520,700 jobs.
celebration of major festivals and the year-end holiday season. Meanwhile, despite competition from foreign and local express delivery service providers, PMB’s courier business continued to register robust growth, with items handled increasing by 14.5% in the first six months of 2007 (January-June 2006: -26.8%). Continuous improvement in the operational capabilities of PMB, through its extensive network of post offices and outlets, increased product offerings, as well as enhanced mode of payment through credit cards and e-payment support the growth in the postal segment.
As for broadcasting, the launch of Measat-3 satellite in December 2006 is anticipated to
triple Malaysia’s satellite communication capacity. Measat-3 will be able to support the growing demand for the next generation communications services such as direct-to-home (DTH) television, broadband and remote connectivity. The DTH service provider, ASTRO has 2.3 million subscribers with penetration rate of 35.4 per 100 household as at end-March 2007 (end-2006: 2.2 million; 34.5%). With Measat-3, Malaysians will not only be able to enjoy greater selection of television channels but also have easy access through internet with high speed connections.
Growth in the transport and storage sub-sector is expected to accelerate by 7.6% in 2007 (2006: 5.2%) supported by strong performance
33
in travel and robust trade-related activities. Backed by increasing growth in world container trade, container handling at seven major ports (Klang, Johor, Tanjung Pelepas (PTP), Kuantan, Penang, Bintulu and Kuching) recorded strong growth of 14.7% to 7.3 million twenty-foot equivalent units (TEUs) during the first half of 2007 (January-June 2006: 9.6%; 6.3 million TEUs). Increased efficiency and productivity of ports as well as capacity expansion also contributed to the strong growth. Dredging activities to deepen wharfs, increasing number of berths to secure more shipping lines with larger vessels as well as continuous efforts in upgrading facilities and services have led to brisk port activity. Port Klang, which comprises Northport and Westports, contributed 46.6% of the total container throughput and handled 3.4 million TEUs, while PTP handled 2.7 million TEUs or 37.5% of total container handled. Meanwhile, the number of ships calling at the major ports increased to 21,729 ships (January-June 2006: 21,710 ships) with Port Klang dominating 38.4% of the ship calls. Port Klang and PTP have been continuously included in the World Top 20 Container Ports since 2003.
In addition, these major ports have taken initiatives to provide various support services. Port Klang has diversified its business to leverage on value-added services such as providing distribution park (distripark) services, halal hub services, vehicle transit centres, handling of conventional cargo and trade with smaller vessels. PTP administers the 800-hectare Pelepas Free Zone, which provides facilities for commercial and industrial activities. Companies operating in the free zone are involved in total logistics provision, distribution and warehousing; shipbuilding, repair and maintenance; and manufacturing of electronics, drilling systems for the oil and gas industry as well as contact lens. As PTP is part of the Southern economic corridor, investment into the free zone is expected to pick up, generating indigenous cargo.
Land transportation continues to record positive growth supported by increased land and rail infrastructure as well as improvements in facilities and services provided. The number of vehicles on tolled highways increased to 551 million in the first half of the year (January-June 2006: 545 million). The average daily ridership on bus services by RapidKL rose to 161,000 passengers
at end-June 2007 (end-June 2006: 104,000). Increase in number of buses, frequency of service, areas served and innovative pricing encouraged more people to use the bus services. Public bus services were further enhanced with RapidPenang commencing operations since 31 July 2007. Ridership on urban rail services in the Klang Valley and surrounding areas, improved by 4.5% to 82 million passengers during the first half of 2007 (January-June 2006: 2.8%; 78.5 million) due to the introduction of the integrated ticketing system, increase in capacity, affordable fares and increased efficiency of service providers. Growth was also supported by the extension of the KTM Komuter service from Rawang to Rasa since April this year, which is expected to boost passenger volume by two million a year. Improvements in urban transport services are in line with the Government’s effort to encourage the use of public transport and reduce traffic congestion in Kuala Lumpur.
Meanwhile, passenger traffic on the Keretapi Tanah Melayu Berhad (KTMB) inter-city trains declined by 7.7% to 1.7 million passengers (January-June 2006: 8.5%; 1.9 million) while revenue earned contracted by 3.1% to RM32.8 million (January-June 2006: 7.8%; RM33.9 million). In contrast, cargo revenue of KTMB recorded strong growth of 8.4% to RM58.7 million (January-June 2006: 0.3%; RM54.1 million) due to higher demand and improved services with high-powered locomotives. These high-speed locomotives are capable of reducing travel time and able to transport larger volume of goods as the number of attached wagons can be increased. Significant progress was achieved in the northern region, to transport cargo from Padang Besar to Penang Port, mainly rubber-based products and processed canned food from Southern Thailand. Furthermore, ongoing projects such as the Rawang-Ipoh electrified double-tracking project, is expected to f u r t h e r b o o s t p a s s e n g e r a n d c a r g o transportation.
Growth in the air transportation segment was supported by continued expansion in passenger traffic although cargo volume registered a decline. During the first six months of 2007, passenger volume at the Kuala Lumpur International Airport (KLIA) rose by 7.3% to 12.5 million (January-June 2006: 5.4%; 11.7 million), owing partly to the higher number of tourist arrivals and more international airlines operating in KLIA. Budget

34
travel on AirAsia surged by 42.6% to 4.5 million passengers (January-June 2006: 37.2%; 3.1 million). Demand for budget travel was spurred by aggressive promotional efforts and competitive fares during the festive and holiday seasons. The low-cost carrier also gained from quality routings, increased flight frequencies and connectivity. Low-cost passenger volume received a further boost with the setting up of Firefly, a subsidiary of Malaysian Airlines System (MAS) operating from Penang since April 2007. As at end-July 2007, Firefly has carried 47,146 passengers. Prospects of growth in air transportation continue to remain upbeat with AirAsia X, launching the long-haul low-cost service in the fourth quarter of 2007.
Air cargo volume handled by Malaysia Airports Holdings Berhad contracted by 9.6% to 464 million tonnes during the first six months of 2007 (January-June 2006: 7.8%; 513.5 million tonnes). The slack in air cargo was due to the slowdown in electronics exports. Air cargo volume is likely to pick up in the second half of the year consistent with the anticipated increase in electronics exports.
Growth in the utilities sub-sector is expected to sustain at 4.6% in 2007 (2006: 5.2%). Sales of electricity grew by 4.8% in the first six months of the year, on account of increased activities in trade, industrial and household sub-sectors (January-June 2006: 3.5%). Maximum demand for electricity peaked at 13,409 megawatts (MW) in March 2007 (January-June 2006: 12,842 MW; June). In addition, water supply to customers recorded 2.6% growth to 6,247 million litres per day (mld) (January-June 2006: 5.3%; 6,088 mld), while metered consumption rose by 4.1% to 3,983 mld (January-June 2006: 4.0%; 3,827 mld).
The other services sub-sector, comprising community, social, and personal services as well as imputed rent of owner-occupied dwellings, is expected to sustain growth of 5.0% in 2007 (2006: 4.7%). This is mainly attributable to increased activity in private health and education. As at end-June 2007, there are 525 private institutions of higher education, comprising 36 private universities and 489 private colleges. The number of foreign students in Malaysia is expected to increase by 8.4% to 51,310 students in 2007 (2006: 13.9%; 47,320 students), of which, 39,260 students are in private learning institutions. Meanwhile, with the vigorous promotion of health tourism and the improved quality of healthcare services available
in the country, the number of foreigners seeking treatment is expected to increase. Currently, the majority of them are from Indonesia, representing 79.2% of the total, with the rest from countries such as Japan, Europe, India, China, United States (US), Singapore, Australia and Korea.
Growth in the government services sub-sector is estimated at 4.6% (2006: 9.8%) due to higher expenditure on public services. This is reflected in the increased supply and improved quality of public services.
Manufacturing Sector
Output d r iven by domest ic -or ien ted industries…
The manufacturing sector is expected to grow 3.1% in 2007 (2006: 7.1%) supported by domestic-oriented industries, particularly chemicals and chemical products, food and construction-related industries. During the first half of the year, softer external demand, particularly for E&E products, textiles and apparels as well as machinery and equipment affected the overall performance of the sector, which grew 0.5% (January-June 2006: 8.8%).
Output in the domestic-oriented industries grew 5.3% while export-oriented industries contracted 1.9% during the first six months (January-June 2006: 5.0%; 11.1%). Despite contraction in output, the export-oriented industries continue to remain as a major contributor to the total manufactured output. Meanwhile, sales value of the sector increased 2.9% to RM248 billion (January-June 2006: 9.4%; RM241 billion), mainly contributed by the increase in sales of electronic valves and tubes as well as basic iron and steel products. During the period under review, capacity utilisation of the sector edged higher to 80.4%, particularly, paper, chemical and rubber-based products.
Output of domestic-oriented industries, as shown in Table 3.3, increased at a faster pace of 5.3% in the first six months of 2007 (January-June 2006: 5.0%). During the period, major industry groups, such as food and beverages as well as construction-related industries recorded double-digit growth.

35
The chemicals and chemical products industry, including agricultural and industrial chemicals, cosmetics and toiletry products, paint and soaps, is a significant contributor to the manufacturing sector. Despite higher crude oil prices, output of the industry grew strongly by 9.2% (January-June 2006: 1.7%), which boosted the industry’s share to 10.0% of the overall manufacturing sector during the period. The basic chemicals industry recorded solid growth of 11.8% (January-June 2006: 1.3%) largely due to higher production of industrial gases, following increased activities in other domestic manufacturing industries and stronger external demand. However, higher input prices in the oleochemical industry, in particular crude palm oil (CPO), led to contraction in output of household and personal care products as well as pharmaceuticals of 16.0% and 36.0% (January-June 2006: 15.6%; 9.2%), respectively. Nevertheless, overall output of the oleochemical industry is expected to increase further in the second half as manufacturers are ensured of adequate supply of CPO as input from their cross-border investments. Output and sales of pesticides, fertilisers and other agrochemical products increased by 15.6%
TABLE 3.3
Manufacturing Production Index January-June(2000 = 100)
Index Change(%)
Share(%)
Industries 2006 2007 2006 2007 2006 2007
Export-oriented industries 137.1 134.5 11.1 -1.9 63.7 63.3 Electrical and electronic products 140.1 132.2 13.4 -5.6 39.5 38.3 Petroleum products 157.0 170.5 11.9 8.6 12.2 13.4 Textiles, apparel and footwear 89.2 80.2 12.6 -10.1 2.5 2.2 Wood and wood products 111.0 114.7 0.9 3.3 3.0 3.0 Rubber products 137.8 148.8 0.4 8.0 3.4 3.9 Machinery and equipment 127.9 110.4 -1.7 -13.7 1.9 1.5 Medical,opticalandscientificinstruments 114.5 126.0 8.3 10.0 1.1 1.1Domestic-oriented industries 136.6 143.8 5.0 5.3 36.3 36.7 Chemicals and chemical products 139.4 152.2 1.7 9.2 9.2 10.0 Non-metallic mineral and other related products 112.9 120.4 -1.9 6.6 3.9 3.7 Plastic products 178.1 171.6 21.7 -3.6 5.4 5.2 Food products 130.3 146.9 1.1 12.7 3.6 3.9 Transport equipment 156.3 126.6 5.3 -19.0 3.7 2.7 Off-estate processing 128.1 118.1 1.4 -7.8 3.0 2.7 Fabricated metal products 148.2 187.0 20.0 26.2 3.4 3.7 Basic metals 103.5 121.6 -6.9 17.5 1.9 2.0 Paper and paper products 127.0 146.0 4.1 14.9 1.8 1.9 Beverages 107.3 112.1 -6.8 4.5 0.4 0.5 Tobacco products 85.3 85.0 -7.0 -0.3 0.2 0.2
Total 136.9 137.6 8.8 0.5 100.0 100.0
Source: Department of Statistics and Ministry of Finance, Malaysia.
36
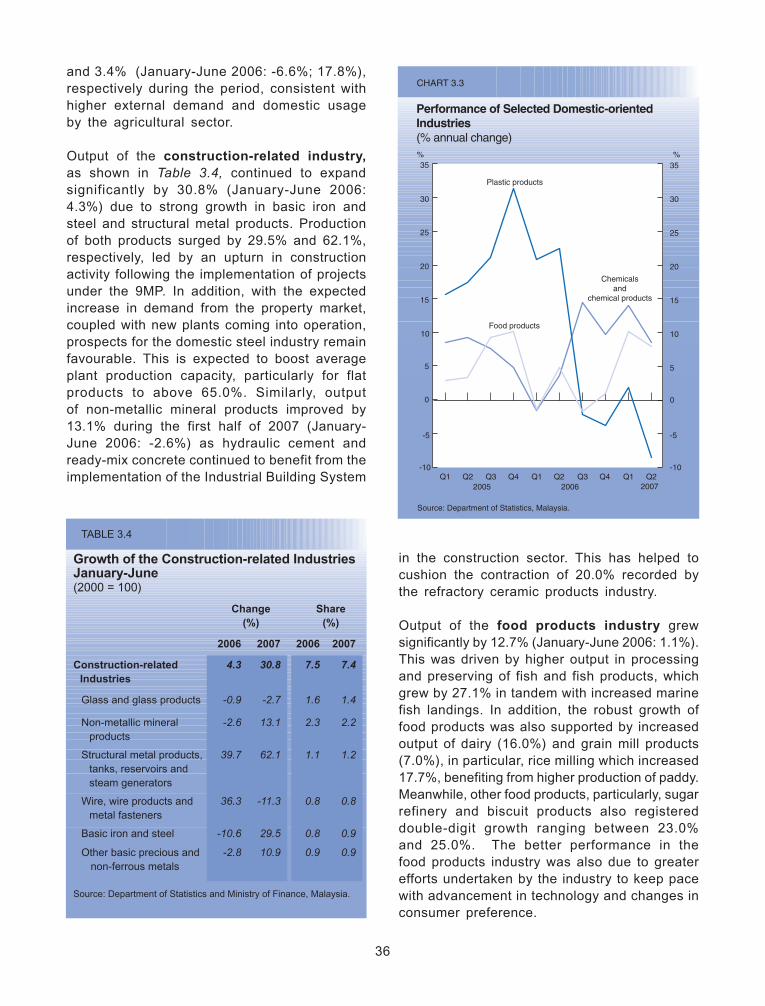
in the construction sector. This has helped to cushion the contraction of 20.0% recorded by the refractory ceramic products industry.
Output of the food products industry grew significantly by 12.7% (January-June 2006: 1.1%). This was driven by higher output in processing and preserving of fish and fish products, which grew by 27.1% in tandem with increased marine fish landings. In addition, the robust growth of food products was also supported by increased output of dairy (16.0%) and grain mill products (7.0%), in particular, rice milling which increased 17.7%, benefiting from higher production of paddy. Meanwhile, other food products, particularly, sugar refinery and biscuit products also registered double-digit growth ranging between 23.0% and 25.0%. The better performance in the food products industry was also due to greater efforts undertaken by the industry to keep pace with advancement in technology and changes in consumer preference.
and 3.4% (January-June 2006: -6.6%; 17.8%), respectively during the period, consistent with higher external demand and domestic usage by the agricultural sector.
Output of the construction-related industry, as shown in Table 3.4, continued to expand significantly by 30.8% (January-June 2006: 4.3%) due to strong growth in basic iron and steel and structural metal products. Production of both products surged by 29.5% and 62.1%, respectively, led by an upturn in construction activity following the implementation of projects under the 9MP. In addition, with the expected increase in demand from the property market, coupled with new plants coming into operation, prospects for the domestic steel industry remain favourable. This is expected to boost average plant production capacity, particularly for flat products to above 65.0%. Similarly, output of non-metallic mineral products improved by 13.1% during the first half of 2007 (January-June 2006: -2.6%) as hydraulic cement and ready-mix concrete continued to benefit from the implementation of the Industrial Building System
TABLE 3.4
Growth of the Construction-related IndustriesJanuary-June(2000 = 100)
Change(%)
Share(%)
2006 2007 2006 2007
Construction-related Industries
4.3 30.8 7.5 7.4
Glass and glass products -0.9 -2.7 1.6 1.4
Non-metallic mineral products
-2.6 13.1 2.3 2.2
Structural metal products, tanks, reservoirs and steam generators
39.7 62.1 1.1 1.2
Wire, wire products and metal fasteners
36.3 -11.3 0.8 0.8
Basic iron and steel -10.6 29.5 0.8 0.9
Other basic precious and non-ferrous metals
-2.8 10.9 0.9 0.9
Source: Department of Statistics and Ministry of Finance, Malaysia.
% %
CHART 3.3
Performance of Selected Domestic-oriented Industries(% annual change)
Source: Department of Statistics, Malaysia.
2005 2006 2007
0
5
10
15
20
25
30
35
-10-10
-5-5
0
5
10
15
20
25
30
35
Food products
Plastic products
Chemicalsand
chemical products
Q2Q2 Q1Q3Q1Q3 Q4 Q2 Q4Q1

37
Downward trends were observed in some major groups of domestic-oriented industries, namely off-estate processing, plastics and transport equipment industries. Output of the off-estate processing industries, comprising mainly palm oil and rubber, contracted by 7.8% (January-June 2006: 1.4%) constrained by supply of latex and CPO. The plastic products industry registered a decline in output and sales of 3.6% and 0.7% (January-June 2006: 21.7%; 13.3%), respectively, due to lower demand for components from the E&E and transport equipment industries as well as lower supply of petroleum feedstock. This was reflected in the sharp decline in the production of plastic bags and films as well as plastics blow moulded products by 25.1% and 14.0% (January-June 2006: 44.9%; 1.1%), respectively. However, plastic injection moulded products continued to record strong growth of 20.1% (January-June 2006: 17.5%), in part due to increased demand for packaging materials by the beverages industry as well as plastic parts for automobile components meant for the export market.
Output of transport equipment, which was affected by continued decline in domestic sales of motor vehicles since June 2006 further contracted by 19.0% in the first half of 2007 (January-June 2006: 5.3%). Lower production and sales of motor vehicles were partly due to tighter hire purchase loan conditions and increase in fuel prices. The depressed used car market also affected the overall performance of the transport equipment industry. Consequently, the declining trend led to contraction of 13.4% (January-June 2006: 22.5%) in production of automotive parts and components. However, the industry is anticipated to recover during the second half of 2007 due to rising disposable income and introduction of new models. Efforts to penetrate China’s automotive market by the local manufacturers will also enhance production and sales of passenger cars and improve the performance of the transport equipment industry.
Export-oriented industries contracted in the first six months of 2007 following the downtrend in the global demand for E&E products, particularly office and accounting machines as well as video and communication apparatus. This was, however, mitigated by strong growth recorded in the medical, optical and scientific instruments, and resource-based industries, particularly rubber and petroleum products. Production of medical, optical and scientific instruments was boosted by strong demand from health services, while growth in rubber-based industries was supported by the booming automotive industry, particularly in China. Similarly, higher production in wood-based industries was supported by product innovation in wooden furniture to cater for the global market as well as to meet local demand of the construction industry.
Output of E&E industry as shown in Table 3.5, declined by 5.6% (January-June 2006: 13.4%) on account of weak global demand. Production of semiconductors experienced lower negative growth of 0.3% (January-June 2006: 14.8%) while office, accounting and computing machinery as well as audio visual and communication apparatus contracted by 18.0% and 14.5% (January-June 2006: 26.1%; 1.7%), respectively. The semiconductors industry worldwide is facing stiff competition as manufacturers are investing in production of higher density memory chips at lower average prices. Nevertheless, electrical machinery and apparatus posted strong growth

38
TABLE 3.5
Growth of the E&E IndustryJanuary-June(2000 = 100)
Change(%)
Share(%)
2006 2007 2006 2007
Total Manufacturing 8.8 0.5 100.0 100.0
Total E&E products 13.4 -5.6 39.5 38.3
Semiconductors and other components
14.8 -0.3 24.4 24.6
Audio visual and communication
apparatus
1.7 -14.5 6.0 5.5
Office,accountand computing machinery
26.1 -18.0 6.9 6.2
Electrical machinery and apparatus
-7.2 13.9 1.6 1.8
Domestic appliances 6.3 -53.5 0.3 0.2
Source: Department of Statistics, Malaysia.
of 13.9%. Given the importance of the E&E sub-sector, which accounts for 38.3% of total manufacturing sector, efforts are being taken to develop the E&E clusters. Among measures taken are the development of more innovative and higher value added products and services, especially in the area of advanced integrated circuits and packaging. Capacity utilisation of the industry remains high at above 80.0% as manufacturers expect better performance in the second half of the year.
The capital intensive wood-based industry, comprising veneer, panel products, mouldings, furniture and fixtures, expanded by 3.3% during the first half of the year (January-June 2006: 0.9%). Growth was mainly driven by increase in production of laminated boards and veneers, at 5.4% and 2.3% (January-June 2006: -15.2%; 5.9%), respectively. Higher exports to major markets such as Japan and the EU also contributed to the growth of the industry. Increasing demand for customised furniture components as well as greater awareness for high quality and certified sawn timber products among furniture makers is also expected to further enhance growth of the industry.
The rubber-based industry continued to register growth of 8.0% (January-June 2006: 0.4%), contributing 3.9% share to total manufacturing output. In line with higher domestic and external demand, sales of rubber products also increased 7.4% (January-June 2006: 34.6%) during the same period. Rubber gloves, the largest component of the rubber-based industry, recorded a turnaround of 3.6% (January-June 2006: -1.8%), arising from higher usage in health services. Likewise, sales of latex-based catheters also registered double-digit growth of 66.5% (January-June 2006: -21.9%). Malaysian rubber gloves and catheters made from natural rubber latex are highly demanded for their unique mix of high elasticity and tensile strength of properties as well as excellent film-forming characteristics.
Output of medical, optical and scientific instruments posted strong growth of 10.0% in the first six months of the year (January-June 2006: 8.3%) mainly contributed by increased demand for medical and surgical equipment as well as orthopaedic appliances, which registered double-digit growth of 37.8% (January-June 2006: 17.5%). This sterling performance was due to rising domestic and external demand, especially from the Association of Southeast Asian Nations (ASEAN) region, for upgrading healthcare facilities and services, private hospitals and clinics as well as health conscious consumers. The medical and surgical equipment as well as orthopaedic appliances are fast becoming a niche export for Malaysia. Within the optical and scientific instruments group, output of watches and clocks, turned around and registered 10.0% growth (January-June 2006: -0.4%) while sales increased by 12.5% (January-June 2006: -14.8%). The strong sales reflect continuous efforts by the industry to upgrade production of precision and middle-to-high range products to meet changing consumer taste.
In line with lower production of crude oil, output of petroleum products grew moderately by 8.6% in the first six months of the year (January-June 2006: 11.9%). Lower supply of feedstock and weak external demand resulted in slower growth in sales of 0.9% for refined petroleum products (January-June 2006: 23.7%). The high price for Tapis crude oil which averaged USD69 per barrel during the first six months of the year, led to high input costs for petroleum products.

39
UPSCALING MALAYSIA’S ELECTRICAL AND ELECTRONICS INDUSTRY
INTRODUCTION
The electrical and electronics (E&E) industry is the key driver of Malaysia’s industrial development and a major contributor to Gross Domestic Product (GDP) growth, export earnings, investment and employment. This article analyses the status of the domestic E&E industry and highlights Government’s initiatives at encouraging local manufacturers to move up the value chain to fully realise their potential in the industry.
POLICIES AND STRATEGIES TO PROMOTE E&E IN MALAYSIA
In the 1960s, industrial policy was mainly inward looking, focused on import-substitution and labour intensive industries to overcome the high unemployment rate. In addition, projects were encouraged to be located at less developed areas to address uneven regional development. This was facilitated by the Pioneer Industries (Relief from Income Tax) Ordinance, 1958 and Investment Incentives Act, 1968, which provided tax relief or Pioneer Status to investors. Even so, industrial development was constrained by the small domestic market and limited capital, with unemployment remaining high.
Recognising limitations of the inward looking policy, there was a strategic shift in the industrialisation process towards export-oriented industries in the 1970s. To provide greater employment opportunities, labour intensive and export-oriented industries such as electronics and textiles were encouraged. Taking cognisance of the relocation of multinational companies (MNCs) to lower operating cost environment, incentives and facilities were offered to attract them. These included development of industrial estates, free trade zones and local manufacturing warehouses. Tax incentives include import duty exemption on raw materials and Reinvestment Allowance. Consequently, there was a significant influx of foreign direct investment (FDI) particularly in the E&E industry with the first semiconductor factory set up in Penang in 1972. The E&E industry subsequently grew with clusters in Penang and the Klang Valley and further expanded to Malacca, Kulim and Johor Bahru. As at end-2006 more than 1,600 companies were in operation and employing more than 433,800 workers.
The Ninth Malaysia Plan
The E&E industry, in particular electronics, has been targeted as one of the key industries to move towards higher level of technology adoption and to produce greater value-added outputs. In this regard, the E&E cluster in the Northern Corridor Economic Region comprising Penang and Kulim High Technology Park (KHTP) will be further developed. A privately initiated hi-tech electronics hub will be established to complement KHTP.
The presence of the MNCs in the industry will remain significant. Nevertheless, local manufacturers have developed the skills and expertise to support the MNCs requirement for parts and components. Local manufacturers are encouraged to move higher up the value chain through enhancing their capability in design and develop indigenous products to meet demand for high value and more sophisticated products. In the global competitive environment, local manufacturers must have extensive collaboration with each other, research institutions and participating MNCs so as to enhance their innovation capabilities to move into higher value-added activities in the E&E value chain.

40
Third Industrial Master Plan
The Third Industrial Master Plan (IMP3) provides a clear plan of action to move the E&E industry up the value chain. Among the strategies are:
• Strengthening and deepening the semiconductors sub-segment;
• Deepening and widening the development of the information and communications technology (ICT) value chain;
• Intensifying research and development (R&D) and design activities;
• Promoting the application of new and emerging technologies;
• Integrating domestic companies into the regional and global supply chain; and
• Making available skilled workforce.
In addition, the IMP3 proposed strengthening of institutional support, including a comprehensive package of support schemes to encourage investments as well as expanding the role and functions of industry associations. With the comprehensive implementation of action plans, the E&E industry is anticipated to further strengthen and migrate towards knowledge-intensive, high-technology and higher value-added activities.
CURRENT STATUS OF THE E&E INDUSTRY
Contribution to the Economy
In 2006, the electronics industry achieved 9.6% growth while the electrical industry grew 3.6%, as shown in Table 1, surpassing the targeted average annual growth rate of 7.7% and 3.0%, respectively, under the 9MP. The electronics industry remains as the major contributor at 30.7% share to total value added of the manufacturing sector while its share to GDP was significant at 9.6%.
Table 1
value Added of the E&E Industry (in 2000 prices)
Year
Electronics Electrical(Electrical
Machinery and Apparatus)
Total E&EManufacture of office,
accounting and
computing machinery
(RM million)
Manufacture of radio, TV,
communications equipment and
apparatus(RM million)
Total Electronics
Value(RM million)
Growth(%)
Value(RM million)
Growth(%)
Value(RM million)
Growth(%)
2001 8,078 22,487 30,565 -13.5 2,039 -45.9 32,604 -16.6
2002 8,822 24,347 33,169 8.5 2,197 7.8 35,366 8.5
2003 9,559 26,235 35,794 7.9 2,392 8.9 38,186 8.0
2004 10,309 29,278 39,587 10.6 2,572 7.5 42,159 10.4
2005 10,987 30,450 41,437 4.7 2,749 6.9 44,186 4.8
2006 12,790 32,630 45,420 9.6 2,848 3.6 48,268 9.2
Source: Department of Statistics, Malaysia.
41
Investment in the E&E Industry
Malaysia is a major player in the fast expanding E&E market in Asia-Pacific. Over the past three decades, Malaysia has attracted some of the world’s leading electronics MNCs. The share of FDI in the E&E industry (Table 3) has increased steadily from 46.0% in 1985 to 85.8% in 2006. The relatively strong growth in FDI particularly in E&E industry reflects the confidence of investors, emanating from the favourable investment climate, good infrastructure, sound legal and regulatory framework as well as skilled and multilingual labour force.
The E&E industry continues to expand and reinvest, bringing in new technology and processes to move further up the value chain. This is reflected in the total approved investments and increasing capital-investment-to-employee ratio (CIPE). The IMP3 targets the industry growth rate at 7.2% or RM5.5 billion per annum, with total approved investment of RM82.4 billion by 2020. As total investment approved for the industry in the first half of this year was RM8.5 billion, Malaysia is on track to achieve the IMP3 target.
1 Source: Semiconductor Industry Association, US.
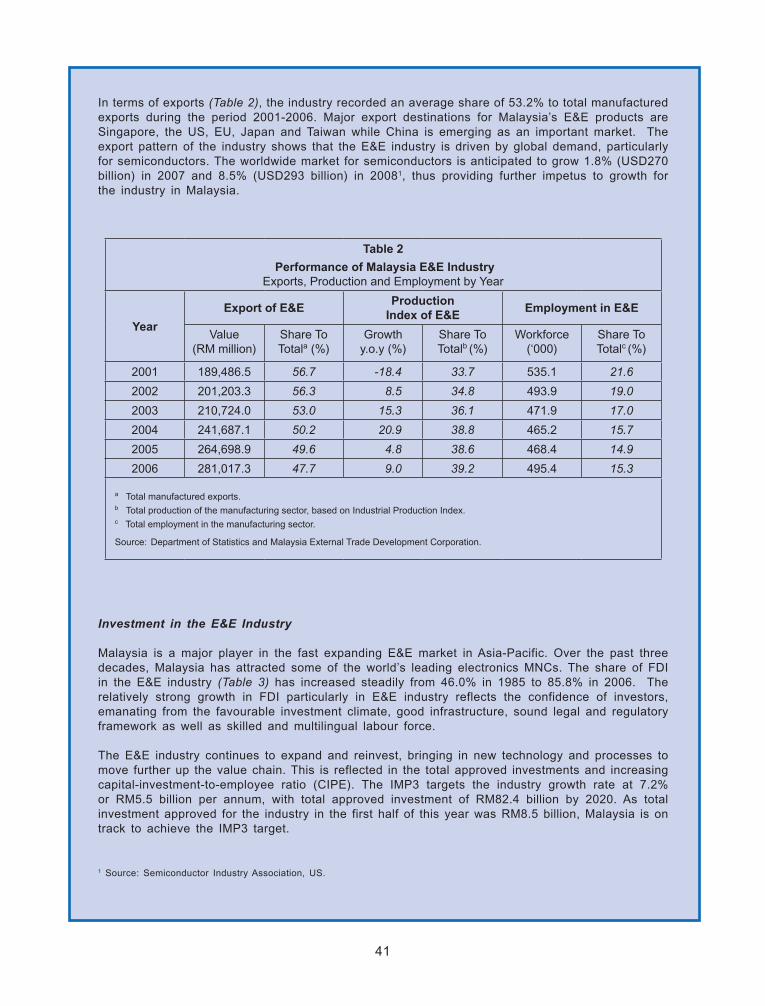
In terms of exports (Table 2), the industry recorded an average share of 53.2% to total manufactured exports during the period 2001-2006. Major export destinations for Malaysia’s E&E products are Singapore, the US, EU, Japan and Taiwan while China is emerging as an important market. The export pattern of the industry shows that the E&E industry is driven by global demand, particularly for semiconductors. The worldwide market for semiconductors is anticipated to grow 1.8% (USD270 billion) in 2007 and 8.5% (USD293 billion) in 20081, thus providing further impetus to growth for the industry in Malaysia.
Table 2
Performance of Malaysia E&E IndustryExports, Production and Employment by Year
Year
Export of E&EProduction
Index of E&EEmployment in E&E
Value (RM million)
Share ToTotala (%)
Growthy.o.y (%)
Share ToTotalb (%)
Workforce (‘000)
Share ToTotalc (%)
2001 189,486.5 56.7 -18.4 33.7 535.1 21.6
2002 201,203.3 56.3 8.5 34.8 493.9 19.0
2003 210,724.0 53.0 15.3 36.1 471.9 17.0
2004 241,687.1 50.2 20.9 38.8 465.2 15.7
2005 264,698.9 49.6 4.8 38.6 468.4 14.9
2006 281,017.3 47.7 9.0 39.2 495.4 15.3
a Total manufactured exports.b Total production of the manufacturing sector, based on Industrial Production Index.c Total employment in the manufacturing sector.
Source: Department of Statistics and Malaysia External Trade Development Corporation.

42
Malaysian Electronics Industry: A Gap Analysis
Malaysia’s E&E industry has been pursuing an export-driven developmental model that relies on relative operating cost advantage and FDI. This model has resulted in a local industry that is dominated by MNCs with very few domestic companies. Concerted efforts from all stakeholders is required to increase the number of domestic companies and help them move to higher value-added activities, as shown in chart 1. While the Government has been accommodative to the needs of the industries, only a few local manufacturers embraced the call for higher value-added activities, particularly in design and indigenous products development and technologies, since the 1990s. This entails an in-depth study of the E&E value chain to identify the current position of Malaysian owned manufacturing companies in the entire value chain.
In general, Malaysian companies have gained considerable experience in assembly and testing, where it involves large volumes, low value-added activities amidst a highly cost competitive environment, resulting in limited technology transfer. Thus, Malaysian companies largely remain as component manufacturers with limited capability to expand into higher value-added activities, particularly product conceptualisation and design. In addition, Malaysian companies continue to face challenges in penetrating E&E marketing channels, which is dominated by MNCs. In contrast, Taiwan has been able to foster a dynamic original design manufacturer industry, capturing the higher value-added activities of product conceptualisation and design, while South Korea has been able to move into original brand manufacturer (OBM) space, hence strengthening its market presence.
The robust growth in investment during the first half of 2007 further triggered imports of intermediate and capital goods, which accounted for 71.5 % (RM171.2 billion) and 13.2% (RM31.5 billion) share to total imports, respectively. This high proportion of imports of intermediate goods indicates that there is strong potential for local manufacturers to upgrade and produce value-added products to meet the demand for intermediate goods domestically.
Table 3
Approved E&E Projects
YearNumber of Projects
Approved
Investments (RM million) FDI toTotal
Capital Investment
(%)
WorkforceCIPE Ratio
(RM)Domestic
InvestmentFDI Total
Capital Investment
2002 178 1,645.5 4,005.4 5,650.9 70.9 24,754 228,283
2003 185 1,347.7 3,629.9 4,977.6 72.9 17,488 284,628
2004 195 1,800.9 6,826.0 8,626.9 79.1 24,530 351,686
2005 227 2,474.8 11,318.9 13,793.8 82.1 47,317 291,518
2006 170 1,422.2 8,601.5 10,023.7 85.8 24,293 413,536
Source: Malaysia Industrial Development Authority.

43
STRENGTHENING MALAYSIA’S PRESENCE IN E&E INDUSTRY
Strengthening and Deepening of the Semiconductors Cluster
The cluster concept, particularly in the semiconductor industry, underpins the Government’s effort to strengthen the E&E industry. The synergies arising out of locating related companies operating along the entire E&E value chain will enable them to optimise benefits and minimise cost. In this regard, the further development of existing semiconductors cluster in Penang and KHTP in Kedah will help to attract more investment into all aspects of the value chain, creating a critical mass of companies and expanding markets, which will further strengthen the E&E industry.
Leveraging on ICT and New Emerging Technologies
The E&E and ICT industries enjoy a symbiotic relationship. Riding on advancement in the latter, which include services such as internet facilities; convergent products such as personal digital assistant (PDA); as well as parts and components including disk drives and data storage media, have enhanced the growth performance of the E&E industry, in particular industrial electronics. New technology for both industries include microelectromechanical systems (MEMS) such as smart sensors,
44
WiMAX, high performance grid computing, language design and protocol as well as creative content. In addition, the new and emerging technologies promoted under the IMP3 such as biotechnology, cognitive technology and nanotechnology will further strengthen the E&E industry in Malaysia. The Government, in collaboration with industry, will establish the Electronic Industry Advisory Panel to spur the development and promotion of new and emerging technologies as well as identify local companies capable of applying them.
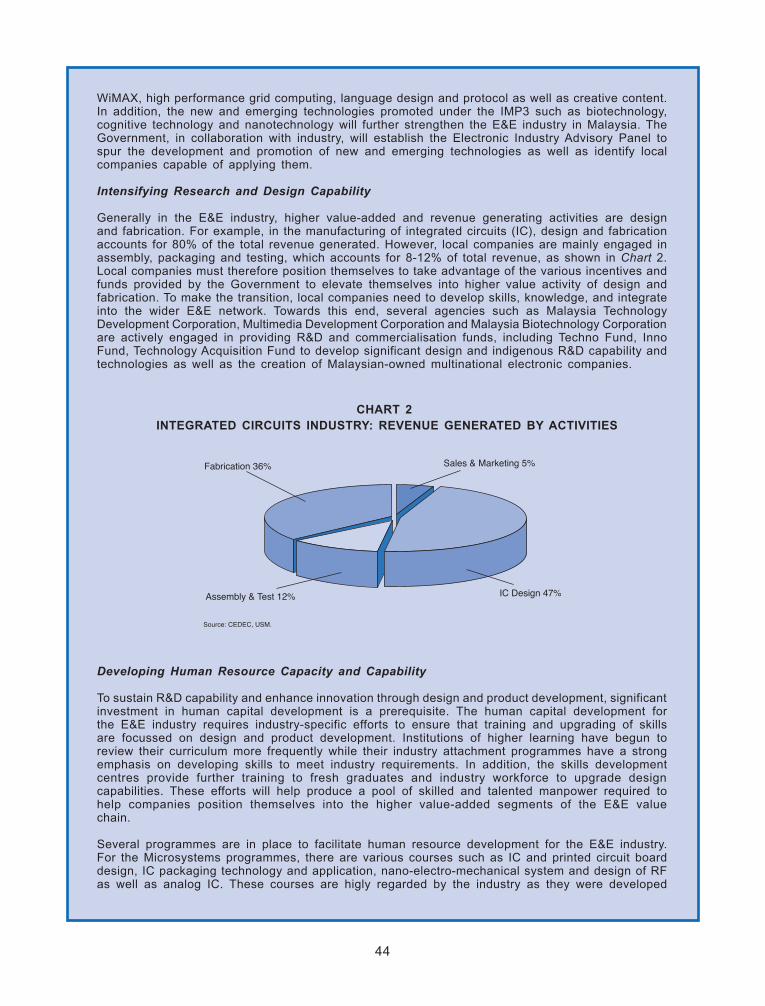
Intensifying Research and Design Capability
Generally in the E&E industry, higher value-added and revenue generating activities are design and fabrication. For example, in the manufacturing of integrated circuits (IC), design and fabrication accounts for 80% of the total revenue generated. However, local companies are mainly engaged in assembly, packaging and testing, which accounts for 8-12% of total revenue, as shown in chart 2. Local companies must therefore position themselves to take advantage of the various incentives and funds provided by the Government to elevate themselves into higher value activity of design and fabrication. To make the transition, local companies need to develop skills, knowledge, and integrate into the wider E&E network. Towards this end, several agencies such as Malaysia Technology Development Corporation, Multimedia Development Corporation and Malaysia Biotechnology Corporation are actively engaged in providing R&D and commercialisation funds, including Techno Fund, Inno Fund, Technology Acquisition Fund to develop significant design and indigenous R&D capability and technologies as well as the creation of Malaysian-owned multinational electronic companies.
Developing Human Resource Capacity and Capability
To sustain R&D capability and enhance innovation through design and product development, significant investment in human capital development is a prerequisite. The human capital development for the E&E industry requires industry-specific efforts to ensure that training and upgrading of skills are focussed on design and product development. Institutions of higher learning have begun to review their curriculum more frequently while their industry attachment programmes have a strong emphasis on developing skills to meet industry requirements. In addition, the skills development centres provide further training to fresh graduates and industry workforce to upgrade design capabilities. These efforts will help produce a pool of skilled and talented manpower required to help companies position themselves into the higher value-added segments of the E&E value chain.
Several programmes are in place to facilitate human resource development for the E&E industry. For the Microsystems programmes, there are various courses such as IC and printed circuit board design, IC packaging technology and application, nano-electro-mechanical system and design of RF as well as analog IC. These courses are higly regarded by the industry as they were developed
CHART 2 INTEGRATED CIRCUITS INDUSTRY: REvENUE GENERATED BY ACTIvITIES

45
with world class design centres such as the Toppan Technical Design Centre, Japan; Silicon Valley Technical Institute, USA; and IPC, USA. In addition, the Malaysian Institute of Microsystems (MIMS) under the Selangor Human Resource Development Centre (SHRDC) has established an advance technology centre of learning for design development and innovation particularly in IC design. The training programmes, involving short term and continuous professional up-skilling courses for fresh graduates, technical staff and industry engineering professionals to equip them with the right competencies and innovative capabilities. In addition to these training programmes, facilities for activities from designing to prototyping are also available in MIMS to industry players, on a time-sharing basis. In terms of funding, Pembangunan Sumber Manusia Berhad, which manages the Human Resource Development Fund helps defray the training cost incurred by the industry in upgrading technical and soft skills of their employees.
Creation of Centres of Excellence
Another strategic initiative by the Government for strengthening the E&E sector is the creation of Centres of Excellence. These centres will be responsible for providing technology support, R&D facilities, incubators for start-ups, market intelligence and access to funding for the industry. In the IMP3, measures will be introduced to promote the specialisation of R&D by creating Centres of Excellence in public universities. Specifically, USM has been designated for microelectronics; UTM and MMU for ICT; UKM for MEMS and UM for photonics.
In l ine with the mandate given, USM spearheaded the upgrading of the Collaborative Micro-Electronic Design Excellence Centre (CEDEC) into a Centre of Excellence, comprising seven universities with USM as the secretariat. The CEDEC initiative towards fulfilling the value-added aspiration of the nation can be summarised as below:
• Increasing the pool of IC designers to create a larger critical mass of designers. Third andfourth year electronic and electrical engineering students in the seven universities are allowed to opt for microelectronic specialisation;
• Support fabrication foundries by creating local clusters of design houses and enhanceuniversities design skills in fabrication;
• Encourage local fabless start-ups through strengthening development and technologicalcapabilities as well as encourage entrepreneurial spirit to spawn start-ups; and
• Enablingandintensifyingsystemsdesigncapabilitiesthroughdevelopinghardwareandsoftwaredesign engineers, which in turn will create systems design and manufacturing ecosystem.
CEDEC has enabled collaboration and coordination in design activities amongst its members. In order to further enhance this cooperation, Fabless Malaysian Integrated Circuit Design Association (MICDA) was formed in June 2007. The formation of MICDA and the upgrading of CEDEC fast tracks efforts to uplift design activities as well as in grooming more Malaysian designers and product developers.
CONCLUSION
Despite Malaysia’s long reliance on the E&E industry, local manufacturers have largely confined themselves to the low value-added segment of the industry. However, since the E&E sector contributes significantly to the manufacturing sector, greater benefit can be realised if the industry progresses to the higher value segments. Towards this, the strategies initiated by the Government focusing on semiconductor clusters; leveraging on ICT; enhancing R&D capabilities and capacities; developing human resource and creation of centres of excellence will play a crucial role in strengthening the E&E industry and ensure that local players move up the value chain.
At the national level, tangible benefits can be derived through strengthening and enhancing the E&E industry. Significant revenue increases can be reaped by progressing to higher levels of the value chain. In addition, with the increasing focus on design and development elements of the value chain, it is anticipated that the import bill for intermediate products can be reduced. Furthermore, moving up the value chain will provide the opportunities and potential for establishing horizontal and vertical linkages within the E&E and other industries. In the long run, involvement in the higher value added activities of the E&E value chain will allow Malaysia to establish international brands and link up with the global supply chain.

46
The production of textiles, apparels and footwear industry declined by 10.1% in the first six months of 2007 (January-June 2006: 12.6%). The decline was due to 21.4% contraction in output of textiles and 2.5% in apparels (January-June 2006: 9.8%; 31.4%), as a result of stiff competition from low-cost producing countries, in particular China, India, Thailand and Viet Nam. However, output and sales of the knitted and crocheted products rebounded 24.3% and 4.8% (January-June 2006: -11.8%; 0.8%), respectively, as manufacturers rationalised their production process through improved quality and achieved economies of scale. In an effort to improve profit margins, the textile and apparels manufacturers are engaging in outsourcing and cross-border investments.
Production of machinery and equipment industry including air conditioning, refrigerating and ventilating machinery, contracted 13.7% during the first six months of 2007 (January-June 2006: -1.7%) on account of lower sales of 5.9% (January-June 2006: 2.8%). Weakening sales during the period, resulting from lower domestic and external demand, led to lower capacity utilisation of 60.0%.
Agriculture Sector
Continues to expand, supported by food commodities…
Value added of the agriculture sector is estimated to expand by 3.1% in 2007 (2006: 5.2%), with growth emanating largely from higher output in food commodities including livestock, fishing and other agriculture sub-sectors. Higher value added of the agro-food sub-sector is in line with the Government’s efforts to reduce the import bill of food and to increase the self-sufficiency level (SSL), especially for meat and dairy products. Meanwhile, value added of the plantation sub-sector is projected to slow down due to the unfavourable weather conditions in Peninsular Malaysia in the early part of the year. Despite the moderate growth, the agriculture sector share to GDP remains at 7.7% in 2007 (2006: 7.9%). The Government’s continuous efforts to transform the agriculture sector into an important engine of growth can be seen through various programmes initiated by respective agencies, including high impact agricultural projects such as setting up of
TABLE 3.6
value Added in the Agriculture Sector 2006-2007(in 2000 prices)
Growth (%)
Share to Agriculture
(%)
2006 20071 2006 20071
Agriculture 5.2 3.1 100.0 100.0
Oil palm 5.8 -0.6 30.5 29.4
Rubber 12.6 1.0 6.9 6.7
Forestry and logging -0.4 2.8 22.2 22.1
Other agriculture2 5.3 7.0 24.6 25.7
Fishing 9.3 5.2 15.8 16.1
1 Estimate.2 Including livestock, paddy, cocoa, fruits, vegetables, copra, tobacco, tea,flowers,pepperandpineapples.
Source: Department of Statistics and Ministry of Finance, Malaysia.
the National Feedlot Centre and Permanent Food Production Parks, nurturing agro-entrepreneurs as well as promoting contract farming. The proposed agriculture related developments in the Northern Corridor Economic Region (NCER) is envisaged to further boost the contribution of the agriculture sector to GDP growth.
Production of CPO in 2007 is projected to record lower output of 15.7 million tonnes (2006: 15.9 million tonnes). In the early part of the year, major floods destroyed newly matured trees and disrupted harvesting activities in the southern region of Peninsular Malaysia and was further compounded by the seasonal down cycle. Production of CPO in Johor, the worst-hit state by the floods, declined by 15.5% during the first quarter of 2007. Nevertheless, the new matured areas coming onstream, better estate management and higher quality agricultural inputs are expected to partially offset the negative impact of unfavourable weather. Higher palm oil prices are expected to encourage better efficiency in oil palm harvesting.
Production of CPO decreased by 8.0% during the first six months of 2007 (January-June 2006: 1.3%), due to lower yields of fresh fruit
47
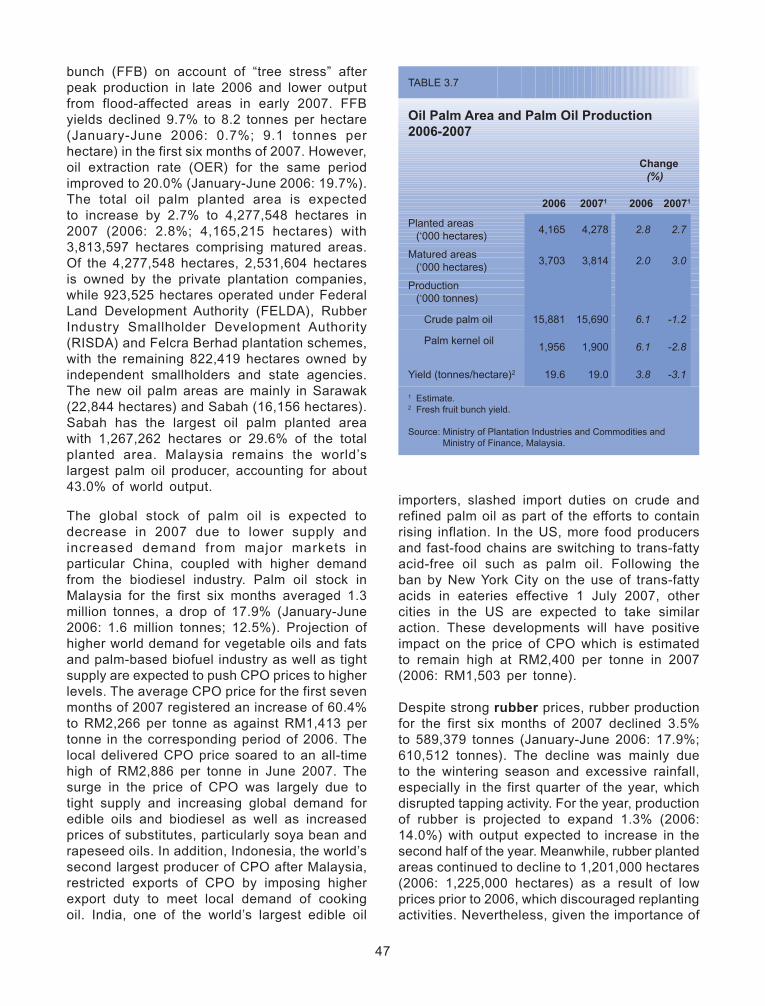
bunch (FFB) on account of “tree stress” after peak production in late 2006 and lower output from flood-affected areas in early 2007. FFB yields declined 9.7% to 8.2 tonnes per hectare (January-June 2006: 0.7%; 9.1 tonnes per hectare) in the first six months of 2007. However, oil extraction rate (OER) for the same period improved to 20.0% (January-June 2006: 19.7%). The total oil palm planted area is expected to increase by 2.7% to 4,277,548 hectares in 2007 (2006: 2.8%; 4,165,215 hectares) with 3,813,597 hectares comprising matured areas. Of the 4,277,548 hectares, 2,531,604 hectares is owned by the private plantation companies, while 923,525 hectares operated under Federal Land Development Authority (FELDA), Rubber Industry Smallholder Development Authority (RISDA) and Felcra Berhad plantation schemes, with the remaining 822,419 hectares owned by independent smallholders and state agencies. The new oil palm areas are mainly in Sarawak (22,844 hectares) and Sabah (16,156 hectares). Sabah has the largest oil palm planted area with 1,267,262 hectares or 29.6% of the total planted area. Malaysia remains the world’s largest palm oil producer, accounting for about 43.0% of world output.
The global stock of palm oil is expected to decrease in 2007 due to lower supply and increased demand from major markets in particular China, coupled with higher demand from the biodiesel industry. Palm oil stock in Malaysia for the first six months averaged 1.3 million tonnes, a drop of 17.9% (January-June 2006: 1.6 million tonnes; 12.5%). Projection of higher world demand for vegetable oils and fats and palm-based biofuel industry as well as tight supply are expected to push CPO prices to higher levels. The average CPO price for the first seven months of 2007 registered an increase of 60.4% to RM2,266 per tonne as against RM1,413 per tonne in the corresponding period of 2006. The local delivered CPO price soared to an all-time high of RM2,886 per tonne in June 2007. The surge in the price of CPO was largely due to tight supply and increasing global demand for edible oils and biodiesel as well as increased prices of substitutes, particularly soya bean and rapeseed oils. In addition, Indonesia, the world’s second largest producer of CPO after Malaysia, restricted exports of CPO by imposing higher export duty to meet local demand of cooking oil. India, one of the world’s largest edible oil
importers, slashed import duties on crude and refined palm oil as part of the efforts to contain rising inflation. In the US, more food producers and fast-food chains are switching to trans-fatty acid-free oil such as palm oil. Following the ban by New York City on the use of trans-fatty acids in eateries effective 1 July 2007, other cities in the US are expected to take similar action. These developments will have positive impact on the price of CPO which is estimated to remain high at RM2,400 per tonne in 2007 (2006: RM1,503 per tonne).
Despite strong rubber prices, rubber production for the first six months of 2007 declined 3.5% to 589,379 tonnes (January-June 2006: 17.9%; 610,512 tonnes). The decline was mainly due to the wintering season and excessive rainfall, especially in the first quarter of the year, which disrupted tapping activity. For the year, production of rubber is projected to expand 1.3% (2006: 14.0%) with output expected to increase in the second half of the year. Meanwhile, rubber planted areas continued to decline to 1,201,000 hectares (2006: 1,225,000 hectares) as a result of low prices prior to 2006, which discouraged replanting activities. Nevertheless, given the importance of
TABLE 3.7
Oil Palm Area and Palm Oil Production2006-2007
Change (%)
2006 20071 2006 20071
Planted areas (‘000 hectares)
4,165 4,278 2.8 2.7
Matured areas (‘000 hectares)
3,703 3,814 2.0 3.0
Production (‘000 tonnes)
Crude palm oil 15,881 15,690 6.1 -1.2
Palm kernel oil1,956 1,900 6.1 -2.8
Yield (tonnes/hectare)2 19.6 19.0 3.8 -3.1
1 Estimate. 2 Fresh fruit bunch yield.
Source: Ministry of Plantation Industries and Commodities and Ministry of Finance, Malaysia.

48
downstream activities, the Government continues to provide assistance to small holders to increase the acreage under rubber. Efforts are also being made to consolidate and rehabilitate rubber smallholdings to increase productivity.
Natural rubber price (SMR 20) is estimated to remain strong in 2007 at RM7.00 per kg (2006: RM7.11 per kg) as synthetic rubber is expected to record high prices in tandem with increased crude oil prices. In addition, projection of higher demand from the tyre industries of China and India is expected to further lend support to rubber prices. During the first six months of the year, the average export price of rubber (SMR 20) was at RM7.00 per kg (January-June 2006: RM6.94 per kg). Supply constraints due to adverse weather conditions and continued strong global demand, especially from China, contributed to the firm price. The favourable price of natural rubber is expected to benefit 320,671 rubber smallholders by raising their monthly income to RM700 per hectare in 2007 (2006: RM676 per hectare) as higher rubber prices encourage them to increase tapping and replanting activities.
Value added of the fishing industry, on the other hand, expanded by 4.0% in the first six months of 2007 (January-June 2006: 9.4%). The expansion was attributed to higher marine fish landings by 5.1% to 656,580 tonnes (January-June 2006: 11.4%; 624,600 tonnes), mainly due to expansion in deep sea fishing. The increase in marine fish landings is partly due to positive response to the Government’s initiatives such as large-scale community-based marine fish farms, construction of artificial reefs and fish shelters as well as upgrading fishing vessels and related equipment. The completion of the deep sea fishing port in Tanjung Manis, Sarawak will further boost marine fish landings. In addition, investment by Malaysian International Tuna Port Sdn Bhd, a joint venture company between the Government and the private sector to establish the first integrated tuna fishing port in Batu Maung, Penang, will further develop Malaysia’s fishing industry. This 105-hectare port is capable of accommodating 100 ships at any one time and able to attract 2,000 international tuna fishing boats and is expected to create up to 10,000 jobs. Meanwhile, value added of aquaculture is projected to grow strongly due to increase in output by 80.6% to 369,000 tonnes (2006: -1.4%; 204,360 tonnes). High impact projects initiated by Government such as Aquaculture Industrial Zone in Terengganu which comprise 2,800 hectares and focus on high value species, including tiger prawn and grouper as well as ornamental fish, are projected to further spur the aquaculture industry.
Value added of livestock is also projected to expand strongly by 10.5% for 2007 (2006: 6.9%) and account for 9.9% share of the agriculture sector. Integrated farming with rearing of cattle and goats in oil palm estates and feedlot cattle rearing contributed to the higher output of livestock sub-sector. In addition, modern poultry farming such as closed house system also resulted in higher output of the poultry industry. As a result, value added of livestock for the first six months of the year grew strongly by 12.0% (January-Jun 2006: 9.4%), underpinned by higher production in poultry (11.9%) and cattle (8.1%).
TABLE 3.8
Rubber Area, Yield and Production2006-2007
Change (%)
2006 20071 2006 20071
Total area (‘000 hectares) Smallholdings Estate
1,225
1,17253
1,201
1,15348
-2.0
3.3-53.9
-2.0
-1.6-9.4
Yield (kg per hectare) Smallholdings Estate
1,3501,525
1,3801,545
2.310.4
2.21.3
Total production (‘000 tonnes) Smallholdings Estate
1,284
1,21568
1,300
1,23070
14.0
14.55.2
1.3
1.22.9
% of world production 13.3 13.0
1 Estimate.
Source: Ministry of Plantation Industries and Commodities and Ministry of Finance, Malaysia.

49
Value added of other agriculture sub-sector which includes paddy, pineapples, tobacco, coconut, vegetables, fruits, tea and pepper is projected to increase strongly by 5.0% in 2007 (2006: 4.2%) on the back of higher production of vegetables and fruits. Expansion in cultivated areas, intensive implementation of estate-based production such as permanent food production parks as well as modern and good farming practice, including organic farming are expected to increase production of vegetables. Value added of vegetable farming improved further by 8.8% in the first six months of the year (January-June 2006: 6.1%). Similarly, value added of fruits also increased further by 1.9% (January-June 2006: 6.8%) due to expansion of fruit cultivated areas and higher domestic demand. Fruits such as star fruit, watermelon and papaya are also gaining popularity in the international market. In 2006, 240,000 tonnes of fruits were exported to major importers such as Singapore, Hong
Kong, Netherlands, Germany and United Arab Emirates.
Cocoa production declined in the first six months of 2007 due to inclement weather early this year. In addition, following the decline in planted areas due to land conversion by smallholders to other profitable crops, production of cocoa contracted by 1.5% to 19,055 tonnes (January-June 2006: 37.1%; 19,348 tonnes). Meanwhile, paddy production is also projected to increase due to increase in productivity and supported by the Government’s efforts to be self-sufficient. Output of paddy is expected to increase 5.7% in 2007 (2006: -6.9%) on account of improved yield per hectare. Yield per hectare is estimated to increase to 3.8 tonnes per hectare (2006: 3.5 tonnes per hectare) in Peninsular Malaysia due to further consolidation of padi smallholding and better estate management and utilisation of higher yield clones.
Mining Sector
Growth supported by new oil fields coming onstream…
Growth of the mining and quarrying sector is forecast to expand 3.3% in 2007 (2006: -0.4%), underpinned by higher production of crude oil and natural gas in the second half of the year. During the first six months, production of crude oil (including condensates) increased 2.7% to 678,207 barrels per day (bpd) (January-June 2006: -3.3%; 660,589 bpd) due to resumption of production after completion of maintenance and rejuvenation of major oil platforms. In 2007, production of crude oil is expected to increase 3.5% to 690,000 bpd (2006: -5.2%; 666,925 bpd). In addition, the Kikeh oil fields situated off Sabah, is expected to come onstream in the third quarter of 2007. As crude oil and natural gas are depleting resources and given the high crude oil prices which is expected to remain firm in the medium term, more exploration activities especially for deep water oil and gas fields are being carried out. As a result, in 2007, four new fields were discovered off Peninsular Malaysia, Sarawak and Sabah. Reserves for crude oil and condensates now stands at 5.4 billion barrels and is estimated to last 22 years
TABLE 3.9
Production of Other Agriculture 2006-2007(‘000 tonnes)
Change (%)
2006 20071 2006 20071
Cocoa 32 30 14.1 -6.0
Paddy 2,154 2,277 -6.9 5.7
Livestock
Meat2 244 269 3.2 10.2
Poultry 1,035 1,159 5.6 12.0
Eggs (million) 7,751 8,200 5.0 5.8
Milk (million litre) 45 51 10.6 12.4
Miscellaneous agriculture
Fruits3 1,135 1,190 12.0 4.8
Pepper 19 20 -5.0 5.3
Vegetable 591 623 1.8 5.3
Copra 24 20 96.9 -15.3
Pineapple 158 166 6.6 5.1
Flowers (million cutting) 146 161 43.2 10.2
1 Estimate.2 Including beef, swine and mutton.3 Consists of star fruit, papaya, durian, guava, mangoesteen,
banana, rambutan, watermelon, and dokong.
Source: Ministry of Agriculture and Agro-Based Industry and Ministry of Plantation Industries and Commodities, Malaysia.
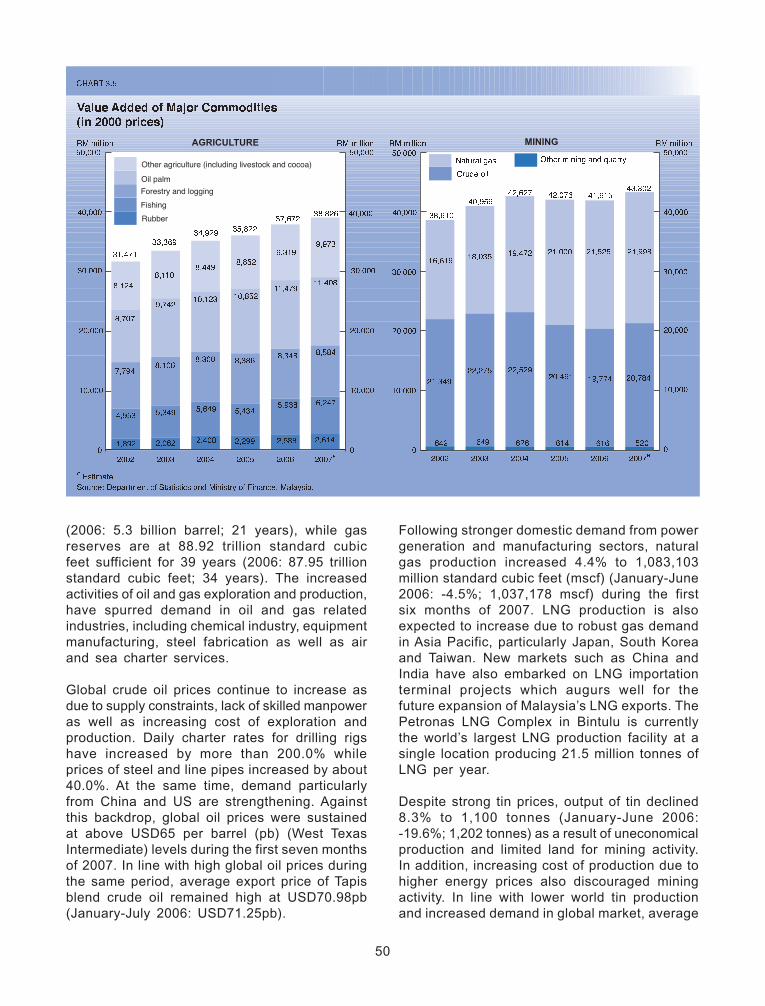
50
(2006: 5.3 billion barrel; 21 years), while gas reserves are at 88.92 trillion standard cubic feet sufficient for 39 years (2006: 87.95 trillion standard cubic feet; 34 years). The increased activities of oil and gas exploration and production, have spurred demand in oil and gas related industries, including chemical industry, equipment manufacturing, steel fabrication as well as air and sea charter services.
Global crude oil prices continue to increase as due to supply constraints, lack of skilled manpower as well as increasing cost of exploration and production. Daily charter rates for drilling rigs have increased by more than 200.0% while prices of steel and line pipes increased by about 40.0%. At the same time, demand particularly from China and US are strengthening. Against this backdrop, global oil prices were sustained at above USD65 per barrel (pb) (West Texas Intermediate) levels during the first seven months of 2007. In line with high global oil prices during the same period, average export price of Tapis blend crude oil remained high at USD70.98pb (January-July 2006: USD71.25pb).
Following stronger domestic demand from power generation and manufacturing sectors, natural gas production increased 4.4% to 1,083,103 million standard cubic feet (mscf) (January-June 2006: -4.5%; 1,037,178 mscf) during the first six months of 2007. LNG production is also expected to increase due to robust gas demand in Asia Pacific, particularly Japan, South Korea and Taiwan. New markets such as China and India have also embarked on LNG importation terminal projects which augurs well for the future expansion of Malaysia’s LNG exports. The Petronas LNG Complex in Bintulu is currently the world’s largest LNG production facility at a single location producing 21.5 million tonnes of LNG per year.
Despite strong tin prices, output of tin declined 8.3% to 1,100 tonnes (January-June 2006: -19.6%; 1,202 tonnes) as a result of uneconomical production and limited land for mining activity. In addition, increasing cost of production due to higher energy prices also discouraged mining activity. In line with lower world tin production and increased demand in global market, average

51
price of tin traded on the Kuala Lumpur Tin Market strengthened further to USD13,385 per tonne (January-June 2006: USD8,088 per tonne).
Construction Sector
Buoyant construction activities …
Value added of the construction sector increased significantly by 4.4% in the first half of 2007 (January-June 2006: -1.2%), after recording a turnaround in the fourth quarter of 2006. The expansion was largely led by increased civil engineering activity, following the implementation of 9MP projects. For the whole year, the sector is envisaged to register a growth of 5.2% (2006: -0.5%).
The civil engineering sub-sector continues to benefit from large allocation in federal development expenditure in 2007. Growth in the sub-sector also emanated from ongoing projects such as the Pantai Timur (Phase II) Highway, Kuala Lumpur-Putrajaya Highway and Duta-Ulu Kelang Expressway. Implementation of projects in the Iskandar Development Region (IDR), which include State Administrative Centre, roads and highways, housing and waterfront city are expected to provide further impetus to the construction sector. Other civil engineering activities such as the flood mitigation project in
TABLE 3.11
Major Ongoing Construction Projects
9MP Construction Projects
Pantai Timur (Phase II) Highway, Terengganu
Duta-Ulu Kelang Expressway
Kuala Lumpur-Putrajaya Highway
Upgrading of Kota Kinabalu Airport, Sabah
Government Quarters in Putrajaya Phase III
Universiti Teknologi MARA – Puncak Alam Campus
Construction of Istana Negara, Jalan Duta, Kuala Lumpur
Sentul-Batu Caves Double-Tracking project
Iskandar Development Region (IDR) Projects
State Administrative Centre, Nusajaya
Cleaning of Seget River, Skudai River and Tebrau River
Construction of two elevated interchanges in Jalan Tampoi
Construction of Senai Interchange
Upgrading of Perling Interchange
Northern Corridor Economic Region (NCER) Projects
Second Penang Bridge
Upgrading of Penang Bridge
Source: Economic Planning Unit, Malaysia.
TABLE 3.10
Production and Reserves of Crude Oil and Natural Gas2006-2007
Change (%)
2006 20071 2006 20071
Crude oil
Production (‘000 barrels per day)2 666.9 690.0 -5.2 3.5
Reserves (billion barrels) 5.3 5.4 1.7 2.1
Reserves/production (years) 21 22
Natural gas
Production3
(million standard cubic feet per day) (mmscfd) 6,258.9 6,439.6 8.0 2.9
Reserves (trillion standard cubic feet) 87.95 88.92 3.2 1.1
Reserves/ production (years) 34 39
1 Estimate.2 Including condensates.3Excludingflaringandreinjection.
Source: Petroliam Nasional Berhad (PETRONAS).

52
the Klang Valley, construction activity in the oil and gas industry and the construction of RM1.4 billion Asia Petroleum Hub in Tanjung Bin, Johor will contribute significantly to the growth of the sector.
Activity in the residential sub-sector moderated after housing developers responded to the cautious buying sentiment following the higher inflation and interest rates in 2006. As a result, low-and-medium property developers have largely deferred their new launches, resulting in lower housing starts of 65,045 units (January-June 2006: 85,025 units) during the first half of 2007. However, with stable interest rate and lower inflation, purchasing sentiment picked up in second quarter of 2007 as reflected by the take-up rate of newly launched residential units which improved to 30.8% (April-June 2006: 11.0%). The high-end property market (more than RM250,000) performed better, as seen in the newly launched detached houses and high-end condominium segments which registered higher
take-up rates of 57.1% and 42.8% respectively (April-June 2006: 3.6%; 33.6%). Government proactive measures such as the exemption of Real Property Gains Tax (RPGT), the removal of the limitation on the number of loans given to non-residents and the lifting of Foreign Investment Committee approval on foreign ownership of residential properties above RM250,000 are expected to support the sub-sector.
On the supply side, developers’ optimism was boosted by the establishment of the one-stop-centre to expedite approvals for development of housing projects and incentives offered to developers who undertake the build-then-sell concept. In tandem with these developments, new sales and advertising permits for construction of residential units and shophouses as well as renewals of such permits increased to 490 and 874 (January-June 2006: 488 permits; 790 permits) respectively. Loans by the banking system for residential property also rose by 7.4% to RM167,549 million (end-June 2006: RM156,044 million). Reflecting the improvement in demand and consumer sentiment, the Malaysian All House Price Index trended upwards by 3.6% during the first half of 2007 (January-June 2006: 1.9%), with higher-than-average prices recorded in Klang Valley and Penang.
The non-residential sub-sector registered a better performance in line with the strong economic performance during the first half of 2007. This was reflected by increased construction activity especially for office buildings. The incoming supply of office space rebounded by 19.2% at end-June 2007 (end-June 2006: -15.9%). The newly completed buildings with a combined area of 126,871 square metres (sqm), boosted the existing stock level of office space to 14,680,860 sqm (end-June 2006: 142,427 sqm; 14,412,571 sqm). The buoyant growth in new business activities, particularly banking, information and communications technology (ICT) and outsourcing has led to higher occupancy rate of office space of 84.9% at end-June 2007 (end-June 2006: 84.4%).
Construction activity of retail space, on the other hand, softened with incoming supply declining 6.7% at end-June 2007 (end-June 2006: 36.6%). However, with the completion of five new shopping complexes during the period, existing stock of
CHART 3.6
Residential Supply Indicators
units('000)
Source: National Property Information Centre (NAPIC).
right scale
1,000
1,500
2,000
2,500
3,000
3,500
4,000
4,500
Q4Q3Q2Q1
20072006200520042003500
544
588
632
676
720
Planned supply
Incoming supply
Existing stock
units('000)
right scale

53
retail space increased to 8,124,391 sqm (end-June 2006: 4 new shopping complexes; 7,533,704 sqm). The overall occupancy rate remained high at 79.8% (end-June 2006: 80.1%).
A total of eight new hotels with 967 rooms were completed during the first six months of 2007 (January-June 2006: 4 hotels; 780 rooms). The existing stock level increased to 2,180 hotels with 149,820 rooms (end-June 2006: 2,154 hotels; 147,510 rooms). The vigorous promotion of VMY 2007 improved the average occupancy rate of 3-5 star rated hotels to 64.4% during the second quarter of 2007 (April-June 2006: 58.4%).
The volume of property transactions increased 3.0% to reach 135,189 transactions in the first half of 2007 (January-June 2006: -4.1%; 131,313 transactions). However, value of transactions increased 12.4% to RM32.3 billion (January-June 2006: 0.9%; RM28.8 billion) reflecting the general improvement in buying sentiment of the property sector, in particular, the high-end residential segment. Residential transactions accounted for 63.6% of the total transactions
CHART 3.7
Non-residential Supply Indicators
20062003 2004 2005 20062002 2003 2004 2005
%% Occupancy RateIncoming Supplyunitssq. meter
('000)
Source: National Property Information Centre (NAPIC).
50
60
70
80
90
50
60
70
80
90
Hotels (3-5 star)
Office spaces
Retail spaces
Q1Q3Q1Q3Q1Q3Q1Q3Q1Q3Q10
500
1,000
1,500
2,000
2,500
3,000
Retail spacesOffice spaces
Industrial units
Shops
Q1Q3Q1Q3Q1Q3Q1Q3Q10
10,000
20,000
30,000
40,000
50,000
right scale
2007 2007
during the period, followed by agricultural (20.0%), commercial (8.8%), development (4.9%) and industrial (2.6%).
Domestic Demand Performance
G r o w t h s p e a r h e a d e d b y d o m e s t i c demand…
The strong economic growth in 2007 will be driven by higher domestic demand expenditure of 9.0% (2006: 7.0%). The private sector continues to be the main engine of growth spurred by strong private investment and buoyant consumer spending. Public sector expenditure is also expected to expand although its share to GDP remains lower than private expenditure as shown in Table 3.12.
Private sector expenditure is envisaged to strengthen further by 8.6% (2006: 7.0%) in line with positive consumer sentiment and favourable business environment. The strong performance of the private sector is supported by various

54
pro-business measures, including reduction in corporate tax rate and accommodative monetary policy. Additionally, private sector income is expected to increase significantly by 9.9% (2006: 12.5%) due to higher economic activity and better terms of trade. Consequently, the private sector is expected to contribute 5.2 percentage points to economic growth with a higher share of 61.5% to total GDP (2006: 4.2 percentage points; 60.1%). On the other hand, the public sector is expected to expand by 10.1%, contributing 2.4 percentage points to GDP growth (2006: 6.8%; 1.6 percentage points). As a result, aggregate domestic demand (excluding change in stocks) is projected to strengthen to 9.0% (2006: 7.0%). Amidst moderate expansion in global trade, contribution to growth from external demand is expected to be sustained, supported by firm
commodity prices and an upturn in demand for E&E products towards the second half of the year. Import growth, particularly capital and intermediate goods, is anticipated to accelerate at a faster pace in tandem with increased domestic economic activity.
Private investment is projected to grow by 7.1% with a share of 11.6% to GDP in 2007 (2006: 7.0%; 11.5%), following improvement in the business environment. The Business Conditions Index (BCI) recorded a three-year high of 122.1 points in the second quarter of 2007 (April-June 2006: 102.4 points), indicating increased optimism of investors on Malaysia’s economic outlook. The favourable performance of private investment is reflected in several key investment indicators, as shown in chart 3.8. These include
TABLE 3.12
Gross Domestic Product (GDP) by Aggregate Demand2006-2008(in 2000 prices)
Change(%)
Share of GDP(%)
Contribution toGDP growth
(percentage point)
2006 20071 20082 2006 20071 20082 2006 20071 20082
GDP 5.9 6.0 6.0-6.5 100.0 100.0 100.0 5.9 6.0 6.0-6.5
Domestic demand3 7.0 9.0 6.8 84.1 86.5 86.9 5.8 7.6 5.9
Private expenditure 7.0 8.6 8.2 60.1 61.5 62.7 4.2 5.2 5.1
Consumption 7.1 9.0 7.9 48.6 49.9 50.8 3.4 4.4 4.0
Investment 7.0 7.1 9.5 11.5 11.6 11.9 0.8 0.8 1.1
Public expenditure 6.8 10.1 3.2 24.0 25.0 24.2 1.6 2.4 0.8
Consumption 5.0 10.8 5.5 12.9 13.5 13.4 0.6 1.4 0.7
Investment 8.9 9.3 0.5 11.1 11.5 10.8 1.0 1.0 0.1
Change in stocks -0.2 -0.2 0.4 0.1 -0.1 0.7
External sector 0.1 -9.6 -1.9 16.1 13.7 12.7 0.0 -1.5 -0.3
Exports4 7.4 4.1 5.7 125.0 122.7 122.0 9.1 5.2 6.9
Imports4 8.6 6.2 6.6 108.9 109.0 109.3 9.1 6.7 7.2
GDP (RM billion, current value) 572.6 625.1 681.7
Change (%) 10.2 9.2 9.1
1 Estimate. 2 Forecast.3 Excluding change in stocks.4 Goods and services.
Source: Department of Statistics and Ministry of Finance, Malaysia.

55
higher imports of intermediate goods, production of hydraulic cement as well as iron and steel in the first six months of 2007. The expansion in investment activity was spurred by higher capacity utilisation in the manufacturing sector which increased to 80.4% in the second quarter of 2007 from 70.0% in the first quarter.
Results from the Business Expectation Survey conducted by the Department of Statistics Malaysia (DOSM) for the first half of 2007 also indicated higher capital outlay by the private sector which increased by 16.6% (January-June 2006: -13.2%). The services sector is expected to contribute the largest share to capital outlay at 48.6%, followed by mining and electricity (23.7%), manufacturing (23.1%) and agriculture (2.6%). Investment in the services sector is expected to emanate from transport and communication as well as financial intermediation. Approved projects for domestic direct investment (DDI) in the manufacturing sector increased significantly by 71.3% to RM14.3 billion during the first six months of the year (January-June 2006: 28.1%; RM8.4 billion), mainly in petroleum, basic metal, chemicals and chemical product and E&E industries. Meanwhile, total loans disbursed by the banking system, excluding the household sector, increased 12.9% to RM35,876 million during the first six months (end-June 2006: -4.5%; RM31,775 million). A large portion of loans disbursed was for the manufacturing sector (including agro-based) (31.2%), followed by wholesale, retail trade, restaurants and hotels (20.6%) as well as finance, insurance and business activities (18.3%). During the same period, loans disbursed to SMEs increased by 2.0% to RM67.5 billion constituting 36.2% of total business loan disbursed in the banking system (January-June 2006: 35.2%; RM66.1 billion).
Malaysia continues to attract FDI amidst a competitive environment. In the first quarter of 2007, total net FDI recorded a robust growth of 54.1% to RM5,697 million (January-March 2006: 21.2% to RM3,696 million). Manufacturing continued to be the main contributor with a share of 52.2% to total FDI, followed by wholesale and retail trade (26.4%), financial intermediation (16.8%) as well as mining and quarrying (7.7%). Meanwhile, approvals for foreign investment in manufacturing projects increased strongly by
Private Investment Indicators

56
114.1% to RM14.5 billion in the first six months of 2007 (January-June 2006: 3.5%; RM6.8 billion), mainly in E&E (53.3%), petroleum (20.5%), chemicals and chemical products (6.3%) and non-metallic mineral industries (6.1%).
Growth in private consumption is expected to increase 9.0% and account for 49.9% of GDP in 2007 (2006: 7.1%; 48.6%). Key factors underpinning the increase in private consumption include a supportive financial environment backed by low and stable interest rates, and higher disposable income arising from stable employment prospects, salary adjustments for civil servants as well as positive wealth effect from a bullish stock market and strong commodity prices. The uptrend in private consumption spending is reflected in the Consumer Sentiments Index (CSI), which recorded a significant increase of 11.7 points in the second quarter of 2007 to 115.9 points (April-June 2006: 104.2 points). During the first six months of 2007, major consumption indicators, especially food sales and services tax collection, registered double-digit growth of 17.9% and 12.5% (January-June 2006: 1.4%; 0.3%), respectively. Credit card transactions and consumption credit grew strongly by 21.1% and 7.1% (end-June 2006: 16.2%; 21.3%), respectively. Meanwhile, sales of motorcycles expanded by 4.5% (January-June 2006: 3.6%).
Public consumption is estimated to expand 10.8% (2006: 5.0%), mainly due to larger expenditure on supplies and services as well as higher emolument. The expenditure on supplies and services is to improve the administrative machinery and delivery system of the public sector while higher expenditure on emolument is due to the salary adjustment for civil servants of between 7.5% and 35.0% effective 1 July 2007. Meanwhile, public investment is expected to increase 9.3%, with a share 11.5% to GDP (2006: 8.9%; 11.1%), largely underpinned by ongoing development projects.
National Resource Position
Healthy resource posit ion to support growth…
National income in current prices continues to record robust growth of 9.4% in 2007 (2006: 12.0%) in line with expansion in domestic economic activities and firm commodity prices.

57
Despite higher consumption spending growth of 12.7% (2006: 9.7%), Gross National Savings (GNS) continues to expand by 4.9%, constituting 36.6% of Gross National Product (GNP) (2006: 17.1%; 38.2%). Private sector accounts for 62.2% of total GNS (2006: 60.8%), which can be mobilised to finance domestic investments. Total investment, including change in stocks, is expected to increase strongly by 11.6% (2006: 12.6%) mainly from private sector initiatives. Consequently, the savings-investment gap in 2007 is envisaged to continue to record a surplus of RM90 billion or 14.8% of GNP (2006: RM93.4 billion; 16.8%), reflecting the country’s strong economic fundamentals.
Trade Performance
Export Performance
Exports to pick up momentum…
Exports moderated to 1.1% (January-June 2006: 10.5%) in the first six months of the year amidst continued soft external demand for E&E products, in particular semiconductor devices, automatic data processing (ADP) machines and parts as well as telecommunications equipment
TABLE 3.13
Savings-Investment Gap2006-2008(in current value)
2004 2005 2006 20071 20082
RM million
Public Sector Savings 73,000 70,506 83,079 84,030 86,214 Gross capital formation 48,744 53,480 58,761 65,385 66,968 Surplus/Deficit 24,256 17,026 24,318 18,645 19,246
Private Sector Savings 93,569 110,493 128,876 138,242 150,765 Gross capital formation3 60,523 51,837 59,775 66,923 81,297 Surplus/Deficit 33,046 58,656 69,101 71,319 69,468
Overall Gross national savings 166,569 180,999 211,955 222,272 236,979 (as % of GNP) 37.0 36.5 38.2 36.6 35.8
Gross capital formation3 109,267 105,317 118,536 132,308 148,265 (as % of GNP) 24.3 21.3 21.4 21.8 22.4
Surplus/Deficit 57,302 75,682 93,419 89,964 88,714 (as % of GNP) 12.7 15.3 16.8 14.8 13.4
1 Estimate. 2 Forecast. 3 Including change in stocks.
Source: Department of Statistics and Ministry of Finance, Malaysia.

58
During the first half of 2007, exports of non-E&E grew 8.9% (January-June 2006: 16.1%) supported by higher growth in exports of resource-based products, in particular, chemicals, plastics, rubber as well as iron, steel and metal. In addition, firm demand for food, beverages and tobacco was reflected in double-digit growth in export earnings of the industry.
Exports of chemicals and plastic products posted robust growth of 22.1% to RM20,128 million during the first six months of the year (January-June 2006: 2.4%; RM16,488 million). Growth was underpinned by exports of chemicals which rebounded strongly by 31.8% (January-June 2006: -3.6%) on account of strong demand for organic and inorganic chemicals, particularly from China and Thailand. Meanwhile, steady demand from ASEAN, China and Japan saw significant growth of 16.8% in exports of essential oils, perfumes and cleaning preparations (January-June 2006: 11.7%).
Another major component, plastic products, grew 10.8% in the first six months of 2007 (January-June 2006: 10.2%) in response to increasing demand from ICT and medical devices industries. Singapore, Japan and Thailand are among the major markets for plastic products. Exports of plastic products to the EU saw an increase following the conclusion of anti-dumping and anti-subsidy investigations in 2006, on plastic carrier bags imported from Malaysia. In addition, Malaysia’s move to ban the import of plastic
TABLE 3.14
Gross Exports2006-2007
RM million Change (%)
Share (%)
2006 20071 2006 20071 2006 20071
Manufactured goods 479,674 489,734 10.1 2.1 81.4 79.3
Agricultural goods 39,091 52,245 14.6 33.6 6.6 8.5
Mining goods 55,824 60,438 9.3 8.3 9.5 9.8
Others 14,377 14,814 11.7 3.0 2.4 2.4
Gross Exports 588,966 617,229 10.3 4.8 100.0 100.0
1 Estimate.
Source: Department of Statistics and Ministry of Finance, Malaysia.
and parts. However, export growth is expected to pick up momentum towards the second half of the year, supported by firm commodity prices and an upswing in the global demand for E&E products. For the year, gross exports are expected to remain strong despite a moderate expansion in global trade. Gross export earnings free on board (f.o.b) are projected to grow at 4.8% (2006: 10.3%) contributed by manufactured goods which comprise 79.3% of total exports. Meanwhile, robust global demand for major commodities such as palm oil, crude petroleum and LNG is expected to boost export receipts of agriculture and mineral products by 33.6% and 8.3% (2006: 14.6%; 9.3%), respectively. Given the strong performance, Malaysia is expected to record a trade surplus for the 10th consecutive year since 1998.
Exports of Manufactured Goods
Strong exports of resource-based manufactured goods…
Export earnings of manufactured goods rose marginally by 0.5% during the first half of 2007 (January-June 2006: 10.1%) mainly due to weak global demand for E&E products as shown in Table 3.15. However, strong growth in the exports of resource-based manufactured goods cushioned the moderation in E&E exports.
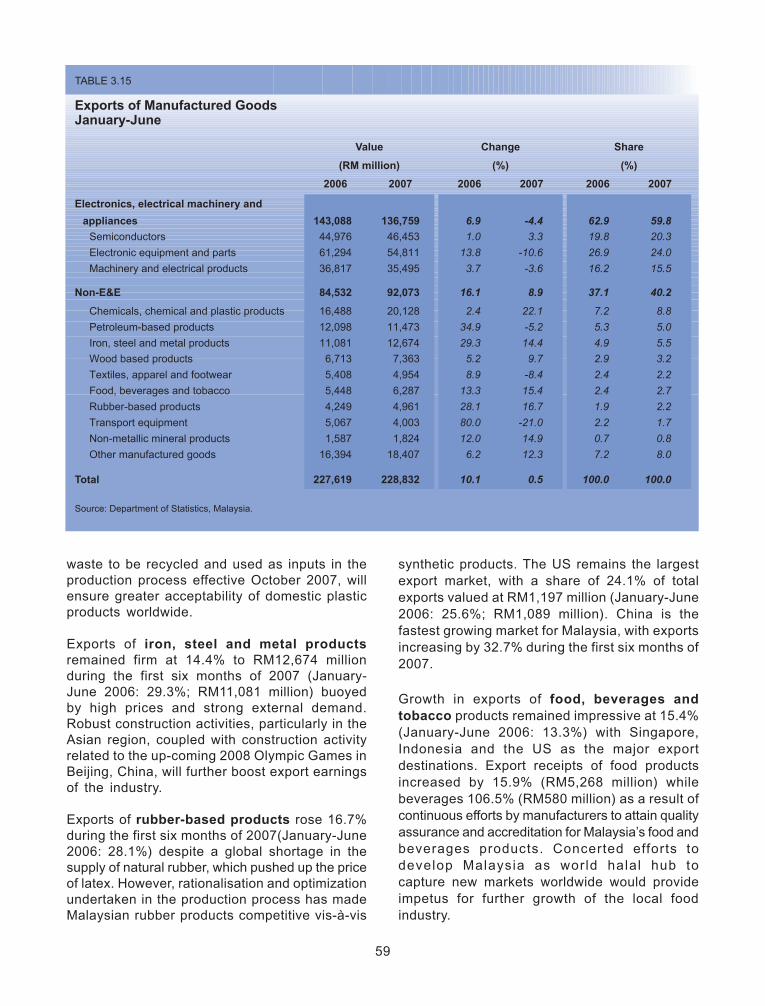
59
waste to be recycled and used as inputs in the production process effective October 2007, will ensure greater acceptability of domestic plastic products worldwide.
Exports of iron, steel and metal products remained firm at 14.4% to RM12,674 million during the first six months of 2007 (January-June 2006: 29.3%; RM11,081 million) buoyed by high prices and strong external demand. Robust construction activities, particularly in the Asian region, coupled with construction activity related to the up-coming 2008 Olympic Games in Beijing, China, will further boost export earnings of the industry.
Exports of rubber-based products rose 16.7% during the first six months of 2007(January-June 2006: 28.1%) despite a global shortage in the supply of natural rubber, which pushed up the price of latex. However, rationalisation and optimization undertaken in the production process has made Malaysian rubber products competitive vis-à-vis
synthetic products. The US remains the largest export market, with a share of 24.1% of total exports valued at RM1,197 million (January-June 2006: 25.6%; RM1,089 million). China is the fastest growing market for Malaysia, with exports increasing by 32.7% during the first six months of 2007.
Growth in exports of food, beverages and tobacco products remained impressive at 15.4% (January-June 2006: 13.3%) with Singapore, Indonesia and the US as the major export destinations. Export receipts of food products increased by 15.9% (RM5,268 million) while beverages 106.5% (RM580 million) as a result of continuous efforts by manufacturers to attain quality assurance and accreditation for Malaysia’s food and beverages products. Concerted efforts to develop Malaysia as world halal hub to capture new markets worldwide would provide impetus for further growth of the local food industry.
TABLE 3.15
Exports of Manufactured Goods January-June
value Change Share
(RM million) (%) (%)
2006 2007 2006 2007 2006 2007
Electronics, electrical machinery and
appliances 143,088 136,759 6.9 -4.4 62.9 59.8
Semiconductors 44,976 46,453 1.0 3.3 19.8 20.3
Electronic equipment and parts 61,294 54,811 13.8 -10.6 26.9 24.0
Machinery and electrical products 36,817 35,495 3.7 -3.6 16.2 15.5
Non-E&E 84,532 92,073 16.1 8.9 37.1 40.2
Chemicals, chemical and plastic products 16,488 20,128 2.4 22.1 7.2 8.8
Petroleum-based products 12,098 11,473 34.9 -5.2 5.3 5.0
Iron, steel and metal products 11,081 12,674 29.3 14.4 4.9 5.5
Wood based products 6,713 7,363 5.2 9.7 2.9 3.2
Textiles, apparel and footwear 5,408 4,954 8.9 -8.4 2.4 2.2
Food, beverages and tobacco 5,448 6,287 13.3 15.4 2.4 2.7
Rubber-based products 4,249 4,961 28.1 16.7 1.9 2.2
Transport equipment 5,067 4,003 80.0 -21.0 2.2 1.7
Non-metallic mineral products 1,587 1,824 12.0 14.9 0.7 0.8
Other manufactured goods 16,394 18,407 6.2 12.3 7.2 8.0
Total 227,619 228,832 10.1 0.5 100.0 100.0
Source: Department of Statistics, Malaysia.

60
Export earnings of wood-based products also recorded strong growth of 9.7%. (January-June 2006: 5.2%) following increased demand from major markets such as Taiwan, Japan and the EU. In addition, lower tariffs imposed under Japan-Malaysia Economic Partnership Arrangement which became effective in July 2006 further enhanced export receipts of wood-based products. Sustained demand for Malaysian veneer, plywood and wooden furniture in traditional markets as well as increasing demand from emerging markets such as United Arab Emirates and India bode well for the industry.
Exports of petroleum products contracted by 5.2% to RM11,473 million during the first six months of 2007 (January-June 2006: 34.9%; RM12,098 million) on account of lower production of crude oil. Republic of Korea, India, Japan, Singapore and China continue to be the major export markets for Malaysia. Exports of petroleum products to Republic of Korea increased sharply by 86.0% to RM1,121 million (January-June 2006:
192.6%; RM603 million) while exports to India grew 18.4% to RM536 million (January-June 2006: 24.5%; RM452 million).
Overall export earnings of transport equipment fell by 21.0% to RM4,003 million during the first six months of 2007 (January-June 2006: 80.0%; RM5,067 million) following lower exports by 46.4% in other vehicles such as railway vehicles and associated equipment as well as ships, boats and floating structures. The road vehicles, however, registered strong growth of 32.5% (January-June 2006: 0.5%) supported by higher demand for parts and accessories of motor vehicles, motor cycles as well as passenger motor vehicles, excluding buses. Exports of transport equipment are envisaged to further expand with increase in demand, particularly from China.
Meanwhile, exports of E&E products declined by 4.4% during the first half of 2007 (January-June 2006: 6.9%) on account of lower exports of electronic equipment and parts (-10.6%) as well

61
as machinery and electrical products (-3.6%). The slowdown in demand for E&E products, as shown in chart 3.12, was however, mitigated by improved performance in the exports of semiconductors which grew by 3.3% (January-June 2006: 1.0%). Despite lacklustre performance, E&E exports remained the major component, constituting 59.8% of total manufactured exports.
Exports of Primary Commodities
Export earnings backed by firm commodity prices …
Export receipts from primary commodities are projected to increase 18.7% to RM112,682 million in 2007 (2006: 11.4%; RM94,916 million), mainly contributed by higher export earnings of palm oil, palm kernel, crude oil and natural gas. Export receipts of agriculture commodities for the first half of 2007, increased 13.6% to RM20,044 million (January-June 2006: 3.8%; RM17,640 million), representing 7.1% of gross exports (January-June 2006: 6.4%). The strong performance was on account of higher commodity prices and increased global demand for CPO and rubber. Meanwhile, export receipts of mining increased slightly by 0.9% to RM27,705 million (January-June 2006: 17.7%; RM27,464 million) largely due to marginal increase in export of crude oil. Share of mining proceeds to gross exports was sustained at 9.8% (January-June 2006: 9.8%).
Export volume of palm oil declined by 8.3% to 6.1 million tonnes during the first half of 2007 (January-June 2006: -1.6%; 6.6 million tonnes) due to lower production of palm oil as a result of bad weather conditions in the first quarter of 2007. For the year, export of palm oil is projected to decrease 2.2% to 14.1 million tonnes (2006: 7.3%; 14.4 million tonnes). China remains the largest importer of Malaysia’s palm oil, accounting for 27% of total palm oil export, followed by the Netherlands (13%), Pakistan (8%) and US (5%). Rising global demand for biofuels and tight supply conditions pushed the average export unit value of palm oil to RM2,076 per tonne in the first six months of the year. Consequently, export value for the first half of 2007 improved further to RM12,609 million (January-June 2006: RM9,866 million). CPO export price is expected to stabilise at RM2,450 per tonne for
the year with export value for palm oil forecast at RM34,545 million (2006: RM22,687 million). Presently, Malaysia is the largest exporter of palm oil accounting for 62% of world exports, and 22% of global exports of vegetable oils and fats. Export earnings of palm kernel oil (PKO) rebounded significantly by 40.0% to RM1,305 million in the first half of 2007 (January-June 2006: -18.9%; RM932 million) resulting from higher export volume of 523,292 tonnes due to higher external demand. During the same period, export price of PKO increased further to RM2,494. With sustained high PKO prices, total export earnings of PKO for the year is expected to reach RM2,565 million.
Despite strong global demand and firm prices, export earnings of rubber, declined 15.6% to RM3,385 million (January-June 2006: 55.0%; RM4,010 million) following lower production as a result of poor weather conditions. Consequently, export volume declined by 16.3% to 483,542 tonnes (January-June 2006: 4.5%; 577,657 tonnes) while average export price was sustained at RM7.00 per kg. The firm rubber price was due to rising external demand, especially from China, Germany, US and France, and higher price of synthetic rubber. China remains the largest importer of Malaysia’s rubber, accounting for 31.4% of total exports followed by Germany (14.5%), US (5.9%) and France (5.5%). Malaysia remains the third largest exporter of natural rubber after Thailand and Indonesia, accounting for 11.0% of world export.
Export volume of crude petroleum increased slightly by 0.1% to 8.37 million tonnes in the first half of 2007 (January-June 2006: -5.4%; 8.36 million tonnes) on account of sustained global demand for crude oil. Export unit value was lower at RM1,750 per tonne during the period (January-June 2006: RM1,912 per tonne). As a result petroleum receipts fell 8.4% to RM14,640 million (January-June 2006: 24.3%; RM15,976 million). Crude petroleum is exported mainly to Singapore, India, Thailand, Republic of Korea and Indonesia.
In contrast, export earnings of LNG increased further by 14.9% to RM12,878 million (January-June 2006: 11.4%; RM11,205 million) due to robust demand from Japan, Taiwan and South Korea which accounted for 98.9% of total exports. Export volume of LNG rebounded significantly

62
TABLE 3.16
Primary Commodity Exports 2006-2007
Change (%)
2006 20071 2006 20071
Palm oil2 Volume (‘000 tonnes) 14,423 14,100 7.3 -2.2 Unit Value (RM/tonne) 1,573 2,450 5.6 55.8 Value (RM million) 22,687 34,545 13.3 52.3
Palm kernel oil Volume (‘000 tonnes) 933 950 9.7 1.8 Unit Value (RM/tonne) 2,313 2,700 -9.8 16.7 Value (RM million) 2,158 2,565 -1.0 18.9
Saw logs Volume (‘000 cubic metres) 4,772 5,000 -17.1 4.8 Unit Value (RM/cubic metres) 474 480 10.7 1.3 Value (RM million) 2,261 2,400 -8.3 6.1
Sawn timber Volume (‘000 cubic metres) 2,939 3,281 -10.3 11.6 Unit Value (RM/cubic metres) 1,203 1,250 13.6 3.9 Value (RM million) 3,536 4,101 1.9 16.0
Rubber Volume (‘000 tonnes) 1,134 1,165 0.6 2.7 Unit Value (RM/tonne) 7,259 7,200 41.5 -0.8 Value (RM million) 8,235 8,388 42.3 1.9
Pepper Volume (‘000 tonnes 16.5 15.6 -8.0 -5.5 Unit Value (RM/tonne) 8,684 10,500 28.9 20.9 Value (RM million) 139 164 14.4 18.2
Cocoa Volume (‘000 tonnes) 14 14 45.7 3.6 Unit Value (RM/tonne) 5,624 5,800 3.7 3.1 Value (RM million) 76 81 51.2 6.9
Crude petroleum Volume (‘000 tonnes) 16,858 17,640 -7.5 4.6 Unit Value (RM/tonne) 1,896 1,968 17.7 3.8 Value (RM million) 31,955 34,723 8.8 8.7
Liquefiednaturalgas Volume (‘000 tonnes) 21,534 22,470 -1.9 4.3 Unit Value (RM/tonne) 1,081 1,099 14.2 1.6 Value (RM million) 23,286 24,560 12.0 5.5
Tin Volume (‘000 tonnes) 19 25 -42.3 29.0 Unit Value (RM/tonne) 30 46 8.2 53.5 Value (RM million) 583 1,155 -37.7 98.1
Total value (RM million) 94,916 112,682 11.4 18.7
1 Estimate.
2 Includes crude palm oil, processed palm oil and stearin.
Source: Department of Statistics Malaysia, Malaysian Palm Oil Board and Ministry of Finance, Malaysia.

63
by 11.7% to 12.1 million tonnes (January-June 2006: -5.3%; 10.8 million tonnes) while prices increased to RM1,067 per tonne in the first half of 2007 (January-June 2006: RM1,037 per tonne).
Import Performance
Imports to accelerate…
Gross imports valued at cost, insurance and freight (c.i.f.) are expected to expand 7.6% in 2007 to RM517,264 million (2006: 10.8%; RM480,773 million). During the first six months of the year, gross imports increased 3.5% to RM239,393 million (January-June 2006: 12.6%; RM231,237 million) following strong demand for intermediate goods which accounted for 71.5% of total imports, as shown in Table 3.17. Likewise, imports of consumption goods grew in consonant with resilient household spending and increased tourist arrivals. The level of imports of capital goods was sustained. In terms of product sectors, imports included mainly E&E products, machinery, appliances and parts, chemical and chemical products, manufactures of metal as well as iron and steel products.
Led by sustained production and investment activity, imports of intermediate goods grew 7.6% to RM171,235 million (January-June 2006: 8.0%; RM159,134 million) in the first six months of the year. On a disaggregated basis, imports of industrial supplies, including metals and chemicals, surged 23.1% (January-June 2006: 1.0%) driven by increased demand in domestic oriented industries such as chemicals, iron, steel and other metals as well as construction related industries. Imports also included line pipes for the oil and gas industry and animal feed for livestock. Likewise, strong consumption activity was reflected in the imports of primary and processed materials for the food and beverages industry which increased by 7.9% (January-June 2006: 28.5%). Cocoa beans, soya beans, cane sugar, palm oil as well as milk and cream in powder and other forms, were among the principal inputs imported by the industry. High petroleum prices and weak demand for transport equipment saw imports of fuels and lubricants record a marginal growth of 1.4% (January-June 2006: 30.7%). Apart from crude petroleum which accounted for 50.0% of imports in the sub-category, other
imports included naphtha, diesel fuel, coal and natural gas. Despite slower external demand for E&E products, import values of thermionic valves and tubes, which are inputs for the E&E industry, remained high at RM55,604 million (January-June 2006: RM54,563 million), indicating better prospects for the export-oriented semiconductor industry. Poor domestic sales of motor vehicles, lower production as well as a weak used car market continued to plague the transport equipment industry. Consequently, imports of parts and accessories for transport equipment posted a decline of 4.6% (January-June 2006: -0.6%). Growth in the sub-category was mainly supported by imports of aircraft engines and parts as well as turbo jets, propellers and parts. For the year, imports of intermediate goods are projected to grow by 7.9% (2006: 8.8%) to meet increased domestic demand as investment, production and consumption activity strengthen. In addition, a pick up in global E&E cycle towards the second half of the year will also lend support to growth in imports of intermediate goods.
Imports of capital goods, which comprised 13.2% of total imports declined 2.8% to RM31,525 million during the first six months of 2007 after recording growth of 16.7% during the corresponding period last year. The strong growth was on account of delivery of lumpy items such as ships, aircraft, offshore support vessels, rail locomotives as well as machinery and equipment in tandem with strong external demand for commodity exports and capacity expansion in various sectors, including oil and gas, travel and manufacturing. Despite posting negative growth in the first six months of 2007, import values of capital goods remained high, supported primarily by demand for capital goods, excluding transport equipment. This sub-category, which accounted for 87.4% of capital goods, grew 1.1% (January-June 2006: 83.9%; 8.6%) in tandem with sustained business and investment activity. Principal products imported included electronic equipment and parts, telecommunications equipment as well as floating docks for the oil and gas industry. Imports of transport equipment for industrial purposes declined 23.6% to RM3,980 million due to dissipation of the high-base effect (January-June 2006: 92.2%; RM5,211 million). Nevertheless, capital goods imported during this period included aircraft, tankers and heavy vehicles. For the year, imports of capital goods are envisaged to expand 4.6% to RM68,279

64
million (2006: 7.4%; RM65,257 million) in line with increased investment in plant, machinery and equipment as business and investment activity come on stream with the implementation of development projects.
Boosted by r is ing aff luence, imports of consumption goods expanded by 5.0% (January-June 2006: 13.4%) in the first six months of the year. While imports of non-industrial transport equipment such as outboard motors, motorcycles and bicycles fell 4.1% (January-June 2006:
19.3%), a sharp increase of 8.7% (January-June 2006: 4.4%) was recorded in the import bill of food and beverages, indicating strong private consumption and tourist spending. Frozen meat, fruits, fresh and frozen seafood, vegetables, alcoholic beverages as well as milk and cream in powder and other forms were among the items imported. Similarly, strong growth of 15.9% and 5.7% (January-June 2006: 10.3%; 12.8%), respectively was also seen in imports of durables and non-durables. Major consumption goods included medicaments, pharmaceuticals,
TABLE 3.17
Gross Imports by End Use January-June
RM million Change (%)
Share (%)
2006 2007 2006 2007 2006 2007
Capital goods 32,448 31,525 16.7 -2.8 14.0 13.2
Capital goods (except transport equipment) 27,237 27,545 8.6 1.1 83.9 87.4
Transport equipment (industrial) 5,211 3,980 92.2 -23.6 16.1 12.6
Intermediate goods 159,134 171,235 8.0 7.6 68.8 71.5
Food and beverages, primary and processed mainly for industry
5,344 5,764 28.5 7.9 3.4 3.4
Industrial supplies, primary and processed 48,510 59,732 1.0 23.1 30.5 34.9
Fuel and lubricants primary processed, others
16,196 16,416 30.7 1.4 10.2 9.6
Parts and accessories of transport equipment
5,968 5,692 -0.6 -4.6 3.8 3.3
Parts and accessories of capital goods (except thermionic valves and tubes)
28,555 28,027 6.3 -1.8 17.9 16.4
Thermionic valves and tubes 54,563 55,604 9.2 1.9 34.3 32.5
Consumption goods 13,164 13,824 13.4 5.0 5.7 5.8
Food and beverages, primary and processed, mainly for household consumption
4,635 5,039 4.4 8.7 35.2 36.5
Transport equipment (non-industrial) 150 144 19.3 -4.1 1.1 1.0
Other consumer goods 8,378 8,641 18.9 3.1 63.6 62.5
Durables 1,829 2,119 10.3 15.9 21.8 24.5
Semi-durables 2,899 2,664 34.9 -8.1 34.6 30.8
Non-durables 3,650 3,858 12.8 5.7 43.6 44.6
Others (including dual use goods) 10,106 10,257 10.6 1.5 4.4 4.3
Imports for re-exports 16,384 12,552 72.3 -23.4 7.1 5.2
Total 231,237 239,393 12.6 3.5 100.0 100.0
Source: Department of Statistics, Malaysia.

65
goods are reassembled, packed and labelled at commercial free zone areas in ports and airports for re-exports mainly to the US, Thailand, China, Hong Kong, Singapore, Australia and India. Re-exports are anticipated to expand 5.3% (2006: 50.6%) for the year boosted by an upturn in the global electronics cycle towards the second half of the year as well as continued investment in oil and gas production and exploration activities.
Balance of Payments
Strong current account surplus…
Malaysia’s overall balance of payments position is anticipated to remain favourable in 2007 with the current account posting a surplus for the tenth consecutive year, as shown in Table 3.18. The surplus in the current account, however, is projected to narrow to 14.8% of GNP (2006: 16.8%), consistent with continued expansion in manufacturing and investment activity. While the surplus in the goods account is expected to be marginally lower, increased tourist receipts and higher earnings in the transportation account
cosmetics and health care products, batteries, furniture, printed material as well as household electrical appliances. Accordingly, the share of consumption goods to total imports increased to 5.8% compared with 5.7% in the corresponding period of last year. For the year, imports of consumption goods are set to expand by 9.4% (2006: 13.4%) spurred by rising disposable income, increased tourist arrivals as well as year-end festivities and holidays.
Other imports, including dual use goods, increased marginally by 1.5% (January-June 2006: 10.6%) on account of sustained demand for motor spirit of all grades and motor cars, including station wagons and vans. Meanwhile, sluggish global demand for E&E products was reflected in a 23.4% contraction (January-June 2006: 72.3%) in imports for re-exports. Accounting for 5.2% (January-June 2006: 7.1%) of total imports, re-exports comprised mainly parts and accessories for ADP machines and digital monolithic integrated circuits. Other items included line pipes and floating structures for oil and gas industry, flat rolled steel products as well as parts for aircraft and aircraft engines. These
TABLE 3.18
Current Account of the Balance of Payments 2007-2008 (RM million)
20071 20082
+ - Net + - Net
Goods 619,164 490,373 128,791 661,209 530,454 130,755
Trade account (Exports/Imports) 617,229 517,264 99,965 659,143 559,544 99,599
(% annual change) 4.8 7.6 6.8 8.2
Services 91,861 95,846 -3,985 102,120 106,766 -4,646
Transportation 19,927 38,892 -18,965 24,121 43,223 -19,102
Travel 44,500 17,220 27,280 49,000 20,396 28,604
Other services 26,947 38,856 -11,908 28,413 42,169 -13,756
Government transactions 487 878 -392 587 978 -392
Income 33,804 51,644 -17,840 35,524 55,498 -19,974
Compensation of employees 5,388 5,561 -173 5,654 6,922 -1,268
Investment income 28,416 46,083 -17,667 29,870 48,576 -18,706
Current transfers 1,293 18,295 -17,002 1,364 18,785 -17,421
Current account 746,122 656,158 89,964 800,217 711,503 88,714
1 Estimate. 2 Forecast.
Source: Ministry of Finance, Malaysia.

66
outflows, which include payments for business, leisure, education, health as well as pilgrimage are anticipated to increase further by 16.9% to RM17,220 million (2006: 4.9%; RM14,736 million) as more Malaysians travel abroad on account of rising affluence and increasingly affordable air travel. Although payments for transportation are expected to be higher on account of Malaysia’s continued reliance on foreign freight services for transportation of goods, gross receipts are also envisaged to increase, supported by a buoyant air passenger segment. Boosted by capacity expansion in airport facilities and services, increasing business activities, and with VMY 2007 well underway, patronage of domestic airlines is expected to continue trending upwards. Additionally, a surge in intra-regional travel following enhanced connectivity and competitive air fares, coupled with new destination launches are anticipated to further spur growth in transport receipts. Apart from aircraft parking and landing fees as well as other airport disbursements, higher earnings are also expected from related port dues with the expansion in container throughput at major ports. Accordingly, the transportation account is projected to register a smaller deficit by 3.3% to RM18,965 million (2006: 19.4%; -RM19,620 million) for the year. Meanwhile, net outflows in the other services account is anticipated to be higher as Malaysia continues to import foreign professional, business and technical expertise. Payments for royalties, licence fees, construction and installation services as well as brisk economic activity in trade-related services, including insurance, telecommunications, finance and leasing are also expected to contribute to net outflows.
The deficit in the income account is expected to be sustained at RM17,840 million (2006: -RM17,356 million), as a result of increased repatriation of interest, profits and dividends accruing to Malaysian firms operating abroad. Gross receipts, anticipated to increase by 9.1% to RM33,804 million in 2007, are primarily from oil and gas, utilities, manufacturing, banking, telecommunications and construction activities where Malaysian companies have gained a firm foothold abroad. Improved returns on external reserves holdings are also expected to offset the deficit in the income account. Similarly, gross payments, comprising interest, profits and dividends of MNCs operating in Malaysia are
are expected to significantly improve the deficit envisaged in the services account. Meanwhile, the deficit in the income and transfers accounts are expected to be sustained. The financial account, however, is expected to record lower net outflows following improved business confidence, underpinned by new investment opportunities in the IDR and NCER, business friendly policies as well as better corporate performance of GLCs and the private sector. Accordingly, Malaysia’s international reserves are anticipated to be strong, further enhancing the nation’s economic resilience.
Despite favourable commodity prices and an anticipated upturn in the global electronics cycle towards the second half of the year, the goods account in 2007 is expected to post a lower surplus, contracting by 4.3% to RM128,791 million (2006: 7.2%; RM134,558 million) in line with moderate expansion in world trade. Nevertheless, firm commodity prices and strong demand, in particular, for palm oil and crude petroleum from emerging markets such as China and India are expected to boost export earnings of major commodities, increasing their share to total exports to 18.3% (2006: 16.1%). For the year, however, import growth is expected to outpace exports, consistent with increased domestic demand for capital, intermediate and consumption goods. Accordingly, imports are anticipated to accelerate by 7.7% to RM490,373 million while exports, at 5.0% to RM619,164 million (2006: 10.6%, RM455,185 million; 9.8%, RM589,743 million).
The services account, comprising transportation, travel, government transactions and other services, is expected to improve significantly and record a lower deficit of RM3,985 million (2006: -RM6,931million) underpinned by higher tourist arrivals and improved earnings in air passenger travel. Net inflows in the travel account are projected to increase 16.1% to RM27,280 million (2006: 20.8%; RM23,501 million) in tandem with VMY 2007, coupled with aggressive efforts to promote Malaysia as a health, education as well as an international convention and exhibition hub. For the year, tourist spending, the largest contributor to earnings in the services account, is poised to expand by 16.4% to RM44,500 million (2006: 14.1%; RM38,237 million). Gross

67
envisaged to increase 6.8% to RM51,644 million (2006: 9.3%; RM48,349 million) in anticipation of improved corporate earnings following strong economic activity. In the light of concerted efforts to further enhance the investment climate through various policies and initiatives, a significant portion of the earnings is expected to be retained in Malaysia for re-investment purposes, signalling continued confidence in the economy. The other component in the income account, compensation of employees, which includes salaries and other benefits earned by expatriates working in Malaysia and by Malaysians working abroad, is expected to record a smaller deficit of RM173 million in 2007 (2006: -RM283 million) in keeping with recent trends. Higher inflows envisaged in the account will be supported by foreign demand for local professional skills and technical expertise in various fields, including, oil and gas, construction, plantation agriculture and other professional businesses.
Net outflows associated with current transfers, which reflect remittances by Malaysians working abroad and repatriation of earnings by foreign workers in Malaysia, are expected to remain stable. This is in line with the Government’s efforts to regulate the inflow and presence of foreign workers according to the needs of the various sectors of the economy. As such, transfer payments in 2007 are expected to see only a marginal increase of 1.6% to RM18,295 million (2006: -0.5%; RM17,999 million) while receipts are projected to expand by 12.7% to RM1,293 million (2006: 1.4%; RM1,147 million). Consequently, the deficit in the current transfers is expected to be sustained, growing 0.9% to RM17,002 million (2006: -0.7%; -RM16,852 million).
The financial account, comprising direct investment, portfolio investment and other investment, is expected to further improve following concerted efforts by the Government to provide a conducive business environment. Liberalisation measures in the property market, including the waiver on RPGT, growing number of merger and acquisition activities in financial, plantation agriculture and communications sectors as well as improved corporate earnings are expected to spur greater inflows of FDI. In addition, rising business confidence in the light of developments in IDR and NCER, liberalisation of foreign exchange rules
and smooth implementation of projects under the 9MP are also expected to boost inflows of FDI. Outward flows are also expected to be substantial as Malaysian firms continue to expand and diversify their business interests abroad mainly in oil and gas, manufacturing, services and construction.
Reinforced by sound macroeconomic fundamentals, investor confidence is also expected to be reflected in strong portfolio inflows in anticipation of better returns on equities and debt securities. The other investment component of the financial account is, however, expected to register a net outflow mainly on account of net repayments of external loans by the official sector, trade credits extended by Malaysian exporters and repayment of trade credits by Malaysian importers. In addition, placement of assets abroad by the banking sector and sett l ing of inter-bank borrowings will continue to contribute to the outflows.
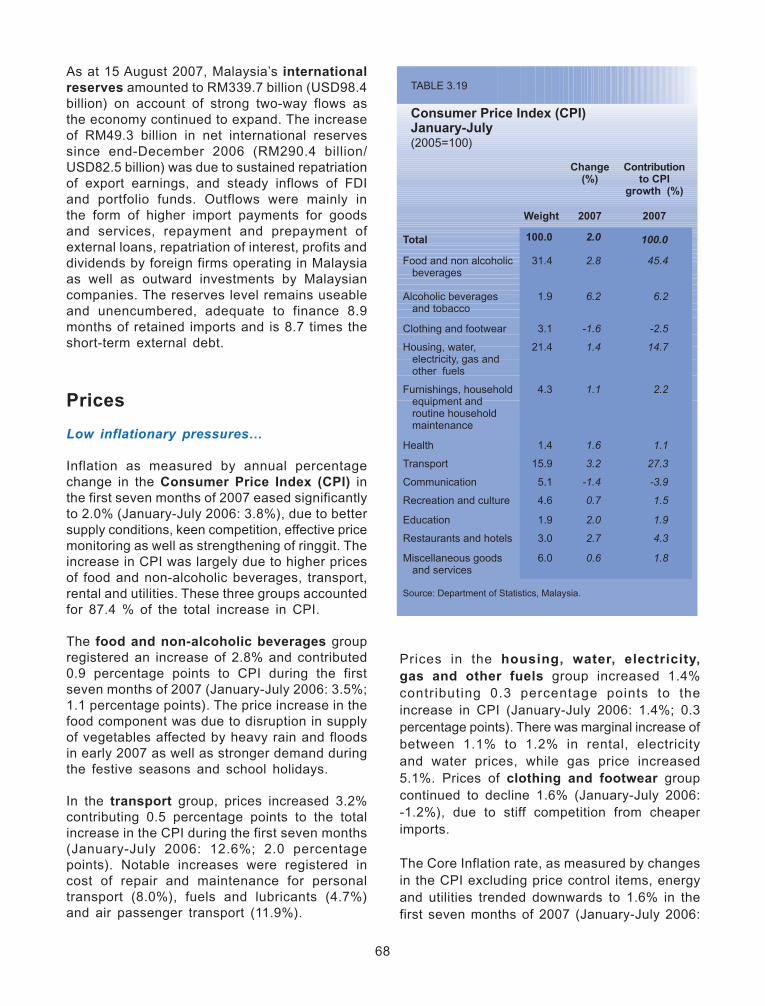
68
Prices in the housing, water, electricity, gas and other fuels group increased 1.4% contributing 0.3 percentage points to the increase in CPI (January-July 2006: 1.4%; 0.3 percentage points). There was marginal increase of between 1.1% to 1.2% in rental, electricity and water prices, while gas price increased 5.1%. Prices of clothing and footwear group continued to decline 1.6% (January-July 2006: -1.2%), due to stiff competition from cheaper imports.
The Core Inflation rate, as measured by changes in the CPI excluding price control items, energy and utilities trended downwards to 1.6% in the first seven months of 2007 (January-July 2006:
As at 15 August 2007, Malaysia’s international reserves amounted to RM339.7 billion (USD98.4 billion) on account of strong two-way flows as the economy continued to expand. The increase of RM49.3 billion in net international reserves since end-December 2006 (RM290.4 billion/USD82.5 billion) was due to sustained repatriation of export earnings, and steady inflows of FDI and portfolio funds. Outflows were mainly in the form of higher import payments for goods and services, repayment and prepayment of external loans, repatriation of interest, profits and dividends by foreign firms operating in Malaysia as well as outward investments by Malaysian companies. The reserves level remains useable and unencumbered, adequate to finance 8.9 months of retained imports and is 8.7 times the short-term external debt.
Prices
Low inflationary pressures…
Inflation as measured by annual percentage change in the Consumer Price Index (CPI) in the first seven months of 2007 eased significantly to 2.0% (January-July 2006: 3.8%), due to better supply conditions, keen competition, effective price monitoring as well as strengthening of ringgit. The increase in CPI was largely due to higher prices of food and non-alcoholic beverages, transport, rental and utilities. These three groups accounted for 87.4 % of the total increase in CPI. The food and non-alcoholic beverages group registered an increase of 2.8% and contributed 0.9 percentage points to CPI during the first seven months of 2007 (January-July 2006: 3.5%; 1.1 percentage points). The price increase in the food component was due to disruption in supply of vegetables affected by heavy rain and floods in early 2007 as well as stronger demand during the festive seasons and school holidays.
In the transport group, prices increased 3.2% contributing 0.5 percentage points to the total increase in the CPI during the first seven months (January-July 2006: 12.6%; 2.0 percentage points). Notable increases were registered in cost of repair and maintenance for personal transport (8.0%), fuels and lubricants (4.7%) and air passenger transport (11.9%).
TABLE 3.19
Consumer Price Index (CPI)January-July(2005=100)
Change(%)
Contribution to CPI
growth (%)
Weight 2007 2007
Total 100.0 2.0 100.0
Food and non alcoholic beverages
31.4 2.8 45.4
Alcoholic beverages and tobacco
1.9 6.2 6.2
Clothing and footwear 3.1 -1.6 -2.5
Housing, water, electricity, gas and other fuels
21.4 1.4 14.7
Furnishings, household equipment and routine household maintenance
4.3 1.1 2.2
Health 1.4 1.6 1.1
Transport 15.9 3.2 27.3
Communication 5.1 -1.4 -3.9
Recreation and culture 4.6 0.7 1.5
Education 1.9 2.0 1.9
Restaurants and hotels 3.0 2.7 4.3
Miscellaneous goods and services
6.0 0.6 1.8
Source: Department of Statistics, Malaysia.
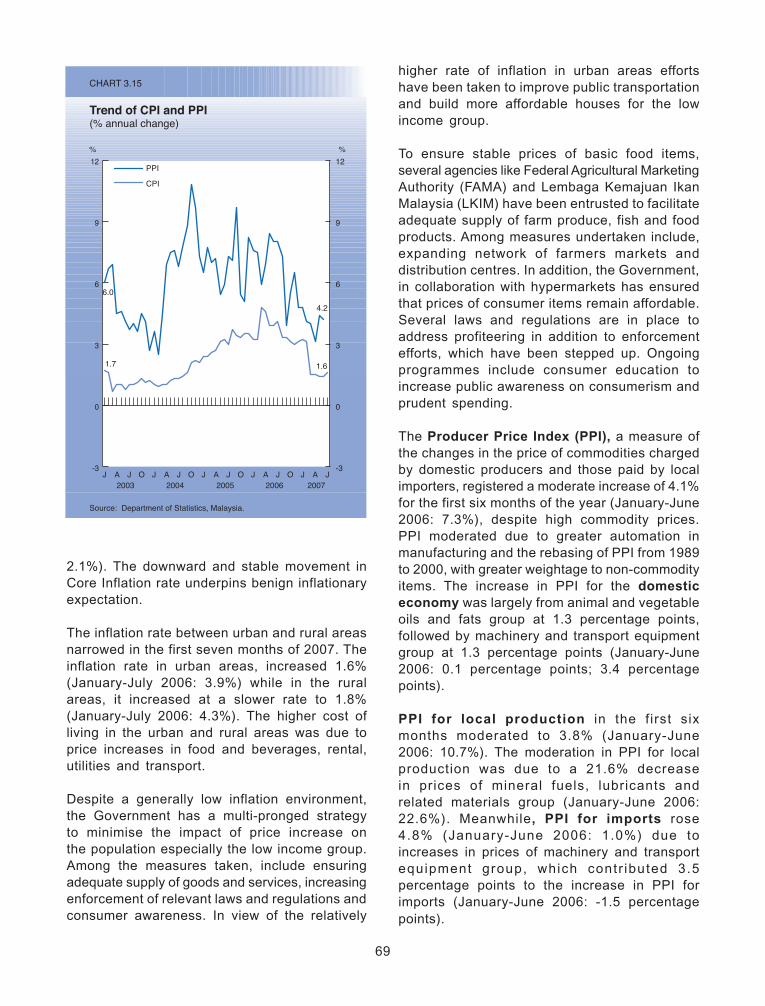
69
2.1%). The downward and stable movement in Core Inflation rate underpins benign inflationary expectation.
The inflation rate between urban and rural areas narrowed in the first seven months of 2007. The inflation rate in urban areas, increased 1.6% (January-July 2006: 3.9%) while in the rural areas, it increased at a slower rate to 1.8% (January-July 2006: 4.3%). The higher cost of living in the urban and rural areas was due to price increases in food and beverages, rental, utilities and transport.
Despite a generally low inflation environment, the Government has a multi-pronged strategy to minimise the impact of price increase on the population especially the low income group. Among the measures taken, include ensuring adequate supply of goods and services, increasing enforcement of relevant laws and regulations and consumer awareness. In view of the relatively
higher rate of inflation in urban areas efforts have been taken to improve public transportation and build more affordable houses for the low income group.
To ensure stable prices of basic food items, several agencies like Federal Agricultural Marketing Authority (FAMA) and Lembaga Kemajuan Ikan Malaysia (LKIM) have been entrusted to facilitate adequate supply of farm produce, fish and food products. Among measures undertaken include, expanding network of farmers markets and distribution centres. In addition, the Government, in collaboration with hypermarkets has ensured that prices of consumer items remain affordable. Several laws and regulations are in place to address profiteering in addition to enforcement efforts, which have been stepped up. Ongoing programmes include consumer education to increase public awareness on consumerism and prudent spending.
The Producer Price Index (PPI), a measure of the changes in the price of commodities charged by domestic producers and those paid by local importers, registered a moderate increase of 4.1% for the first six months of the year (January-June 2006: 7.3%), despite high commodity prices. PPI moderated due to greater automation in manufacturing and the rebasing of PPI from 1989 to 2000, with greater weightage to non-commodity items. The increase in PPI for the domestic economy was largely from animal and vegetable oils and fats group at 1.3 percentage points, followed by machinery and transport equipment group at 1.3 percentage points (January-June 2006: 0.1 percentage points; 3.4 percentage points).
PPI for local production in the first six months moderated to 3.8% (January-June 2006: 10.7%). The moderation in PPI for local production was due to a 21.6% decrease in prices of mineral fuels, lubricants and related materials group (January-June 2006: 22.6%). Meanwhile, PPI for imports rose 4.8% (January-June 2006: 1.0%) due to increases in prices of machinery and transport equipment group, which contr ibuted 3.5 percentage points to the increase in PPI for imports (January-June 2006: -1.5 percentage points).
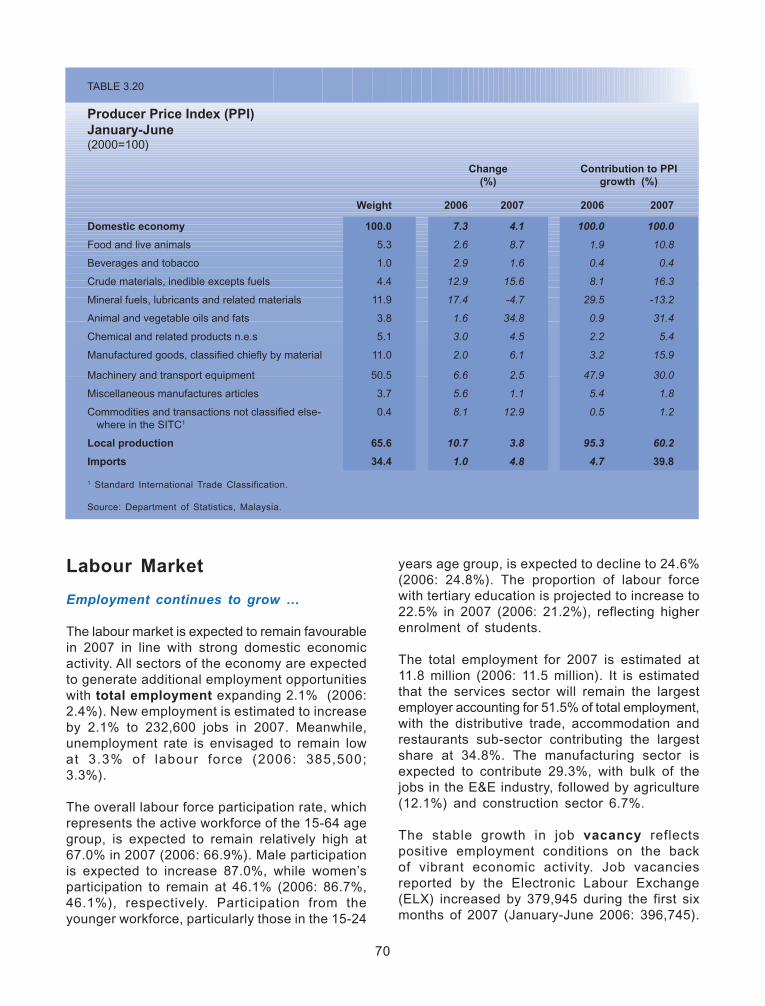
70
Labour Market
Employment continues to grow …
The labour market is expected to remain favourable in 2007 in line with strong domestic economic activity. All sectors of the economy are expected to generate additional employment opportunities with total employment expanding 2.1% (2006: 2.4%). New employment is estimated to increase by 2.1% to 232,600 jobs in 2007. Meanwhile, unemployment rate is envisaged to remain low at 3.3% of labour force (2006: 385,500; 3.3%).
The overall labour force participation rate, which represents the active workforce of the 15-64 age group, is expected to remain relatively high at 67.0% in 2007 (2006: 66.9%). Male participation is expected to increase 87.0%, while women’s participation to remain at 46.1% (2006: 86.7%, 46.1%), respectively. Participation from the younger workforce, particularly those in the 15-24
years age group, is expected to decline to 24.6% (2006: 24.8%). The proportion of labour force with tertiary education is projected to increase to 22.5% in 2007 (2006: 21.2%), reflecting higher enrolment of students.
The total employment for 2007 is estimated at 11.8 million (2006: 11.5 million). It is estimated that the services sector will remain the largest employer accounting for 51.5% of total employment, with the distributive trade, accommodation and restaurants sub-sector contributing the largest share at 34.8%. The manufacturing sector is expected to contribute 29.3%, with bulk of the jobs in the E&E industry, followed by agriculture (12.1%) and construction sector 6.7%.
The stable growth in job vacancy reflects positive employment conditions on the back of vibrant economic activity. Job vacancies reported by the Electronic Labour Exchange (ELX) increased by 379,945 during the first six months of 2007 (January-June 2006: 396,745).
TABLE 3.20
Producer Price Index (PPI)January-June (2000=100)
Change(%)
Contribution to PPI growth (%)
Weight 2006 2007 2006 2007
Domestic economy 100.0 7.3 4.1 100.0 100.0
Food and live animals 5.3 2.6 8.7 1.9 10.8
Beverages and tobacco 1.0 2.9 1.6 0.4 0.4
Crude materials, inedible excepts fuels 4.4 12.9 15.6 8.1 16.3
Mineral fuels, lubricants and related materials 11.9 17.4 -4.7 29.5 -13.2
Animal and vegetable oils and fats 3.8 1.6 34.8 0.9 31.4
Chemical and related products n.e.s 5.1 3.0 4.5 2.2 5.4
Manufacturedgoods,classifiedchieflybymaterial 11.0 2.0 6.1 3.2 15.9
Machinery and transport equipment 50.5 6.6 2.5 47.9 30.0
Miscellaneous manufactures articles 3.7 5.6 1.1 5.4 1.8
Commoditiesandtransactionsnotclassifiedelse-where in the SITC1
0.4 8.1 12.9 0.5 1.2
Local production 65.6 10.7 3.8 95.3 60.2
Imports 34.4 1.0 4.8 4.7 39.8
1 Standard International Trade Classification.
Source: Department of Statistics, Malaysia.
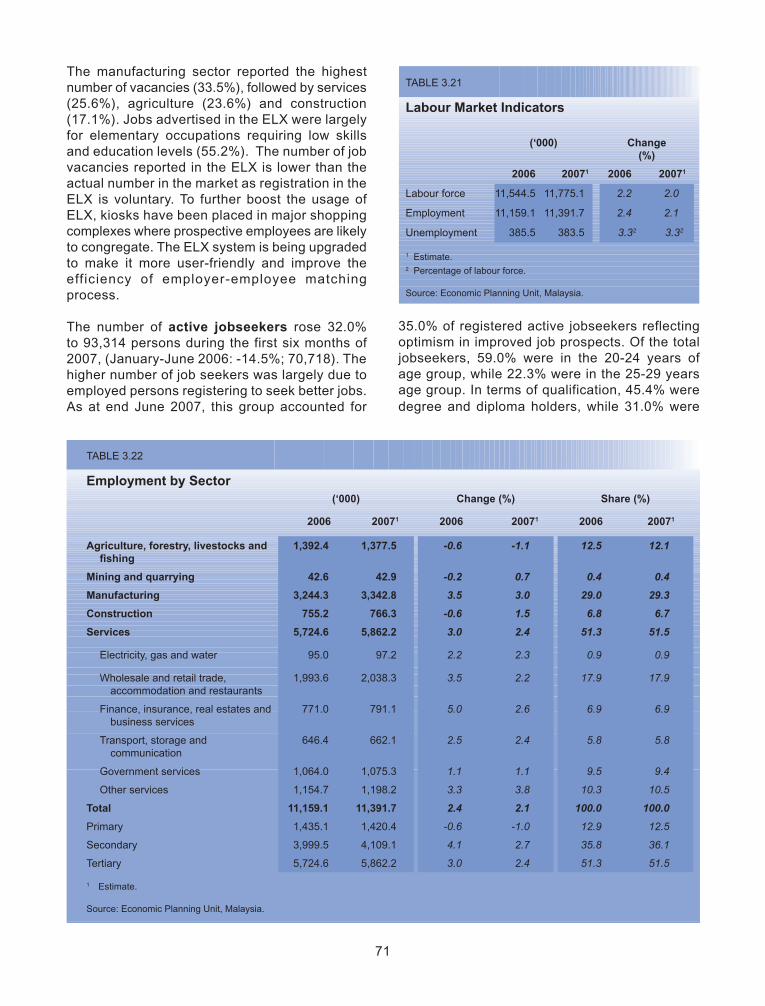
71
The manufacturing sector reported the highest number of vacancies (33.5%), followed by services (25.6%), agriculture (23.6%) and construction (17.1%). Jobs advertised in the ELX were largely for elementary occupations requiring low skills and education levels (55.2%). The number of job vacancies reported in the ELX is lower than the actual number in the market as registration in the ELX is voluntary. To further boost the usage of ELX, kiosks have been placed in major shopping complexes where prospective employees are likely to congregate. The ELX system is being upgraded to make it more user-friendly and improve the efficiency of employer-employee matching process.
The number of active jobseekers rose 32.0% to 93,314 persons during the first six months of 2007, (January-June 2006: -14.5%; 70,718). The higher number of job seekers was largely due to employed persons registering to seek better jobs. As at end June 2007, this group accounted for
35.0% of registered active jobseekers reflecting optimism in improved job prospects. Of the total jobseekers, 59.0% were in the 20-24 years of age group, while 22.3% were in the 25-29 years age group. In terms of qualification, 45.4% were degree and diploma holders, while 31.0% were
TABLE 3.21
Labour Market Indicators
(‘000) Change (%)
2006 20071 2006 20071
Labour force 11,544.5 11,775.1 2.2 2.0
Employment 11,159.1 11,391.7 2.4 2.1
Unemployment 385.5 383.5 3.32 3.32
1 Estimate.2 Percentage of labour force.
Source: Economic Planning Unit, Malaysia.
TABLE 3.22
Employment by Sector(‘000) Change (%) Share (%)
2006 20071 2006 20071 2006 20071
Agriculture, forestry, livestocks and fishing
1,392.4 1,377.5 -0.6 -1.1 12.5 12.1
Mining and quarrying 42.6 42.9 -0.2 0.7 0.4 0.4
Manufacturing 3,244.3 3,342.8 3.5 3.0 29.0 29.3
Construction 755.2 766.3 -0.6 1.5 6.8 6.7
Services 5,724.6 5,862.2 3.0 2.4 51.3 51.5
Electricity, gas and water 95.0 97.2 2.2 2.3 0.9 0.9
Wholesale and retail trade, accommodation and restaurants
1,993.6 2,038.3 3.5 2.2 17.9 17.9
Finance, insurance, real estates and business services
771.0 791.1 5.0 2.6 6.9 6.9
Transport, storage and communication
646.4 662.1 2.5 2.4 5.8 5.8
Government services 1,064.0 1,075.3 1.1 1.1 9.5 9.4
Other services 1,154.7 1,198.2 3.3 3.8 10.3 10.5
Total 11,159.1 11,391.7 2.4 2.1 100.0 100.0
Primary 1,435.1 1,420.4 -0.6 -1.0 12.9 12.5
Secondary 3,999.5 4,109.1 4.1 2.7 35.8 36.1
Tertiary 5,724.6 5,862.2 3.0 2.4 51.3 51.5
1 Estimate.
Source: Economic Planning Unit, Malaysia.

72
Sijil Pelajaran Malaysia (SPM) school leavers. Graduate jobseekers registered with the system were mainly from business administration, IT, arts, science and technical fields.
The number of retrenched workers declined by 18.2% to 8,382 (January-June 2006: 40.8%; 10,250). The affected workers were mainly plant and machine operators and assemblers, general workers as well as those in craft and related trade. The manufacturing sector registered the largest number of retrenchments (6,351: 76.9%), mainly in the manufacture of radio, television and communication equipment and apparatus sub-sectors (6,264: 98.6% of sector). Retrenchments in the services sector accounted for 19.8%, (January-June 2006: 3,731; 36.4%) in particular the sub-sectors of wholesale & retail trade, repair of motor vehicles, motorcycles and personal household goods as well as hotel and restaurants. Overall, the retrenchments were mainly due to firms rationalising their opera t ions to improve product iv i ty and profitability.
As at end May 2007, there were more than 1.91 million registered foreign workers (including expatriates) in Malaysia accounting for 16.8% of total employment. Foreign workers are mainly engaged in semi and low-skilled jobs in the manufacturing sector (34.7%), agriculture (25.5%) while 16.7% are domestic maids. Indonesians comprise 75.6% of total foreign labour, followed by Nepalese (14.5%) and Indians (9.1%). There are plans to reduce the number of foreign workers to about 1.5 million by 2010, in particular unskilled workers. To reduce reliance on foreign workers, employers are encouraged to move up the value chain by adopting new technology, introducing mechanisation and automation in the production process.
Meanwhile, as at end-July 2007, a total of 35,052 (2006: 26,697) expatriates were employed in the country as professionals, specialists and skilled workers mainly in the services (16,871) and manufacturing (12,284) sectors. Majority of the expatriates were from India (48.1%; 7,040), Japan (10.1%: 3,535) and China (9.8%; 3,444). The employment of expatriates is in line with Government’s efforts to promote high-end growth sectors, through enhancing capacity especially in technical and professional services.
Outlook for 2008
Malaysian Economy
Private sector led growth, reinforced by improved external environment…
Growth prospects for the global economy remain favourable in 2008. The world economy is projected to expand by 5.2% (2007: 5.2%) supported by broad-based and balanced expansion across the regions. Growth will be led by emerging market and developing countries, in particular, China, India and Russia. The upturn in the US economy and sustained growth in the Euro area will further reinforce the continued expansion in world growth. World trade is expected to grow at a faster pace of 7.4% (2007: 7.1%) underpinned by strong demand for commodities, continued expansion in trade in services and supported by sustained demand for electronics. Inflationary pressures are expected to be manageable, cushioned in part by higher productivity growth, softening US
73
dollar as well as proactive measures taken by major economies to contain inflation.
Despite the positive outlook, several downside risks remain, which could derail the growth momentum of the world economy. These include, among others, lower-than-expected growth of the US economy, prolonged subprime mortgage crisis, widening global imbalances, oil price shocks leading to higher world inflation, geopolitical tensions as well as pandemic diseases. Notwithstanding the external challenges, the Malaysian economy is expected to remain resilient on the back of a well-diversified and broad-based structure as well as strong macroeconomic fundamentals, which have strengthened over the years.
The Malaysian economy is anticipated to strengthen further to 6.0-6.5% in 2008 (2007: 6.0%) with positive contribution from all sectors of the economy. Domestic demand will be the main driver of the economy, while external demand is expected to pick up in tandem with improved prospects in world trade. Private investment and consumption spending are expected to remain robust, while public expenditure continues to expand. Inflation is anticipated to remain low despite strong expansion in the economy as output growth is still below potential level. Coupled with increased productivity, the economy would be able to absorb higher demand expenditure. In line with higher output and firm commodity prices, nominal GNP per capita is expected to rise 6.8% to RM23,864 in 2008 (2007: 7.2%; RM22,345). In terms of PPP, per capita income is expected to increase 6.9% to reach USD14,206 (2007: 13.9%; USD13,289), reflecting improved quality of life of the rakyat.
Sectoral Outlook
Robust services and vibrant construction activity…
All sectors of the economy are expected to register steady growth in 2008, led by services, reinforced by faster pace in construction activities as well as high global electronics demand. The services sector is forecast to sustain solid growth at 8.6% (2007: 9.0%) with favourable performance across all sub-sectors. Strong
domestic consumption spending as well as higher tourist arrivals and establishment of new retail outlets will contribute to sturdy growth in the wholesale and retail trade as well as the accommodation and restaurants sub-sectors. In addition, real estate and business services as well as finance and insurance sub-sectors are expected to benefit mainly from increased property transactions and continued expansion in the demand for IT-related and financial services. Growth in the transport and storage as well as communication sub-sectors are expected to be sustained, following upgrading of port facilities, higher investment in the air and land transportation segments as well as enhancement in the telecommunications network.
Value added in the manufacturing sector is projected to grow by 3.8% (2007: 3.1%) in line with expansion in global trade. Global demand for manufactured goods, particularly E&E products, is expected to rise sharply, underpinned by sustained world growth and strengthening US economy. This will benefit Malaysia’s export-oriented industries. Output of resource-based products is expected to expand due to strong demand for refined petroleum products, plastics and chemicals including biofuels, rubber gloves as well as wooden furniture and fixtures. Growth in non-metallic minerals and metal industries will be further supported by increased activity in the domestic economy, in particular construction.
Growth in the agriculture sector is envisaged at 3.5% (2007: 3.1%) on the back of rising output in food commodities and higher production of oil palm and rubber. Output of palm oil is expected to increase by 2.0% following improved yields and expansion in matured areas. In addition, measures taken to achieve vision 35:25, a target of 35 tonnes per hectare of FFB and 25.0% OER through the wide use of high quality seedlings and latest technology as well as knowledge-based production systems will result in higher output of palm oil. Production of rubber is also expected to expand, supported by firm rubber prices, which are likely to encourage smallholders to increase tapping activity. Utilisation of better clones and low intensity tapping system as well as the use of stimulants is also envisaged to contribute to higher output of rubber. Rapid developments in the agro-food industry and promotion of other sources of growth in agriculture, including aquaculture, horticulture, seaweed, deep-sea

74
fishing as well as kenaf planting will further boost output of the sector. Output of livestock industry is also envisaged to increase, contributed by the integrated farming projects involving rearing of cattle and goats in oil palm and rubber plantations. Output of poultry and eggs are also expected to increase with modern rearing systems to meet local and external demand. In addition, agriculture related projects under the NCER are expected to contribute positively to the overall growth of the agriculture sector in 2008.
Higher production of crude oil and natural gas is expected to support growth in the mining sector by 4.0% (2007: 3.3%). Production of crude oil is expected to increase following the completion of major maintenance and rejuvenation of several oil wells over the past few years. Production is envisaged to enhance further with expanded capacity from the oil fields in Kikeh. Similarly, production of LNG is expected to increase on account of upgrading and expansion of facilities in MLNG DUA plant in Bintulu, Sarawak. Output from quarrying is expected to pick up to meet demand for higher production of cement and other non-metallic mineral products, consistent with vibrant activity in the construction sector.
The construction sector is poised to strengthen further with a growth of 6.3% (2007: 5.2%) on the back of ongoing infrastructure projects and newly launched infrastructure projects under 9MP, in particular the development of growth corridors. Growth is also expected to emanate from the implementation of major transport-related projects, such as the Second Penang Bridge, Penang Monorail, Ipoh-Padang Besar Double Tracking Rail project and extension of Ampang and Kelana Jaya Light Rail Transit lines. Efforts to develop Southern Johor as one of the world’s largest integrated petroleum logistics hub and the ongoing NCER will further add impetus to the growth of this sector. In addition, the non-residential sub-sector is envisaged to pick up strongly supported by rising demand for office space in tandem with increasing business activity, especially in major urban and industrial areas. The residential sub-sector is also expected to strengthen on account of bullish consumer
sentiment and increasing foreign demand due to various liberalisation measures and incentives introduced in the property market.
Domestic Demand
Strong domestic demand driven by private sector…
The growth momentum in 2008 is expected to strengthen, driven by positive developments that supported domestic economic activity in 2007. Aggregate domestic demand expenditure (excluding change in stocks) is expected to expand 6.8% (2007: 9.0%), strengthened by private sector expenditure, which is envisaged to grow by 8.2% (2007: 8.6%). The role of private sector as the key engine of growth is reflected by its high contribution of 5.1 percentage points to GDP growth (2007: 5.2 percentage points). Meanwhile, contribution to GDP growth by the public sector is expected to moderate to 0.8 percentage points in 2008 (2007: 2.4 percentage points) following slower growth in public expenditure by 3.2% (2007: 10.1%).
In tandem with favourable business sentiment and better external environment in 2008, private investment is forecast to increase markedly by 9.5%, accounting for 11.9% of GDP (2007: 7.1%; 11.6%). Investment activity is expected to strengthen following various measures taken by the Government to improve the business climate, including further reduction of another one percentage point in corporate tax to 26.0% in 2008. Measures to strengthen intellectual property rights including the setting up of additional special courts are expected to boost investor confidence and generate more R&D activities. In addition, greater participation of the private sector in the implementation of IDR, NCER and other economic corridors is expected to accelerate investment activities. The implementation of the trans peninsular-oil pipeline across the northern region, integrated petroleum terminal in Tanjung Bin, Johor as well as greater upstream activity is expected to increase investment outlay in the oil and gas industry. In addition, MNCs are expected to increase capacity utilisation in anticipation of higher external demand, particularly in the E&E

75
sector. With significant number of DDI approvals coming onstream in various sectors, greater SME involvement in domestic economic activity is envisaged to further enhance capital outlay. Consequently, investment activity is expected to further strengthen in 2008 and add to the productive capacity of the economy, thereby increasing Malaysia’s potential output in the medium and long term.
Private consumption is expected to increase 7.9% (2007: 9.0%) on account of higher disposable income arising from firm commodity prices and sustained domestic economic activity as well as stable employment conditions. Pay hike for civil servants effective July 2007 leading to increase in permanent income is expected to further enhance propensity to consume. Positive wealth effects from the equity and property markets will also enhance the propensity to consume. As a result, share of private consumption to GDP will increase to 50.8% in 2008 (2007: 49.9%).
Public consumption is projected to increase 5.5% in 2008 (2007: 10.8%), following higher expenditure for emolument in tandem with increased productivity in the public service. Share of public consumption to GDP is expected to be sustained at 13.4% in 2008 (2007: 13.5%). Similarly, public investment growth is expected to be 0.5%, with a share 10.8% to GDP (2007: 9.3%; 11.5%), supported by development allocation of Federal Government expenditure as well as higher capital outlay by Non-Financial Public Enterprise.
National Resource Position
Lower savings-investment surplus…
In line with expansion in domestic economic activity and favourable export earnings, national income in current prices is projected to expand by 9.0% in 2008 (2007: 9.4%). Although total consumption is expected to remain high at 10.7% (2007: 12.7%), growth in GNS is projected to increase by 6.6% to RM237 billion. Total investment expenditure (including change in
stocks) is projected to continue to post double-digit growth of 12.1% to RM148.3 billion (2007: 11.6%; RM132.3 billion) and account for 22.4% of GNP (2007: 21.8%), driven mainly by private sector investment activity. Accordingly, the savings-investment gap in 2008 is expected to be lower at RM88.7 billion or 13.4% of GNP (2007: RM90 billion; 14.8%).
External Sector
Lower current account surplus to meet increased economic activity…
Malaysia’s external position is expected to remain strong in tandem with improved prospects for global growth and world trade. The goods account of the BOP is expected to record a surplus of RM130,755 million (2007: RM128,791 million) even as import growth accelerates and continues to outpace exports. This is on account of increased domestic economic activity and to meet rising demand for manufactured goods. Firm commodity prices and higher demand for E&E products are anticipated to boost growth in exports (f.o.b) by 6.8% to RM661,209 million (2007: 5.0%; RM619,164 million) while imports (f.o.b) are projected to post a stronger growth of 8.2% to RM530,454 million (2007: 7.7%; RM490,373 million). Manufactured goods are expected to account for 80.1% of total exports while 83.6% of imports will comprise capital and intermediate goods (2007: 79.3%; 83.2%).
Despite higher tourist arrivals and capacity expansion in the air travel segment, the services account is forecast to register a higher deficit of RM4,646 million (2007: -RM3,985 million) following higher payments for transportation and other services, including professional, technical and business services. The extension of VMY into 2008, coupled with additional promotional activities to promote various individual states and niche tourism products is anticipated to boost gross tourist receipts to RM49,000 million (2007: RM44,500 million). This will result in a higher net surplus in the travel account of RM28,604 million (2007: RM27,280 million). In contrast, a higher net outflow of RM19,974 million (2007: -RM17,840

76
million) is envisaged in the income account, as MNCs continue to repatriate interest, profits and dividends from higher export earnings and improved corporate balance sheets. Meanwhile, outflows in the transfers account, constituting mainly remittances by foreign workers, is expected to increase marginally to RM17,421 million (2007: -RM17,002 million) on account of rising disposable income following continued expansion of the
domestic economy. Although the surplus in the goods account will be more than sufficient to cushion higher net outflows in the services, income and transfers accounts, the current account of the balance of payments is expected to post a lower surplus of RM88,714 million or 13.4% of GNP (2007: RM89,964 million; 14.8%) consistent with strong consumption and investment activity.