economic evaluation of non-tariff trade barriers: sanitary
TRANSCRIPT
Journal of Economic Integration20(1), March 2005; 158-184
Economic Evaluation of Non-Tariff Trade Barriers: Sanitary Regulations and the Broiler Market in the
Western Hemisphere
D. L. Salin, W. F. Hahn, A. SomwaruU.S. Department of Agriculture(USDA)-Economic Research Service(ERS)
Abstract
Exporting countries are concerned that sanitary standards might shield
domestic industry from foreign competition. This study analyzes economic effects
of changes in Western Hemisphere sanitary requirements on broiler trade in the
Americas. A mathematical programming model detects that if Brazil and Mexico
are allowed to export fresh, chilled, and frozen poultry meat to the United States
and Canada then the United States becomes an importer of value added broiler
products and looses market share to Brazil in world broiler market. Due to
geographic location, Mexico expands exports to the United States.
• JEL Classification: C61, D21, F12, F02, Q18
• Key words: Mathematical programming, Firm behavior, Imperfect sub-stitution, Endogenous value-added, Differentiated products, UnitedStates, Canada, Mexico, Brazil, Sanitary and phytosanitarystandards (SPS), World Trade Organization (WTO), Broilertrade, Nontariff trade barriers (NTBs)
I. Introduction
The Doha Round provides an opportunity to fundamentally reform the threepillars of agricultural market protection. The agreement calls for (1) an increase inmarket access, (2) the reduction or elimination of export subsidies, and (3) the
*Corresponding address: Delmy L. Salin, 1400 Independence Ave., SW, Rm. 1203 Washington, DC20250 Phone: (202) 690-4440 Fax: (202) 690-3616 Email: [email protected]
2005-Center for International Economics, Sejong Institution, All Rights Reserved.
Economic Evaluation of Non-Tariff Trade Barriers:~ 159
reduction of domestic support. In many cases, market access for imported foodsare blocked by sanitary and phytosanitary standards (SPS). SPS are meant toprotect human, animal, and plant health. While negotiators recognized theimportance of protecting human, animal, and plant health, they were concernedthat in some cases SPS were being used to shield domestic industry from foreigncompetition. To prevent abuses of SPS, a number of reforms addressing them wereincluded in the Doha Round Agreement.
In January 1995, the World Trade Organization (WTO) implemented theapplication of the SPS Agreement with the purpose of minimizing the negativeeffects of unjustified health barriers on international trade. Under this agreement,codes were established to prevent the introduction of infectious agents and diseasesinto importing countries through trade of animals or animal products (OIE 2003).Although the SPS Agreement requires transparency and science-based regulations,it does not require the adoption of international standards (harmonization). Inaddition, nations have accepted the concept of “regionalization”, therebyrecognizing disease-free regions or zones within a country. This would allowexports from distinct regions within a country that present evidence of the absenceor low incidence of pests and diseases (Roberts 1998a, Roberts 1998b, Salin et al.2002, Kassum and Morgan 2002). Nonetheless, there is limited published researchin the area of the economic impact of SPS, especially on the poultry industry.
The United States and Canada protect their poultry industries from ExoticNewcastle Disease (END). END is endemic throughout the rest of the WesternHemisphere. Both Mexico and Brazil have eradicated END from some of theirStates, opening the possibility that they can ship fresh or frozen poultry to theUnited States and Canada. This paper is the first to analyze in a unique approachthe economic impact of these changes in North America sanitary requirements onWestern Hemisphere broiler production and trade flows. The United States andBrazil are the worlds two most important poultry exporters. Changes in productionand trade in the Western Hemisphere will have global implications.
The economic model developed for this paper is a mathematical-programmingmodel designed specifically to measure the changes and distribution of theeconomic welfare arising from reform of SPS and other policies on WesternHemisphere broiler (chicken meat) markets. This analysis focuses on SPS reformand does not address the impacts of other policies. This model uses a newapproach to model product differentiation. Products are differentiated by differentlevels of value-added service, and the level of value-added embedded in goods is
160 D. L. Salin, W. F. Hahn, A. Somwaru
endogenous. The model focuses on the four major players in the WesternHemisphere broiler market: Canada, the United States, Mexico, and Brazil. Otherregions in the Western Hemisphere and the rest of the world are modeled with lessdetail.
II. Overview of the World Broiler Market
Before discussing policy and modeling issues, it is useful to place the WesternHemisphere poultry market in its global perspective. Poultry production andconsumption have grown rapidly worldwide. Reasons for this expansion includeshort production cycle, cooking versatility, low fat content, and relatively lowprices compared with beef and pork. Broiler markets are highly concentrated inproduction and international broiler trade is dominated by a few countries(Rogowsky, 1998). In 2002, world broiler production totaled about 54 million tons,in ready to cook (RTC) equivalent form. The United States is the worlds largestproducer followed by China, Brazil, European Union (EU), and Mexico. Thesefive countries account for more than 70 percent of the world’s production (FAS,2003a). Broiler production has become highly concentrated, especially in theUnited States, Brazil, Mexico, and Thailand, where a few large firms account formost of the production (Orden et al., 2002, UNA, 2002). The United States is theworld’s top broiler consuming country, accounting for about one-quarter of globalconsumption, followed by China, EU, and Brazil. These four countries account for65 percent of the worlds broiler consumption. The United States and Brazildominate international broiler trade globally. These two countries account for morethan two-thirds of the world’s broiler exports (FAS, 2003a). Russia, Japan, andChina are the worlds largest importers accounting for more than half of worldsbroiler imports, followed by the EU, Saudi Arabia, Mexico, and Hong Kong.These seven countries account for 85 percent of total world broiler imports (FAS,2003a).
In the North American region, broiler production totaled 17.6 million tons in2002. This represents 32 percent of total world broiler production. This regionconsumed 15.7 million tons of broilers in 2002, comprising 30 percent of totalworld broiler consumption (FAS, 2003a). The United States is the largest broilerproducer and consumer worldwide. In addition, it is the only net broiler exportingcountry in the region, accounting for 38 percent of total world exports. Mexico isthe fifth largest world broiler producer and consumer country. Mexico and Canada
Economic Evaluation of Non-Tariff Trade Barriers:~ 161
are among the top 10 broiler importing countries, accounting for about 8 percent ofthe worlds broiler imports.
III. Policy Environment in Western Hemisphere Broiler Trade
While SPS have important effects on poultry trade in the Western Hemisphere,these are not the only policies that have a significant impact on broiler productionand trade. In addition to the SPS, which are discussed later, the following policiesare included in the model:
Of the four countries modeled in detail, only Canada has a major domesticprogram to support its poultry industry. Canadian poultry supply controls place anupper limit on poultry production in Canada. To further protect its industry, Canadaestablished import quotas. Prior to NAFTA it was common for the Canadiangovernment to offer “supplementary” quotas allowing additional imports to enter.Under its NAFTA obligations, Canada expanded and reformed its poultry importquota regime. After signing the Doha-Round Agreement, Canada replaced itsquota with a tariff-rate-quota (TRQ). The current, over-quota-rate on poultry hasbeen set high enough to eliminate imports over the quota.
Prior to NAFTA, Mexico protected its poultry industry from U.S. competitionwith a number of different (and frequently changing) policies. As part of itsNAFTA obligations, Mexico replaced these policies with a TRQ, with anexpanding quota and contracting over-quota rate. During the period between thesigning of NAFTA and 2002, the Government of Mexico often allowed poultryimports to exceed the quota without imposing the over-quota tariff. By 2002,poultry trade with the United States was supposed to be liberalized. Starting in2003, the Government announced a provisional safeguard TRQ on imports of U.S.leg quarters which is (a) legal under NAFTA and (b) meant to stay in place until2008. The 2004 duty-free quota is 101,000 metric tons (MT) with an over-quotarate of 79%. The quota grows to 104,600 MT in 2008 with the over-quota ratedropping to 19.8%.
Direct domestic support to the poultry industry is low in both Brazil and theUnited States. Poultry tariffs are low in the United States, ranging from 4.4 to 23.3cents per kilogram depending on the product. Poultry imports from its NAFTApartners could enter tariff-free; however, U.S. poultry imports are negligible. SPSare the important factor limiting poultry imports to the United States.
END and highly pathogenic avian influenza (HPAI), included in List A of the
162 D. L. Salin, W. F. Hahn, A. Somwaru
International Organization for Epizootics (OIE) classification of transmissiblepoultry diseases, are two highly infections diseases that restrict poultry trade (Table1). Countries in which END exists can export only processed poultry meat but notfresh, chilled, or frozen poultry to the United States. (Salin et al. 2002, FSIS 2003).Currently, the U.S. Animal and Plant Health Inspection Service (APHIS) considersEND to exist in all but 16 regions of the world (table 2). In addition, APHISrecognizes two Mexican states, Sinaloa and Sonora, as having a low risk of ENDtransmission.
The United States has not been fully successful in preventing END and avianinfluenza from entering the country. However, it has been able to contain thoseoutbreaks that it experienced. Avian influenza is a common problem; the last U.S.
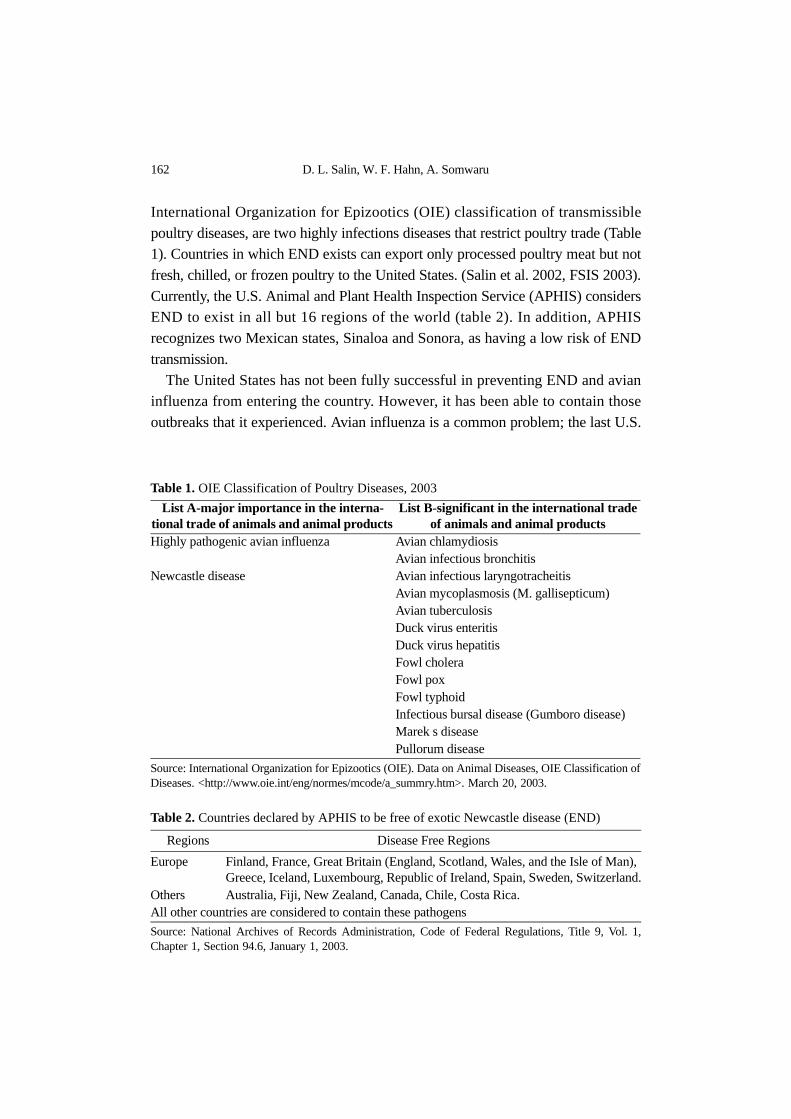
Table 1. OIE Classification of Poultry Diseases, 2003
List A-major importance in the interna-tional trade of animals and animal products
List B-significant in the international trade of animals and animal products
Highly pathogenic avian influenza Avian chlamydiosisAvian infectious bronchitis
Newcastle disease Avian infectious laryngotracheitisAvian mycoplasmosis (M. gallisepticum)Avian tuberculosisDuck virus enteritisDuck virus hepatitisFowl choleraFowl poxFowl typhoid Infectious bursal disease (Gumboro disease) Marek s diseasePullorum disease
Source: International Organization for Epizootics (OIE). Data on Animal Diseases, OIE Classification ofDiseases. <http://www.oie.int/eng/normes/mcode/a_summry.htm>. March 20, 2003.
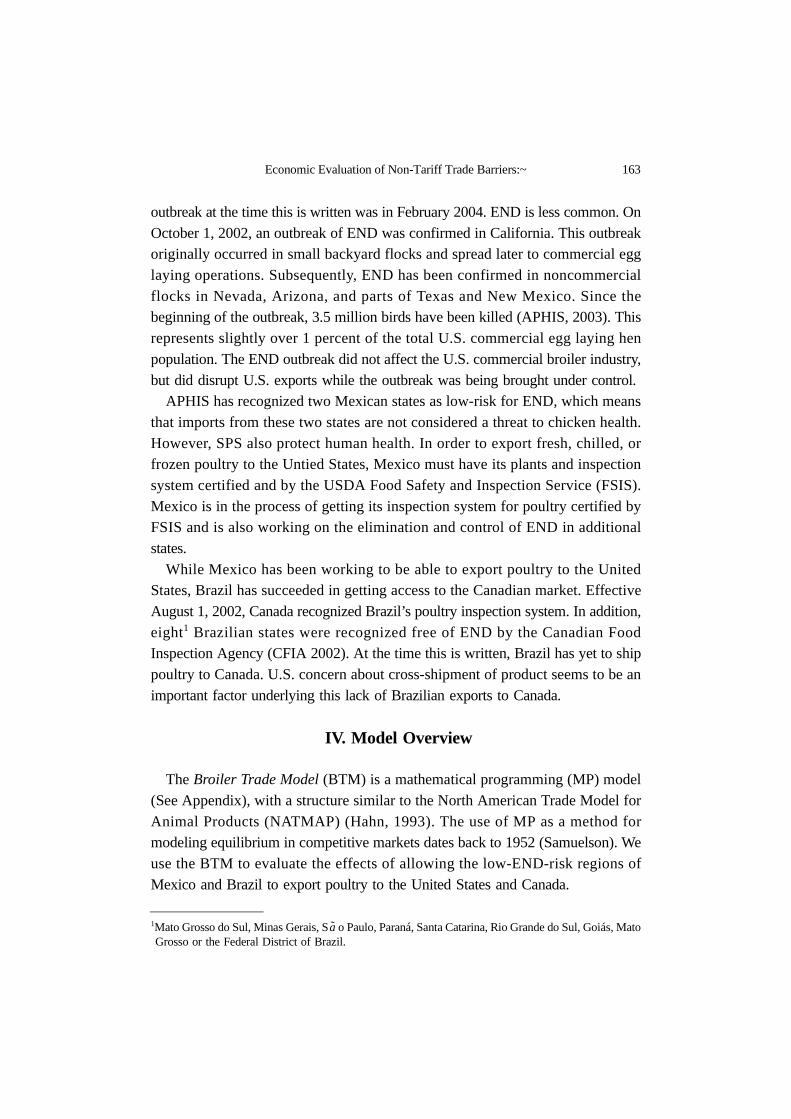
Table 2. Countries declared by APHIS to be free of exotic Newcastle disease (END)
Regions Disease Free Regions
Europe Finland, France, Great Britain (England, Scotland, Wales, and the Isle of Man), Greece, Iceland, Luxembourg, Republic of Ireland, Spain, Sweden, Switzerland.
Others Australia, Fiji, New Zealand, Canada, Chile, Costa Rica.All other countries are considered to contain these pathogens
Source: National Archives of Records Administration, Code of Federal Regulations, Title 9, Vol. 1,Chapter 1, Section 94.6, January 1, 2003.
Economic Evaluation of Non-Tariff Trade Barriers:~ 163
outbreak at the time this is written was in February 2004. END is less common. OnOctober 1, 2002, an outbreak of END was confirmed in California. This outbreakoriginally occurred in small backyard flocks and spread later to commercial egglaying operations. Subsequently, END has been confirmed in noncommercialflocks in Nevada, Arizona, and parts of Texas and New Mexico. Since thebeginning of the outbreak, 3.5 million birds have been killed (APHIS, 2003). Thisrepresents slightly over 1 percent of the total U.S. commercial egg laying henpopulation. The END outbreak did not affect the U.S. commercial broiler industry,but did disrupt U.S. exports while the outbreak was being brought under control.
APHIS has recognized two Mexican states as low-risk for END, which meansthat imports from these two states are not considered a threat to chicken health.However, SPS also protect human health. In order to export fresh, chilled, orfrozen poultry to the Untied States, Mexico must have its plants and inspectionsystem certified and by the USDA Food Safety and Inspection Service (FSIS).Mexico is in the process of getting its inspection system for poultry certified byFSIS and is also working on the elimination and control of END in additionalstates.
While Mexico has been working to be able to export poultry to the UnitedStates, Brazil has succeeded in getting access to the Canadian market. EffectiveAugust 1, 2002, Canada recognized Brazil’s poultry inspection system. In addition,eight1 Brazilian states were recognized free of END by the Canadian FoodInspection Agency (CFIA 2002). At the time this is written, Brazil has yet to shippoultry to Canada. U.S. concern about cross-shipment of product seems to be animportant factor underlying this lack of Brazilian exports to Canada.
IV. Model Overview
The Broiler Trade Model (BTM) is a mathematical programming (MP) model(See Appendix), with a structure similar to the North American Trade Model forAnimal Products (NATMAP) (Hahn, 1993). The use of MP as a method formodeling equilibrium in competitive markets dates back to 1952 (Samuelson). Weuse the BTM to evaluate the effects of allowing the low-END-risk regions ofMexico and Brazil to export poultry to the United States and Canada.
1Mato Grosso do Sul, Minas Gerais, S o Paulo, Paraná, Santa Catarina, Rio Grande do Sul, Goiás, MatoGrosso or the Federal District of Brazil.
a
164 D. L. Salin, W. F. Hahn, A. Somwaru
The BTM divides the world into eight regions; however only four of these aremodeled in detail. The four regions with the detailed specification are Canada, theUnited States, Mexico, and Brazil. These countries will be referred to as the majorplayers. The BTM has a full set of supply and demand relationships for the majorplayers. The four other regions are represented as excess-demand regions. Theseareas are net importers of chicken from the United States and Brazil. The excessdemand regions are the Caribbean, Central America, the rest of South America,and the Eastern Hemisphere. The model starts with a baseline set of prices,quantities, and policies and assumes that the current production and trade pattern isoptimal. Changes in policies may lead to changes in the optimal pattern ofproduction and trade.
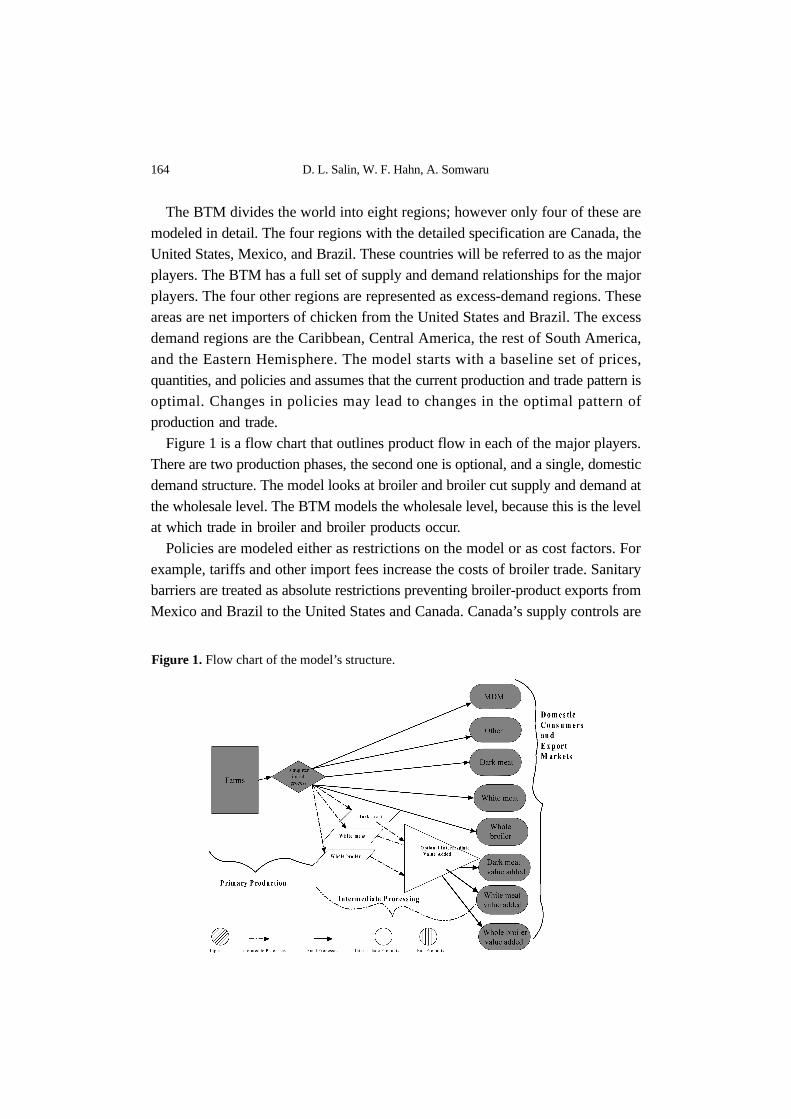
Figure 1 is a flow chart that outlines product flow in each of the major players.There are two production phases, the second one is optional, and a single, domesticdemand structure. The model looks at broiler and broiler cut supply and demand atthe wholesale level. The BTM models the wholesale level, because this is the levelat which trade in broiler and broiler products occur.
Policies are modeled either as restrictions on the model or as cost factors. Forexample, tariffs and other import fees increase the costs of broiler trade. Sanitarybarriers are treated as absolute restrictions preventing broiler-product exports fromMexico and Brazil to the United States and Canada. Canada’s supply controls are
Figure 1. Flow chart of the model’s structure.
Economic Evaluation of Non-Tariff Trade Barriers:~ 165
modeled as an upper bound on total production. Because Canada’s over-quota tariffrates on all broiler products and Mexico’s on dark meat are high, these quotas aretreated as if they were absolute limits on imports. If the over-quota rates were lowenough to allow trade, they could be modeled as an additional cost of importingproduct in excess of the quota. U.S. tariffs on (potential) Brazilian imports aretreated as a cost of shipping product.
Although it is a wholesale-market model, the demand structure is a consumer-level demand specification. Wohlgenant and Haidacher show that when marketsare competitive, derived demands have the same properties as consumer demandsprovided one adds in the demand for marketing inputs (Wohlgenant and Haidacher,1989). We maintain the typical, partial equilibrium assumption that changes inbroiler prices do not cause changes in other product prices. If the prices of all othergoods are fixed, including broiler marketing inputs, then we can aggregate theirexpenditures into a single good, using Hicksian aggregation as suggested byLewbel (Lewbel, 1996). The consuming sector buys chicken products and theaggregate “other” good.
The primary production phase is a combination of the farm, slaughter, andpreliminary processing phase of production. This structure is consistent with thebusiness organization of broiler production in the major players. Most of the broilerproduction in the Western Hemisphere is integrated. While farms are usuallyseparate enterprises, it is common for bird producers to contract with slaughter/processing companies, the integrators. The primary production phase produces twotypes of chickens that are turned into five types of poultry products. The two typesof chickens are (1) those that end up being sold as whole chickens and (2) thosethat are processed into parts. When chickens are processed for parts, they producefour kinds of chicken parts in fixed proportions. Parts chickens’ outputs areapproximately 32% white meat, 44% dark meat (leg and thigh or leg quarters), 22%other meat (wings, backs, necks) and 2% mechanically deboned meat (MDM).
Whole chickens and parts chickens are modeled as joint products. The types ofchickens that farmers produce for their integrators vary by the chicken’s end use.An alternative modeling structure could start with a generic chicken that is eithersold “whole” or processed into parts. This alternative does not fit reality. A furtherproblem is that (at least in the United States) it is common for the sum of the valueof chicken parts prices to be lower than the value of a whole chicken. This impliesnegative value-added, a sub-optimal solution. What is actually happening is thatU.S. integrators use a cheaper chicken to produce parts. Modeling whole and parts
166 D. L. Salin, W. F. Hahn, A. Somwaru
chickens as distinct but joint products better captures the working of the marketand allows the observed baseline to be optimal.
The usual economic model of trade is based on the concept of comparative advantage,a theory based entirely on costs of supplying products. Once one introduces jointproduction, consumer tastes begin to have an important effect on trade flows. Costfactors alone cannot explain how chicken parts should be priced. In competitiveequilibrium, the total value of the parts has to equal the marginal cost of producingthe birds. Given our assumption of fixed-proportions parts production, demanddetermines relative prices for chicken parts. U.S. as well as Canadian consumershave a strong preference for white meat and are willing to pay a high price for it.High white-meat prices cause low dark-meat prices. Low U.S. dark-meat prices arethe most important factor driving U.S. broiler-meat exports.
Each of the five basic chicken products can be sold to the domestic market orexported. Three of the five, whole chickens, white meat, and dark meat, can befurther processed to make value-added products. This is the second stage of theproduction process. Some of the firms involved in primary production of chickenproducts also produce these value-added products. We have excluded “other” chickenfrom the value-adding process, as this low-valued item is not traded. MDM is animportant export item for the United States. However, it is used as an input in otherproducts, and there is no identifiable demand for value-added MDM.
Value-added white and dark meat includes categories of products such asboneless, skinless, and processed products for restaurant use/trade. We includedwhole broilers in the value-added category to account for the importance ofrotisserie broilers in Mexico. Differences in processing or other services applied tovalue-added products are a market-determined source of imperfect substitutability.One of the innovative features of our model is that it incorporates this source ofimperfect substitutability. We have developed a means of incorporating endogenouslevels of value-added in domestic and international trade. Our theory of endogenous,product differentiation is outlined below.
A. Product Differentiation, Value-added, and Trade
It is common for countries to engage in significant bilateral trade that involvestrade in the “same” commodity. By “same” we mean having the same tariff code orinternational commodity code. Economic modeling of “same” commodities bilateraltrade is problematic. One way to deal with bilateral trade is through more detailedspecification of the products traded. This is one reason why we include so much
Economic Evaluation of Non-Tariff Trade Barriers:~ 167
chicken-product detail in our model. The price of dark meat and MDM relative towhite meat is one of the reasons that the United States is a major poultry exporter.Brazil is much more competitive in the whole-bird market. Differences inconsumer tastes and prices for broiler cuts determine a large part of the trade. Byaccounting for consumer taste, we can differentiate a countrys imports and exports.
Another method that economists have adopted to deal with bilateral trade is toassume that the products with the same name are actually “differentiated”, henceimperfect substitutes. One example of the differentiated product approach is theArmington specification (Alston et al. 1990). The Armington approach is based onthe hypothesis that one country’s products are imperfect substitutes for another’s.Another approach to dealing with bilateral trade in an undifferentiated commodityinvolves introducing regions within nations and internal/external transportationcosts.
One of the problems in using the Armington approach in this context is that SPShave prevented Mexico and Brazil from shipping chicken products to the UnitedStates or Canada. In most applications, the Armington approach is implemented byusing some elasticity of substitution for domestic and imported products. With noobserved trade, we have no idea about how these imports substitute for domesticproduct. The maximum impact of policy reform is likely to occur when domesticand imports are perfect substitutes. We have assumed that the “generic” poultryproducts are perfect substitutes.
One of the apparent advantages of Mexico and Brazil as exporters is their lowlabor costs relative to the United States and Canada. These low labor costs suggestthat they would be strongest in those market niches demanding value-addedproducts. Value-added products are obviously differentiated. To deal with thispossibility, we developed a model of endogenous value added.
Unlike the arbitrary and unrealistic assumption of the Armington approach, thispaper uses natural sources of product differentiation and substitutability. That isdifferences in value-added to a “generic” commodity. In our discussion of endogenousvalue added, we are going to focus on a single-good, single country case.Extension to our multiple country, multiple product case is trivial.
We consider a value-added product a combination of ingredients and services.By ingredients, we mean the physical product. In this case, ingredients are wholechickens and chicken cuts. Services are largely confined to processing. Examplesof services in this case include boning and skinning, packaging, and further pro-cessing. Portion control, the production of standard-sized portions for the restaurant
168 D. L. Salin, W. F. Hahn, A. Somwaru
use/trade, is another example of services applied to an ingredient. Adding value to basic ingredients via the use of service allows a country to
export both products and services. The “compounded” exported good can then beclassified based on its main ingredient. That is, a country with low ingredient costsand high costs of services could have bilateral trade with a country with highingredient costs and low value-added costs. In this case, a low-ingredient, highservice product is an imperfect substitute of a high-ingredient, low service product.
BTM uses simple types of value-added products. Our discussion will focus onthe simple case captured in the model, but we will note obvious extensions. Onesimplifying assumption that we make is to define a value-added product with onlyone ingredient and one service. There will be a fixed proportion relationship betweenthe ingredient, the service and the value-added product. Doubling the production ofthe value added product requires a doubling of the ingredients and service. Twoobvious extensions to our basic model would be to (1) allow for multipleingredients and services and (2) more complex production relationships.
The amount of service added to the ingredient is fixed in our model. Our modelresembles a supply-side version of Lancasters model of the demand for characteristics(Lancaster 1966). In this approach, the goods consumers buy are modeled as bundlesof characteristics. In our model, the value-added product is literally a bundle ofcharacteristics. If we were to model consumer demand using characteristicdemand, it would be possible to make the desired amount of service added to theingredient endogenous. The amount of “service” added to each product varies byproduct and country. We would normally expect that the demand for services wouldbe income elastic. The United States and Canada with high income consumers arelikely to demand more highly-processed products than consumers in Mexico orBrazil.
Our theory of product differentiation also draws on household production theoryor the theory of “boundary of the firm.” Both theories attempt to explain thoseactivities that are done internally and those that are purchased in the market. Weassume that the consumer desires some value-added product. Another obviousgeneralization is to make the end product endogenous as well.
For example, the consumer wants a chicken dinner. In the Western Hemisphere,one observes a range of options for providing chicken dinners. Some consumersraise their own chickens that they make into dinners. On the other extreme, somebuy their chicken dinner from a restaurant. We can allow for a range of optionsbetween the two extreme cases by allowing the agent to buy partially processed
Economic Evaluation of Non-Tariff Trade Barriers:~ 169
products. In our two-characteristic case, the partially processed products are a com-bination of raw commodity and purchased value-added. The partially processedproduct is going to be treated as a bundle of characteristics, just as in thecharacteristic model of demand.
Since we have assumed a fixed proportions relationship between ingredients andservices, we can focus initially on the per-unit relationship between embeddedbought service and self-produced service. The partially processed product will bedefined so that one unit of it has enough ingredients to make one unit of the finalproduct. The amount of value added by the processor to the partially-processedproduct will be denoted by “b”. The term “m” stands for the per-unit value-addedmade by the firm or consumer. The term “v” is the per-unit value-added target. Ourmodel hypothesizes a production function that relates v, b, and m as follows:
(1)
A general form as in (1) allows the two types of value-added service to be eitherperfect or imperfect substitutes. Imperfect substitution can result in interiorsolutions to the make-versus-buy decision. The BTM uses a constant-elasticity-of-substitution (CES) function for (1). Our assumptions about how the final product isproduced allow us to further separate the supply of ingredients from the supply ofservices. In a competitive equilibrium, the optimal amount of “bought” versus“made” service is going to be determined by equating the marginal value product(MVP) of bought services to that of made services. The MVP of “made” service inthe consumer demand for partially processed products reflects the currency-equivalent value of marginal utility. The level of embedded service in the partiallyprocessed product is endogenous. The price of the partially processed product (pp)is going to be the marginal cost of the ingredient (pi) plus the marginal cost of theembedded service (pb) times the amount of embedded service:
(2)
Generally, higher-income consumers buy more services and more products withembedded, value-added services. Different household costs of “do-it-yourself” explainswhy we observe the same basic ingredients with different levels of services attachedbeing marketed to final consumers. As noted above, our programming model simplifiesreality by assuming only a limited number of value-added products. We allow the
v f b m,( )=
pp pi b*pb+=
170 D. L. Salin, W. F. Hahn, A. Somwaru
amount of desired service to vary across countries. In our approach, we includeproducts at the wholesale level, not at the retail end-user consumption products.Since we expect less diversity in firm technology than in consumer’s preferences,limiting the range of value-added products at this wholesale level is likely to beless restrictive.
We developed a two-country test model using our approach and were able to getbilateral trade between a country with low service and high ingredient costs andone with low ingredient and high service costs. It was also possible to set up examplesthat lead to one-way trade flows. Armington models with bilateral trade in onescenario generally produce bilateral trade in others. One way to allow for even morepossibility for bilateral trade in our kind of model is to introduce more producerand consumer diversity. In the BTM, there is one aggregate consumer, oneaggregate value-adding sector, and only one type of value-added in each country.Introducing more kinds of consumer’s, producers, and expanding the types of end-use value-added will allow for more potential for bilateral trade.
V. Predicting Broiler Market Impacts:Model Assumptions and Results
The BTM starts with a baseline set of prices, quantities, and policies and theassumption that this baseline represents a competitive market equilibrium. If thereare no changes in the policies or other exogenous variables, then the BTM’soptimal solution replicates the baseline.
Total broiler production, consumption, and the trade patterns for the fourcountries are based on 2002 estimates, as published by the USDA. Production iscalculated on a ready-to-cook (RTC) basis. However, trade is measured on aproduct-weight basis. Value-added products lose bone and skin in processing.When creating the baseline, we adjusted production, trade, and consumptionnumbers where necessary to account for processing.
Production and trade statistics are generally aggregate all broiler products. Wehad additional information on the U.S. and Mexican markets which we used to dis-aggregate total production. Seventeen percent of U.S. broiler production is sold aswhole birds (Parsons, 2003). This ratio was also used for Canada. We assumed thatfifty percent of Mexican and Brazilian broiler production is whole birds. AlthoughMexican broiler processors market 80 percent of their production as whole birds(UNA, 2002), this does not imply that consumers usually buy whole birds.
Economic Evaluation of Non-Tariff Trade Barriers:~ 171
Consumers often buy broiler parts/cuts at supermarkets, public markets, and butchershops where the cut-up operation takes place (Salin and Hahn, 2003). Consumerdemand for parts determines Mexico’s demand for imported broiler parts. Our useof 50 percent reflects a compromise between plant-level production and finalconsumption. We used the same disaggregation of production for Brazil that weused for Mexico.
We were able to get Brazilian prices for an industry contact. Canadian prices arebased on U.S. prices plus an estimated quota rent of U.S. $0.20/KG. The USDApublishes a wide range of prices for wholesale chicken products and even has pricereports for Mexican chicken products. The problem with the Mexican wholesalechicken prices is that they are not directly comparable to the U.S. prices. Mexicanprices are collect closer to the end-user than U.S. prices. Given the trade patternbetween Mexico and the United States for baseline trade flows to be in equilibrium,Mexican prices for dark meat and MDM must be U.S. plus transportation. Sinceother chicken products are not exported to Mexico, Mexican prices have to be lessthan U.S. prices plus transportation. We used the Mexican wholesale prices and theequilibrium U.S.-Mexico price differences for dark meat and MDM to estimate themarkup between the plant and the Mexican wholesale market level. We used thisestimated markup to create plant-level prices for generic chicken cuts in Mexico.
Our treatment of value-added products is based on a mix of discussion with thepoultry industry and judgement. U.S and Canadian consumers demand the sameamount of processing in value-added broiler cuts and have similar broiler value-added costs. We assumed that U.S. and Canadian value-added broiler cuts have 5times more embedded services than Mexican and Brazilian cuts due to higherincome consumers in these countries. Mexicos cost of adding value is assumed tobe 33 percent of the U.S. cost, while Brazils cost is 20 percent of the U.S. cost(ACMF, 2002). Salin and Hahn (2003) indicate that typical Mexican wholesale-retail markup on broiler is about 33 percent, as opposed to 100 percent in theUnited States. The difference in price between U.S. and Canadian value-added and“generic” cuts is 15 times more than the Mexican price difference and 25 times theBrazilian price difference. The U.S. or Canadian products are more highlyprocessed with higher costs for that processing. We also assumed that 75 percent ofthe value-added of processing broiler parts in the United States and Canada isperformed at the processor level, while the remaining 25 percent of the value addedis completed by the final seller of the product. We reversed these percentages forMexico because Salin and Hahn indicate that most broiler processing in Mexico
172 D. L. Salin, W. F. Hahn, A. Somwaru
occurs closer to the final users. We also assume that Brazils “bought” versus“made” shares of embedded services are the same as Mexico’s.
Since we are focusing on SPS changes, we kept the other baseline policies thesame. There are no tariffs on the within-quota chicken trade in the NAFTAcountries. We assumed that both Canada and Mexico maintain their TRQs onchicken. This is one deviation from the 2002 baseline as Mexico’s TRQ on darkmeat was initiated in 2003. Mexico has a 5 percent ad-valorem tariff on broilermeat from non-NAFTA sources. We applied this tariff to potential imports fromBrazil.
The U.S. tariff on broilers varies by cuts and source. Canadian and Mexican broilerscan enter the U.S. duty-free. For broilers imported from Brazil, U.S. tariff rate wasset to its minimum rate, 4.4 cents per kilogram. Brazilian import tariffs areirrelevant to the model, as Brazil does not import broiler in the baseline or any ofthe alternative scenarios.
Currently in Mexico only two states are recognized as being relatively low-riskof END transmission by APHIS. Sinaloa and Sonora account for 4 percent of totalMexican poultry production (Salin et al. 2002). In some scenarios, we assume thatadditional states in Mexico will be recognized as free of END. The eight Brazilianstates that Canada has recognized to be free of END account for about 72% ofBrazilian production. In addition, we assume that at some point in time Mexicoand Brazil are certified to export fresh, chilled, or frozen broiler products to theUnited States and Canada.
A. Scenarios
To determine the economic impact of allowing Mexico and Brazil to exportfresh, chilled or frozen broiler to the United States and Canada, four scenarios weredeveloped:
� Scenario 1: the baseline, representing current sanitary policies, which preventexports from Mexico and/or Brazil to the U.S. and Canada. � Scenario 2 (regionalization of SPS): 4-percent of total Mexican production
and 50% of Brazilian production occurs in END-free areas and is eligible to beexported to Canada and the United States. � Scenario 3 (regionalization of SPS): 15 percent of total Mexican production
and 70 percent of Brazilian production is recognized as END-free. In this scenario,an additional important poultry-producing state in Mexico is recognized as free of
Economic Evaluation of Non-Tariff Trade Barriers:~ 173
END. The important poultry-producing states are: Jalisco, Veracruz, Coahuila,Querétaro Puebla, Nuevo León, Aguascalientes, and Estado de México (UNA,2002). Each of these states accounts for between 6 to 13 percent of national broilerproduction. 70 percent of Brazilian production is now recognized as low-risk byCanada.�Scenario 4 Both Mexico and Brazil eliminate END from 100% of their produc-
tion
B. Empirical Results
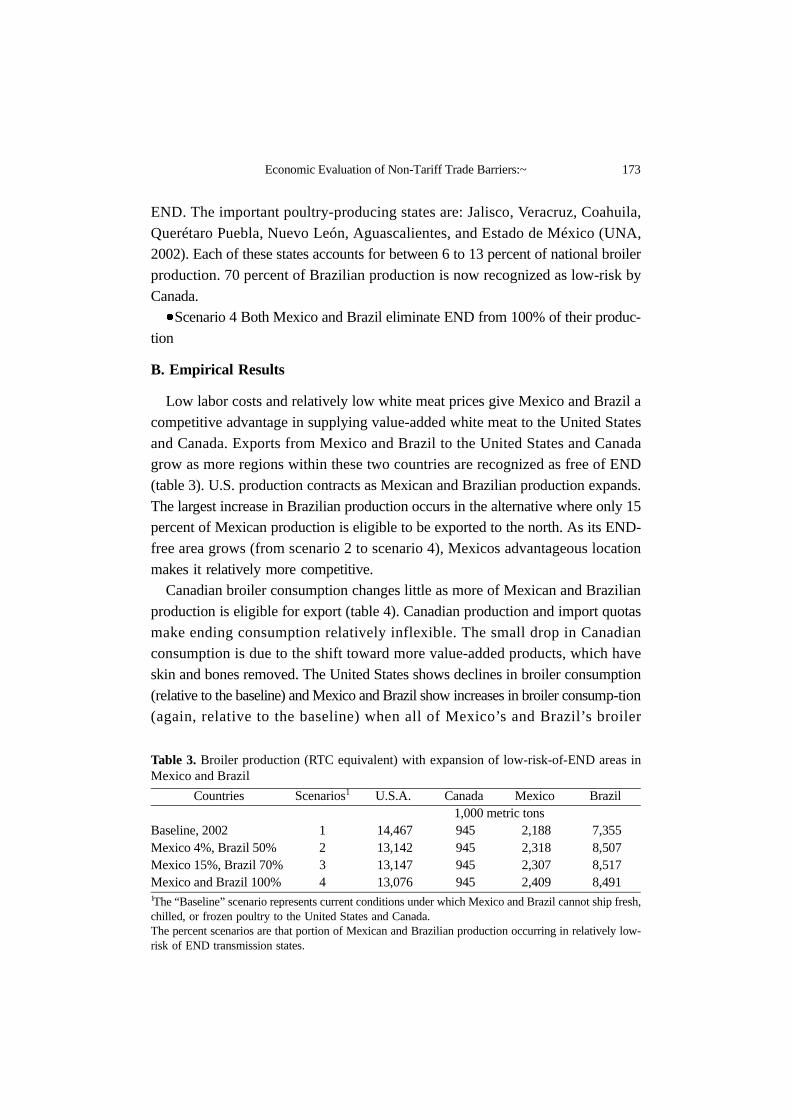
Low labor costs and relatively low white meat prices give Mexico and Brazil acompetitive advantage in supplying value-added white meat to the United Statesand Canada. Exports from Mexico and Brazil to the United States and Canadagrow as more regions within these two countries are recognized as free of END(table 3). U.S. production contracts as Mexican and Brazilian production expands.The largest increase in Brazilian production occurs in the alternative where only 15percent of Mexican production is eligible to be exported to the north. As its END-free area grows (from scenario 2 to scenario 4), Mexicos advantageous locationmakes it relatively more competitive.
Canadian broiler consumption changes little as more of Mexican and Brazilianproduction is eligible for export (table 4). Canadian production and import quotasmake ending consumption relatively inflexible. The small drop in Canadianconsumption is due to the shift toward more value-added products, which haveskin and bones removed. The United States shows declines in broiler consumption(relative to the baseline) and Mexico and Brazil show increases in broiler consump-tion(again, relative to the baseline) when all of Mexico’s and Brazil’s broiler
Table 3. Broiler production (RTC equivalent) with expansion of low-risk-of-END areas inMexico and Brazil
Countries Scenarios1 U.S.A. Canada Mexico Brazil1,000 metric tons
Baseline, 2002 1 14,467 945 2,188 7,355 Mexico 4%, Brazil 50% 2 13,142 945 2,318 8,507 Mexico 15%, Brazil 70% 3 13,147 945 2,307 8,517 Mexico and Brazil 100% 4 13,076 945 2,409 8,491 1The “Baseline” scenario represents current conditions under which Mexico and Brazil cannot ship fresh,chilled, or frozen poultry to the United States and Canada.The percent scenarios are that portion of Mexican and Brazilian production occurring in relatively low-risk of END transmission states.
174 D. L. Salin, W. F. Hahn, A. Somwaru
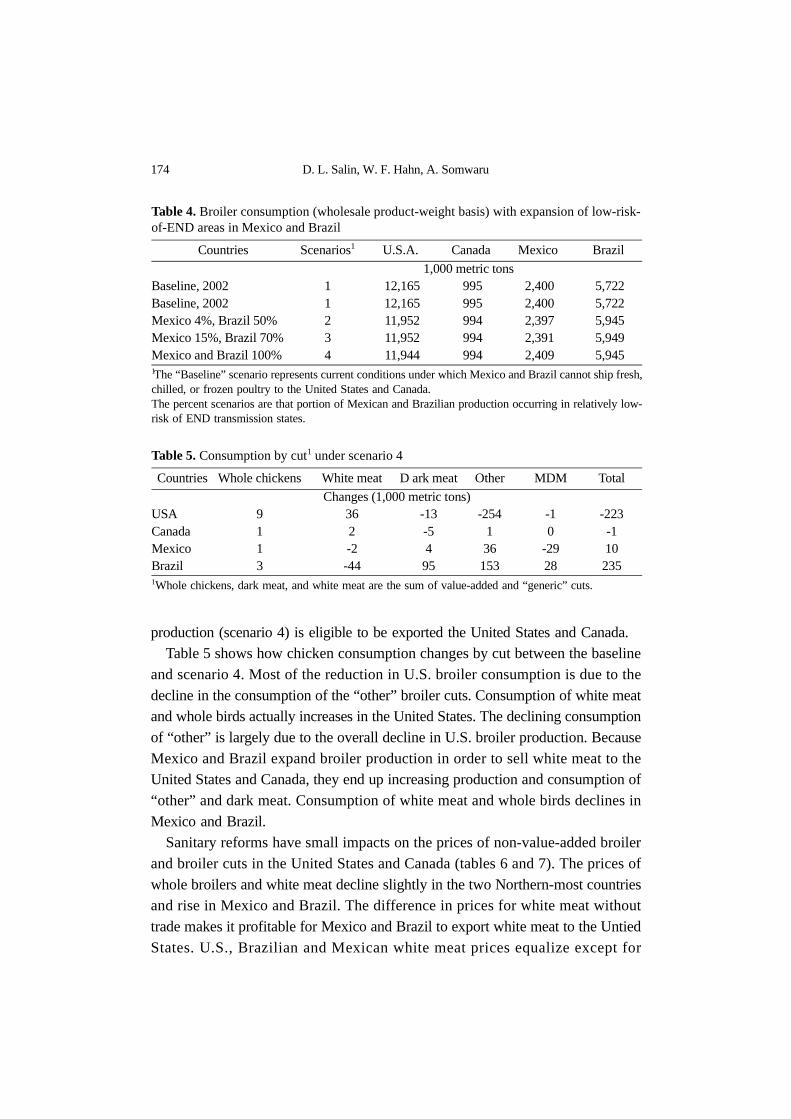
production (scenario 4) is eligible to be exported the United States and Canada. Table 5 shows how chicken consumption changes by cut between the baseline
and scenario 4. Most of the reduction in U.S. broiler consumption is due to thedecline in the consumption of the “other” broiler cuts. Consumption of white meatand whole birds actually increases in the United States. The declining consumptionof “other” is largely due to the overall decline in U.S. broiler production. BecauseMexico and Brazil expand broiler production in order to sell white meat to theUnited States and Canada, they end up increasing production and consumption of“other” and dark meat. Consumption of white meat and whole birds declines inMexico and Brazil.
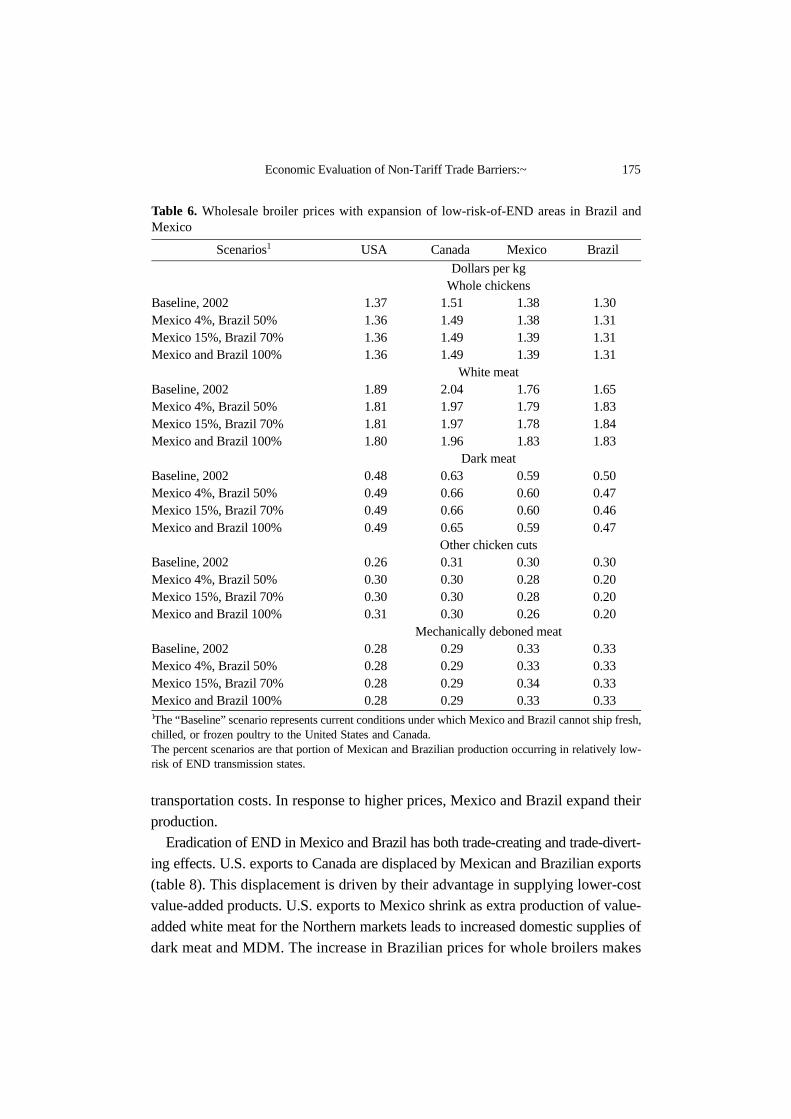
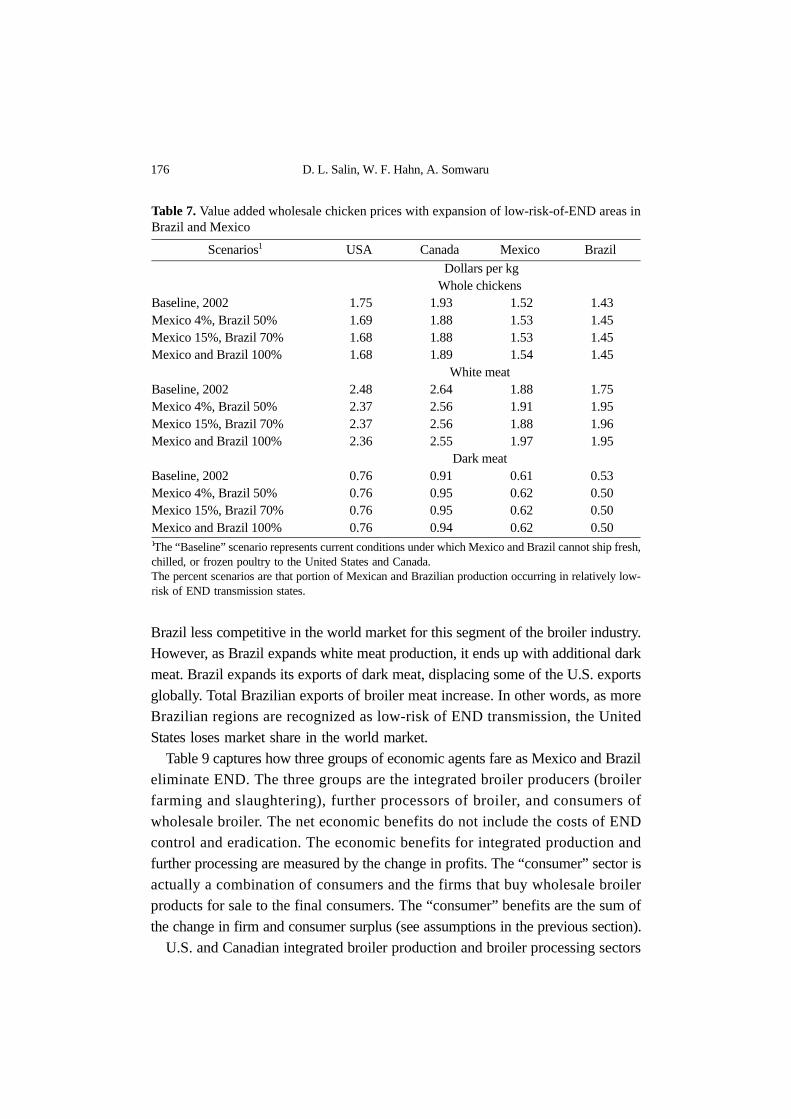
Sanitary reforms have small impacts on the prices of non-value-added broilerand broiler cuts in the United States and Canada (tables 6 and 7). The prices ofwhole broilers and white meat decline slightly in the two Northern-most countriesand rise in Mexico and Brazil. The difference in prices for white meat withouttrade makes it profitable for Mexico and Brazil to export white meat to the UntiedStates. U.S., Brazilian and Mexican white meat prices equalize except for
Table 4. Broiler consumption (wholesale product-weight basis) with expansion of low-risk-of-END areas in Mexico and Brazil
Countries Scenarios1 U.S.A. Canada Mexico Brazil
1,000 metric tons Baseline, 2002 1 12,165 995 2,400 5,722 Baseline, 2002 1 12,165 995 2,400 5,722 Mexico 4%, Brazil 50% 2 11,952 994 2,397 5,945 Mexico 15%, Brazil 70% 3 11,952 994 2,391 5,949 Mexico and Brazil 100% 4 11,944 994 2,409 5,945 1The “Baseline” scenario represents current conditions under which Mexico and Brazil cannot ship fresh,chilled, or frozen poultry to the United States and Canada.The percent scenarios are that portion of Mexican and Brazilian production occurring in relatively low-risk of END transmission states.
Table 5. Consumption by cut1 under scenario 4
Countries Whole chickens White meat D ark meat Other MDM Total
Changes (1,000 metric tons)USA 9 36 -13 -254 -1 -223Canada 1 2 -5 1 0 -1Mexico 1 -2 4 36 -29 10Brazil 3 -44 95 153 28 2351Whole chickens, dark meat, and white meat are the sum of value-added and “generic” cuts.
Economic Evaluation of Non-Tariff Trade Barriers:~ 175
transportation costs. In response to higher prices, Mexico and Brazil expand theirproduction.
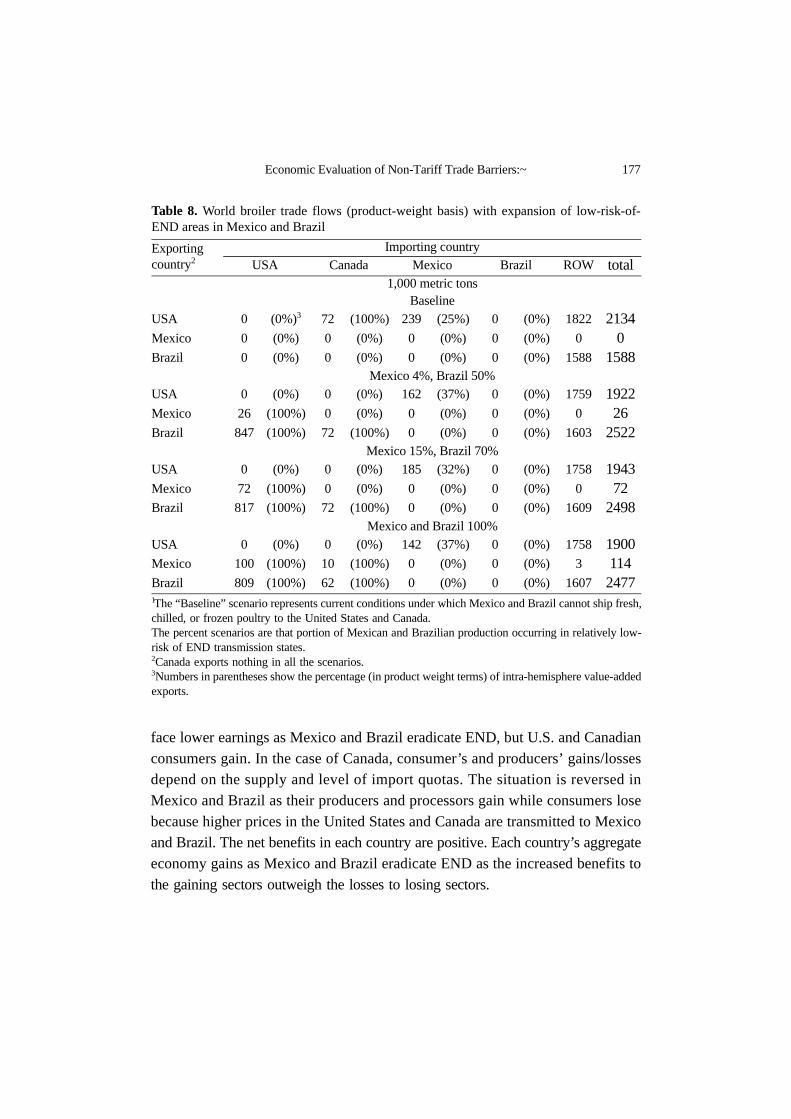
Eradication of END in Mexico and Brazil has both trade-creating and trade-divert-ing effects. U.S. exports to Canada are displaced by Mexican and Brazilian exports(table 8). This displacement is driven by their advantage in supplying lower-costvalue-added products. U.S. exports to Mexico shrink as extra production of value-added white meat for the Northern markets leads to increased domestic supplies ofdark meat and MDM. The increase in Brazilian prices for whole broilers makes
Table 6. Wholesale broiler prices with expansion of low-risk-of-END areas in Brazil andMexico
Scenarios1 USA Canada Mexico Brazil
Dollars per kgWhole chickens
Baseline, 2002 1.37 1.51 1.38 1.30 Mexico 4%, Brazil 50% 1.36 1.49 1.38 1.31 Mexico 15%, Brazil 70% 1.36 1.49 1.39 1.31 Mexico and Brazil 100% 1.36 1.49 1.39 1.31
White meatBaseline, 2002 1.89 2.04 1.76 1.65 Mexico 4%, Brazil 50% 1.81 1.97 1.79 1.83 Mexico 15%, Brazil 70% 1.81 1.97 1.78 1.84 Mexico and Brazil 100% 1.80 1.96 1.83 1.83
Dark meatBaseline, 2002 0.48 0.63 0.59 0.50 Mexico 4%, Brazil 50% 0.49 0.66 0.60 0.47 Mexico 15%, Brazil 70% 0.49 0.66 0.60 0.46 Mexico and Brazil 100% 0.49 0.65 0.59 0.47
Other chicken cutsBaseline, 2002 0.26 0.31 0.30 0.30 Mexico 4%, Brazil 50% 0.30 0.30 0.28 0.20 Mexico 15%, Brazil 70% 0.30 0.30 0.28 0.20 Mexico and Brazil 100% 0.31 0.30 0.26 0.20
Mechanically deboned meatBaseline, 2002 0.28 0.29 0.33 0.33 Mexico 4%, Brazil 50% 0.28 0.29 0.33 0.33 Mexico 15%, Brazil 70% 0.28 0.29 0.34 0.33 Mexico and Brazil 100% 0.28 0.29 0.33 0.33 1The “Baseline” scenario represents current conditions under which Mexico and Brazil cannot ship fresh,chilled, or frozen poultry to the United States and Canada.The percent scenarios are that portion of Mexican and Brazilian production occurring in relatively low-risk of END transmission states.
176 D. L. Salin, W. F. Hahn, A. Somwaru
Brazil less competitive in the world market for this segment of the broiler industry.However, as Brazil expands white meat production, it ends up with additional darkmeat. Brazil expands its exports of dark meat, displacing some of the U.S. exportsglobally. Total Brazilian exports of broiler meat increase. In other words, as moreBrazilian regions are recognized as low-risk of END transmission, the UnitedStates loses market share in the world market.
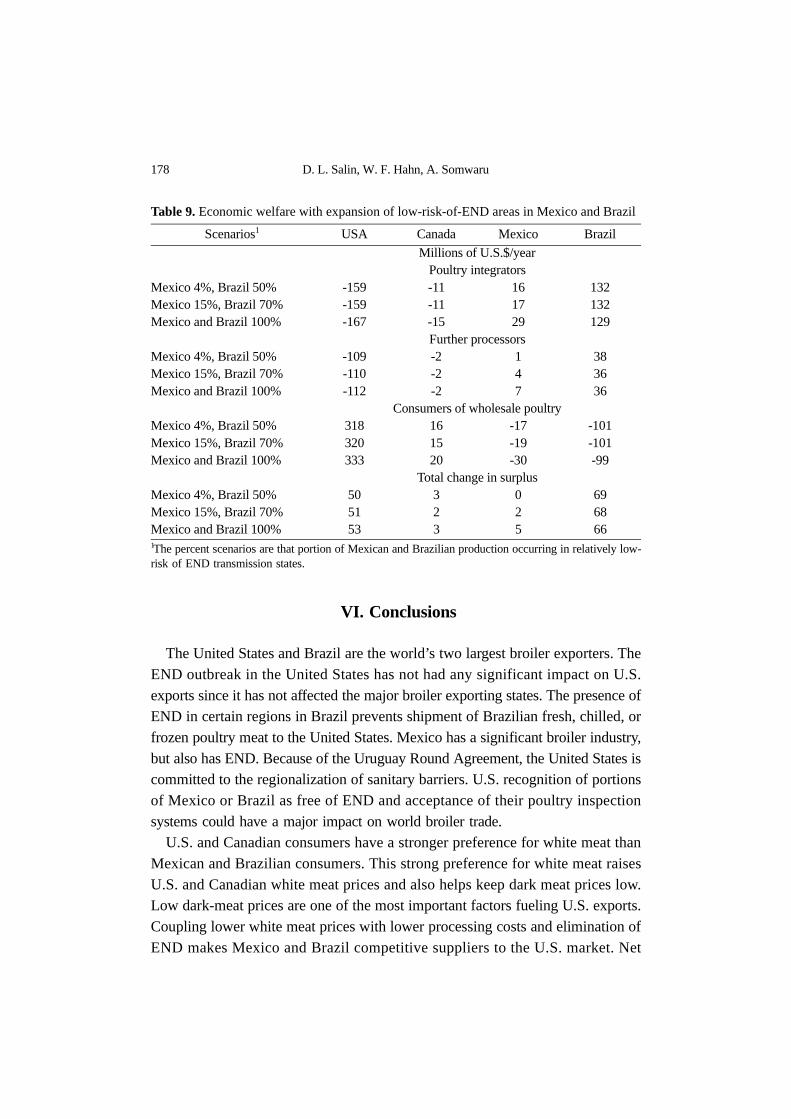
Table 9 captures how three groups of economic agents fare as Mexico and Brazileliminate END. The three groups are the integrated broiler producers (broilerfarming and slaughtering), further processors of broiler, and consumers ofwholesale broiler. The net economic benefits do not include the costs of ENDcontrol and eradication. The economic benefits for integrated production andfurther processing are measured by the change in profits. The “consumer” sector isactually a combination of consumers and the firms that buy wholesale broilerproducts for sale to the final consumers. The “consumer” benefits are the sum ofthe change in firm and consumer surplus (see assumptions in the previous section).
U.S. and Canadian integrated broiler production and broiler processing sectors
Table 7. Value added wholesale chicken prices with expansion of low-risk-of-END areas inBrazil and Mexico
Scenarios1 USA Canada Mexico Brazil
Dollars per kg Whole chickens
Baseline, 2002 1.75 1.93 1.52 1.43 Mexico 4%, Brazil 50% 1.69 1.88 1.53 1.45 Mexico 15%, Brazil 70% 1.68 1.88 1.53 1.45 Mexico and Brazil 100% 1.68 1.89 1.54 1.45
White meatBaseline, 2002 2.48 2.64 1.88 1.75 Mexico 4%, Brazil 50% 2.37 2.56 1.91 1.95 Mexico 15%, Brazil 70% 2.37 2.56 1.88 1.96 Mexico and Brazil 100% 2.36 2.55 1.97 1.95
Dark meatBaseline, 2002 0.76 0.91 0.61 0.53 Mexico 4%, Brazil 50% 0.76 0.95 0.62 0.50 Mexico 15%, Brazil 70% 0.76 0.95 0.62 0.50 Mexico and Brazil 100% 0.76 0.94 0.62 0.50 1The “Baseline” scenario represents current conditions under which Mexico and Brazil cannot ship fresh,chilled, or frozen poultry to the United States and Canada.The percent scenarios are that portion of Mexican and Brazilian production occurring in relatively low-risk of END transmission states.
Economic Evaluation of Non-Tariff Trade Barriers:~ 177
face lower earnings as Mexico and Brazil eradicate END, but U.S. and Canadianconsumers gain. In the case of Canada, consumer’s and producers’ gains/lossesdepend on the supply and level of import quotas. The situation is reversed inMexico and Brazil as their producers and processors gain while consumers losebecause higher prices in the United States and Canada are transmitted to Mexicoand Brazil. The net benefits in each country are positive. Each country’s aggregateeconomy gains as Mexico and Brazil eradicate END as the increased benefits tothe gaining sectors outweigh the losses to losing sectors.
Table 8. World broiler trade flows (product-weight basis) with expansion of low-risk-of-END areas in Mexico and Brazil
Exporting country2
Importing countryUSA Canada Mexico Brazil ROW total
1,000 metric tonsBaseline
USA 0 (0%)3 72 (100%) 239 (25%) 0 (0%) 1822 2134Mexico 0 (0%) 0 (0%) 0 (0%) 0 (0%) 0 0Brazil 0 (0%) 0 (0%) 0 (0%) 0 (0%) 1588 1588
Mexico 4%, Brazil 50%USA 0 (0%) 0 (0%) 162 (37%) 0 (0%) 1759 1922Mexico 26 (100%) 0 (0%) 0 (0%) 0 (0%) 0 26Brazil 847 (100%) 72 (100%) 0 (0%) 0 (0%) 1603 2522
Mexico 15%, Brazil 70%USA 0 (0%) 0 (0%) 185 (32%) 0 (0%) 1758 1943Mexico 72 (100%) 0 (0%) 0 (0%) 0 (0%) 0 72Brazil 817 (100%) 72 (100%) 0 (0%) 0 (0%) 1609 2498
Mexico and Brazil 100%USA 0 (0%) 0 (0%) 142 (37%) 0 (0%) 1758 1900Mexico 100 (100%) 10 (100%) 0 (0%) 0 (0%) 3 114Brazil 809 (100%) 62 (100%) 0 (0%) 0 (0%) 1607 24771The “Baseline” scenario represents current conditions under which Mexico and Brazil cannot ship fresh,chilled, or frozen poultry to the United States and Canada.The percent scenarios are that portion of Mexican and Brazilian production occurring in relatively low-risk of END transmission states. 2Canada exports nothing in all the scenarios.3Numbers in parentheses show the percentage (in product weight terms) of intra-hemisphere value-addedexports.
178 D. L. Salin, W. F. Hahn, A. Somwaru
VI. Conclusions
The United States and Brazil are the world’s two largest broiler exporters. TheEND outbreak in the United States has not had any significant impact on U.S.exports since it has not affected the major broiler exporting states. The presence ofEND in certain regions in Brazil prevents shipment of Brazilian fresh, chilled, orfrozen poultry meat to the United States. Mexico has a significant broiler industry,but also has END. Because of the Uruguay Round Agreement, the United States iscommitted to the regionalization of sanitary barriers. U.S. recognition of portionsof Mexico or Brazil as free of END and acceptance of their poultry inspectionsystems could have a major impact on world broiler trade.
U.S. and Canadian consumers have a stronger preference for white meat thanMexican and Brazilian consumers. This strong preference for white meat raisesU.S. and Canadian white meat prices and also helps keep dark meat prices low.Low dark-meat prices are one of the most important factors fueling U.S. exports.Coupling lower white meat prices with lower processing costs and elimination ofEND makes Mexico and Brazil competitive suppliers to the U.S. market. Net
Table 9. Economic welfare with expansion of low-risk-of-END areas in Mexico and Brazil
Scenarios1 USA Canada Mexico Brazil
Millions of U.S.$/yearPoultry integrators
Mexico 4%, Brazil 50% -159 -11 16 132Mexico 15%, Brazil 70% -159 -11 17 132Mexico and Brazil 100% -167 -15 29 129
Further processorsMexico 4%, Brazil 50% -109 -2 1 38Mexico 15%, Brazil 70% -110 -2 4 36Mexico and Brazil 100% -112 -2 7 36
Consumers of wholesale poultryMexico 4%, Brazil 50% 318 16 -17 -101Mexico 15%, Brazil 70% 320 15 -19 -101Mexico and Brazil 100% 333 20 -30 -99
Total change in surplusMexico 4%, Brazil 50% 50 3 0 69Mexico 15%, Brazil 70% 51 2 2 68Mexico and Brazil 100% 53 3 5 661The percent scenarios are that portion of Mexican and Brazilian production occurring in relatively low-risk of END transmission states.
Economic Evaluation of Non-Tariff Trade Barriers:~ 179
economic welfare in all four countries increases. However, the model does not accountfor costs associated with the elimination of END in Mexico and Brazil. These costswill reduce the net gains. The net gains presented in this paper are welfare changesper year. The largest part of the costs of END eradication will be a one-time cost.
Brazil and Mexico have an advantage in supplying value-added broiler products.If these countries can achieve END free status and are certified that their inspectionsystem is equivalent to the United States, their exports of value-added to the UnitedStates will reduce U.S. broiler production. In response to these policies changes,U.S. broiler industry might have to intensify its efforts to increase itscompetitiveness. However, our analysis does not account for improvement inBrazilian and Mexican productivity arising from the elimination of END.
A large portion of world broiler trade is driven by subtle differences in countries’economic development and consumers’ purchasing power. The model finds a long-run equilibrium under the assumption that the rest of the economy is not affectedby changes in the broiler sector. Current trends in the Mexican and Brazilianeconomies as a whole are likely to reduce the estimated long-run impacts ofsanitary barrier reforms. White meat is the more expensive cut in Mexico, and it islikely that the preference for white meat will grow along with Mexico’s economicdevelopment. If economic growth in Mexico and Brazil accelerates, this isexpected to lead to improved wages and more environmental regulations, which inturn could decrease their relative competitiveness in the further processing ofbroiler cuts.
Received 1 January 2003, Accepted 5 March 2003
References
Agriculture and Agri-Food Canada. November 11, 2002. Minister of Agriculture andAgri-food, Canada, <http://www.agr.gc.ca>.
Alston, Julian, Colin Carter, Richard Greeen, Daniel Pick. 1990. “Whither ArmingtonTrade Models?” American Journal of Agricultural Economics. Vol. 72: 455-467.
Associaòão Brasileira dos Pordutores e Exportadores de Frangos (ABEF), 2001.Australian Chicken Meat Federation (ACMF). June 2002. Benchmarking and Value
Cheian On-going Study Program. Year 3 Report.Coleman Jonathan R., and Warren Payne. 2003. “Factors Affecting Trade in Mexican
Imports of Poultry Meat From the United States”. Office of Industries WorkingPaper, U.S. International Trade Commission.
180 D. L. Salin, W. F. Hahn, A. Somwaru
Companhia Nacional de Abastecimiento (CONAB), Ministério da Agricultura, Pecuária eAbastecimiento, Brazil, <http://www.conab.gov.br>. November 26, 2002.
Hahn, William F. 1990. North American Trade Model for Animal Products, TechnicalBulletin No. 1830, USDA Economic Research Service.
International Organization for Epizootics (OIE). March 29, 2003. Data on AnimalDiseases, OIE Classification of Diseases. <http://www.oie.int/eng/normes/mcode/a_summry.htm>.
Kassum, Julian and Nancy Morgan. 2002. “The SPS Agreement: Livestock and Meat Trade.Draft Food and Agriculture Organization (FAO) Paper.
Lancaster, Kelvin J. May 1966. “Change and Innovation in the Technology ofConsumption.” American Economic Review, 56(2): 14-23.
Lewbel, Arthur. June 1996. “Aggregation without Separability: A Generalized CompositeCommodity Theorem.” American Economic Review 86(3): 524-543.
National Archives of Records Administration. January 1, 2003, Code of FederalRegulations, Title 1, Vol.9, Section 94.6 and 94.22.
Orden, David, Timothy Josling, and Donna Roberts. 2002. Product Differentiation,Sanitary Barriers, and Arbitrage in World Poultry Markets. Global Food Trade andConsumer Demand for Quality, Kluwer Academic/Plenum Publishers, New York.
Parson Richard. National Poultry Supervisor, Poultry Market News. USDA-AgriculturalMarketing Service. Personal Communication on March 6, 2003.
Roberts, Donna. 1998a. Preliminary Assessment of the Effects of the WTO Agreement onSanitary and Phytosanitary Trade Regulations, Journal of International EconomicLaw Oxford University Press 3(1): 377-405.
---------1998b. Implementation of the WTO Agreement on the Application of Sanitary andPhytosanitary Measures: The First Two Years, International Agricultural TradeResearch Consortium, University of Minnesota.
Rogowsky, Robert A. and Very Simpson. December 1998. Industry and Trade Summary:Poultry. U.S. International Trade Commission, Publication 3148.
Salin, Delmy, William H. Hahn and David J. Harvey. December 2002. U.S.-Mexico BroilerTrade: A Bird's Eye View. E-Outlook Report, ERS-USDA, LPD-M-102-01. <http://www.ers.usda.gov/publications/ldp/dec02/ldpm10201/DBGen. htm>.
Salin, Delmy and William H. Hahn. “Trip Report of the Mexican Broiler Marketing System.”Unpublished paper, February 17, 2003.
Samuelson, Paul A. 1952. “Price Equilibrium and Linear Programming.” AmericanEconomic Review Vol. 42, no. 1 pp: 283-303.
Secretaría de Agricultura, Ganadería y Desarrollo Rural, Pesca y Alimentación (SAGARPA)-Servicio de Información y Estadística Agroalimentaria y Pesquera (SIAP).September 2001. Anuario Estadístico de la Producción Pecuaria de los EstadosUnidos Mexicanos 2000.
Unión Nacional de Avicultores (UNA) de Mexico. Abril 2002. Compendio de IndicadoresEconómicos del Sector Avícola.
USDA Agricultural Baseline Projections to 2012, Office of the Chief Economist, Staff
Economic Evaluation of Non-Tariff Trade Barriers:~ 181
Report WAOB-2003-1.USDA Animal and Plant Health Inspection Service (APHIS). April 2003. Emergency Manage-
ment Warning 87: “Exotic Newcastle Disease Confirmed in the United States”. <http://aphisweb.aphis.usda.gov/lpa/issues/enc/emws/encdw87-03.html>.
USDA Foreign Agricultural Service (FAS). March 2003a. “Livestock and Poultry: WorldMarkets and Trade.” Circular Series DL&P 1-03. http://www.fas.usda.gov/dlp/circular/2003/03-03LP/dlp1_03.pdf
-------January 24, 2003b. “Mexico Poultry and Products Provisional Safeguard on ChickenLeg Quarters.” Gain Report Number: MX3012. Global Agricultural Information Network.
USDA Food Safety and Inspection Service (FSIS), Field Automation and InformationManagement Division. Personal Communication on March 6, 2003.
Wohlgenat, Michael K. and Richard C. Haidacher. December 1989. Retail-toFarmLinkages for a Complete Demand System of Food Commodities. Technical Bulletin177, United States Department of Agriculture Economic Research Service.
Wright Chris. August 2002. Mexico Nervous Ahead of NAFTA Deadline, Poultry USA,pp. 22-24.
182 D. L. Salin, W. F. Hahn, A. Somwaru
Appendix: The Structure of the MP Model
The MP model minimizes the costs of producing, processing, and shippingbroilers subject to a representative-consumer-utility constraint. The typicalmathematical programming model maximizes the sum of producer and consumersurplus. Consumer surplus does not exist when two or more prices change. Onecannot integrate under multiple demand functions. Multi-product MP modelstypically use compensated demand functions, which have symmetric derivativesand can be integrated. Hahn (1993) showed that minimizing costs subject to autility constraint and maximizing surplus with compensated demand functions areequivalent approaches. The use of a compensated demand system allows one to doa welfare analysis of changes in policy or exogenous variables.
The MP model uses quadratic utility functions. The quadratic utility function islocally flexible. The modeling process starts with a baseline set of prices,consumption, and elasticities. The elasticities are required to be (1) homogeneousof degree 0 in prices and expenditures and (2) consistent with the budgetconstraint. The compensated elasticities (3) must exhibit Slutsky symmetry and (4)be negative, semi-definite. The first three conditions on the elasticities implyequality constraints. As a result, over half the elasticities in the system arefunctions of the others. The fourth constraint is an inequality constraint.
The demand elasticities used in the model are based on published sources. Thereare two problems. The first is that while economists often impose the equalityrestrictions of demand theory, they often do not check the inequality restrictions.Many published elasticities are not negative, semi-definite. We generally correctthis problem by making cross-price elasticities closer to zero. The other problemwe had is that no published set of demand elasticities with the same level ofpoultry product detail we have in this model. We made some arbitrary assumptionsrelating the detailed elasticities to the aggregate estimates. We tested our model byusing different disaggregation assumptions. It turns out that varying the demandelasticities had only small effects on the model results.
Given sets of demand elasticities for the United States, Canada, Mexico, andBrazil, the modeling system finds a set of quadratic utility functions consistent withthose elasticities and the baseline prices and quantities. The utility constraints forthe MP model can be written:
(1)Ai k, Di k,b
k
∑ Bi k l, , Di k,b *Di l,
b Ai k, Di k,k
∑ Bi k l, , Di k, *Di l,
k l,∑+≤
k l,∑+
Economic Evaluation of Non-Tariff Trade Barriers:~ 183
In equation 1, the subscripts “i” vary with the four countries, while “k” and “l”vary over the consumption quantities. The terms Ai,k and Bi,k,l are quadratic utilityfunction parameters. The term Di,k is the models solution for the demand forproduct k in country i and the term Db
j,k is the baseline demand for product k incountry i. The constraint in equation 1 requires that the representative consumersutility is a least as great as the baseline utility.
There are five sources of costs. The first cost is in the production of broilers.There are two types of broilers in the model: parts-type broilers and whole-typebroilers. These are joint products. The parts-type and whole-type birds produced incountry i are denoted by Bi,p and Bi,w respectively. The joint cost function forproduction of birds is:
(2)
In equation 2, α i,b, σi,b, di,b,. and fi,b are parameters. Equation (2) looks like aconstant elasticity of substitution (CES) production function; however, because theσi,b are greater than 1, the level sets curve away from the axes rather than towardthem. The “f” parameters are 1 equal to one plus the flexibility of supply. If thesupply of birds were perfectly elastic in some country, its “f” will be one. Researchshows that chicken supply seems to be extremely elastic. We set the value of “f” toimply a supply elasticity of 8. The α i,b and di,b, parameters are set so that themarginal costs of producing the baseline amount of whole birds equals the baselinewhole bird price and the marginal costs of broilers parts equals the weighted valueof its parts.
Another production activity that induces costs is the adding of value to broilercuts. There are three value-added broiler cuts, whole birds, white meat, and darkmeat and two sources of value added in each country, the processor and theintermediate consumer. The model calculates the total value added to each of thethree cuts by each of the two sources in each of the three countries. The value-added by parts is aggregated by source and country using a CES-like approach asin equation 2. The aggregate supply of value-added supplied by each country’s twosources is upward sloping, so that marginal and total costs increase with increasinglevels of value-added processing.
Another set of cost arises when broiler meat is exported. Exports incur transportcosts and import tariffs in the receiving countries. The fourth cost in the model isthe cost of buying the aggregate other good. As noted above, the typical partial
α i b, di b p, , Bi p,σi b, di b w, , Bi w,
σi b,+( )fi b, σi b,⁄
184 D. L. Salin, W. F. Hahn, A. Somwaru
equilibrium assumptions allow one to combine all other goods into a Hickseanaggregate. This good is supplied at constant marginal cost.
Exports to the other regions of the world are modeled as creating a benefit. Thebenefit is the net surplus change from changes in exports. Other regions are treatedas excess demand regions. That is, the supply responses and demand responses arecombined to yield an excess demand. The other regions of the world aredemanders of U.S. and Brazilian broiler and broiler cuts. The net benefit fromexports is subtracted from the costs.
The cost and utility functions in the MP model are non-linear. Most of the rest ofthe equations in the model are linear identities. There are identities relating theproduction to exports, demand to imports, and the distribution of demand andproduction between value-added and “generic” cuts. There is also a set of linearidentities relating per-unit-value-added to cuts to the total value added produced ina country. The unit-value-added variable allows us to make value-addedendogenous. Let the unit-value-added variable be denoted by Ui,j,k,m. The unit valueadded term has 4 subscripts: i for the producing/exporting country, j for theimporting/consuming country, k for the value-added cut, and m for the source ofvalue added. The subscript “m” takes two values depending on whether the value-added is made by the intermediate consumer or bought from a processor. “Made”and “bought” value-added can be imperfect substitutes and are related through a(simplified) CES production function constraint:
(3)
The MP model was set up to allow the production function for final products tovary according to the source and use country as well as by the value-added cut.The “w” parameters are set so that equation 3 fits the baseline data.
1 wi j k made, , , * Ui j k made, , ,( )
σi j k, , wi j k bought, , , * Ui j k bought, , ,( )
σi j k, ,+( )=