economic evaluation of urmel-ice, a school-based ... · data collection data collection included...
TRANSCRIPT
ORIGINAL PAPER
Economic evaluation of URMEL-ICE, a school-based overweightprevention programme comprising metabolism, exerciseand lifestyle intervention in children
Dorothea Kesztyus • Anja Schreiber • Tamara Wirt • Martina Wiedom •
Jens Dreyhaupt • Susanne Brandstetter • Benjamin Koch • Olivia Wartha •
Rainer Muche • Martin Wabitsch • Reinhold Kilian • Jurgen M. Steinacker
Received: 1 July 2011 / Accepted: 21 September 2011
� Springer-Verlag 2011
Abstract
Objective Measuring the impact of the URMEL-ICE
school-based overweight prevention programme on
anthropometric measures in primary-school children,
computing incremental cost-effectiveness relation (ICER)
and net monetary benefit (NMB).
Methods This is an intervention study with historical
control. Propensity score method is applied to account for
group differences. One-year teacher-driven classroom
implementation is used, which is based on especially
developed teaching material including health education,
physical activity breaks and parent involvement. 354
children in the control and 365 children in the intervention
group at baseline and follow-up were analysed. Effective-
ness is measured as cm waist circumference (WC) and unit
(0.01) waist-to-height ratio (WHtR) increase prevented in
intervention vs. control group using an adjusted two-level
model. Standard cost-effectiveness analysis methods, net
benefit regression and a societal perspective for a 1-year
time horizon are applied.
Results WC gain was 1.61 cm and WHtR gain was 0.014
significantly less in intervention vs. control group. Inter-
vention costs were €24.09 per child. ICER was €11.11
(95% confidence interval (CI) [8.78; 15.02]) per cm WC
and €18.55 (95% CI [14.04; 26.86]) per unit WHtR gain
prevented. At a maximum willingness to pay (MWTP) of
€35, both values of the CIs for NMB regarding WC and
WHtR are located in the positive range.
Conclusions The study gives new information about the
cost-effectiveness of structured health promotion embed-
ded in daily routine at primary schools. Assuming a MWTP
of €35 the intervention is cost-effective with a positive
NMB. This result may help decision makers in imple-
menting programmes to prevent childhood overweight in
school settings.
Keywords Overweight � Prevention and control � Child �Cost-effectiveness
JEL Classification I10 � I12 � I18
Introduction
Overweight and obesity in childhood are already linked to
various health risks [1]. Being overweight or obese as a
D. Kesztyus (&) � A. Schreiber � T. Wirt � S. Brandstetter �B. Koch � O. Wartha � J. M. Steinacker
Division of Sports and Rehabilitation, Department of Internal
Medicine II, Ulm University Medical Centre, Frauensteige 6,
Haus 58/33, 89075 Ulm, Germany
e-mail: [email protected]
M. Wiedom � J. Dreyhaupt � R. Muche
Institute of Epidemiology and Medical Biometry,
Ulm University, Ulm, Germany
S. Brandstetter
Medical Sociology, Institute of Epidemiology and Preventive
Medicine, Regensburg University, Regensburg, Germany
O. Wartha
Transfer Centre for Neuroscience and Learning (ZNL),
University of Ulm, Ulm, Germany
M. Wabitsch
Division of Paediatric Endocrinology
and Diabetes, Department of Paediatrics,
Ulm University Medical Centre, Ulm, Germany
R. Kilian
Research - Mental Health Services RU,
Department of Psychiatry II, Ulm University,
Gunzburg, Germany
123
Eur J Health Econ
DOI 10.1007/s10198-011-0358-3
child, the likelihood to remain so in adulthood is not
negligible, and today’s children may have ultimately
shorter lives than their parents [2]. According to the various
comorbidities, obesity goes along with higher medical
costs, leading to estimations of total annual costs of
approximately €32.8 billion in the EU (2002) [3] and
US$139 billion in the United States (2003) [4].
Programmes of preventive measures in children and
adolescents differ a lot concerning their degree of evalua-
tion, and only few of them are examined towards their cost-
effectiveness [5].
Analyses of cost-effectiveness are mainly found in the
field of treatment for already apparent overweight or
obesity, probably due to the interests of the pharmaceutical
industry on one hand and to higher levels of uncertainty
concerning primary prevention and subsequent methodo-
logical difficulties [6] on the other hand.
The latest review of recent research on economic eval-
uation of preventive measures by John et al. [7] identifies
four studies published in 2008–2009. Two of them were
taken from the ACE-Obesity (Assessing Cost-effectiveness
in Obesity) Project, and thereof, the most cost-effective
intervention was the reduction in TV advertising of energy-
dense, nutrient-poor food and beverages, while the other
programme exceeded the usual threshold values of cost-
effectiveness. According to John et al., the APPLE (A Pilot
Program for Lifestyle and Exercise) Project conducted in
New Zealand was an economically inferior project con-
cerning the changes in health-related quality of life as
primary outcome variable. The fourth study, the FitKid
school-based obesity prevention study carried out in
Augusta, GA, USA, was successful but with limited
meaning, because of the usage of an intermediate outcome
measure. But since successful studies on overweight pre-
vention programmes in children are rare and the epidemic
is getting worse, we are not in the convenient situation to
push aside studies with intermediate outcome measures.
The URMEL-ICE programme [8, 9] was designed from
a synthesis of components taken from successful inter-
ventions. Even though intermediate outcome measures are
used, the purpose of this article is to show the cost-effec-
tiveness and the simplicity of this intervention to help
decision makers find an effective and simple way to take
action against the growing threat of obesity.
Participants and methods
Overview of the URMEL-ICE study
URMEL-ICE stands for Ulm Research on Metabolism,
Exercise and Lifestyle Intervention in Children. The basic
study was a school-based, cluster-randomized intervention
trial conducted in the region of Ulm, Germany. In close
temporal proximity, the intervention was implemented in
the Bavarian county of Gunzburg, located in immediate
neighbourhood to Ulm. The main difference between the
two studies is that all cost data in association with the
intervention were collected in Gunzburg, while a control
group was missing. The intervention in Gunzburg was
initiated by the district administration and the local com-
munity foundation and aimed at the benefit of all children
in the county; therefore, a control group was not desired.
For both parts, approval was obtained from the Ethics
Committee of the Ulm University, and parents were asked
for their written informed consent.
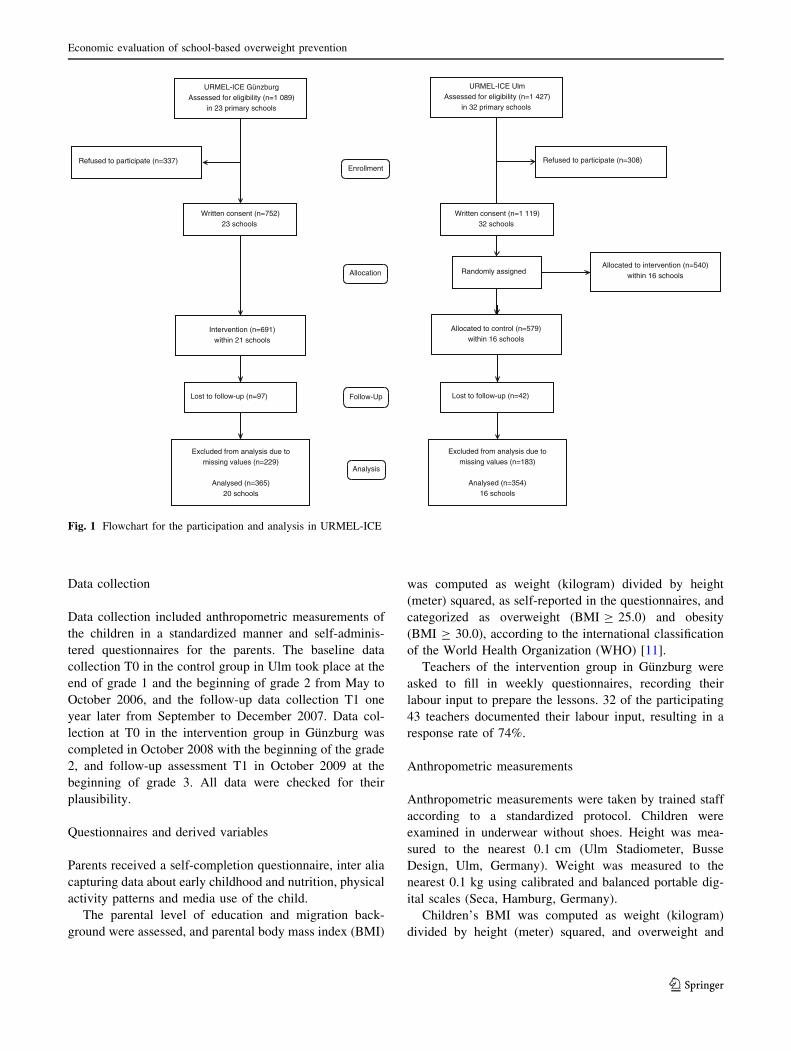
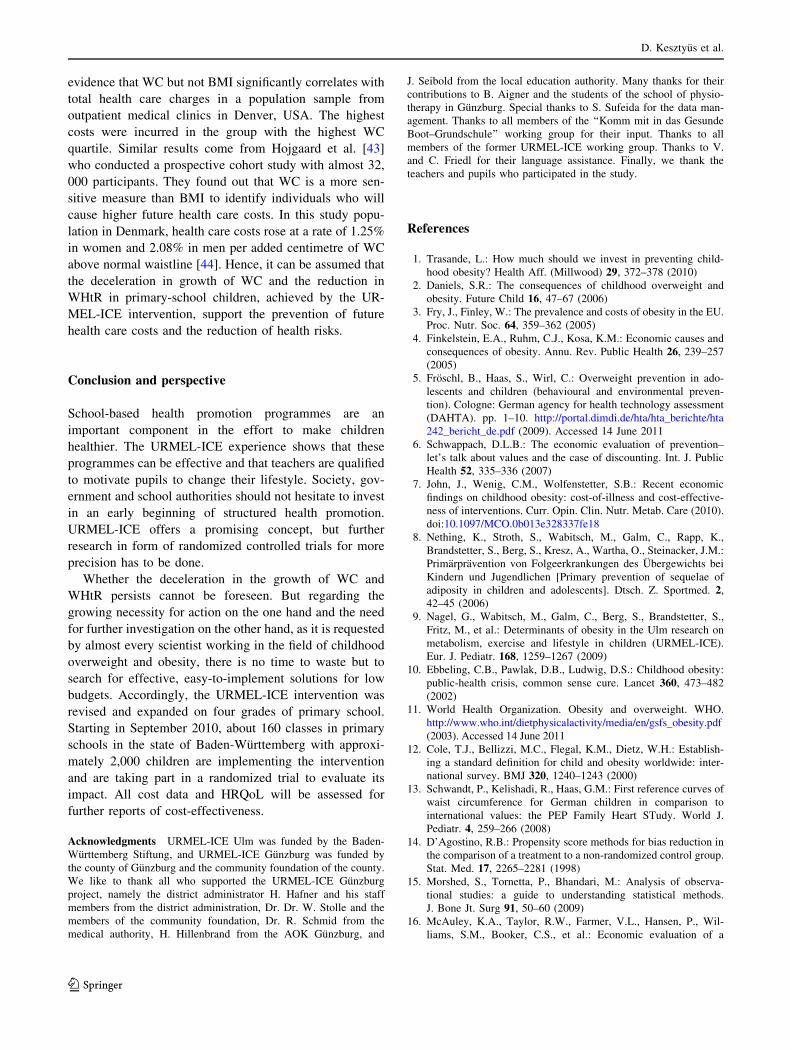
Figure 1 shows a flowchart with the number of partici-
pants, for both intervention and control group, and the final
number of participants included in the data analysis. Two
schools in Gunzburg failed to complete baseline measure-
ments. Reasons for loss to follow-up were removals,
repeating 2nd grade and sick leave.
In a previous article, the effects of the basic intervention
study on children’s BMI and other measures of fat mass
were summarized (Brandstetter, Klenk, Berg et al. under
revision). Data of 945 children (16 intervention schools:
n = 495; 16 control schools: n = 450) were analysed.
Multivariate analyses adjusted for baseline values showed
no statistically significant effect of the intervention on
BMI, but on waist circumference (-0.85 (95% confidence
interval (95% CI): -1.59 to -0.12) and subscapular
skinfold thickness (-0.64 (95% CI): -1.25 to -0.02)).
After additional adjustment for individual time lag between
baseline and follow-up, these effects were reduced in the
total group to -0.60 (95% CI: -1.25 to 0.05) and -0.61
(-1.26 to 0.04), respectively.
Intervention
The URMEL-ICE intervention is aiming at primary-
school children in their second grade. To ensure feasi-
bility of the programme, scientists of different disciplines
were supported by experienced school teachers. The so-
developed lecture material is integrated into the usual
curriculum and does not require additional lessons. Three
crucial risk factors for childhood overweight and obesity
are addressed by the intervention: physical activity, con-
sumption of sweetened beverages, and media use [10].
The intervention consists of 28 units for regular teaching
time spread over 36 weeks in one school year, regular
activity breaks, 6 family homework assignments that have
to be completed by the children and their parents and
information material for parents. Teachers were trained in
3 courses by a scientific coordinator to familiarize
themselves with the material and the implementation of
the intervention.
D. Kesztyus et al.
123
Data collection
Data collection included anthropometric measurements of
the children in a standardized manner and self-adminis-
tered questionnaires for the parents. The baseline data
collection T0 in the control group in Ulm took place at the
end of grade 1 and the beginning of grade 2 from May to
October 2006, and the follow-up data collection T1 one
year later from September to December 2007. Data col-
lection at T0 in the intervention group in Gunzburg was
completed in October 2008 with the beginning of the grade
2, and follow-up assessment T1 in October 2009 at the
beginning of grade 3. All data were checked for their
plausibility.
Questionnaires and derived variables
Parents received a self-completion questionnaire, inter alia
capturing data about early childhood and nutrition, physical
activity patterns and media use of the child.
The parental level of education and migration back-
ground were assessed, and parental body mass index (BMI)
was computed as weight (kilogram) divided by height
(meter) squared, as self-reported in the questionnaires, and
categorized as overweight (BMI C 25.0) and obesity
(BMI C 30.0), according to the international classification
of the World Health Organization (WHO) [11].
Teachers of the intervention group in Gunzburg were
asked to fill in weekly questionnaires, recording their
labour input to prepare the lessons. 32 of the participating
43 teachers documented their labour input, resulting in a
response rate of 74%.
Anthropometric measurements
Anthropometric measurements were taken by trained staff
according to a standardized protocol. Children were
examined in underwear without shoes. Height was mea-
sured to the nearest 0.1 cm (Ulm Stadiometer, Busse
Design, Ulm, Germany). Weight was measured to the
nearest 0.1 kg using calibrated and balanced portable dig-
ital scales (Seca, Hamburg, Germany).
Children’s BMI was computed as weight (kilogram)
divided by height (meter) squared, and overweight and
Enrollment
Follow-Up
Analysis
URMEL-ICE UlmAssessed for eligibility (n=1 427)
in 32 primary schools
Refused to participate (n=337) Refused to participate (n=308)
Allocation
Written consent (n=752)23 schools
Excluded from analysis due tomissing values (n=229)
Analysed (n=365)20 schools
Lost to follow-up (n=42)Lost to follow-up (n=97)
Allocated to control (n=579)within 16 schools
Written consent (n=1 119)32 schools
Randomly assignedAllocated to intervention (n=540)
within 16 schools
Excluded from analysis due tomissing values (n=183)
Analysed (n=354)16 schools
URMEL-ICE GünzburgAssessed for eligibility (n=1 089)
in 23 primary schools
Intervention (n=691)within 21 schools
Fig. 1 Flowchart for the participation and analysis in URMEL-ICE
Economic evaluation of school-based overweight prevention
123
obesity were defined using the cut-off points recommended
by the International Obesity Task Force (IOTF) [12].
Waist circumference (WC) was measured twice to the
nearest 0.1 cm at umbilicus level, using an executive
diameter tape (Seca, Hamburg, Germany), calculating the
average for the analysis. WC C 50th and WC [ 90th
percentile were defined according to the German data
presented by Schwandt et al. [13]. Waist-to-height ratio
(WHtR) was calculated by the ratio of WC, and height in
centimetres and participants with WhtR C 0.5 were
determined. Individual WHtR, WC and BMI differences
were computed. WHtR differences were multiplied by 102
to facilitate comparability, so one unit in the economic
analysis represents 0.01 WHtR.
In the Ulm control group, individual time lag between
baseline and follow-up was registered. Because of the
narrow time frame of the measurements in the Gunzburg
intervention group, a due date for each measurement T0
and T1 was set, and the time interval between these due
dates was defined as reference.
Statistical analyses
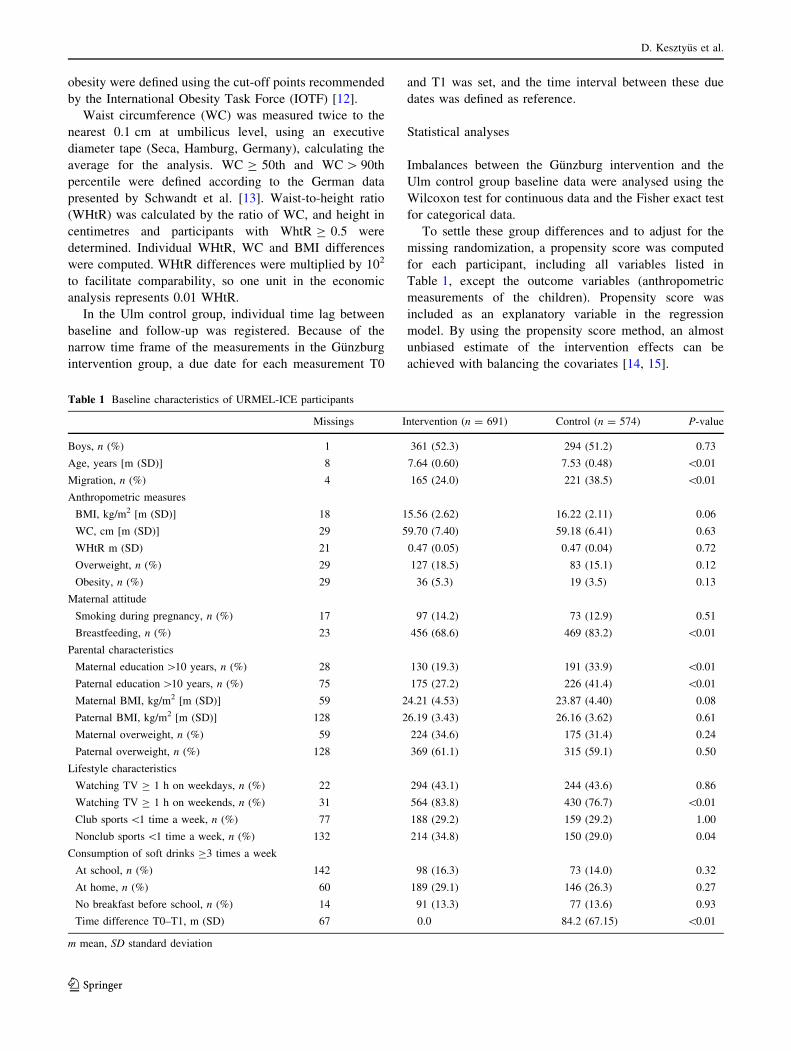
Imbalances between the Gunzburg intervention and the
Ulm control group baseline data were analysed using the
Wilcoxon test for continuous data and the Fisher exact test
for categorical data.
To settle these group differences and to adjust for the
missing randomization, a propensity score was computed
for each participant, including all variables listed in
Table 1, except the outcome variables (anthropometric
measurements of the children). Propensity score was
included as an explanatory variable in the regression
model. By using the propensity score method, an almost
unbiased estimate of the intervention effects can be
achieved with balancing the covariates [14, 15].
Table 1 Baseline characteristics of URMEL-ICE participants
Missings Intervention (n = 691) Control (n = 574) P-value
Boys, n (%) 1 361 (52.3) 294 (51.2) 0.73
Age, years [m (SD)] 8 7.64 (0.60) 7.53 (0.48) \0.01
Migration, n (%) 4 165 (24.0) 221 (38.5) \0.01
Anthropometric measures
BMI, kg/m2 [m (SD)] 18 15.56 (2.62) 16.22 (2.11) 0.06
WC, cm [m (SD)] 29 59.70 (7.40) 59.18 (6.41) 0.63
WHtR m (SD) 21 0.47 (0.05) 0.47 (0.04) 0.72
Overweight, n (%) 29 127 (18.5) 83 (15.1) 0.12
Obesity, n (%) 29 36 (5.3) 19 (3.5) 0.13
Maternal attitude
Smoking during pregnancy, n (%) 17 97 (14.2) 73 (12.9) 0.51
Breastfeeding, n (%) 23 456 (68.6) 469 (83.2) \0.01
Parental characteristics
Maternal education [10 years, n (%) 28 130 (19.3) 191 (33.9) \0.01
Paternal education [10 years, n (%) 75 175 (27.2) 226 (41.4) \0.01
Maternal BMI, kg/m2 [m (SD)] 59 24.21 (4.53) 23.87 (4.40) 0.08
Paternal BMI, kg/m2 [m (SD)] 128 26.19 (3.43) 26.16 (3.62) 0.61
Maternal overweight, n (%) 59 224 (34.6) 175 (31.4) 0.24
Paternal overweight, n (%) 128 369 (61.1) 315 (59.1) 0.50
Lifestyle characteristics
Watching TV C 1 h on weekdays, n (%) 22 294 (43.1) 244 (43.6) 0.86
Watching TV C 1 h on weekends, n (%) 31 564 (83.8) 430 (76.7) \0.01
Club sports \1 time a week, n (%) 77 188 (29.2) 159 (29.2) 1.00
Nonclub sports \1 time a week, n (%) 132 214 (34.8) 150 (29.0) 0.04
Consumption of soft drinks C3 times a week
At school, n (%) 142 98 (16.3) 73 (14.0) 0.32
At home, n (%) 60 189 (29.1) 146 (26.3) 0.27
No breakfast before school, n (%) 14 91 (13.3) 77 (13.6) 0.93
Time difference T0–T1, m (SD) 67 0.0 84.2 (67.15) \0.01
m mean, SD standard deviation
D. Kesztyus et al.
123

Individual differences between T0 and T1 in BMI, WC
and WHtR were the main outcome measures. To determine
the intervention effects on these outcome measures, the
clustering in schools was taken into account by computing
a two-level model with adjustment on propensity score and
the respective baseline value.
All above-mentioned analyses were carried out with
SAS 9.2 (SAS Institute, Cary, NC, USA). A P-value less
than 0.05 was considered as significant.
Assessment of intervention costs
A social perspective was used including all costs that were
directly incurred by the intervention. All prices were real
market prices, and the reference year was 2008 corre-
sponding to the year of the Gunzburg intervention.
All costs associated with the programme delivery were
assessed at the time of incurrence. Costs for the develop-
ment of the intervention materials as well as costs for the
scientific evaluation were not included, and only costs that
would incur with a repeated implementation, as described
by McAuley et al. [16], were to be assessed.
Average costs for hourly wages of primary-school
teachers were estimated using data from official statistics
of the state of Bavaria [17, 18]. Classroom time was not
included in the intervention costs because no additional
time was needed for the implementation, but the time
teachers spent on preparing the lessons with the interven-
tion materials and the time teachers were trained by the
scientific coordinator were counted.
Costs of the scientific coordinator for the training and
support of the teachers were included, and together with
the costs for the printed material, copies and postal charges
were added up to the fixed costs.
All costs were summed up and computed to costs per
class and then divided by the number of pupils in the
respective class at T0, assuming that all children were
reached by the intervention. This computation leads to an
individual cost parameter per participant, which was used
for the bootstrapping procedure.
No discounting was applied due to the relatively short
intervention period of 1 year.
Cost-effectiveness analysis
Standard methods of cost-effectiveness analysis were
applied. All cost-effectiveness analyses were carried out
with Stata 11 (StataCorp LP, College Station, TX, USA), the
mainly used modules bscer.do and bsceaprogs.do provided
by Glick et al. [19] in the Internet. Net benefit regression was
computed with SAS 9.2 (SAS Institute, Cary, NC, USA).
ICER, NMB and CEAC were computed on the basis of a
bootstrap sample derived from the data of the individual
cost parameter per participant as described above and the
unadjusted individual effect parameter WC and WHtR,
respectively.
The ICER is defined as the ratio of net intervention costs
and net intervention effects, with CI representing the
average costs per participant in the intervention group and
CC the average costs per participant in the control group,
which in this scenario equals null:
ICER :CI � CC
EI � EC
¼ DC
DE
Likewise, EI and EC represent the average effects in their
respective group.
The MWTP stands for the resources society is willing to
sacrifice in order to obtain a given benefit. In cost-effec-
tiveness analysis, this threshold is represented by k. To
transform health effects in monetary terms, net monetary
benefit is calculated:
NMB ¼ k � DE� DC
In case NMB [ 0, this is to be considered as positive [20].
The graphical representation of the acceptance of the
intervention in dependency on the MWTP is illustrated by
the cost-effectiveness acceptability curve (CEAC), a fur-
ther method to specify the uncertainty in estimates of cost-
effectiveness [21].
Finally, net benefit regression combines cost-effective-
ness methodology with statistical advances of regression
analysis, like covariate adjustment [22], which means in
this case propensity score adjustment.
Missing data, censoring
Common to observational studies is the problem of missing
data and loss to follow-up censoring. To examine baseline
differences between lost to follow-up records and records
used in the analyses, the Wilcoxon test for continuous data
or the Fisher exact test for categorical data were used. The
same applies for differences between records excluded due
to missing values and records used for analyses.
Sensitivity analysis
The number of parameters that could enter a sensitivity
analysis is restricted. Since the examination of cost-effec-
tiveness was conducted with real world data and no mod-
elling was applied, variables for sensitivity analysis are
mainly the respective differences in costs and effects.
All costs were precisely collected along the trial, and
there remains only a small possibility for variation
(teachers individual working time to prepare the lessons),
and no discount rate was used. The remaining variable of
interest for sensitivity analysis is the difference in effects,
Economic evaluation of school-based overweight prevention
123
whose influence on cost-effectiveness shall be tested at a
10, 20 and 30% lower value.
Results
Characteristics of the participants in intervention and
control group at baseline are presented in Table 1. From a
total of 1, 265 children at baseline, 655 (51.8%) were boys
and 610 (48.2%) were girls, with no significant difference
between the groups. Anthropometric baseline data showed
no significant differences.
Loss to follow-up, missing data
Participants who were lost to follow-up were older
(Gunzburg) or boys (Ulm), had higher BMI and WHtR
(Gunzburg) or lower BMI (Ulm), more often had a
migration background (Ulm), consumed more soft drinks at
school (Gunzburg) and watched TV more frequently on
weekdays (Ulm). Their mothers smoked more often during
pregnancy (Gunzburg).
Participants who were excluded from the analysis due to
missing values more often had a migration background
(Ulm, Gunzburg), more often were obese (Gunzburg), less
often had breakfast before school (Ulm), watched TV more
frequently on weekdays (Ulm, Gunzburg) and consumed
more soft drinks at home (Ulm). Fathers (Ulm) or mothers
(Gunzburg) had lower levels of education, and mothers
smoked more often during pregnancy (Ulm).
Intervention effects
For children in the intervention group, the unadjusted rel-
ative risk (RR) for incident overweight at follow-up (T1)
was 0.66 (95% confidence interval (CI) [0.39; 1.14]). The
unadjusted RR for incident WHtR C 0.5 at T1 was 0.51
(95% CI [0.29; 0.90], n = 1,077) and for incident
WC [ 90th percentile was 0.44 (95% CI [0.21; 0.90],
n = 1,085). All available data from the participants at
follow-up (n = 1,131) were used for these calculations.
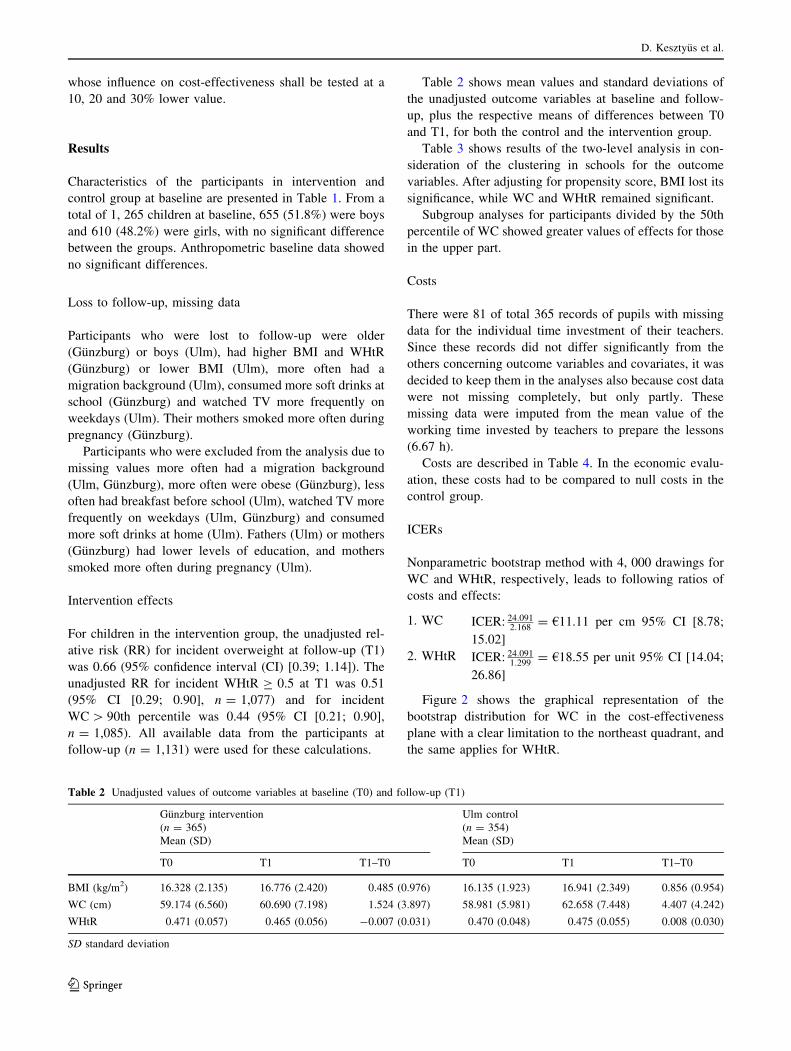
Table 2 shows mean values and standard deviations of
the unadjusted outcome variables at baseline and follow-
up, plus the respective means of differences between T0
and T1, for both the control and the intervention group.
Table 3 shows results of the two-level analysis in con-
sideration of the clustering in schools for the outcome
variables. After adjusting for propensity score, BMI lost its
significance, while WC and WHtR remained significant.
Subgroup analyses for participants divided by the 50th
percentile of WC showed greater values of effects for those
in the upper part.
Costs
There were 81 of total 365 records of pupils with missing
data for the individual time investment of their teachers.
Since these records did not differ significantly from the
others concerning outcome variables and covariates, it was
decided to keep them in the analyses also because cost data
were not missing completely, but only partly. These
missing data were imputed from the mean value of the
working time invested by teachers to prepare the lessons
(6.67 h).
Costs are described in Table 4. In the economic evalu-
ation, these costs had to be compared to null costs in the
control group.
ICERs
Nonparametric bootstrap method with 4, 000 drawings for
WC and WHtR, respectively, leads to following ratios of
costs and effects:
1. WC ICER: 24:0912:168
= €11.11 per cm 95% CI [8.78;
15.02]
2. WHtR ICER: 24:0911:299
= €18.55 per unit 95% CI [14.04;
26.86]
Figure 2 shows the graphical representation of the
bootstrap distribution for WC in the cost-effectiveness
plane with a clear limitation to the northeast quadrant, and
the same applies for WHtR.
Table 2 Unadjusted values of outcome variables at baseline (T0) and follow-up (T1)
Gunzburg intervention
(n = 365)
Mean (SD)
Ulm control
(n = 354)
Mean (SD)
T0 T1 T1–T0 T0 T1 T1–T0
BMI (kg/m2) 16.328 (2.135) 16.776 (2.420) 0.485 (0.976) 16.135 (1.923) 16.941 (2.349) 0.856 (0.954)
WC (cm) 59.174 (6.560) 60.690 (7.198) 1.524 (3.897) 58.981 (5.981) 62.658 (7.448) 4.407 (4.242)
WHtR 0.471 (0.057) 0.465 (0.056) -0.007 (0.031) 0.470 (0.048) 0.475 (0.055) 0.008 (0.030)
SD standard deviation
D. Kesztyus et al.
123

NMB and net benefit regression
The graphical representation of the NMB, concerning WC
in Fig. 3, computed on the bootstrap data, shows a positive
net benefit since at the point of intersection of the line with
the X-axis, with a willingness to pay of €11.11.
Observations in this graphic coincide with the parameter
intervention in the net benefit regression without adjust-
ment on propensity score. Table 5 shows parameters of the
net benefit regression in dependency on MWTP.
After adjustment, at a MWTP of €35 with an estimator of
€31.80 for the net benefit, both values of the corresponding
CI are located in the positive range (95% CI [3.91; 59.69]).
For WHtR, at a MWTP of €35, the estimator for the net
benefit amounts to €25.93 and the adjusted CI is located in
the positive range (95% CI [2.55; 49.31]).
The confidence intervals for the NMB for both WC and
WHtR are located in the positive range but reflect little
precision of the estimates.
Table 3 Multilevel analyses results of differences between control and intervention group for BMI, WC and WHtR
All (n = 719) Model 1
Adjusted for baseline value
Model 2
Adjusted for baseline value and propensity score
Estimator 95% CI Estimator 95% CI
BMI (kg/m2) -0.387 [-0.553; -0.221] -0.173 [-0.401; 0.056]
WC (cm) -2.163 [-2.741; -1.585] -1.544 [-2.448; -0.646]
WHtR -0.013 [-0.017; -0.009] -0.014 [-0.021; -0.007]
\50 percentile of WC (n = 388)
BMI (kg/m2) -0.273 [-0.447; -0.099] -0.177 [-0.431; 0.078]
WC (cm) -1.514 [-2.204; -0.823] -1.270 [-2.321; -0.218]
WHtR -0.009 [-0.015; -0.003] -0.012 [-0.021; -0.003]
C50 percentile of WC (n = 331)
BMI (kg/m2) -0.497 [-0.744; -0.250] -0.140 [-0.501; 0.221]
WC (cm) -2.881 [-3.869; -1.893] -1.850 [-3.465; -0.234]
WHtR -0.017 [-0.025; -0.010] -0.016 [-0.028; -0.004]
CI confidence limits
Table 4 One-year intervention
costs in 2008 EuroItem Quantity Unit costs Total cost
Teacher time
Training 3 times 2 h, 46 teachers 22.62/h 6,243.12
Prepare lessons Mean 6.57 h, 46 teachers 22.62/h 6,836.22
Scientific coordinator 40% of total working time 30,000.00/year 12,000.00
Work books and copies 46 classes 30.00/each 1,380.00
Postal charges 6 packages, 46 teachers 1.45/package 400.20
Total 26,859.54
Fig. 2 Incremental cost-effectiveness ratio (ICER) for waist circum-
ference. Scatter plot in the cost-effectiveness plane showing the mean
differences in costs and effects from the trial data using 4,000
bootstrap re-samples (differences based on intervention minus
control)
Economic evaluation of school-based overweight prevention
123

CEAC
The cost-effectiveness acceptability curve in Fig. 4 illus-
trates the estimates of the probability that net monetary
benefit is positive in dependency on the MWTP for WC in
the intervention group compared to the control group.
Since all cost-effectiveness pairs of the bootstrap sample
are located in the north-east quadrant of the cost-effec-
tiveness plane (more costly, more effective), the CEAC
intersects the Y-axis at 0%. For the same reason, the
present CEAC is an increasing function of MWTP and
asymptotes to 100% acceptability. 95% CI for the accept-
ability covers MWTP from €8.78 to €15.04.
The same applies for the CEAC for WHtR (95% CI
[€14.04; €26.87].
Sensitivity analysis
At a 10% lower difference in effects, the costs for a one-
centimetre change in WC lead to 11% higher costs:
ICER : 24:0911:951
= €12.35 per cm (25% higher costs for a 20%
change and 43% higher costs for a 30% change).
The same percentage of higher costs applies for changes
in effects in WHtR.
Discussion
Strengths and limitations
The strength of this investigation lies in the prospective
assessment of cost data and workload of the teachers,
which is important for the quality of the economic evalu-
ation. To account for the missing randomization, propen-
sity score adjustment is used to deal with observed
covariate differences and to obtain valid unbiased estimates
of the average causal effects [23].
The strength of the URMEL-ICE intervention lies first
within its uncomplicated implementation through teachers
in regular classes, thus reaching as many children as pos-
sible in an age group in a school-setting. Parental
involvement reinforces the efficacy. Second strength lies
within its multidirectional design aiming at three risk fac-
tors for the development of childhood overweight, namely
consumption of soft drinks, sedentary lifestyle and time
spent with screen media. According to the reviews of
Kropski et al. [24] and Livingstone et al. [25], school-based
multicomponent preventive measures have better chances
to be successful.
The first limitation that should be mentioned is the lack
of a parallel control group for the Gunzburg intervention.
The participants in the used control group from Ulm, tested
2 years earlier, showed some differences to the participants
of the Gunzburg intervention group concerning covariates,
but not baseline values of the outcome parameters. Thus,
the results of the study are exploratory findings and should
Fig. 3 Net monetary benefit (NMB) statistics for waist circumference
as a function of willingness to pay. The intersections of the net benefit
curves with the NMB = 0 axis define the point estimate and 95%
confidence interval on cost-effectiveness
Table 5 Net benefit regression for WC
Model Estimator
k = 0€ k = 15€ k = 30€
No treatment Reference Reference Reference
Intervention -23.32 -0.59 23.72
Intervention without
propensity score
-22.08 8.42 40.85
Propensity score 1.70 15.67 30.25
k = maximum willingness to pay MWTP
Fig. 4 Cost-effectiveness acceptability curve (CEAC) for waist
circumference showing the probability that the intervention is cost-
effective compared to the control (no intervention) under various
assumptions of willingness to pay
D. Kesztyus et al.
123

be interpreted as such. Further limitations are loss to fol-
low-up and missing values for analyses. The number of
missing data in this study was elevated due to the amount
of variables needed to compute the propensity score. This
was necessary for the adjustment for group differences and
influence factors.
Missing data and censoring may imply a form of
selection bias but, in the best case, only lessen the precision
of the study [15]. Even in the frequently cited study of
Wang et al. [26], a loss to follow-up from initial 1,203 to
641 participants in the end is reported.
Possible reasons for the better success in the Gunzburg
cohort than in the original Ulm cohort may lie in the fact
that teachers in Gunzburg were asked to fill in weekly
questionnaires to record their labour input to assess costs,
and this may have led to a more intensive engagement with
the implementation. Another fact is that all teachers in the
county of Gunzburg were advised to take part by their
supervisory school authority, whereas the Ulm cohort
consists only of teachers who decided to opt in on their
own, which may have led to a selection bias. So, the effects
in Ulm had a smaller size and would have needed more
participants to confirm the statistical evidence. And
although the regions in which the studies were conducted
are in close neighbourhood, there may be a number of
marginal differences, which in sum could have led to dif-
ferent effects.
Willingness to pay (WTP) versus quality-adjusted life
years (QALYs)
The URMEL-ICE intervention has significantly reduced
the growth of WC and WHtR in the participating children.
Costs of €11.11 per cm WC growth inhibited and €18.55
per unit (0.01) WHtR increase avoided show favourable
cost-effectiveness ratios.
The results of this investigation show clearly that pre-
vention of overweight and obesity in a school setting with
low financial input, achieved by implementing the inter-
vention in classrooms by teachers in regular lessons, can be
effective and cost-effective as well.
One possibility to decide whether an intervention is
cost-effective is to compare its costs to a threshold of the
WTP for a specific change in health status. The costs of
€24.09 (US$35.41) per child in the URMEL-ICE inter-
vention to cut incidence of WC [ 90th percentile and
WHtR C 0.5 by the half fall below the value of US$46.91
Cawley et al. [27] found in their contingent valuation
analysis of WTP for a 50% reduction of childhood obesity.
Though one should not forget that the costs of US$35.41
incurred per child (second grade) and the WTP of
US$46.91 is measured per adult individual (aged 18 and
over), it may not be compared directly. The MWTP values
mentioned in the economic evaluation of the URMEL-ICE
project remain hypothetical.
WTP and QALYs are alternative measures of the value
of reductions in health risk. The QALY assessment for
children is difficult, and the number of instruments suitable
for cost–utility or cost–benefit analyses is limited. One
reason is the inability of young children to value changes in
health directly and the potential biased valuation of proxy
respondents [28]. Only few authors report utility assess-
ment in children. A review carried out in 2008 by Tarride
et al. [29] identified 34 studies, most of them in the area of
cancer and using the Health Utility Index (HUI). None-
theless, some studies suggest a lower HRQoL for over-
weight and obese school children, measured with
instruments that do not support the generation of utility
weights [30–32].
Cost and risk reduction through lower WC and WHtR
BMI is the accepted standard index for the definition of
overweight and obesity, but BMI does not differentiate
between overweight due to increased muscle and fat mass.
A great deal of adolescents (32.1% of females and 42% of
males) who were classified as overweight or obese due to
their BMI did not have truly high adiposity [33]. So the
effectiveness of programmes comprising physical educa-
tion, where an increase in muscle mass or the transfor-
mation of fat mass into muscles is part of the effect cannot
be measured exactly via BMI. For the measurement of fat
distribution, measures like WC and WHtR that take
abdominal fat tissue into account are more suitable.
Especially visceral fat accumulation holds higher risk of
metabolic syndrome and is associated with increased
secretion of free fatty acids, hyperinsulinemia, insulin
resistance, hypertension and dyslipidemia [33, 34]. The
new IDF (International Diabetes Association) definition of
at-risk groups and of metabolic syndrome in children and
adolescents uses WC C 90th percentile as the main and
essential component [35]. WC may even be a helpful
parameter in identifying prepubertal children with higher
cardiovascular risk [36]. Maffeis et al. [37] found out that
each centimetre increase in WC at the age of 8 years
doubled the risk of having 20% greater BMI 4 years later.
They consider WC as a promising index to assess adiposity
as well as to make a prognosis.
The same applies to WHtR. Ashwell and Hsieh [38]
publicized six reasons why WHtR is a rapid and effective
global indicator for health risks of obesity and how it could
simplify the health message on obesity. There are some
studies that prove WHtR is also a suitable risk predictor for
children and adolescents [39–41].
Greater WC has been shown to be associated with
excess burden of ill health. Cornier et al. [42] provided
Economic evaluation of school-based overweight prevention
123
evidence that WC but not BMI significantly correlates with
total health care charges in a population sample from
outpatient medical clinics in Denver, USA. The highest
costs were incurred in the group with the highest WC
quartile. Similar results come from Hojgaard et al. [43]
who conducted a prospective cohort study with almost 32,
000 participants. They found out that WC is a more sen-
sitive measure than BMI to identify individuals who will
cause higher future health care costs. In this study popu-
lation in Denmark, health care costs rose at a rate of 1.25%
in women and 2.08% in men per added centimetre of WC
above normal waistline [44]. Hence, it can be assumed that
the deceleration in growth of WC and the reduction in
WHtR in primary-school children, achieved by the UR-
MEL-ICE intervention, support the prevention of future
health care costs and the reduction of health risks.
Conclusion and perspective
School-based health promotion programmes are an
important component in the effort to make children
healthier. The URMEL-ICE experience shows that these
programmes can be effective and that teachers are qualified
to motivate pupils to change their lifestyle. Society, gov-
ernment and school authorities should not hesitate to invest
in an early beginning of structured health promotion.
URMEL-ICE offers a promising concept, but further
research in form of randomized controlled trials for more
precision has to be done.
Whether the deceleration in the growth of WC and
WHtR persists cannot be foreseen. But regarding the
growing necessity for action on the one hand and the need
for further investigation on the other hand, as it is requested
by almost every scientist working in the field of childhood
overweight and obesity, there is no time to waste but to
search for effective, easy-to-implement solutions for low
budgets. Accordingly, the URMEL-ICE intervention was
revised and expanded on four grades of primary school.
Starting in September 2010, about 160 classes in primary
schools in the state of Baden-Wurttemberg with approxi-
mately 2,000 children are implementing the intervention
and are taking part in a randomized trial to evaluate its
impact. All cost data and HRQoL will be assessed for
further reports of cost-effectiveness.
Acknowledgments URMEL-ICE Ulm was funded by the Baden-
Wurttemberg Stiftung, and URMEL-ICE Gunzburg was funded by
the county of Gunzburg and the community foundation of the county.
We like to thank all who supported the URMEL-ICE Gunzburg
project, namely the district administrator H. Hafner and his staff
members from the district administration, Dr. Dr. W. Stolle and the
members of the community foundation, Dr. R. Schmid from the
medical authority, H. Hillenbrand from the AOK Gunzburg, and
J. Seibold from the local education authority. Many thanks for their
contributions to B. Aigner and the students of the school of physio-
therapy in Gunzburg. Special thanks to S. Sufeida for the data man-
agement. Thanks to all members of the ‘‘Komm mit in das Gesunde
Boot–Grundschule’’ working group for their input. Thanks to all
members of the former URMEL-ICE working group. Thanks to V.
and C. Friedl for their language assistance. Finally, we thank the
teachers and pupils who participated in the study.
References
1. Trasande, L.: How much should we invest in preventing child-
hood obesity? Health Aff. (Millwood) 29, 372–378 (2010)
2. Daniels, S.R.: The consequences of childhood overweight and
obesity. Future Child 16, 47–67 (2006)
3. Fry, J., Finley, W.: The prevalence and costs of obesity in the EU.
Proc. Nutr. Soc. 64, 359–362 (2005)
4. Finkelstein, E.A., Ruhm, C.J., Kosa, K.M.: Economic causes and
consequences of obesity. Annu. Rev. Public Health 26, 239–257
(2005)
5. Froschl, B., Haas, S., Wirl, C.: Overweight prevention in ado-
lescents and children (behavioural and environmental preven-
tion). Cologne: German agency for health technology assessment
(DAHTA). pp. 1–10. http://portal.dimdi.de/hta/hta_berichte/hta
242_bericht_de.pdf (2009). Accessed 14 June 2011
6. Schwappach, D.L.B.: The economic evaluation of prevention–
let’s talk about values and the case of discounting. Int. J. Public
Health 52, 335–336 (2007)
7. John, J., Wenig, C.M., Wolfenstetter, S.B.: Recent economic
findings on childhood obesity: cost-of-illness and cost-effective-
ness of interventions. Curr. Opin. Clin. Nutr. Metab. Care (2010).
doi:10.1097/MCO.0b013e328337fe18
8. Nething, K., Stroth, S., Wabitsch, M., Galm, C., Rapp, K.,
Brandstetter, S., Berg, S., Kresz, A., Wartha, O., Steinacker, J.M.:
Primarpravention von Folgeerkrankungen des Ubergewichts bei
Kindern und Jugendlichen [Primary prevention of sequelae of
adiposity in children and adolescents]. Dtsch. Z. Sportmed. 2,
42–45 (2006)
9. Nagel, G., Wabitsch, M., Galm, C., Berg, S., Brandstetter, S.,
Fritz, M., et al.: Determinants of obesity in the Ulm research on
metabolism, exercise and lifestyle in children (URMEL-ICE).
Eur. J. Pediatr. 168, 1259–1267 (2009)
10. Ebbeling, C.B., Pawlak, D.B., Ludwig, D.S.: Childhood obesity:
public-health crisis, common sense cure. Lancet 360, 473–482
(2002)
11. World Health Organization. Obesity and overweight. WHO.
http://www.who.int/dietphysicalactivity/media/en/gsfs_obesity.pdf
(2003). Accessed 14 June 2011
12. Cole, T.J., Bellizzi, M.C., Flegal, K.M., Dietz, W.H.: Establish-
ing a standard definition for child and obesity worldwide: inter-
national survey. BMJ 320, 1240–1243 (2000)
13. Schwandt, P., Kelishadi, R., Haas, G.M.: First reference curves of
waist circumference for German children in comparison to
international values: the PEP Family Heart STudy. World J.
Pediatr. 4, 259–266 (2008)
14. D’Agostino, R.B.: Propensity score methods for bias reduction in
the comparison of a treatment to a non-randomized control group.
Stat. Med. 17, 2265–2281 (1998)
15. Morshed, S., Tornetta, P., Bhandari, M.: Analysis of observa-
tional studies: a guide to understanding statistical methods.
J. Bone Jt. Surg 91, 50–60 (2009)
16. McAuley, K.A., Taylor, R.W., Farmer, V.L., Hansen, P., Wil-
liams, S.M., Booker, C.S., et al.: Economic evaluation of a
D. Kesztyus et al.
123
community based obesity prevention program in children: the
APPLE project. Obesity 18, 131–136 (2010)
17. Bayerisches Landesamt fur Statistik und Datenverarbeitung.
Volksschulen in Bayern [Elementary schools in Bavaria]. Mun-
chen: Bayerisches Landesamt fur Statistik und Datenverarbeitung;
LfStaD. http://www.statistik.bayern.de/veroeffentlichungen/
?themenbereich=3200 (2009). Accessed 14 June 2011
18. Landesamt fur Finanzen. Besoldungstabellen Archiv [Salary tables
archive]. http://www.lff.bayern.de/bezuege/besoldung/ (2009).
Accessed 14 June 2011
19. Glick, H.A., Doshi, J.A., Sonnad, S.S., Polsky, D.: Web resour-
ces. In: Gray, A., Briggs, A. (eds.) Economic evaluation in
clinical trials, vol. 5 of Handbooks in Health Economic Evalua-
tion Series, p. vii. Oxford University Press (2007)
20. Kilian, R.: Gesundheitsokonomische Evaluation in der psychiat-
rischen Versorgungsforschung. [Health economic evaluation in
mental health services research]. Prav. Gesundheitsf. 3, 135–144
(2008)
21. Fenwick, E., Byfort, S.: A guide to cost-effectiveness accept-
ability curves. Br. J. Psychiatry 187, 106–108 (2005)
22. Hoch, J.S.: Improving efficiency and value in palliative care with
net benefit regression: an introduction to a simple method for
cost-effectiveness analysis with personal level data. J. Pain
Symptom Manag. 38, 54–61 (2009)
23. Indurkhya, A., Mitra, N., Schrag, D.: Using propensity scores to
estimate the cost-effectiveness of medical therapies. Stat. Med.
25, 1561–1576 (2006)
24. Kropski, J.A., Keckley, P.H., Jensen, G.L.: School-based obesity
prevention programs: an evidence-based review. Obesity (Silver
Spring) 16, 1009–1018 (2008)
25. Livingstone, M.B.E., McCaffrey, T.A., Rennie, K.L.: Childhood
obesity prevention studies: lessons learned and to be learned.
Public Health Nutr. 9, 1121–1129 (2006)
26. Wang, L.Y., Yang, Q., Lowry, R., Wechsler, H.: Economic
analysis of a school-based obesity prevention program. Obes.
Res. 11, 1313–1324 (2003)
27. Cawley, J.: Contingent valuation analysis of willingness to pay to
reduce childhood obesity. Econ. Hum. Biol. 6, 281–292 (2008)
28. Prosser, L.A., Hammitt, J.K., Keren, R.: Measuring health pref-
erences for use in cost-utility and cost-benefit analyses of inter-
ventions in children: theoretical and methodological
considerations. Pharmacoeconomics 25, 713–726 (2007)
29. Tarride, J.E., Burke, N., Bischof, M., Hopkins, R.B., Goeree, L.,
Campbell, K., et al.: A review of health utilities across conditions
common in paediatric and adult populations. Health Qual. Life
Outcomes. 8, 12 (2010)
30. Williams, J., Wake, M., Hesketh, K., Maher, E., Waters, E.:
Health-related quality of life of overweight and obese children.
JAMA. 293, 70–76 (2005)
31. Wille, N., Erhart, M., Petersen, C., Ravens-Sieberer, U.: The
impact of overweight and obesity on health-related quality of life
in childhoodresults from an intervention study. BMC. Public
Health. 8, 421 (2008)
32. Wake, M., Salmon, L., Waters, E., Wright, M., Hesketh, K.:
Parent-reported health status of overweight and obese Australian
primary school children: a cross-sectional population survey. Int.
J. Obes. Relat. Metab. Disord. 26, 717–724 (2002)
33. Rodrıguez, G., Moreno, L.A., Blay, M.G., Blay, V.A., Garagorri,
J.M., Sarrıa, A., et al.: Body composition in adolescents: mea-
surements and metabolic aspects. Int. J. Obes. Relat. Metab.
Disord. 28, S54–S58 (2004)
34. Schneider, H.J., Friedrich, N., Klotsche, J., Pieper, L., Nauck, M.,
John, U., et al.: The predictive value of different measures of
obesity for incident cardiovascular events and mortality. J. Clin.
Endocrinol. Metab. 95, 1777–1785 (2010)
35. Zimmet, P., Alberti, G., Kaufman, F., Tajima, N., Silink, M.,
Arslanian, S., et al.: The metabolic syndrome in children and
adolescents. Lancet 369, 2059–2061 (2007)
36. Maffeis, C., Pietrobelli, A., Gressani, A., Provera, S., Tato, L.:
Waist circumference and cardiovascular risk factors in prepu-
bertal children. Obes. Res. 9, 179–187 (2001)
37. Maffeis, C., Grezzani, A., Pietrobelli, A., Provera, S., Tato, L.:
Does waist circumference predict fat gain in children? Int.
J. Obes. Relat. Metab. Disord. 25, 978–983 (2001)
38. Ashwell, M., Hsieh, S.D.: Six reasons why the waist-to-height ratio
is a rapid and effective global indicator for health risks of obesity
and how its use could simplify the international public health
message on obesity. Int. J. Food Sci. Nutr. 56, 303–307 (2005)
39. Kahn, H., Imperatore, G., Cheng, Y.J.: A population-based
comparison of BMI percentiles and waist-to-height ratio for
identifying cardiovascular risk in youth. J. Pediatr. 146, 482–488
(2005)
40. Savva, S.C., Tornaritis, M., Savva, M.E., Kourides, Y., Panagi,
A., Silikiotou, N., et al.: Waist circumference and waist-to-height
ratio are better predictors of cardiovascular disease risk factors in
children than body mass index. Int. J. Obes. Relat. Metab. Disord.
24, 1453–1458 (2000)
41. Mokha, J.S., Srinivasan, S.R., Dasmahaptra, P., Fernandez, C.,
Chen, W., Xu, J., et al.: Utility of waist-to-height ratio in
assessing the status of central obesity and related cardiometabolic
risk profile among normal weight and overweight/obese children:
the Bogalusa Heart Study. BMC. Pediatr. 10, 73 (2010)
42. Cornier, M.A., Tate, C.W., Grundwald, G.K., Bessesen, D.H.:
Relationship between waist circumference, body mass index, and
medical care costs. Obes. Res. 10, 1167–1172 (2002)
43. Højgaard, B., Gryd-Hansen, D., Olsen, K.R., Søgaard, J.,
Sørensen, T.I.A.: Waist circumference and body mass index as
predictors of health care costs. PLoS One. 3, e2619 (2008)
44. Højgaard, B., Olsen, K.R., Søgaard, J., Sørensen, T.I.A., Gryd-
Hansen, D.: Economic costs of abdominal obesity. Obes. Facts. 1,
146–154 (2008)
Economic evaluation of school-based overweight prevention
123