economic footprint of oil production
TRANSCRIPT

Economic Footprint of Oil Production

Production

The Second Biggest Industry in MT

Production

Production80%

Production92%

Production100%

Fuels Production
Value of Fuels Produced: $7.3 Billion
50% of MT’s Total Manufacturing Production
10% of MT’s Total Industrial Production

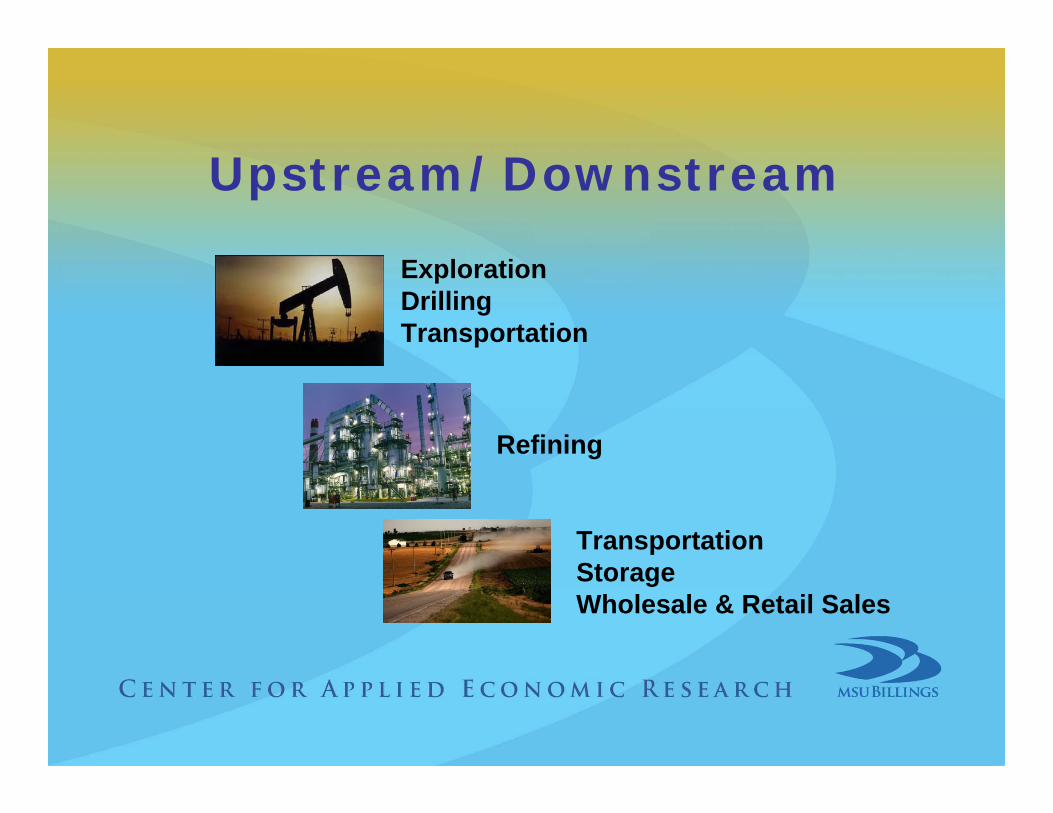
Upstream/Downstream
ExplorationDrillingTransportation

Upstream/Downstream
ExplorationDrillingTransportation
Refining
Upstream/Downstream
ExplorationDrillingTransportation
TransportationStorageWholesale & Retail Sales
Refining

Best Paying IndustriesRefining $ 91,744 Securities, comm. contracts, investments $ 89,515 Oil and gas extraction $ 75,983 Mining, except oil and gas $ 68,619 Utilities $ 66,412 Pipeline transportation $ 64,487 Support activities for mining $ 64,052 Federal Government $ 57,390 Chemical manufacturing $ 54,932 Electronic markets & agents and brokers $ 54,160
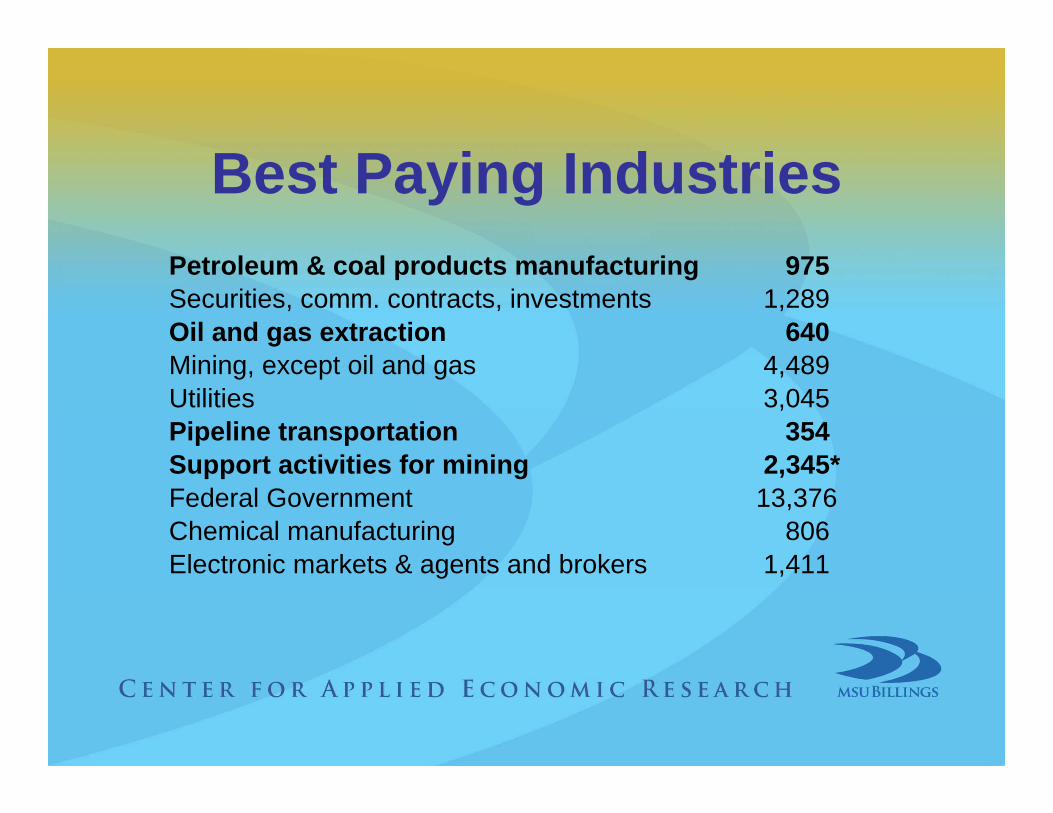
Best Paying IndustriesPetroleum & coal products manufacturing 975 Securities, comm. contracts, investments 1,289 Oil and gas extraction 640 Mining, except oil and gas 4,489 Utilities 3,045 Pipeline transportation 354 Support activities for mining 2,345* Federal Government 13,376 Chemical manufacturing 806 Electronic markets & agents and brokers 1,411

For Each 1 Mill Barrel Increase in Oil Production…
Added Sales $73 MillionAdded Jobs 86 JobsAdded Wages $18 Million

Consumption

Petroleum Products Industrial Consumption
Total Demand: $2.25 Billion
3% of Total Value of Outputs

Which Industry Sectors Use The Most Petroleum Fuels?

Petroleum Fuels Consumption 2006
Businesses $2,250 Million
Government $70 Million
Households $600 Million
2006

Petroleum Fuels Consumption 2008
Businesses $2,250 Million………$3,150 Million
Government $70 Million……… $100 Million
Households $600 Million……… $840 Million
2006 2008

Percent of Household Spending
Gas/Fuel Oil/Propane 6%Food 14%Rent or Home Payment 29%New or Used Vehicle 8%

12 Month Price Changes
Gas/Fuel Oil/Propane 38%Food 6.0%Rent or Home Payment 2.6%New or Used Vehicle -0.3%
Overall Inflation Rate 5.6%

Gas/Fuel Oil/Propane 7%Food 15%Rent or Home Payment 31%New or Used Vehicle
Percent of Household Spending

Gas/Fuel Oil/Propane 10%Food 22%Rent or Home PaymentNew or Used Vehicle
Overall Inflation Rate 6.2%
Percent of Household Spending

Thank You