economic freedom: global and regional patterns · economic freedom: global and regional patterns...
TRANSCRIPT

21
Chapter 2
Economic Freedom: Global and Regional Patterns
Anthony B. Kim
The struggle for greater economic freedom has intensified this year as governments have had to cope simultaneously with a
financial crisis and slower world growth, and in some cases political instability and unsustain-able levels of debt as well. The temptation for some has been to impose ever greater controls, eroding previous gains in economic freedom. As a result, the global average economic freedom score has declined by 0.2 point in the 2012 Index.
Of the 179 economies graded in the 2012 Index, only five have sustained very high freedom scores of 80 or more, putting them in the “free” category. Canada has dropped into the “mostly free” category this year, joining 22 other coun-tries at that level. Thus, a total of only 28 coun-tries, or about 16 percent of all countries graded, have economic systems in which individuals enjoy substantial levels of freedom.
At the opposite end of the scale, the number of countries with scores (below 50) that rank them as “repressed” also declined, from 32 to just 29.
The largest portion of the countries graded—112
Sources: Terry Miller, Kim R. Holmes, and Edwin J. Feulner, 2012 Index of Economic Freedom (Washington, D.C.: The Heritage Foundation and Dow Jones & Company, Inc., 2012), at www.heritage.org/index.
Chart 1 heritage.org
Global Distribution ofEconomic Freedom
Number of Countries in Each Category
2011 Index 2012 Index
Free MostlyFree
Moderately Free
Mostly Unfree
Repressed
6
2723
5762
57 60
32 29
5

22 2012 Index of Economic Freedom
Property RightsFreedom from
Corruption
Fiscal FreedomGovernment
Spending
Business FreedomLabor FreedomMonetary Freedom
Trade FreedomInvestment FreedomFinancial Freedom
Score Changes
RULE OF LAW LIMITED GOVERNMENT
REGULATORY EFFICIENCY OPEN MARKETS
–0.2–0.1
+0.6–4.1
+0.40
+1.0
–0.3+0.5+0.1
Business FreedomLabor Freedom
Monetary Freedom
REGULATORY EFFICIENCY
OPENMARKETS
Trade FreedomInvestment Freedom
Financial Freedom
LIMITED GOVERNMENT
Fiscal FreedomGovernment Spending
RULE OF LAW Property RightsFreedom from Corruption
0 20 40 60 80 100
0 20 40 60 80 100
0 20 40 60 80 100
0 20 40 60 80 100
43.440.4
76.959.8
64.761.474.4
74.550.748.6
The Ten Economic Freedoms: A Global Look
Global trade freedom is stuck in neutral or, even worse, may actually be rolling backward. Al-though progress was uneven, investment freedom advanced in the 2012 Index. Overall, the average financial freedom score remained essentially unchanged from the past year. Despite some progress toward stability, the global financial system has been under considerable strain, in large part because of the ongoing European sovereign debt turmoil.
Many economies have continued to streamline and modernize their business frameworks. Globally, starting a business takes seven procedures and 30 days, while completing licensing requirements takes an average of 194 days. For the world as a whole, labor reform progress has considerably slowed. The 2012 Index registered a continued improvement in monetary freedom as a result of reduced inflationary pressures.
The average top individual income tax rate is 28.6 percent, and the average top corporate tax rate is 24.8 percent. The average overall tax burden as a percentage of GDP is 23 percent. The average level of government spending as a percentage of GDP is 35.2 percent. Many govern-ments have run budget deficits in recent years, with rising public debt. The average level of gross public debt as a percentage of GDP in advanced economies is over 90 percent.
The rule of law has weakened. The global economy has been in tumultuous times, and there have been a number of large scale demonstrations around the world. Some governments con-tinue to justify expropriations and nationalizations on the basis of the ongoing financial and economic turmoil. Thirteen countries’ property rights scores declined. Scores for freedom from corruption continue to lag behind those of other components of economic freedom.

Chapter 2 23
economies—have freedom scores between 50 and 70. Of those, 62 economies are “moderately free” (scores of 60–70), and 60 are “mostly unfree” (scores of 50–60).
As shown in “The Ten Economic Freedoms: A Global Look” on the previous page, the decline of economic freedom was most pronounced in the area of respect for limited government. The soundness of public finance has severely dete-riorated, particularly in advanced economies, as a result of years of heavy government spending that has led to rising levels of public debt and eco-nomic stagnation. Scores also fell overall in the category of rule of law due to intensified corrup-tion and the erosion of respect for property rights. Overall, scores for most of the economic freedoms related to regulatory efficiency and open markets improved slightly, although labor freedom record-ed no score change and trade freedom declined. The largest average gain was in monetary freedom,
with many countries enhancing monetary stabil-ity by getting inflationary pressure under control.
regional variationsEach of the world’s regions has registered at
least one country that is ranked among the top 20 freest economies in the 2012 Index. Average levels of economic freedom, however, vary wide-ly among the regions, and there are some stark differences in regional economic performance. Indeed, countries often share certain character-istics—cultural, geographical, historical, or oth-ers—with their regional neighbors that may help to shed light on the particular challenges to eco-nomic freedom that their citizens face. As shown in Chart 2, economic freedom varies noticeably by region, with inhabitants of North America and Europe continuously enjoying greater levels of economic freedom than those who live in other regions of the world.
50
55
60
65
70
75
80
85
768 million 3.7 billion
813 million
443 million
768 million 3.7 billion
460 million334 million
813 million
443 million
Sub-SaharanAfrica53.7
Asia-Pacific57.5
Middle East/North Africa
59.9
South and Central
America/Caribbean
60.0
Europe66.1
NorthAmerica
73.8
Sub-SaharanAfrica53.7
Asia-Pacific57.5
Middle East/North Africa
59.9
South and Central
America/Caribbean
60.0
Europe66.1
NorthAmerica
73.8
Sources: Terry Miller, Kim R. Holmes, and Edwin J. Feulner, 2012 Index of Economic Freedom (Washington, D.C.: The Heritage Foundation and Dow Jones & Company, Inc., 2012), at www.heritage.org/index, and International Monetary Fund, World Economic Outlook Databases, at http://www.imf.org/external/ns/cs.aspx?id=28 (November 21, 2011).
Chart 2 heritage.org
Economic Freedom by Region, with Population
Index of Economic Freedom Score
Circle sizes are relative to region’s population = 500 million people

24 2012 Index of Economic Freedom
In every region, economic freedom is the key to greater opportunity and prosperity. Despite varying degrees of economic freedom across the regions, the relationship between economic freedom and prosperity is consistent within the regions: Per capita incomes are much higher in countries that are economically free. (See Chart 3.)
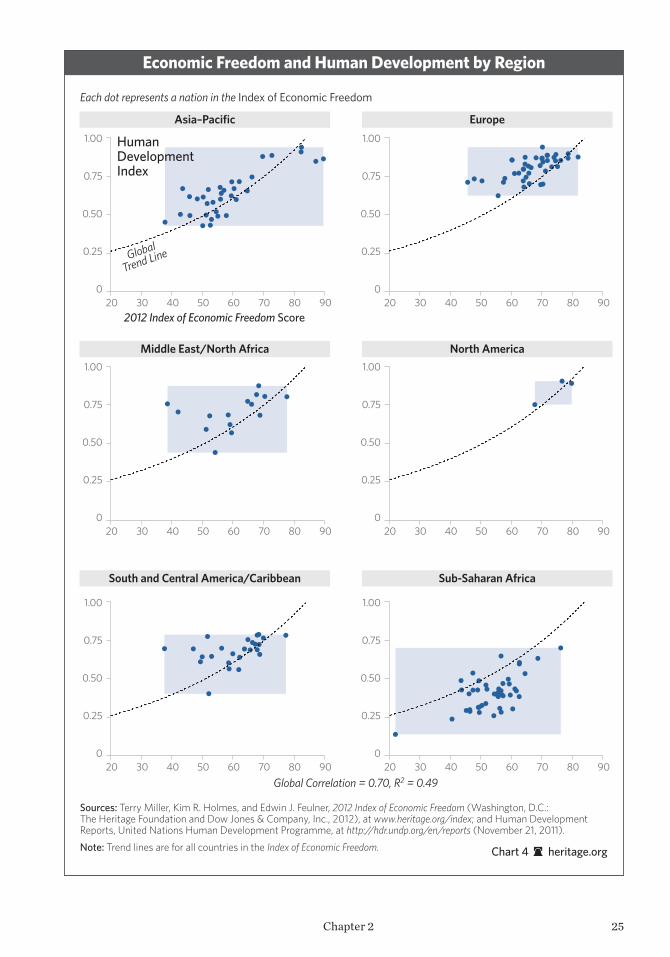
Not surprisingly, overall human development also thrives in an environment that is economi-cally free. Economic freedom is about more than a business environment in which entrepreneur-ship and prosperity can flourish. Across all of the regions, as demonstrated in Chart 4, higher eco-nomic freedom induces greater overall human development as measured by the United Nations Human Development Index, which assesses the combined progress of life expectancy, literacy, education, and the standard of living.
diverging regional patternsWhile the global average score for the 2012
Index has declined over the past year, economic freedom has continued to advance in the Sub-Saharan Africa and Asia–Pacific regions.
The North America region recorded the larg-est score decline of 1.3 points, with every coun-try in the region losing more than half a point. Europe and the Middle East and North Africa regions tied for the second greatest loss of eco-nomic freedom on average, down seven-tenths of a point. The South and Central America/Carib-bean region also showed a score decline of 0.2 point. (See Chart 5.)
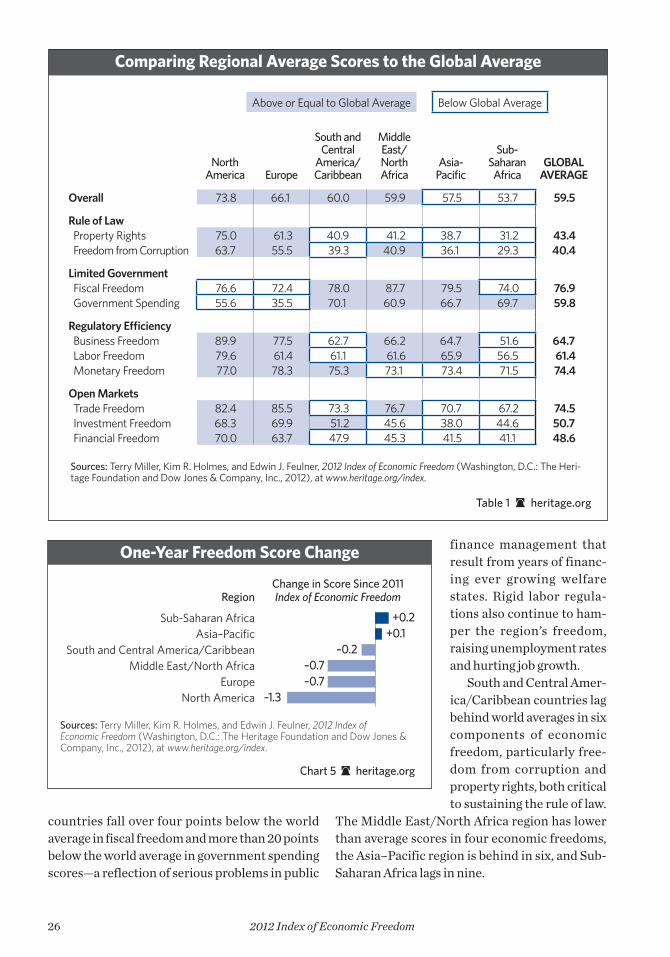
Table 1 shows components of economic free-dom in which regions perform better or worse than the world averages.
Every region has two or more components in which the average level of economic freedom falls below the world average. The North Amer-ica region recorded considerable drops in fiscal freedom and the scores for government spend-ing, both of which trail world averages. European
$0
$10,000
$20,000
$30,000
$40,000
$50,000
$40,830
$25,198
$8,989
$13,595
$3,400$1,514
Five Most Free Five Least Free
Europe Asia-Pacific Middle East and North Africa
Americas Sub-Saharan Africa
$7,885 $8,243
$46,593
Sources: Terry Miller, Kim R. Holmes, and Edwin J. Feulner, 2012 Index of Economic Freedom (Washington, D.C.: The Heritage Foundation and Dow Jones & Company, Inc., 2012), at www.heritage.org/index; World Bank Group, World Development Indicators Online, at http://econ.worldbank.org/WBSITE/EXTERNAL/EXTDEC/0,,menuPK:476823~pagePK:64165236~piPK:64165141~theSitePK:469372,00.html (November 4, 2011); and International Monetary Fund, World Economic Outlook Databases, at http://www.imf.org/external/ns/cs.aspx?id=28 (November 4, 2011).
Chart 3 heritage.org
Per Capita Income by Region
GDP per Capita (Purchasing Power Parity)
$39,063
Chapter 2 25
Sources: Terry Miller, Kim R. Holmes, and Edwin J. Feulner, 2012 Index of Economic Freedom (Washington, D.C.: The Heritage Foundation and Dow Jones & Company, Inc., 2012), at www.heritage.org/index; and Human Development Reports, United Nations Human Development Programme, at http://hdr.undp.org/en/reports (November 21, 2011).
Note: Trend lines are for all countries in the Index of Economic Freedom.
Global Correlation = 0.70, R2 = 0.49
Sub-Saharan AfricaSouth and Central America/Caribbean
North AmericaMiddle East/North Africa
Europe
2012 Index of Economic Freedom Score
Asia–Pacific
Global
Trend Line
Each dot represents a nation in the Index of Economic Freedom
Chart 4 heritage.org
Economic Freedom and Human Development by Region
0
0.25
0.50
0.75
1.00
20 30 40 50 60 70 80 90
0
0.25
0.50
0.75
1.00
20 30 40 50 60 70 80 900
0.25
0.50
0.75
1.00
20 30 40 50 60 70 80 90
0
0.25
0.50
0.75
1.00
20 30 40 50 60 70 80 90
0
0.25
0.50
0.75
1.00
20 30 40 50 60 70 80 900
0.25
0.50
0.75
1.00
20 30 40 50 60 70 80 90
Human Development Index
26 2012 Index of Economic Freedom
countries fall over four points below the world average in fiscal freedom and more than 20 points below the world average in government spending scores—a reflection of serious problems in public
finance management that result from years of financ-ing ever growing welfare states. Rigid labor regula-tions also continue to ham-per the region’s freedom, raising unemployment rates and hurting job growth.
South and Central Amer-ica/Caribbean countries lag behind world averages in six components of economic freedom, particularly free-dom from corruption and property rights, both critical to sustaining the rule of law.
The Middle East/North Africa region has lower than average scores in four economic freedoms, the Asia–Pacific region is behind in six, and Sub-Saharan Africa lags in nine.
Sub-Saharan AfricaAsia–Pacific
South and Central America/CaribbeanMiddle East/North Africa
EuropeNorth America –1.3
–0.7–0.7
–0.2+0.1
+0.2
Sources: Terry Miller, Kim R. Holmes, and Edwin J. Feulner, 2012 Index of Economic Freedom (Washington, D.C.: The Heritage Foundation and Dow Jones & Company, Inc., 2012), at www.heritage.org/index.
Change in Score Since 2011 Index of Economic FreedomRegion
Chart 5 heritage.org
One-Year Freedom Score Change
Comparing Regional Average Scores to the Global Average
Table 1 heritage.org
North America Europe
South and Central
America/ Caribbean
Middle East/ North Africa
Asia-Pacifi c
Sub-Saharan Africa
GLOBAL AVERAGE
Overall 73.8 66.1 60.0 59.9 57.5 53.7 59.5
Rule of Law Property Rights 75.0 61.3 40.9 41.2 38.7 31.2 43.4 Freedom from Corruption 63.7 55.5 39.3 40.9 36.1 29.3 40.4
Limited Government Fiscal Freedom 76.6 72.4 78.0 87.7 79.5 74.0 76.9 Government Spending 55.6 35.5 70.1 60.9 66.7 69.7 59.8
Regulatory E� ciency Business Freedom 89.9 77.5 62.7 66.2 64.7 51.6 64.7 Labor Freedom 79.6 61.4 61.1 61.6 65.9 56.5 61.4 Monetary Freedom 77.0 78.3 75.3 73.1 73.4 71.5 74.4
Open Markets Trade Freedom 82.4 85.5 73.3 76.7 70.7 67.2 74.5 Investment Freedom 68.3 69.9 51.2 45.6 38.0 44.6 50.7 Financial Freedom 70.0 63.7 47.9 45.3 41.5 41.1 48.6
Above or Equal to Global Average Below Global Average
Sources: Terry Miller, Kim R. Holmes, and Edwin J. Feulner, 2012 Index of Economic Freedom (Washington, D.C.: The Heri-tage Foundation and Dow Jones & Company, Inc., 2012), at www.heritage.org/index.

Chapter 2 27
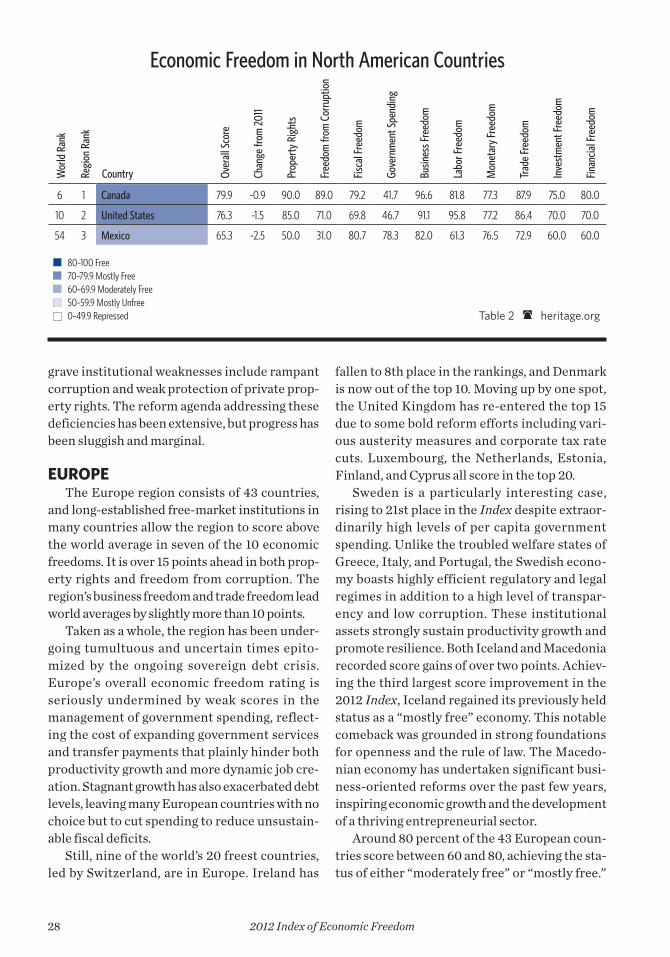
nortH americaNorth America’s three countries have been
linked by a regional trade agreement, the North American Free Trade Agreement (NAFTA), since 1994. NAFTA has been a positive force, connecting more than 400 million people in an economic area with about one-third of the world’s total GDP.
The North America region has long ben-efited from its openness to international trade and investment. Although it enjoys the high-est degree of economic freedom among the six regions, its overall economic freedom score has been declining in recent years, and there has been a notable reordering within the region. While Canada continues to be the region’s freest
economy, the U.S. and Mexico have been losing their economic freedom at a faster rate. Both of these economies registered score declines of 1.5 points, among the 30 worst performances over the last year.
North America scores above the world aver-age in eight areas of economic freedom. It has high levels of business freedom, trade freedom, monetary freedom, and labor freedom. Weak-nesses remain in property rights and freedom from corruption, as Mexico lags considerably behind its two northern neighbors in these two areas that are critical to long-term economic development. Mexico’s rule of law has been severely undercut by ongoing violence and social instability related to drug trafficking. Other
United States
Canada
UnitedStates
Mexico
North America
Sources: Terry Miller, Kim R. Holmes, and Edwin J. Feulner, 2012 Index of Economic Freedom (Washington, D.C.: The Heritage Foundation and Dow Jones & Company, Inc., 2012), at www.heritage.org/index.
Economic Freedom Scores80–100 Free70–79.9 Mostly Free60–69.9 Moderately Free50–59.9 Mostly Unfree0–49.9 RepressedNot Ranked
Map 1 heritage.org
28 2012 Index of Economic Freedom
grave institutional weaknesses include rampant corruption and weak protection of private prop-erty rights. The reform agenda addressing these deficiencies has been extensive, but progress has been sluggish and marginal.
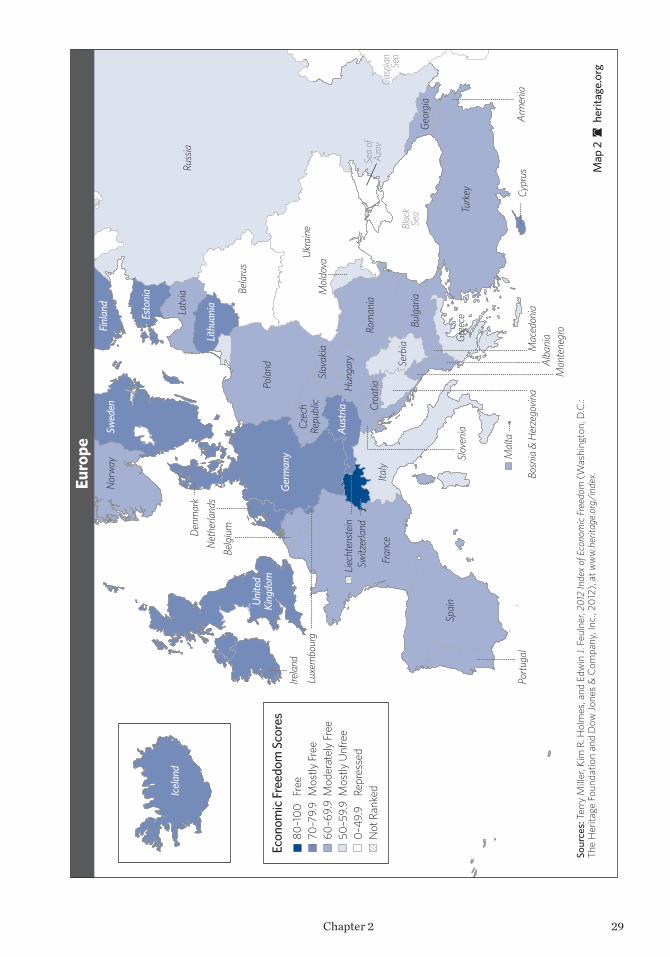
eUropeThe Europe region consists of 43 countries,
and long-established free-market institutions in many countries allow the region to score above the world average in seven of the 10 economic freedoms. It is over 15 points ahead in both prop-erty rights and freedom from corruption. The region’s business freedom and trade freedom lead world averages by slightly more than 10 points.
Taken as a whole, the region has been under-going tumultuous and uncertain times epito-mized by the ongoing sovereign debt crisis. Europe’s overall economic freedom rating is seriously undermined by weak scores in the management of government spending, reflect-ing the cost of expanding government services and transfer payments that plainly hinder both productivity growth and more dynamic job cre-ation. Stagnant growth has also exacerbated debt levels, leaving many European countries with no choice but to cut spending to reduce unsustain-able fiscal deficits.
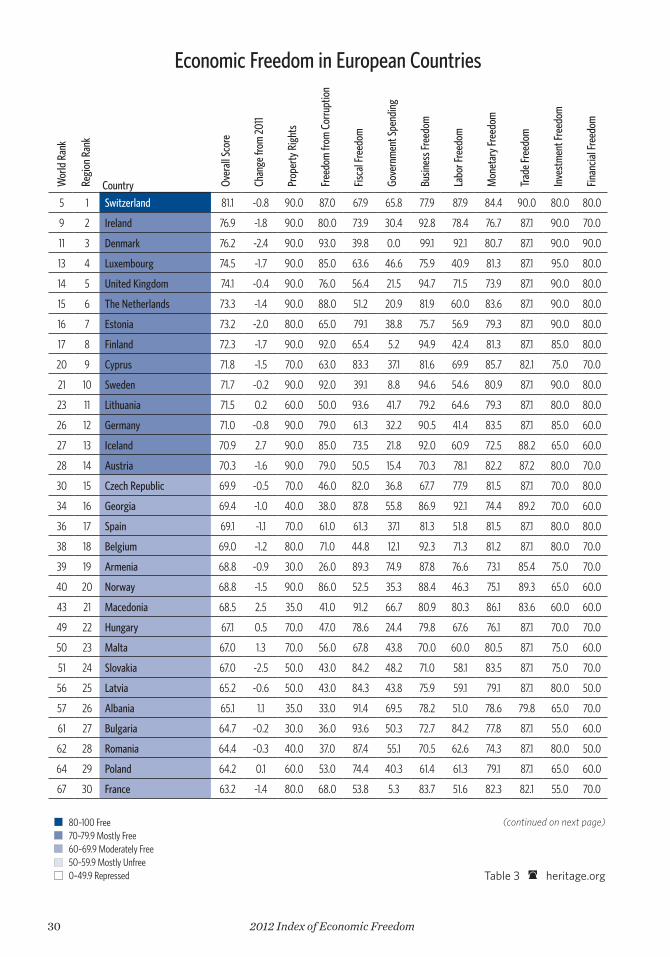
Still, nine of the world’s 20 freest countries, led by Switzerland, are in Europe. Ireland has
fallen to 8th place in the rankings, and Denmark is now out of the top 10. Moving up by one spot, the United Kingdom has re-entered the top 15 due to some bold reform efforts including vari-ous austerity measures and corporate tax rate cuts. Luxembourg, the Netherlands, Estonia, Finland, and Cyprus all score in the top 20.
Sweden is a particularly interesting case, rising to 21st place in the Index despite extraor-dinarily high levels of per capita government spending. Unlike the troubled welfare states of Greece, Italy, and Portugal, the Swedish econo-my boasts highly efficient regulatory and legal regimes in addition to a high level of transpar-ency and low corruption. These institutional assets strongly sustain productivity growth and promote resilience. Both Iceland and Macedonia recorded score gains of over two points. Achiev-ing the third largest score improvement in the 2012 Index, Iceland regained its previously held status as a “mostly free” economy. This notable comeback was grounded in strong foundations for openness and the rule of law. The Macedo-nian economy has undertaken significant busi-ness-oriented reforms over the past few years, inspiring economic growth and the development of a thriving entrepreneurial sector.
Around 80 percent of the 43 European coun-tries score between 60 and 80, achieving the sta-tus of either “moderately free” or “mostly free.”
Economic Freedom in North American Countries
6 1 Canada 79.9 -0.9 90.0 89.0 79.2 41.7 96.6 81.8 77.3 87.9 75.0 80.0
10 2 United States 76.3 -1.5 85.0 71.0 69.8 46.7 91.1 95.8 77.2 86.4 70.0 70.0
54 3 Mexico 65.3 -2.5 50.0 31.0 80.7 78.3 82.0 61.3 76.5 72.9 60.0 60.0
Table 2 heritage.org
80–100 Free70–79.9 Mostly Free60–69.9 Moderately Free50–59.9 Mostly Unfree0–49.9 Repressed
Wor
ld R
ank
Regi
on R
ank
Country Over
all S
core
Chan
ge fr
om 2
011
Prop
erty
Rig
hts
Free
dom
from
Cor
rupt
ion
Fisca
l Fre
edom
Gove
rnm
ent S
pend
ing
Busin
ess F
reed
om
Labo
r Fre
edom
Mon
etar
y Fre
edom
Trad
e Fre
edom
Inve
stm
ent F
reed
om
Finan
cial F
reed
om
Chapter 2 29
Europe
Sour
ces:
Ter
ry M
iller
, Kim
R. H
olm
es, a
nd E
dwin
J. F
euln
er, 2
012
Inde
x of
Eco
nom
ic Fr
eedo
m (W
ashi
ngto
n, D
.C.:
The
Her
itage
Fou
ndat
ion
and
Dow
Jone
s &
Com
pany
, Inc
., 20
12),
at w
ww
.her
itage
.org
/ind
ex.
Russ
ia
Sweden
Turk
ey
Ukr
aine
Finland
Fran
ce
Spai
n
Nor
way
Pola
nd
Italy
Germ
any
Iceland
Bela
rus
Rom
ania
United
Kingdom
Latv
ia
Irela
nd
Austria
Serb
iaBu
lgar
ia
Gree
ce
Hun
gary
Lithuania
Estonia
Portu
gal
Geor
gia
Croa
tia
Slov
akia
Czec
hRe
publ
ic
Belg
ium
Mol
dova
Denm
ark
Switz
erla
nd
Alba
nia
Arm
enia
Slov
enia
Mac
edon
ia
Net
herla
nds
Bosn
ia &
Her
zego
vina
Mon
tene
gro
Cypr
us
Luxe
mbo
urg
Mal
ta
Liech
tens
tein
Blac
k Se
a
Sea
of
Azov
Casp
ian
Sea
Econ
omic
Free
dom
Sco
res
80–1
00
Free
70–7
9.9
Mos
tly Fr
ee60
–69.
9 M
oder
atel
y Fr
ee50
–59.
9 M
ostly
Unf
ree
0–49
.9
Repr
esse
dN
ot R
anke
d
Map
2he
ritag
e.or
g
30 2012 Index of Economic Freedom
(continued on next page)
Economic Freedom in European Countries
5 1 Switzerland 81.1 -0.8 90.0 87.0 67.9 65.8 77.9 87.9 84.4 90.0 80.0 80.0
9 2 Ireland 76.9 -1.8 90.0 80.0 73.9 30.4 92.8 78.4 76.7 87.1 90.0 70.0
11 3 Denmark 76.2 -2.4 90.0 93.0 39.8 0.0 99.1 92.1 80.7 87.1 90.0 90.0
13 4 Luxembourg 74.5 -1.7 90.0 85.0 63.6 46.6 75.9 40.9 81.3 87.1 95.0 80.0
14 5 United Kingdom 74.1 -0.4 90.0 76.0 56.4 21.5 94.7 71.5 73.9 87.1 90.0 80.0
15 6 The Netherlands 73.3 -1.4 90.0 88.0 51.2 20.9 81.9 60.0 83.6 87.1 90.0 80.0
16 7 Estonia 73.2 -2.0 80.0 65.0 79.1 38.8 75.7 56.9 79.3 87.1 90.0 80.0
17 8 Finland 72.3 -1.7 90.0 92.0 65.4 5.2 94.9 42.4 81.3 87.1 85.0 80.0
20 9 Cyprus 71.8 -1.5 70.0 63.0 83.3 37.1 81.6 69.9 85.7 82.1 75.0 70.0
21 10 Sweden 71.7 -0.2 90.0 92.0 39.1 8.8 94.6 54.6 80.9 87.1 90.0 80.0
23 11 Lithuania 71.5 0.2 60.0 50.0 93.6 41.7 79.2 64.6 79.3 87.1 80.0 80.0
26 12 Germany 71.0 -0.8 90.0 79.0 61.3 32.2 90.5 41.4 83.5 87.1 85.0 60.0
27 13 Iceland 70.9 2.7 90.0 85.0 73.5 21.8 92.0 60.9 72.5 88.2 65.0 60.0
28 14 Austria 70.3 -1.6 90.0 79.0 50.5 15.4 70.3 78.1 82.2 87.2 80.0 70.0
30 15 Czech Republic 69.9 -0.5 70.0 46.0 82.0 36.8 67.7 77.9 81.5 87.1 70.0 80.0
34 16 Georgia 69.4 -1.0 40.0 38.0 87.8 55.8 86.9 92.1 74.4 89.2 70.0 60.0
36 17 Spain 69.1 -1.1 70.0 61.0 61.3 37.1 81.3 51.8 81.5 87.1 80.0 80.0
38 18 Belgium 69.0 -1.2 80.0 71.0 44.8 12.1 92.3 71.3 81.2 87.1 80.0 70.0
39 19 Armenia 68.8 -0.9 30.0 26.0 89.3 74.9 87.8 76.6 73.1 85.4 75.0 70.0
40 20 Norway 68.8 -1.5 90.0 86.0 52.5 35.3 88.4 46.3 75.1 89.3 65.0 60.0
43 21 Macedonia 68.5 2.5 35.0 41.0 91.2 66.7 80.9 80.3 86.1 83.6 60.0 60.0
49 22 Hungary 67.1 0.5 70.0 47.0 78.6 24.4 79.8 67.6 76.1 87.1 70.0 70.0
50 23 Malta 67.0 1.3 70.0 56.0 67.8 43.8 70.0 60.0 80.5 87.1 75.0 60.0
51 24 Slovakia 67.0 -2.5 50.0 43.0 84.2 48.2 71.0 58.1 83.5 87.1 75.0 70.0
56 25 Latvia 65.2 -0.6 50.0 43.0 84.3 43.8 75.9 59.1 79.1 87.1 80.0 50.0
57 26 Albania 65.1 1.1 35.0 33.0 91.4 69.5 78.2 51.0 78.6 79.8 65.0 70.0
61 27 Bulgaria 64.7 -0.2 30.0 36.0 93.6 50.3 72.7 84.2 77.8 87.1 55.0 60.0
62 28 Romania 64.4 -0.3 40.0 37.0 87.4 55.1 70.5 62.6 74.3 87.1 80.0 50.0
64 29 Poland 64.2 0.1 60.0 53.0 74.4 40.3 61.4 61.3 79.1 87.1 65.0 60.0
67 30 France 63.2 -1.4 80.0 68.0 53.8 5.3 83.7 51.6 82.3 82.1 55.0 70.0
Table 3 heritage.org
80–100 Free70–79.9 Mostly Free60–69.9 Moderately Free50–59.9 Mostly Unfree0–49.9 Repressed
Wor
ld R
ank
Regi
on R
ank
Country Over
all S
core
Chan
ge fr
om 2
011
Prop
erty
Rig
hts
Free
dom
from
Cor
rupt
ion
Fisca
l Fre
edom
Gove
rnm
ent S
pend
ing
Busin
ess F
reed
om
Labo
r Fre
edom
Mon
etar
y Fre
edom
Trad
e Fre
edom
Inve
stm
ent F
reed
om
Finan
cial F
reed
om

Chapter 2 31
Only Ukraine and Belarus remain “repressed” with scores below 50.
soUtH and central america/caribbean
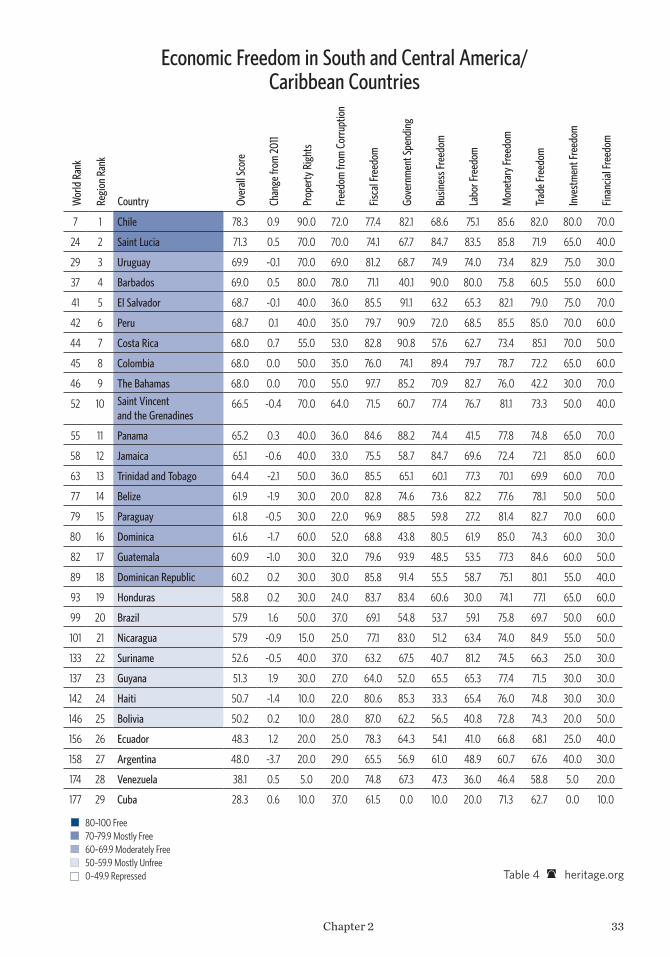
The countries of the South and Central America/Caribbean region range from prosper-ous Chile and the developing economic colossus of Brazil to the small island economies of the Caribbean Sea. The region, which consists of 29 economies, is one of the world’s most diverse, economically as well as politically.
Progress toward greater economic freedom has been made in about half of the countries in the region as the result of policy reforms. Four-teen countries recorded gains in economic free-
dom, while 13 had declines. The countries in the South and Central America/Caribbean region perform better than the world averages in four of the 10 components of economic freedom includ-ing fiscal freedom and investment freedom. Cor-ruption and a lack of protection for property rights are the major problem areas, reflecting long-standing issues of poor governance and a weak rule of law.
The typical country in the region stands out positively in terms of limited taxation and gov-ernment expenditures. The freedom to trade and invest is also better protected than in other parts of the developing world.
In the 2012 Index, the region has maintained an overall level of economic freedom that is half
Economic Freedom in European Countries (continued)
68 31 Portugal 63.0 -1.0 70.0 60.0 59.0 25.5 83.0 32.5 82.6 87.1 70.0 60.0
69 32 Slovenia 62.9 -1.7 60.0 64.0 64.8 27.9 81.4 42.2 81.2 87.1 70.0 50.0
72 33 Montenegro 62.5 0.0 40.0 37.0 91.3 31.7 69.2 86.1 81.2 83.6 55.0 50.0
73 34 Turkey 62.5 -1.7 50.0 44.0 77.7 58.5 67.1 40.0 71.9 85.4 70.0 60.0
83 35 Croatia 60.9 -0.2 40.0 41.0 76.4 45.0 63.4 44.4 81.4 87.5 70.0 60.0
92 36 Italy 58.8 -1.5 50.0 39.0 55.0 19.4 77.4 43.0 82.0 87.1 75.0 60.0
98 37 Serbia 58.0 0.0 40.0 35.0 84.1 39.3 56.5 68.7 68.0 77.9 60.0 50.0
104 38 Bosnia and Herzegovina 57.3 -0.2 20.0 32.0 84.3 24.4 55.2 60.4 80.7 86.0 70.0 60.0
119 39 Greece 55.4 -4.9 50.0 35.0 65.3 16.2 76.3 36.6 72.6 82.1 60.0 60.0
124 40 Moldova 54.4 -1.3 40.0 29.0 86.5 38.7 70.0 41.7 74.4 79.0 35.0 50.0
144 41 Russia 50.5 0.0 25.0 21.0 82.5 48.6 65.1 63.5 66.3 68.2 25.0 40.0
153 42 Belarus 49.0 1.1 20.0 25.0 86.6 34.9 71.3 77.0 65.3 80.4 20.0 10.0
163 43 Ukraine 46.1 0.3 30.0 24.0 78.2 29.4 46.2 51.2 67.7 84.4 20.0 30.0
N/A N/A Liechtenstein N/A N/A N/A N/A N/A N/A N/A N/A N/A N/A N/A N/A
Table 3 heritage.org
80–100 Free70–79.9 Mostly Free60–69.9 Moderately Free50–59.9 Mostly Unfree0–49.9 Repressed
Wor
ld R
ank
Regi
on R
ank
Country Over
all S
core
Chan
ge fr
om 2
011
Prop
erty
Rig
hts
Free
dom
from
Cor
rupt
ion
Fisca
l Fre
edom
Gove
rnm
ent S
pend
ing
Busin
ess F
reed
om
Labo
r Fre
edom
Mon
etar
y Fre
edom
Trad
e Fre
edom
Inve
stm
ent F
reed
om
Finan
cial F
reed
om

32 2012 Index of Economic Freedom
Brazil
Argentina
Peru
Chile
Bolivia
Colombia
Venezuela
Paraguay
Uruguay
Ecuador
Guyana
Cuba
Suriname
Nicaragua
HondurasGuatemala
Panama
Haiti
Costa Rica
Belize Dominican Republic
El Salvador
Jamaica
Trinidad & Tobago
The Bahamas
DominicaSt. LuciaBarbados
Sources: Terry Miller, Kim R. Holmes, and Edwin J. Feulner, 2012 Index of Economic Freedom (Washington, D.C.: The Heritage Foundation and Dow Jones & Company, Inc., 2012), at www.heritage.org/index.
South and Central America/Caribbean
Note: French Guiana not depicted because it is French territory.
St. Vincent & The Grenadines
Economic Freedom Scores80–100 Free70–79.9 Mostly Free60–69.9 Moderately Free50–59.9 Mostly Unfree0–49.9 RepressedNot Ranked
Map 3 heritage.org
7 1 Chile 78.3 0.9 90.0 72.0 77.4 82.1 68.6 75.1 85.6 82.0 80.0 70.0
24 2 Saint Lucia 71.3 0.5 70.0 70.0 74.1 67.7 84.7 83.5 85.8 71.9 65.0 40.0
29 3 Uruguay 69.9 -0.1 70.0 69.0 81.2 68.7 74.9 74.0 73.4 82.9 75.0 30.0
37 4 Barbados 69.0 0.5 80.0 78.0 71.1 40.1 90.0 80.0 75.8 60.5 55.0 60.0
41 5 El Salvador 68.7 -0.1 40.0 36.0 85.5 91.1 63.2 65.3 82.1 79.0 75.0 70.0
42 6 Peru 68.7 0.1 40.0 35.0 79.7 90.9 72.0 68.5 85.5 85.0 70.0 60.0
44 7 Costa Rica 68.0 0.7 55.0 53.0 82.8 90.8 57.6 62.7 73.4 85.1 70.0 50.0
45 8 Colombia 68.0 0.0 50.0 35.0 76.0 74.1 89.4 79.7 78.7 72.2 65.0 60.0
46 9 The Bahamas 68.0 0.0 70.0 55.0 97.7 85.2 70.9 82.7 76.0 42.2 30.0 70.0
52 10 Saint Vincent and the Grenadines
66.5 -0.4 70.0 64.0 71.5 60.7 77.4 76.7 81.1 73.3 50.0 40.0
55 11 Panama 65.2 0.3 40.0 36.0 84.6 88.2 74.4 41.5 77.8 74.8 65.0 70.0
58 12 Jamaica 65.1 -0.6 40.0 33.0 75.5 58.7 84.7 69.6 72.4 72.1 85.0 60.0
63 13 Trinidad and Tobago 64.4 -2.1 50.0 36.0 85.5 65.1 60.1 77.3 70.1 69.9 60.0 70.0
77 14 Belize 61.9 -1.9 30.0 20.0 82.8 74.6 73.6 82.2 77.6 78.1 50.0 50.0
79 15 Paraguay 61.8 -0.5 30.0 22.0 96.9 88.5 59.8 27.2 81.4 82.7 70.0 60.0
80 16 Dominica 61.6 -1.7 60.0 52.0 68.8 43.8 80.5 61.9 85.0 74.3 60.0 30.0
82 17 Guatemala 60.9 -1.0 30.0 32.0 79.6 93.9 48.5 53.5 77.3 84.6 60.0 50.0
89 18 Dominican Republic 60.2 0.2 30.0 30.0 85.8 91.4 55.5 58.7 75.1 80.1 55.0 40.0
93 19 Honduras 58.8 0.2 30.0 24.0 83.7 83.4 60.6 30.0 74.1 77.1 65.0 60.0
99 20 Brazil 57.9 1.6 50.0 37.0 69.1 54.8 53.7 59.1 75.8 69.7 50.0 60.0
101 21 Nicaragua 57.9 -0.9 15.0 25.0 77.1 83.0 51.2 63.4 74.0 84.9 55.0 50.0
133 22 Suriname 52.6 -0.5 40.0 37.0 63.2 67.5 40.7 81.2 74.5 66.3 25.0 30.0
137 23 Guyana 51.3 1.9 30.0 27.0 64.0 52.0 65.5 65.3 77.4 71.5 30.0 30.0
142 24 Haiti 50.7 -1.4 10.0 22.0 80.6 85.3 33.3 65.4 76.0 74.8 30.0 30.0
146 25 Bolivia 50.2 0.2 10.0 28.0 87.0 62.2 56.5 40.8 72.8 74.3 20.0 50.0
156 26 Ecuador 48.3 1.2 20.0 25.0 78.3 64.3 54.1 41.0 66.8 68.1 25.0 40.0
158 27 Argentina 48.0 -3.7 20.0 29.0 65.5 56.9 61.0 48.9 60.7 67.6 40.0 30.0
174 28 Venezuela 38.1 0.5 5.0 20.0 74.8 67.3 47.3 36.0 46.4 58.8 5.0 20.0
177 29 Cuba 28.3 0.6 10.0 37.0 61.5 0.0 10.0 20.0 71.3 62.7 0.0 10.0
Chapter 2 33
Economic Freedom in South and Central America/ Caribbean Countries
Table 4 heritage.org
80–100 Free70–79.9 Mostly Free60–69.9 Moderately Free50–59.9 Mostly Unfree0–49.9 Repressed
Wor
ld R
ank
Regi
on R
ank
Country Over
all S
core
Chan
ge fr
om 2
011
Prop
erty
Rig
hts
Free
dom
from
Cor
rupt
ion
Fisca
l Fre
edom
Gove
rnm
ent S
pend
ing
Busin
ess F
reed
om
Labo
r Fre
edom
Mon
etar
y Fre
edom
Trad
e Fre
edom
Inve
stm
ent F
reed
om
Finan
cial F
reed
om
34 2012 Index of Economic Freedom
a point higher than the global average of 59.5. Guyana is the most improved country in the region, gaining 1.9 points and pulling itself out of the “repressed” category. Chile has solidified its status as one of the global leaders in economic freedom, becoming the 7th freest economy in the 2012 Index.
Cuba remains the least free economy in the region, but a group of countries that have fallen under the influence of Venezuela’s charismatic leader Hugo Chávez, including Bolivia, Ecuador, Nicaragua, and even Dominica, are stuck near the bottom of the rankings or are falling fast.
Noticeably, the South and Central America/Caribbean region’s countries are distributed throughout the rankings in a more balanced fash-ion than are the countries of any other region, almost like a bell curve. All but six countries receive an economic freedom score between 50 and 70, and 16 countries fall in the middle cat-egory of “moderately free.”
middle east/nortH africaThe Middle East/North Africa region, which
consists of 17 countries, has experienced wide-spread turmoil. The region’s overall economic freedom has decreased by 0.7 point since the 2011 Index, and many of its economies remain only “moderately free” or “mostly unfree.”
Many countries in the region have under-gone political and economic upheaval since early 2011, and the gradual rise in economic freedom observed in recent years has come to a halt. As the 2012 Index goes to press, there is still far too little clarity to predict whether the “Arab Spring” will turn out to be a true blossoming of democ-racy and opportunity or simply a sunny break in a very long, cold winter.
Structural and institutional problems abound, and the regional unemployment rate, which averages more than 10 percent, is among the highest in the world and is most pronounced among younger members of the labor force. The region’s troubles are complex, rooted in decades of authoritarianism that has kept power and resources monopolized in the hands of a few. The problems will not be solved simply by hold-ing elections with more political parties or allow-
ing freedom of expression. Hard institutional reforms that reduce the state’s role in the econ-omy and in people’s lives are required. Leaders have already fallen, yet regimes and institutions remain and craftily guard their power.
As Chart 10 shows, scores for most of the 17 countries in the region are concentrated between 50 and 70. The United Arab Emirates recorded the largest score gain in the region. Continu-ing its trend of advancing economic freedom, the UAE registered one of the 20 best score improvements in the 2012 Index. The UAE’s eco-nomic restructuring has been underpinned by efforts to strengthen the business climate, boost investment, and foster the emergence of a more vibrant private sector. The Moroccan economy has advanced its economic freedom for four con-secutive years. In the 2012 Index, the kingdom has regained the status of a “moderately free economy,” with progress due in part to the gov-ernment’s consistent commitment to economic reforms that have encouraged a dynamically evolving private sector.
Bahrain, ranked 12th globally with an eco-nomic freedom score of 75.2, is the only Middle Eastern country among the world’s 20 freest economies. It has been undertaking a challenging transition to greater openness and transparency, more visibly since early 2011, and enhancing the foundations of economic freedom through improvements in property rights and corruption will be critical in ensuring success.
Qatar, which became a “mostly free” economy for the first time in the 2011 Index, continues to advance economic freedom, with notable gains in areas such as freedom from corruption and mone-tary freedom. Eight “moderately free” economies ranging from Israel to Saudi Arabia, while very dif-ferent politically, share a common commitment to economic freedom that is significantly greater than that of other countries in the region. Revers-ing its previous trend of advancing economic freedom, Saudi Arabia recorded the fourth larg-est score decline in the 2012 Index. The decline was largely caused by higher spending intended apparently to quell potential public unrest.
The lowest-ranking countries in the region continue to be Iran and Libya, bonded together

Chapter 2 35
Mid
dle
East
/Nor
th A
fric
a
Sour
ces:
Ter
ry M
iller
, Kim
R. H
olm
es, a
nd E
dwin
J. F
euln
er, 2
012
Inde
x of
Eco
nom
ic Fr
eedo
m (W
ashi
ngto
n, D
.C.:
The
Her
itage
Fou
ndat
ion
and
Dow
Jone
s &
Com
pany
, Inc
., 20
12),
at w
ww
.her
itage
.org
/ind
ex.
Iran
Alge
riaLib
yaEg
ypt
Saud
i Ara
bia
Iraq
Yem
en
Om
an
Syria
Tuni
sia
Jord
anIsr
ael
Uni
ted
Arab
Emira
tes
Kuw
ait
Qat
ar
Leba
non
Bahr
ain
Mor
occo
Casp
ian
Sea
Econ
omic
Free
dom
Sco
res
80–1
00
Free
70–7
9.9
Mos
tly Fr
ee60
–69.
9 M
oder
atel
y Fr
ee50
–59.
9 M
ostly
Unf
ree
0–49
.9
Repr
esse
dN
ot R
anke
d
Map
4he
ritag
e.or
g

36 2012 Index of Economic Freedom
by economic freedom scores that are among the worst in the world.
asia–pacificThe Asia–Pacific region contains over half
of the world’s population: one-third in China and nearly another third in India. Despite the challenging global economic environment, the region has achieved an average annual economic growth rate of around 8 percent over the past five years, largely driven by China, India, and other export-oriented economies.
The Asia–Pacific region is distinguished by the extraordinary disparity in levels of eco-nomic freedom among its economies. Four of the world’s 10 freest economies—Hong Kong, Singapore, Australia, and New Zealand—are in this region, yet most of the other countries remain “mostly unfree.” Countries such as Turk-menistan and Burma have economies that are “repressed.” North Korea, which continues to reject any form of free-market activity, remains the least free economy in both the region and the world. The region’s overall economic freedom
12 1 Bahrain 75.2 -2.5 55.0 49.0 99.9 72.2 76.5 91.1 70.4 82.8 75.0 80.0
25 2 Qatar 71.3 0.8 70.0 77.0 99.7 73.6 69.7 67.9 77.1 82.5 45.0 50.0
32 3 Jordan 69.9 1.0 55.0 47.0 93.5 67.0 69.5 75.7 81.2 79.6 70.0 60.0
35 4 United Arab Emirates 69.3 1.5 55.0 63.0 99.9 80.1 68.0 78.8 80.9 82.6 35.0 50.0
47 5 Oman 67.9 -1.9 50.0 53.0 98.4 53.6 68.2 85.1 72.1 83.7 55.0 60.0
48 6 Israel 67.8 -0.7 70.0 61.0 64.1 41.0 64.4 65.1 79.0 83.6 80.0 70.0
71 7 Kuwait 62.5 -2.4 50.0 45.0 99.9 47.2 61.8 63.5 71.3 81.6 55.0 50.0
74 8 Saudi Arabia 62.5 -3.7 45.0 47.0 99.6 37.3 87.5 71.1 64.9 82.3 40.0 50.0
87 9 Morocco 60.2 0.6 40.0 34.0 69.7 74.8 77.2 27.6 77.9 75.7 65.0 60.0
90 10 Lebanon 60.1 0.0 25.0 25.0 90.8 68.2 53.9 60.6 76.9 80.4 60.0 60.0
95 11 Tunisia 58.6 0.1 40.0 43.0 74.8 71.5 82.9 74.1 76.9 58.1 35.0 30.0
100 12 Egypt 57.9 -1.2 35.0 31.0 89.7 64.1 63.8 53.7 62.3 74.0 65.0 40.0
121 13 Yemen 55.3 1.1 30.0 22.0 83.1 62.8 71.5 57.3 69.3 81.5 45.0 30.0
139 14 Syria 51.2 -0.1 30.0 25.0 84.4 78.5 60.1 50.0 70.9 72.8 20.0 20.0
140 15 Algeria 51.0 -1.4 30.0 29.0 82.9 47.9 66.3 54.4 76.3 72.8 20.0 30.0
171 16 Iran 42.3 0.2 10.0 22.0 80.6 76.9 64.8 51.5 62.0 45.7 0.0 10.0
176 17 Libya 35.9 -2.7 10.0 22.0 80.2 17.9 20.0 20.0 73.6 85.0 10.0 20.0
N/A N/A Iraq N/A N/A N/A N/A N/A N/A N/A N/A N/A N/A N/A N/A
Economic Freedom in Middle East/North African Countries
Table 5 heritage.org
80–100 Free70–79.9 Mostly Free60–69.9 Moderately Free50–59.9 Mostly Unfree0–49.9 Repressed
Wor
ld R
ank
Regi
on R
ank
Country Over
all S
core
Chan
ge fr
om 2
011
Prop
erty
Rig
hts
Free
dom
from
Cor
rupt
ion
Fisca
l Fre
edom
Gove
rnm
ent S
pend
ing
Busin
ess F
reed
om
Labo
r Fre
edom
Mon
etar
y Fre
edom
Trad
e Fre
edom
Inve
stm
ent F
reed
om
Finan
cial F
reed
om

Chapter 2 37
Asi
a an
d th
e Pa
cific
Sour
ces:
Ter
ry M
iller
, Kim
R. H
olm
es, a
nd E
dwin
J. F
euln
er, 2
012
Inde
x of
Eco
nom
ic Fr
eedo
m (W
ashi
ngto
n, D
.C.:
The
Her
itage
Fou
ndat
ion
and
Dow
Jone
s &
Com
pany
, Inc
., 20
12),
at w
ww
.her
itage
.org
/ind
ex.Ch
ina
Australia
Indi
a
Kaza
khst
anM
ongo
lia
Pakis
tan
Burm
a
Afgh
anist
an
Uzb
ekist
an
Turk
men
istan
Thai
land
Indo
nesia
Laos
Kyrg
yz R
epub
lic
Azer
baija
n
Viet
nam
Nep
al
Tajik
istan
Mal
aysia
New
Zea
land
Papu
aN
ew G
uine
a
Cam
bodi
a
Nor
thKo
rea
Bang
lade
sh
Sout
hKo
rea
Philip
pine
s
Hon
g Ko
ngTa
iwan
Mac
au
Japa
nBh
utan
Sri L
anka
Fiji
Tim
or-L
este
Vanu
atu
Sam
oa
Sing
apor
e
Micr
ones
ia
Solo
mon
Islan
ds
Mal
dive
s
Kirib
ati
Tong
aCa
spia
n Se
a
Econ
omic
Free
dom
Sco
res
80–1
00
Free
70–7
9.9
Mos
tly Fr
ee60
–69.
9 M
oder
atel
y Fr
ee50
–59.
9 M
ostly
Unf
ree
0–49
.9
Repr
esse
dN
ot R
anke
d
Map
5he
ritag
e.or
g

38 2012 Index of Economic Freedom
Economic Freedom in Asia–Pacific CountriesW
orld
Ran
k
Regi
on R
ank
Country Over
all S
core
Chan
ge fr
om 2
011
Prop
erty
Rig
hts
Free
dom
from
Cor
rupt
ion
Fisca
l Fre
edom
Gove
rnm
ent S
pend
ing
Busin
ess F
reed
om
Labo
r Fre
edom
Mon
etar
y Fre
edom
Trad
e Fre
edom
Inve
stm
ent F
reed
om
Finan
cial F
reed
om
1 1 Hong Kong 89.9 0.2 90.0 84.0 93.1 91.0 98.9 86.5 85.8 90.0 90.0 90.0
2 2 Singapore 87.5 0.3 90.0 93.0 91.3 91.3 97.2 92.1 84.8 90.0 75.0 70.0
3 3 Australia 83.1 0.6 90.0 87.0 63.4 67.1 91.9 90.6 84.5 86.2 80.0 90.0
4 4 New Zealand 82.1 -0.2 95.0 93.0 71.6 45.0 99.9 89.9 85.2 86.8 75.0 80.0
18 5 Taiwan 71.9 1.1 70.0 58.0 80.4 92.3 88.5 46.6 83.1 85.0 65.0 50.0
19 6 Macau 71.8 -1.3 60.0 50.0 75.8 88.1 60.0 55.0 84.2 90.0 85.0 70.0
22 7 Japan 71.6 -1.2 80.0 78.0 67.1 47.0 81.8 81.4 88.9 81.8 60.0 50.0
31 8 South Korea 69.9 0.1 70.0 54.0 72.8 67.2 93.6 49.7 78.9 72.6 70.0 70.0
53 9 Malaysia 66.4 0.1 50.0 44.0 84.5 72.5 78.1 79.3 81.6 78.8 45.0 50.0
60 10 Thailand 64.9 0.2 45.0 35.0 75.1 87.5 72.5 79.0 69.3 75.2 40.0 70.0
65 11 Kazakhstan 63.6 1.5 40.0 29.0 90.4 83.4 72.9 88.7 71.8 79.6 30.0 50.0
81 12 Mongolia 61.5 2.0 30.0 27.0 88.5 62.8 67.7 74.5 74.3 79.8 50.0 60.0
86 13 Samoa 60.5 -0.1 60.0 41.0 80.3 61.3 72.9 82.3 77.0 70.0 30.0 30.0
88 14 Kyrgyz Republic 60.2 -0.9 20.0 20.0 93.1 66.5 74.1 88.9 71.0 63.2 55.0 50.0
91 15 Azerbaijan 58.9 -0.8 20.0 24.0 84.9 63.7 68.6 81.6 74.5 77.2 55.0 40.0
97 16 Sri Lanka 58.3 1.2 40.0 32.0 73.5 81.4 78.0 62.1 68.5 77.1 30.0 40.0
102 17 Cambodia 57.6 -0.3 30.0 21.0 91.1 90.0 40.7 47.2 80.7 65.2 60.0 50.0
105 18 Fiji 57.3 -3.1 25.0 20.0 78.1 78.9 59.3 75.8 75.7 69.7 30.0 60.0
107 19 The Philippines 57.1 0.9 30.0 24.0 79.1 89.7 54.3 51.7 77.1 75.5 40.0 50.0
109 20 Tonga 57.0 1.2 25.0 30.0 85.9 62.2 77.5 92.1 72.1 75.3 30.0 20.0
111 21 Bhutan 56.6 -1.0 60.0 57.0 83.8 55.3 59.7 78.6 72.6 49.5 20.0 30.0
112 22 Vanuatu 56.6 -0.1 40.0 36.0 97.0 79.9 59.3 50.7 78.4 55.1 30.0 40.0
115 23 Indonesia 56.4 0.4 30.0 28.0 83.5 91.6 54.6 52.1 75.2 73.9 35.0 40.0
122 24 Pakistan 54.7 -0.4 30.0 23.0 80.6 88.1 70.0 47.8 66.3 66.0 35.0 40.0
123 25 India 54.6 0.0 50.0 33.0 76.1 74.8 35.5 74.2 62.9 64.1 35.0 40.0
128 26 Papua New Guinea 53.8 1.2 20.0 21.0 68.3 72.6 59.0 74.0 73.2 84.8 35.0 30.0
129 27 Tajikistan 53.4 -0.1 20.0 21.0 89.0 75.5 61.6 56.8 67.4 82.5 20.0 40.0
130 28 Bangladesh 53.2 0.2 20.0 24.0 72.8 93.9 68.5 55.9 67.5 54.0 55.0 20.0
136 29 Vietnam 51.3 -0.3 15.0 27.0 76.5 66.5 61.1 67.3 75.1 79.6 15.0 30.0
138 30 China 51.2 -0.8 20.0 35.0 70.4 84.1 46.4 55.4 74.2 71.6 25.0 30.0
(continued on next page)80–100 Free70–79.9 Mostly Free60–69.9 Moderately Free50–59.9 Mostly Unfree0–49.9 Repressed Table 6 heritage.org
Chapter 2 39
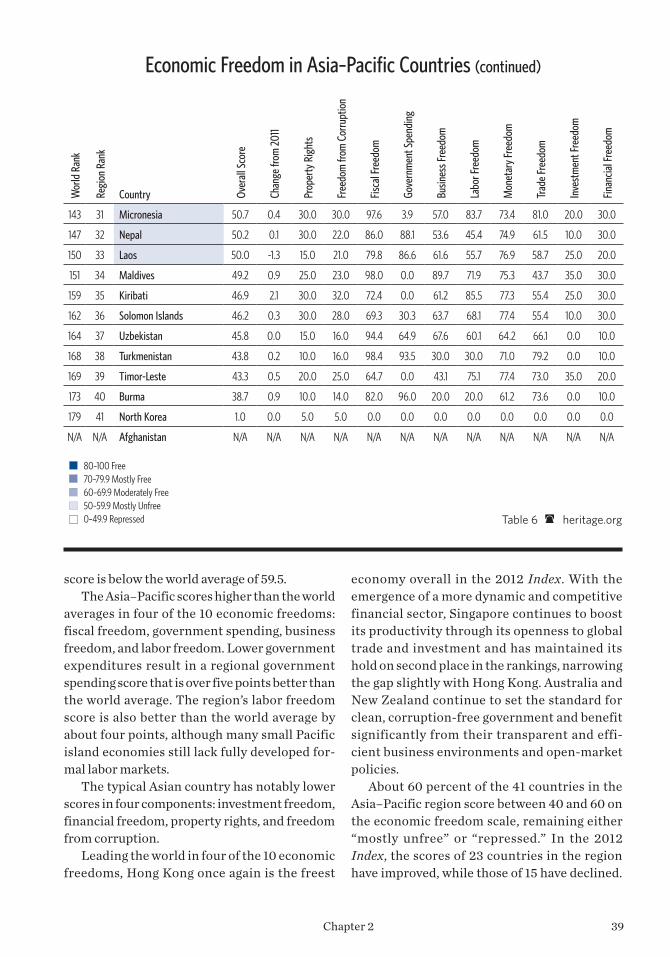
score is below the world average of 59.5.The Asia–Pacific scores higher than the world
averages in four of the 10 economic freedoms: fiscal freedom, government spending, business freedom, and labor freedom. Lower government expenditures result in a regional government spending score that is over five points better than the world average. The region’s labor freedom score is also better than the world average by about four points, although many small Pacific island economies still lack fully developed for-mal labor markets.
The typical Asian country has notably lower scores in four components: investment freedom, financial freedom, property rights, and freedom from corruption.
Leading the world in four of the 10 economic freedoms, Hong Kong once again is the freest
economy overall in the 2012 Index. With the emergence of a more dynamic and competitive financial sector, Singapore continues to boost its productivity through its openness to global trade and investment and has maintained its hold on second place in the rankings, narrowing the gap slightly with Hong Kong. Australia and New Zealand continue to set the standard for clean, corruption-free government and benefit significantly from their transparent and effi-cient business environments and open-market policies.
About 60 percent of the 41 countries in the Asia–Pacific region score between 40 and 60 on the economic freedom scale, remaining either “mostly unfree” or “repressed.” In the 2012 Index, the scores of 23 countries in the region have improved, while those of 15 have declined.
Wor
ld R
ank
Regi
on R
ank
Country Over
all S
core
Chan
ge fr
om 2
011
Prop
erty
Rig
hts
Free
dom
from
Cor
rupt
ion
Fisca
l Fre
edom
Gove
rnm
ent S
pend
ing
Busin
ess F
reed
om
Labo
r Fre
edom
Mon
etar
y Fre
edom
Trad
e Fre
edom
Inve
stm
ent F
reed
om
Finan
cial F
reed
om
143 31 Micronesia 50.7 0.4 30.0 30.0 97.6 3.9 57.0 83.7 73.4 81.0 20.0 30.0
147 32 Nepal 50.2 0.1 30.0 22.0 86.0 88.1 53.6 45.4 74.9 61.5 10.0 30.0
150 33 Laos 50.0 -1.3 15.0 21.0 79.8 86.6 61.6 55.7 76.9 58.7 25.0 20.0
151 34 Maldives 49.2 0.9 25.0 23.0 98.0 0.0 89.7 71.9 75.3 43.7 35.0 30.0
159 35 Kiribati 46.9 2.1 30.0 32.0 72.4 0.0 61.2 85.5 77.3 55.4 25.0 30.0
162 36 Solomon Islands 46.2 0.3 30.0 28.0 69.3 30.3 63.7 68.1 77.4 55.4 10.0 30.0
164 37 Uzbekistan 45.8 0.0 15.0 16.0 94.4 64.9 67.6 60.1 64.2 66.1 0.0 10.0
168 38 Turkmenistan 43.8 0.2 10.0 16.0 98.4 93.5 30.0 30.0 71.0 79.2 0.0 10.0
169 39 Timor-Leste 43.3 0.5 20.0 25.0 64.7 0.0 43.1 75.1 77.4 73.0 35.0 20.0
173 40 Burma 38.7 0.9 10.0 14.0 82.0 96.0 20.0 20.0 61.2 73.6 0.0 10.0
179 41 North Korea 1.0 0.0 5.0 5.0 0.0 0.0 0.0 0.0 0.0 0.0 0.0 0.0
N/A N/A Afghanistan N/A N/A N/A N/A N/A N/A N/A N/A N/A N/A N/A N/A
Economic Freedom in Asia–Pacific Countries (continued)
80–100 Free70–79.9 Mostly Free60–69.9 Moderately Free50–59.9 Mostly Unfree0–49.9 Repressed Table 6 heritage.org
40 2012 Index of Economic Freedom
The Mongolian economy registered one of the 10 largest score improvements in the 2012 Index, which allowed the country to regain the status of one of the world’s “moderately free” economies. The renewed progress in advancing economic freedom has restored momentum for institutional reforms that are critical to ensur-ing long-term economic vitality for Mongolia. Fiji, by contrast, lost the most economic free-dom because of considerable deterioration in freedom from corruption, property rights, and investment freedom.
India and China are ranked 25th and 30th, respectively, in the region, and both remain “mostly unfree.” The two countries’ high econom-ic growth has not been deeply rooted in policies that promote economic freedom. The foundations for long-term economic development continue to be fragile in the absence of effectively func-tioning legal frameworks. Progress with market-oriented reforms has been uneven and has often backtracked at the urging of those with a political interest in maintaining the status quo.
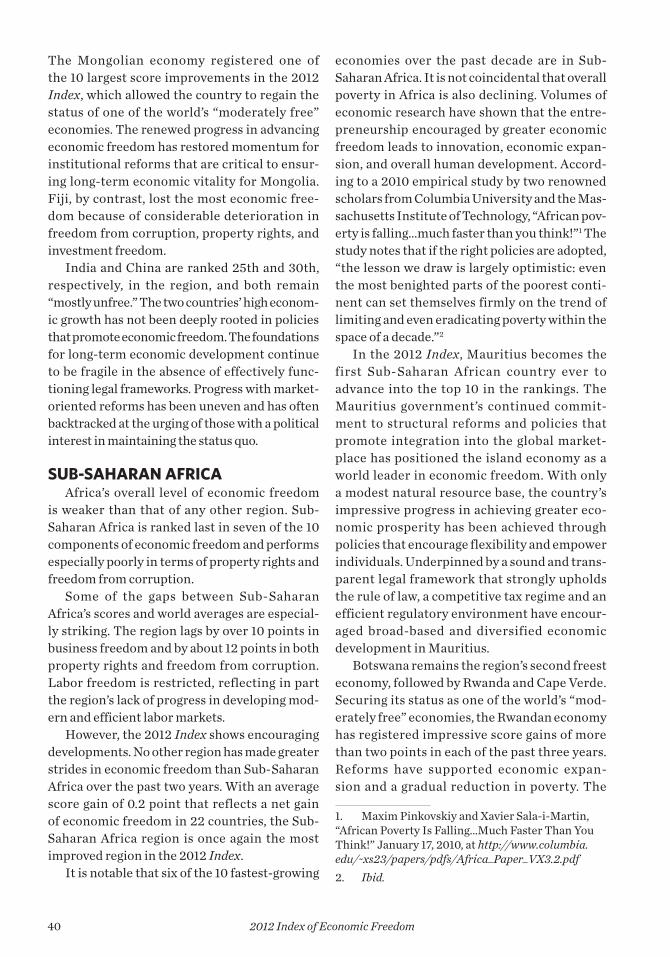
sUb-saHaran africaAfrica’s overall level of economic freedom
is weaker than that of any other region. Sub-Saharan Africa is ranked last in seven of the 10 components of economic freedom and performs especially poorly in terms of property rights and freedom from corruption.
Some of the gaps between Sub-Saharan Africa’s scores and world averages are especial-ly striking. The region lags by over 10 points in business freedom and by about 12 points in both property rights and freedom from corruption. Labor freedom is restricted, reflecting in part the region’s lack of progress in developing mod-ern and efficient labor markets.
However, the 2012 Index shows encouraging developments. No other region has made greater strides in economic freedom than Sub-Saharan Africa over the past two years. With an average score gain of 0.2 point that reflects a net gain of economic freedom in 22 countries, the Sub-Saharan Africa region is once again the most improved region in the 2012 Index.
It is notable that six of the 10 fastest-growing
economies over the past decade are in Sub-Saharan Africa. It is not coincidental that overall poverty in Africa is also declining. Volumes of economic research have shown that the entre-preneurship encouraged by greater economic freedom leads to innovation, economic expan-sion, and overall human development. Accord-ing to a 2010 empirical study by two renowned scholars from Columbia University and the Mas-sachusetts Institute of Technology, “African pov-erty is falling…much faster than you think!”1 The study notes that if the right policies are adopted, “the lesson we draw is largely optimistic: even the most benighted parts of the poorest conti-nent can set themselves firmly on the trend of limiting and even eradicating poverty within the space of a decade.”2
In the 2012 Index, Mauritius becomes the first Sub- Saharan African country ever to advance into the top 10 in the rankings. The Mauritius government’s continued commit-ment to structural reforms and policies that promote integration into the global market-place has positioned the island economy as a world leader in economic freedom. With only a modest natural resource base, the country’s impressive progress in achieving greater eco-nomic prosperity has been achieved through policies that encourage flexibility and empower individuals. Underpinned by a sound and trans-parent legal framework that strongly upholds the rule of law, a competitive tax regime and an efficient regulatory environment have encour-aged broad-based and diversified economic development in Mauritius.
Botswana remains the region’s second freest economy, followed by Rwanda and Cape Verde. Securing its status as one of the world’s “mod-erately free” economies, the Rwandan economy has registered impressive score gains of more than two points in each of the past three years. Reforms have supported economic expan-sion and a gradual reduction in poverty. The
1. Maxim Pinkovskiy and Xavier Sala-i-Martin, “African Poverty Is Falling…Much Faster Than You Think!” January 17, 2010, at http://www.columbia.edu/~xs23/papers/pdfs/Africa_Paper_VX3.2.pdf 2. Ibid.

Chapter 2 41
Sources: Terry Miller, Kim R. Holmes, and Edwin J. Feulner, 2012 Index of Economic Freedom (Washington, D.C.: The Heritage Foundation and Dow Jones & Company, Inc., 2012), at www.heritage.org/index.
Note: Western Sahara is not depicted because its economy is not in the Index of Economic Freedom.
Sub-Saharan Africa
Sudan
MaliChad
Niger
Angola
DemocraticRepublic of
Congo
Ethiopia Somalia
SouthAfrica
Nigeria
Namibia
Mauritania
Zambia
Tanzania
KenyaUganda
BotswanaMozambique
Madagascar
Republic of Congo
Cameroon
Zimbabwe
Gabon
Ghana
Guinea
Coted'Ivoire Central African
Republic
Senegal
BurkinaFaso
Benin
Eritrea
Liberia
Malawi
TogoSierraLeone
Cape Verde
Lesotho
BurundiRwanda
Djibouti
Guinea-Bissau
Swaziland
Equatorial Guinea
The Gambia
Mauritius
ComorosSeychelles
Sao Tome& Principe
Economic Freedom Scores80–100 Free70–79.9 Mostly Free60–69.9 Moderately Free50–59.9 Mostly Unfree0–49.9 RepressedNot Ranked
Map 6 heritage.org
positive economic results achieved through advancing economic freedom have created valuable momentum for additional institution-al reforms that are needed to ensure long-term economic development. Despite considerable progress over the past decade, reform in South Africa has been outpaced by other countries in the region.
Eritrea and Zimbabwe continue to be mired near the bottom of the Index rankings. Political instability and poor management of macroeco-nomic policies severely impede overall eco-nomic development in these countries. Harsh regulatory environments and pervasive corrup-tion undermine the business and investment climates.

42 2012 Index of Economic Freedom
8 1 Mauritius 77.0 0.8 65.0 54.0 91.9 83.4 78.7 70.4 78.3 87.9 90.0 70.0
33 2 Botswana 69.6 0.8 70.0 58.0 78.3 53.7 69.1 70.2 72.4 79.7 75.0 70.0
59 3 Rwanda 64.9 2.2 35.0 40.0 77.2 78.5 73.6 91.4 75.2 78.0 60.0 40.0
66 4 Cape Verde 63.5 -1.1 65.0 51.0 77.3 61.8 59.0 48.5 80.5 66.9 65.0 60.0
70 5 South Africa 62.7 0.0 50.0 45.0 70.7 71.9 75.8 57.3 75.0 76.3 45.0 60.0
75 6 Madagascar 62.4 1.2 40.0 26.0 88.3 93.6 71.1 50.8 76.0 73.5 55.0 50.0
76 7 Namibia 61.9 -0.8 30.0 44.0 65.7 73.0 70.8 85.0 74.4 86.5 50.0 40.0
78 8 Uganda 61.9 0.2 30.0 25.0 80.4 93.0 49.1 87.9 74.6 73.6 45.0 60.0
84 9 Ghana 60.7 1.3 50.0 41.0 81.9 48.3 62.9 62.9 66.9 67.8 65.0 60.0
85 10 Burkina Faso 60.6 0.0 30.0 31.0 80.4 84.0 62.8 58.9 81.4 72.5 55.0 50.0
94 11 The Gambia 58.8 1.4 30.0 32.0 75.0 85.5 56.3 67.2 71.0 60.5 60.0 50.0
96 12 Zambia 58.3 -1.4 30.0 30.0 73.3 84.9 61.2 51.1 64.9 82.3 55.0 50.0
103 13 Kenya 57.5 0.1 30.0 21.0 77.7 75.3 61.7 63.3 79.1 66.7 50.0 50.0
106 14 Swaziland 57.2 -1.9 40.0 32.0 67.2 56.5 66.4 70.8 74.5 69.7 55.0 40.0
108 15 Mozambique 57.1 0.3 30.0 27.0 77.1 69.3 66.8 39.7 74.8 81.1 55.0 50.0
110 16 Tanzania 57.0 0.0 30.0 27.0 79.7 80.2 45.2 60.1 69.4 73.5 55.0 50.0
113 17 Gabon 56.4 -0.3 40.0 28.0 73.5 81.5 57.7 59.8 77.7 61.1 45.0 40.0
114 18 Malawi 56.4 0.6 45.0 34.0 79.3 62.2 42.0 58.2 72.6 70.9 50.0 50.0
116 19 Nigeria 56.3 -0.4 30.0 24.0 84.3 72.3 55.6 80.6 72.0 63.9 40.0 40.0
117 20 Mali 55.8 -0.5 30.0 27.0 60.1 79.9 50.8 66.5 80.7 73.2 50.0 40.0
118 21 Benin 55.7 -0.3 30.0 28.0 76.2 79.9 42.9 51.5 79.7 59.3 60.0 50.0
120 22 Senegal 55.4 -0.3 40.0 29.0 65.4 78.5 58.4 43.5 81.6 72.2 45.0 40.0
125 23 Niger 54.3 0.0 30.0 26.0 76.9 80.5 35.9 40.8 86.4 71.7 55.0 40.0
126 24 Côte d'Ivoire 54.3 -1.1 20.0 22.0 78.1 86.6 42.7 56.1 81.7 70.3 35.0 50.0
127 25 Djibouti 53.9 -0.6 30.0 32.0 80.3 42.4 30.5 61.6 77.2 59.6 65.0 60.0
131 26 Mauritania 53.0 0.9 25.0 23.0 80.5 71.9 51.3 53.2 75.5 69.9 40.0 40.0
132 27 Seychelles 53.0 1.8 50.0 48.0 76.0 59.6 62.3 58.0 67.4 33.4 45.0 30.0
134 28 Ethiopia 52.0 1.5 30.0 27.0 74.8 91.1 64.4 55.5 67.1 65.6 25.0 20.0
135 29 Cameroon 51.8 0.0 30.0 22.0 69.3 90.8 47.1 48.1 70.9 54.9 35.0 50.0
141 30 Guinea 50.8 -0.9 20.0 20.0 69.3 82.6 38.5 64.7 67.1 61.2 45.0 40.0
Wor
ld R
ank
Regi
on R
ank
Country Over
all S
core
Chan
ge fr
om 2
011
Prop
erty
Rig
hts
Free
dom
from
Cor
rupt
ion
Fisca
l Fre
edom
Gove
rnm
ent S
pend
ing
Busin
ess F
reed
om
Labo
r Fre
edom
Mon
etar
y Fre
edom
Trad
e Fre
edom
Inve
stm
ent F
reed
om
Finan
cial F
reed
om
(continued on next page)
Economic Freedom in Sub-Saharan Africa Countries
Table 7 heritage.org
80–100 Free70–79.9 Mostly Free60–69.9 Moderately Free50–59.9 Mostly Unfree0–49.9 Repressed
145 31 Central African Republic 50.3 1.0 20.0 21.0 65.2 92.9 37.3 49.1 74.6 57.8 55.0 30.0
148 32 São Tomé and Príncipe 50.2 0.7 30.0 30.0 87.0 49.1 53.2 46.1 64.6 66.6 45.0 30.0
149 33 Guinea-Bissau 50.1 3.6 20.0 21.0 88.7 63.3 40.5 61.0 75.9 65.3 35.0 30.0
152 34 Sierra Leone 49.1 -0.5 10.0 24.0 80.9 84.3 51.8 42.0 70.1 62.8 45.0 20.0
154 35 Liberia 48.6 2.1 30.0 33.0 76.6 74.8 55.9 50.6 71.8 53.8 20.0 20.0
155 36 Togo 48.3 -0.8 30.0 24.0 68.6 85.6 34.8 45.2 78.3 61.7 25.0 30.0
157 37 Burundi 48.1 -1.5 20.0 18.0 72.2 22.9 46.1 67.2 70.9 78.9 55.0 30.0
160 38 Angola 46.7 0.5 20.0 19.0 84.1 53.2 45.5 43.9 61.2 65.2 35.0 40.0
161 39 Lesotho 46.6 -0.9 40.0 35.0 49.1 0.0 57.5 65.0 75.5 69.1 35.0 40.0
165 40 Comoros 45.7 1.9 30.0 21.0 64.9 85.3 41.5 31.2 78.3 69.4 15.0 20.0
166 41 Chad 44.8 -0.5 20.0 17.0 50.2 74.2 24.9 43.7 72.5 55.6 50.0 40.0
167 42 Republic of Congo 43.8 0.2 10.0 21.0 61.3 78.0 40.6 45.7 71.0 60.7 20.0 30.0
170 43 Equatorial Guinea 42.8 -4.7 20.0 19.0 75.5 28.0 44.7 43.8 73.1 58.8 25.0 40.0
172 44 Democratic Republic of Congo
41.1 0.4 10.0 20.0 72.5 76.1 38.7 39.0 51.2 63.0 20.0 20.0
175 45 Eritrea 36.2 -0.5 10.0 26.0 57.0 46.8 17.1 63.2 52.9 69.1 0.0 20.0
178 46 Zimbabwe 26.3 4.2 10.0 24.0 65.2 38.7 34.9 29.6 0.0 50.4 0.0 10.0
N/A N/A Somalia N/A N/A N/A N/A N/A N/A N/A N/A N/A N/A N/A N/A
N/A N/A Sudan N/A N/A N/A N/A N/A N/A N/A N/A N/A N/A N/A N/A
Chapter 2 43
Wor
ld R
ank
Regi
on R
ank
Country Over
all S
core
Chan
ge fr
om 2
011
Prop
erty
Rig
hts
Free
dom
from
Cor
rupt
ion
Fisca
l Fre
edom
Gove
rnm
ent S
pend
ing
Busin
ess F
reed
om
Labo
r Fre
edom
Mon
etar
y Fre
edom
Trad
e Fre
edom
Inve
stm
ent F
reed
om
Finan
cial F
reed
om
Economic Freedom in Sub-Saharan Africa Countries (continued)
Table 7 heritage.org
preserving and advancing economic freedom
The recent financial and economic turmoil vividly illustrates the interdependence of econo-mies in different regions. Bad policy choices that hurt economic freedom and retard economic performance in one country may have profound-ly negative effects in others. By the same token, good policies in one country—for example, an openness to trade or investment flows—may
have positive effects elsewhere.Every region has positive examples of coun-
tries that have chosen freedom and reaped the rewards for their citizens. As shown in the Index over the past 18 years, economic freedom is the indispensable link between economic poten-tial and prosperous outcomes. No other system comes close in terms of providing for broad-based economic growth or reduction in poverty. Those who are looking for solutions rather than excuses
80–100 Free70–79.9 Mostly Free60–69.9 Moderately Free50–59.9 Mostly Unfree0–49.9 Repressed

44 2012 Index of Economic Freedom
will find in this Index the economic policies and actions that can promote entrepreneurship and long-term economic growth irrespective of his-tory, resources, or level of development.
A recurring theme of human history has been resilience and revival. As Friedrich A. Hayek
once observed, “If old truths are to retain their hold on men’s minds, they must be restated in the language and concepts of successive genera-tions.” The Index of Economic Freedom provides such a reminder for economic revival in the years ahead.