economic globalization, wages and wage … ben salha.docx · web vieweconomic globalization, wages...
TRANSCRIPT
2012 Cambridge Business & Economics Conference ISBN : 9780974211428
Economic Globalization, Wages and Wage Inequality in Tunisia: Evidence from the ARDL Cointegration Approach
Ousama BEN SALHALecturer in economics at the Higher Institute of Management of Sousse, Tunisia
Ph.D student at the Faculty of Economics and Management of Tunis, TunisiaMember of International Finance Group-Tunisia
E-mail: [email protected]
ABSTRACT
This paper seeks to test empirically the impact of economic globalization, i.e international
trade and foreign direct investments, on the level and structure of real wages in Tunisia. On
the one hand, we are interested in the effects of globalization on real wages in the whole
economy, and then a special attention is given to the manufacturing sector. On the second
hand, we analyze the effects of international trade and foreign direct investments on the
evolution of wage inequality. To do this, the recently developed autoregressive distributed lag
(ARDL) bounds testing approach is conducted on annual data covering the period 1970-2009.
Our results reveal that trade liberalization positively affects the average wages only in the
long-run. Nevertheless, FDI didn’t exert any effects on real wages. The second finding is that
trade openness and FDI positively affect the more exportable sector in the country, i.e. the
textile, clothing and leather industry. Finally, this paper support the predictions of the HOS
model since trade liberalization is found to reduce wage inequality between skilled and
unskilled workers in both the short-run and the long-run.
JEL Classification: J31, F16, F21
Keywords: Trade liberalization, FDI, Wages, Wages inequality, Tunisia, ARDL procedure.
June 27-28, 2012Cambridge, UK 1
2012 Cambridge Business & Economics Conference ISBN : 9780974211428
1. INTRODUCTION
The effects of globalization on labor market dynamics had spurred various recent debates on
behalf of economists, policymakers and international institutions1. One can note that the
majority of academic studies on the consequences of economic globalization on labor market
dealt especially with developed countries (see Ghose, 2000, Gorg and Strob, 2002). Arbache
et al. (2004) noted that the exploration of labor market effects of trade openness in developing
countries is not a simple task. This complexity could be explained by the fact that many
developing countries have undertaken numerous economic reforms simultaneously, so that the
study of the relationship between these reforms and the labor markets should be deeply
analyzed. Then, the skill-biased technological change seems to play a significant role in the
relationship between economic globalization and labor markets in developing countries.
These factors, among others, make the empirical studies in contradiction with the theoretical
predictions of the standard theory of international trade (Arbache et al., 2004, p.F73). In
addition, most of papers on the subject tried to establish the link between trade liberalization
and employment/unemployment levels. The studies on the effects of economic globalization
on working conditions were generally confronted to data problems. As pointed out by
Jayasuriya (2008), defining and measuring working conditions is not easy. The same author
argues that the best and quantifiable measure of working conditions is the wage rate. Other
non-wage working conditions indicators, such as the bargaining power, the working
environment or the unionization, suffer from problems of data comparability between
countries. Once more, developed countries, and at less extent, Latin America countries, were
the subject of the majority of empirical investigations. But, what about the effects of
globalization on employment conditions in the Mediterranean emerging countries?
This region has been engaged for few decades in the international integration movement.
Among others, its proximity to the European continent and the abundance of its human capital
June 27-28, 2012Cambridge, UK 2

2012 Cambridge Business & Economics Conference ISBN : 9780974211428
are considered as main attracting factors2. For the majority of these countries, the European
Union represents the principal trade and financial partner. This partnership was sustained by
the conclusion of several free-trade agreements between these countries and the European
Union. However, this region is usually ignored in the academic literature on the outcomes of
globalization on labor markets.
In this paper, we aim at filling this gap in the literature, by establishing both short and long-
run relationship between international trade, foreign direct investments (thereafter FDI) and
wage dynamics in Tunisia. This country was the first one in the south Mediterranean river to
join the World Trade Organization since its creation and signed a free-trade agreement with
the European Union in 1995. Consequently, this paper has triple objectives. First, we search
to determine the effects of economic globalization (international trade and FDI) on the
evolution of the average economy-wide wages in Tunisia. Second, disaggregated analysis of
the manufacturing sector will be conducted. The motivation to conduct such disaggregated
analysis is theoretical in nature, since wages in the importable and exportable sectors did not
react similarly to trade and capital flows liberalization (Edwards, 1988). The last objective of
this paper is to underline the impact of international trade and FDI on the evolution of wage
inequality. For our empirical investigation, we employ the newly developed autoregressive
distributed lag (ARDL) model developed by Pesaran et al. (2001). The use of this approach
will allow us to distinguish the short-run effects from long-run relationships between
economic globalization and wage dynamics. We think that this approach is the appropriate
one for our empirical investigation, since theoretical predictions advance that short-run effects
of economic globalization are different from those relative to the long-run.
Consequently, the originality of this paper resides in, at least, two points. Since the majority
of empirical studies on the effects of economic globalization on labor deals with developed
countries, we will be interested here in investigating this relationship in a small developing
June 27-28, 2012Cambridge, UK 3
2012 Cambridge Business & Economics Conference ISBN : 9780974211428
country which has been engaged for three decades in several economic reforms. This study
represents one of the few empirical attempts to establish both short and long-run effects of the
neo-liberal economic policies on wage dynamics in Tunisia. In the best of our knowledge,
there is no prior attempt to deal with this purpose3. The second novelty is to understand the
relationship between economic globalization and wage dynamics at the disaggregated
industry-level in the manufacturing sector. This may be justified by the fact that the impact of
globalization may change across importable and exportable sectors. This analysis will allow
us to establish the industry-specific effects of international trade and FDI.
The remainder of this paper is structured as follows: section 2 provides an overview of
theoretical and empirical literatures treating the relationship between economic globalization,
wages and wage inequality. In section 3 and 4, we highlight, respectively, some stylized facts
on the Tunisian economy and data. Empirical results and discussion will be presented in
section 5. Section 6 concludes the paper.
2. THEORETICAL AND EMPIRICAL UNDERPINNINGS
Since the Ricardo’s theory of comparative advantage, the debate on the benefits of the free
international trade has witnessed the economic thought. The mainstream background used to
study the effects of international trade and FDI flows on wages and income inequality remains
the Heckscher-Ohlin model, or more specifically the Stolper- Samuelson Theorem. This “two
countries, two factors, two goods” model assumes that the North and the South are abundant,
respectively, in skilled and unskilled workers. The simplest version of this model announces
that, once trade barriers between the two countries are eliminated, each one will be
specialized in the production and the export of the good that uses intensively its abundant
factor and the import of the good that uses intensively its scarce factor (Leamer, 1995, Wood,
2002). Thus, the North will produce the skilled-intensive-good, while the south will produce
the unskilled-intensive-good. This specialization will induce a rise in the relative prices of the
June 27-28, 2012Cambridge, UK 4
2012 Cambridge Business & Economics Conference ISBN : 9780974211428
unskilled labor-intensive product and the earning of unskilled workers in the South, reducing
then the gap of wages between them and skilled workers. However, for developed countries,
specialization will boost wage inequality, by increasing skilled labor wages and reducing
those relative to unskilled labor.
One can note here that, despite that the HOSS model seems to be theoretically robust, some
recent empirical studies failed to validate its predictions (Ghose, 2000, Spiezia, 2002),
especially in the case of less-income countries, where wage inequality has risen in the past
two decades. The first limit is the assumption of the homogeneity of the production functions,
the production factors and the produced goods in the two countries (Lall, 2002). Likewise,
Wood (2002) criticizes the fact that the HOSS model considers technological change as an
exogenous factor. Or, most of technologies used in developing countries are generally
transferred from developed countries through international trade and/or foreign direct
investments. In addition, Meschi and Vivarelli (2009) argue that the notion of skill is relative
to each country and that its significance may change especially between developing countries.
For example, compared to developed countries, middle-income countries are considered as
relatively unskilled labor abundant, but as a skilled labor abundant in relation to low-income
countries (Meschi and Vivarelli, 2009, p.288).
Anderson et al. (2006) assumed that globalization may reduce the telecommunication and
traveling costs, which will encourage the high-skilled workers in the North to cooperate with
those in the South. This cooperation, through trade and direct investments, will facilitate the
know-how transfer around the world. They suppose that two types of workers exist: the high-
skilled workers (K-workers) and the skilled and unskilled workers (L-workers). The main
findings are an increase of wage inequality between the K-workers and the rest of workers in
the North, but no final results were reached for the South. Feenstra and Hanson (1996)
focused on an economy composed by two skill categories: skilled and unskilled workers and
June 27-28, 2012Cambridge, UK 5
2012 Cambridge Business & Economics Conference ISBN : 9780974211428
producing a continuum of goods. By transferring activities from the North to the South,
unskilled-intensive goods produced previously in the North will be considered as skilled-
intensive goods in the South. Consequently, this shift of the production will raise the demand
for skilled labor in both areas. This will increase the gap of earnings between skilled and
unskilled labors and the wage inequality as much in the North as in the South. Wood (2002)
announces that none of these theories succeeded in explaining the impact of globalization on
wage inequality, especially in developing countries. On the other hand, he proposes a
‘synthetic theory’ which may explain, as say Wood, the wage inequality effects of
globalization observed in developed or developing countries, without taking into account
others factors such as the technological change or the labor market institutions (Wood, 2002,
p 25).
The political economy partisans are based on the bargaining power argument to determine the
effects of trade liberalization and free capital movements on the evolution of absolute wages.
They argue that the transition from autarky to free trade is usually marked by a reduction in
the bargaining power of workers. In fact, in the post-liberalization period, capital is
considered as mobile, while labor is relatively immobile, that’s why liberalization will
generate a shift in the balance of power from labor to capital. The disequilibrium in the
balance of power between labor and capital is particularly observed in developing countries4,
where labor market regulations are weak, and sometimes non-existent. This may be explained
by the growing international competition between developing countries in order to attract
foreign capital flows. Low-cost labor is nowadays considered as one of the most important
FDI determinants in developing countries. Labor markets in these countries are generally
characterized by low levels of legal minimum wage, flexible labor laws and the quasi-absence
of trade unions activity. Particularly, the existence or not of trade unions seems to play an
important role when detecting the effects of economic globalization on wage levels and
June 27-28, 2012Cambridge, UK 6

2012 Cambridge Business & Economics Conference ISBN : 9780974211428
structure. Moreover, Velde and Morrissey (2001) advance that the skilled workers are
relatively in stronger bargaining position than less-skilled ones. The authors explain this
difference in the bargaining situation by the scarce and abundant supply of, respectively,
skilled and unskilled workers, especially in developing countries. Freeman (1996) argues that
the fall of unionization power in the United States explained 20% of the US wage inequality
rise. However, in some European countries, where trade unions remain stronger, even wages
of unskilled workers did not decrease in the same period.
Onoran and Stockhammer (2008) argue that, according to the political economists, the effects
of trade and capital flows liberalization on the evolution of wages are not immediate and may
be observed in the medium run, contrary to the traditional international trade theory, which
expects long run effects. Many authors have argued that increasing integration into the global
economy may induce technological change, especially in the case of developing countries
(Singh and Dhumale, 2000, Palokangas, 2009).
Edwards (1988) analyzed the labor market short and long-run adjustments5 to trade
liberalization, which is marked by a shock on import prices, i.e. on terms of trade. The model
is designed for a small open economy, where two production factors (labor and capital) and
three production sectors (exportable (X), importable (M) and non-tradable (N)) exist. In the
short-run, capital is supposed to be fixed, while labor is perfectly mobile among sectors. In
the long-run, both labor and capital move freely. According to Edwards (1988), the intensity
of production factors varies between sectors: relative to labor, the importable sector is the
most capital intensive, followed by the non-tradable sector. The exportable sector is assumed
to have the lowest capital-to-labor ratio6. These differences in factor intensity between sectors
seem to reflect the situation of developing countries, where labor is abundant. The analysis of
the impact of a change in the terms of trade on employment and wages are done under two
June 27-28, 2012Cambridge, UK 7
2012 Cambridge Business & Economics Conference ISBN : 9780974211428
postulations: in the absence of wage rigidities and in the presence of these rigidities,
manifested by the existence of minimum wage on the importable sector.
In the short-run7, if wage rigidities are inexistent, employment in the exportable sector will
increase due to the expansion of production. However, wages will decrease as the supply in
the exportable sector rises. In the importable sector, both employment and wages will
slowdown because of the decline of the output demand. Wages in the non-tradable sector will
fall too. Production in this sector may increase or decrease, depending on the degree of
substitution in production and consumption between the three goods (Edwards, 1988, p.173).
In the presence of wage rigidities, the importable sector is considered as ‘protected’ via the
implementation of minimum wage. The effects of a shock on the import prices on wages in
the exportable and non-tradable sectors are the same as in the first case, i.e. a fall in wages. In
the importable sector, employment will collapse, while wages will rise. In the long-run,
capital and labor can move freely across the three sectors. Thus, an increase in both
employment and wages are observed in the exportable and non-tradable sectors, due to the
increase in the production. The importable sector will experience a fall in the domestic
production, due to the reduction of import tariffs. Thus, labor will move to the exportable and
non-tradable sectors, so that employment in the importable sector would be reduced. Wages in
this sector will rise because of a reduction in labor supply. When minimum wage laws are
implemented, the long-run impacts of changing terms of trade will be an enhancement of
employment in the exportable sector, while those on wage are unclear. Fosu (2000) argue that
the ambiguity may be caused by the coexistence of two contradictory effects. On the one
hand, capital movements between sectors will climb wage in the exportable sector. On the
other hand, due to the reduction in the import tariffs and the existence of minimum wages in
the importable sector, unemployment will rise in this sector. Thus, the labor supply will
migrate from the importable to the exportable sector. Mixed with the growing production
June 27-28, 2012Cambridge, UK 8
2012 Cambridge Business & Economics Conference ISBN : 9780974211428
supply in the exportable sector, trade liberalization will exert pressure on wage in the
exportable sector. Trade liberalization would enhance employment in the non-tradable sector,
while its effects on wages are not clear. Finally, the adjustment in the importable sector still
unchanged as in the short-run, a fall in employment and an increase in wages. Haouas et al.
(2005) advance that many factors may affect the labor market adjustment process, such as the
degree of heterogeneity of goods and sectors, the effects of trade liberalization on
competitiveness…
Dealing with the traditional international trade theory and the bargaining power analysis of
the political economists, Paus and Robinson (1997) mention that ‘little empirical evidence has
been presented in support of either side until now’. Many economists argue that the study of
labor market adjustments to trade and capital flows liberalization remains by far an empirical
issue. The detection of labor market outcomes of liberalization is generally dependent on
country specific characteristics, such as the structure of labor markets, the weight of each
sector in the economy, the labor market standards, the nature of liberalization process…
Agénor and Aizenman (1996) advance that, in spite of the diversity of theoretical background,
the empirical understanding of the effects of trade reforms on wages and employment is still
limited. Krueger (1983), dealing with the effects of international trade on employment and
wages in 10 less developed countries8, concludes that the HOSS theorem success in
explaining the nature of labor markets adjustments in the long-run. Employment seems to be
higher in open economies, and exportable sectors tend to use intensively less skilled workers.
Meschi and Vivarelli (2009) found contradictory empirical results. Dealing with the effects of
international trade on the evolution of income inequality in 65 developing countries between
1980 and 1999, the authors did not establish any significant relationship. When trade flows
are geographically decomposed by the origins/destinations, the authors conclude that both
exports and imports with developed countries rise wage inequality in middle-income
June 27-28, 2012Cambridge, UK 9
2012 Cambridge Business & Economics Conference ISBN : 9780974211428
countries. Paus and Robinson (1997) examined the effects of export growth on average wages
in the manufacturing sectors of 32 developing countries between 1973 and 1990. Results
suggest that exports did not exert direct effects on wage growth. However, exports will
enhance the bulk of foreign exchange, which will be used to import capital goods needed in
local investment. Finally, higher investment will induce more growth, which will affect
wages. Egger and Stehrer (2001) found that both imports and exports of intermediate goods
exacerbate wage of unskilled labor in four Central and Eastern European countries. Trade in
intermediate goods with the European Union reduces the annual change of wage inequality
between skilled and unskilled workers by about 58% and 30%, respectively, in the Hungarian
and the Polish manufacturing sectors. Ramasamy and Yeung (2010) investigate the
relationship between FDI, wages and productivity in China. Employing vector autoregressive
and generalized method of moments on a sample of 28 Chinese provinces, the authors found
that FDI affect positively wages since a 1% expansion in FDI flows gives a rise of 0.048% in
average wages. However, a 1% increase in average wage will slowdown FDI by about 2.67%.
Thus, the ‘cheap labor argument’ seems to be verified in China, since wages could be
considered as a main FDI determinant. Janicki and Wunnava (2004) argue that cheap labor
costs represent one of the most important determinants of FDI flows in developing countries,
especially when these flows are coming from countries where wages are relatively high.
Empirical investigation shows that a change of $1 in the differential of wages between home
and host countries will induce a change of $17 278 in FDI flows. Onoran and Stockhammer
(2008) investigate the effects of FDI and trade flows with the European Union on the
evolution of real wages in five Central and Eastern European countries. In the short-run, FDI
exert positive effects on manufacturing wages, especially in capital intensive and skilled
sectors9. Trade flows with the European Union exert no effects on real wages. In the log-run,
the impact of FDI and exports on real wages are negative, while imports affect positively
June 27-28, 2012Cambridge, UK 10
2012 Cambridge Business & Economics Conference ISBN : 9780974211428
wages. This may be explained by the fact that the important share of imports from the
European Union is composed by intermediate inputs, which is considered as complementary
to labor. These results are so interesting, because a great part of imports from developed to
developing countries are intermediate inputs, which will be transformed and then exported to
developed countries. Jaumotte et al. (2008) conclude that financial globalization (especially
FDI flows) and technology transfer have increased wage inequality within the sample
composed by 20 advanced and 31 developing countries. In contrast, trade liberalization has
reduced wage inequality between skilled and unskilled workers. Nevertheless, the authors use
the share of information and communications technologies capital produced domestically in
the total capital stock as a proxy of technology progress. Or, as mentioned by Damijan et al.
(2003), developing countries generally prefer importing technologies from advanced
countries, rather than to produce them. Arbache et al. (2004) point out that trade liberalization
induces a rapid transfer of foreign technology via FDI and imports flows. So, the measure
used by Jaumotte et al. (2008) may not take in consideration the imported technologies used
in the host country, and then, it will underestimate the real level of technology development.
Beyer et al. (1999) investigated the relationship between trade openness and wage premium in
the case of the Chilean economy over the period 1960-1996. Their finding shows that trade
liberalization amplified the gap of wages between skilled and unskilled labor. The authors
explain this deepening in wage inequality by skill-biased technological change, which favors
skilled workers. Taylor and Driffield (2005) found that FDI explained about 11% of wage
inequality in the United Kingdom manufacturing sectors over the period 1983-1992. Grenier
and Tavakoli (2006) conclude that the ratio of the average production earnings to the average
non-production earnings is moderately affected by imports and FDI in Canada. For a panel of
103 developed and developing countries, Figini and Gorg (2006) examine the possibility of
the existence of non-linear relationship between FDI and wage inequality over the period
June 27-28, 2012Cambridge, UK 11
2012 Cambridge Business & Economics Conference ISBN : 9780974211428
1980-2001. Theoretical backgrounds are based on the Aghion and Howitt’s General Purpose
Technology model. The authors confirm the existence of an inverted-U shape curve in
developing countries, where FDI will enhance wage inequality between skilled and unskilled
workers in the first stage of capital flows entry, and then will reduce it in the long-run.
However, in developed countries, FDI seems to reduce wage inequality, whence the
relationship is linear. Bigsten and Durevall (2006) evaluate the effects of trade openness on
sectoral wage inequality between 1964 and 2000 in Kenya. Using VAR and VECM
estimations, the authors found that the reduction of trade tariffs seems to reduce the gap of
wages between the agricultural and the manufacturing sectors.
3. BASIC STYLIZED FACTS ABOUT ECONOMIC GLOBALIZATION AND LABOR
MARKET IN TUNISIA
Since the mid-1980, the Tunisian economy has recorded good performance. Most
macroeconomic variables, such as inflation rate and budget deficit were controlled10. Between
1980 and 2009, the average GDP growth rate was about 4.5%, including 7.8% in 1992. Per
capita GDP (in purchasing power parity) has more than doubled between 1980 and 2009,
from US$3616 to US$7511. As mentioned by the World Bank (2008), the Tunisian per capita
GDP is the second higher in the Maghreb, just after Libya (World Bank, 2008, p. 1). Starting
from the mid-1980, a set of reform policies have been initiated, with the implementation of
the Structural Adjustment Program in 1986. The decade of the 1990s brought a new
experience with the adhesion to the World Trade Organization since its creation. The next
major step was the signing of the free-trade agreement with the European Union in 1995. The
agreement, entered into force in January 1996, stipulates the gradual reduction of non-tariff
barriers on goods and services, the liberalization of investments and generally the promotion
of economic, social, cultural and financial cooperation between the two parties. While
Tunisia’s total exports were only US$3.3 billion11 in 1980, they became US$6.9 billion in
June 27-28, 2012Cambridge, UK 12
2012 Cambridge Business & Economics Conference ISBN : 9780974211428
1995, and finally reached more than US$12 billion in 2008. At the same time, its share in the
total gross domestic product has significantly grown from 45% in 1995 to 60 % in 2008.
(Figure 1about here)
The overall weighted average tariff rates were cut from over 28% in 1990 to 25.6% at the end
of 2002 and 19.9% in 2006. At the disaggregated level, tariffs on imported manufactured
products have been slowdown by 40% between 1990 and 2006 (UNCTAD, 2010). Following
the reduction of tariffs, imports have more than doubled between 1980 and 2009.
Manufactured goods account for almost 80% of total goods imports in 2009. This may be
related to the fact that a significant share of Tunisian imports is composed by intermediate
goods, which will be transformed and then exported. Thus, the overall trade balance (both
goods and services transactions) has recorded large deficit, reaching one billion US dollars in
2001. This deficit was primarily caused by the goods balance deficit, which continued to be
deteriorated, reaching a record level of about 3 billion US dollars in 2001 and 2007.
Contrariwise, services balance has been characterized by regular surplus, which allowed the
reduction, in some extent, of the goods balance deficit. One should note that the European
Union countries were by far the most important trading partner, accounting for more than
74% of exports and more than 63% of imports in 2009.
On the other hand, since the beginning of the 1970’s, authorities have encouraged foreign
investors to outsource their activities in Tunisia. This was provided, especially, by the well-
known 1972 investment law, which offers many financial and fiscal incentives to foreign
investors (exemption of import duties on raw materials and equipments, partial/total tax
exemption for the first years of activity, no value added tax…). In the next two decades, many
factors have permitted the attraction of more capital flows, such as the geographic proximity,
the abundance of educated and low-priced labor and the relative political stability. Foreign
direct investments were especially encouraged, because they are not only more stable, but also
June 27-28, 2012Cambridge, UK 13
2012 Cambridge Business & Economics Conference ISBN : 9780974211428
because of their ability to bring technological and managerial spillovers12. Consequently, the
surge in FDI flows has substantially improved over the past decades. In fact, FDI flows have
fluctuated up and down, with average annual flows of about US$54.6 million in 1970-1979
and US$157 in 1980-1989. This figure increased further to more than US$356 million in the
next decade. During the first decade of the 21th century, average FDI flows reached US$1.3
billion, with nearly US$3.3 billion in 200613. As a share of GDP, FDI flows have grown
continually from 1.75% in the 1980’s to 2.1% in the end of 1990, reaching finally 4.5%
between 2000 and 2009.
In spite of the good economic performance realized by the Tunisian economy and the neo-
liberal policies implemented by authorities, the labor market always suffers from high
unemployment rate (World Bank (2004), p.28)). As mentioned by Redjeb and Ghobentini
(2005), unemployment is considered as a structural phenomenon in Tunisia. During the last
decades, the nature of unemployment has changed over time. In fact, until the beginning of
the 1990’s, unemployment touched labor force with low or medium levels of education.
However, the last decades were especially marked by a sharp rise of university graduates
unemployment. While the overall unemployment rate was about 14.1% in 2007, the one
relative to young graduates (aged between 23 and 29 years) in economics, law and
management is about 47%14 (Stampini and Verdier-Chouchane (2011)). Youth15
unemployment rate reached 30.7% in 2005, with no important gender differences since the
rate is about 31.4% and 29.3%, respectively, for men and women.
Table 1 deals with the distribution of employed labor force in each sector according to the
level of education. The total employed labor force has increased at an annual growth rate of
2.72% between 1989 and 2007. At the same period, the labor market received, in average,
65800 new employees every year. Services represent the major recipient sector, with a share
evolving from 44% to 48.5% of total employment. While the number of employed workers in
June 27-28, 2012Cambridge, UK 14
2012 Cambridge Business & Economics Conference ISBN : 9780974211428
industry has risen continually, the one relative to agriculture has fluctuated, due to its
dependence on the climatic circumstances. In regard to the educational intensity of
employment, one can advance that, except the illiterate workers, the demand for ones with
primary, secondary or university diplomas has grown over time. In 2007, primary and
secondary graduates represented more than 70% of total employment, whereas the
recruitment of university ones increased to reach 14% in 2007. Over time, the situation of
illiterate employers has been deteriorated, with a demand decreasing in all sectors. Even in
agriculture, the share of workers without schooling fell down from more than 60% in 1984 to
38% in 2007.
(Table 1 about here)
As shown in this table, this sector has used intensively workforce with low level of education,
since more than 80% of workers have, at the best, primary attainments. However, industry
uses medium-skill labor force. In 2007, about 85% of employers are from primary and
secondary schooling. This may be explained by the fact that the Tunisian industries are, in
general, medium-skill industries (textile, mechanical and electrical industries…).
Simultaneously, the number of university graduates working in manufacturing and non-
manufacturing industries has been multiplied by 5 between 1984 and 2007. Finally, services
have required more skilled workforce, since it employed the most important share (83.3%) of
total university graduates in 2007. Workers with secondary level represent the biggest part,
with 41% of the total employment in services.
As mentioned by the World Bank (2004), the Tunisian labor market is characterized by high
regulation. Laws related to dismissal measures are too strict, especially for permanent
workers16. Consequently, Tunisia offers a job security which is higher than the average in
OECD countries (World Bank, 2004, p.44). However, the labor law was revisited in the
1990’s, just to introduce some flexibility on it. Reforms dealt essentially with the economic
June 27-28, 2012Cambridge, UK 15
2012 Cambridge Business & Economics Conference ISBN : 9780974211428
dismissal measures, which become more easily but still too costly for firms. The second wave
of reforms, implemented in 1996, simplified the recruitment procedures, since it allows to
firms to hire workers for partial duration, by using determined period contracts. This measure
was undertaken to encourage firms to recruit workers, since the unemployment rate has been
intensified. At the same time, it allows to firms to adapt themselves rapidly to the internal and
external shocks. Finally, the mechanism of determination of wages includes two major
intervenors: the government and the trade unions. As a consequence, wages are regularly
negotiated. As mentioned by Gouider (2010), wage policies are generally determined in
collective negotiations between the government and sectoral trade unions17. The minimum
wage is annually augmented, proportionally to the increase of productivity, so that the labor
cost still constant over time (World Bank (2008), p. 42). Proportionally, the average annual
real wage has grown from 5864 TDN in 1983 to 7675 TDN in 2009.
(Table 2 about here)
Table 2 deals with the average real wage for the whole economy and for the main economic
sectors. In addition, the total period is divided into two sub-periods: before and after the
conclusion of the free trade agreement with the European Union. This decomposition allows
us to make simple preliminary intuition on the implications of this agreement on the evolution
of wages. As can be seen from the table 2, the only sector for which the annual average wage
is higher to the whole economy annual wage is services. Agricultural wage is found to be the
lowest. In the first sub-period, we remark that the annual real wages are above the annual real
wages associated to the total period. This statement remains valid for all economic sectors.
While, for the post reform period, annual real wages have raised substantially, reaching levels
which are superior to the whole period annual real wages. Thus, comparing the two sub-
periods, it is clear that the real annual wages have grown for all sectors, even if the
enhancement is not identical for all sectors.
June 27-28, 2012Cambridge, UK 16
2012 Cambridge Business & Economics Conference ISBN : 9780974211428
4. EMPIRICAL METHODOLOGY AND DATA
As mentioned previously, our objective is to empirically determine the nature of the short-run
and long-run relationships between trade openness, foreign direct investments and wage
dynamics in Tunisia. More precisely, our investigation will focus on three different
assumptions. The empirical study of each one is developed with respect to the theoretical
background, previously presented.
According to the political economy proponents, economic globalization induces a decrease in
the bargaining power of trade unions. Thus, it will deteriorate the situation of workers,
especially in developing countries. Thus, our first assumption is:
Assumption 1: Trade openness and foreign direct investments have deteriorated the working
conditions, especially wages. To test empirically this assumption, aggregated analysis
between trade openness, FDI and the annual real wage will be conducted during the period
1970-2009. Annual data on exports and imports as a share of GDP are extracted from the
World Development Indicators database (online, 2010). Foreign direct investment flows as a
share of GDP comes from the United Nations Conference on Trade and Development
(UNCTAD) online database. The average real wages are obtained from the Tunisian Institute
of Competitiveness and Quantitative Studies.
As pointed out by Edwards (1988), the effects of trade openness on wages are not the same
for all sectors. Wages in the exportable and importable sectors will react differently to trade
liberalization. This analysis is considered as the basis of our second assumption.
Assumption 2: The effects of trade and capital flows on annual real wages are not the same
for the importable and exportable sectors18. Methodologically, we will study the nature of the
relationship based on disaggregated industry-level data associated to the manufacturing
sector19. This will allow us to distinguish the industry-specific effects of economic
globalization. Manufacturing subsectors are classified into two groups: exportable and
June 27-28, 2012Cambridge, UK 17
2012 Cambridge Business & Economics Conference ISBN : 9780974211428
importable. As in Haouas et al. (2005), the distinction between exportable and importable
sectors is essentially based on the size of the import to export share and on the market
orientation. Data, covering the period 1990-2008, comes from different sources. The national
accounts, published by the Tunisian National Statistics Institute, provide us with data on
disaggregated exports, imports and value-added in the manufacturing subsectors. While, data
associated to disaggregated FDI flows are obtained from the Tunisian Foreign Investment
Promotion Agency.
According to the HOS model, trade liberalization raises the wage of unskilled workers and
decreases the wages of skilled workers in developing countries. Thus, wage inequality will
fall. In addition, Hanson and Feenstra (1996) pointed out that trade liberalization enhances
wage inequality in these countries. Consequently, the third hypothesis we have the intention
to test is:
Assumption 3: Trade openness and foreign direct investments decrease wage inequality
between skilled and unskilled workers. Due to the lack of long time series data on wages by
occupation, we have constructed three different wage inequality indicators, based on annual
real wages. The first one, denoted WII1, has been inspired from Bigsten and Durevall (2006).
Thus, we will create an intersectoral wage inequality indicator, which is the ratio of the
average annual wage in the manufacturing sector divided by the average annual wage in
agriculture. These authors argued that workers in the manufacturing sector are generally more
skilled than those working in agriculture. Thus, this indicator can be considered as a proxy of
wage inequality between unskilled and relatively more skilled workers.
With regard to the second wage inequality proxy, denoted WII2, we have followed the same
methodology, but by dividing the average annual wage in administration by the average
annual wage in agriculture. We think workers in the administration are more skilled than
June 27-28, 2012Cambridge, UK 18
2012 Cambridge Business & Economics Conference ISBN : 9780974211428
workers in the manufacturing sector, and thereafter than those in the agriculture. For example,
workers with higher education represent respectively 57.7%, 7.46% and 1.25% of total
workers in the banking and insurance industry, in the manufacturing sector and in agriculture.
Thus, our second wage inequality indicator can be written as:
Finally, the third wage inequality indicator (WII3) deals essentially with wages in the
manufacturing subsectors. The first step consists in classifying the six subsectors of the
manufacturing sector into two groups: low technology unskilled industries (the pottery, glass
and other construction materials industry, the agro-food industry, the textiles, clothing and
leather industry and the other manufacturing industries) and medium-high technology skilled
industries (the chemical industry and mechanical and the electrical and electronic industry).
The classification of sectors is essentially based on NACE Rev. 2 at 3-digit level and on
Landesmann et al. (2004) and Onaran and Stockhammer (2008). Once subsectors
classification done, we generate the series of the third wage inequality indicator, using the
following formula:
Based on these definitions, three wage inequality indicators are calculated. Figure 2 deals with
the evolution of the wage inequality indicators over the period 1970-2009.
(Figure 2 about here)
As shown in the first and second figures, average annual wages in the manufacturing sector
and administration were, respectively, five and seven times as much as wages in agriculture in
the beginning of the 1970s. Then, wage inequality continually decreases over time. Thus, one
can note that the intersectoral wage inequality between skilled and unskilled workers has
constantly declined between 1970 and 2009. However, the last figure shows that wage
June 27-28, 2012Cambridge, UK 19
2012 Cambridge Business & Economics Conference ISBN : 9780974211428
inequality have fluctuated up and down during the same period, but the general statement is
that it decreases slowly starting from the mid-1990s.
To test empirically the cited assumptions, one should distinguish between the short and long-
run effects. For this reason, we decide to use the ARDL bounds testing procedure introduced
initially by Pesaran and Shin (1999) and developed by Pesaran et al. (2001). Compared to
other cointegration approaches, such as the Johansen and Juselius (1990) one, the ARDL
modeling has several advantages. Firstly, the long-run relationship between two variables can
be estimated even if they have different orders of integration (integrated of order zero (I(0)),
integrated of order one (I(1)) or fractionally integrated). Secondly, as mentioned by Duasa
(2007), the ARDL procedure is more appropriate when the sample size is relatively small.
Finally, Harris and Sollis (2003) advance that the use of ARDL bounds testing approach
allows to obtain unbiased estimates of the long-run relationship. In addition, Amusa et al.
(2009) report that even if some of variables integrated in the regression are endogenous, the
estimated long-run coefficients seem to be unbiased.
Consequently, our empirical methodology involved four major stages. The first step is to
investigate the stationarity properties of times series. This is important because it is necessary
to ensure that none of our variables is integrated of order 2 or above. In fact, the ARDL model
is not applicable if one of variables integrated in the regression is I(2). In this study, three
different unit root tests will be computed: the ADF test, the Philips-Perron test and the Ng-
Perron test. The aim of using various unit root tests is to guarantee that our results are not
sensitive to a given test. Thus, if the hypothesis of stationarity is accepted by at least two unit
root tests, we can admit that the series are stationary. Otherwise, the same tests will be applied
on differenced time series.
The second step consists in testing the existence of long-run relationship between variables.
Thus, bivariate and multivariate cointegration analysis between wage and economic
June 27-28, 2012Cambridge, UK 20
2012 Cambridge Business & Economics Conference ISBN : 9780974211428
globalization variables is conducted. Decision about the existence of cointegration or not is
made on the basis of the joint F-statistics. For each confidence level, Pesaran et al. (2001)
provide two different sets of asymptotic critical values: a lower bound critical value (I(0)) and
an upper bound critical value (I(1)). Three cases are possible. If the computed F-statistics is
below the lower bound critical value, the null hypothesis of no cointegration cannot be
rejected. If the F-statistics is higher than the upper bound, the null hypothesis of no
cointegration is rejected, and finally, if it lies between the lower and the upper bounds, the
result is inconclusive. If series are cointegrated, we move to the third step by estimating the
long-run relationship. Finally, the Vector Error Correction Model (VECM) is used to examine
the short-run dynamics.
5. EMPIRICS
5.1. Trade openness, FDI and the overall real wage
As mentioned previously, implementing unit root tests is a preliminary exercise before testing
for the existence of the long-run relationship among variables. Table 3 presents the results of
unit root tests for the level and first-difference series. As shown in this table, variables
associated to the average real wage, imports and trade openness are non-stationary in levels,
but stationary in first-difference (I(1)). Contrary, the unit root tests yield that FDI and exports
are stationary in level, or I(0).
(Table 3 about here)
Having established that each of the five variables is integrated of order zero or order one, the
long-run equilibrium between annual real wage and variables reflecting the extent of
economic globalization (FDI, exports, imports and trade) are checked using the ARDL
procedure. In order to ensure the robustness of our results, six different models have been
estimated, i.e. both bivariate and multivariate cointegration.
(Table 4 about here)
June 27-28, 2012Cambridge, UK 21
2012 Cambridge Business & Economics Conference ISBN : 9780974211428
The computed F-statistics as well as the critical values at 5% and 10% significance levels are
summarized in table 5, panel A, while the panel B deals with various diagnostic tests
associated to the estimated ARDL model. Results drawn from panel A show that the null
hypothesis of no-cointegration cannot be accepted at the 5% significance level for model 3
and 5 and at the 10% significance level for model 1 and 4. Contrariwise, the same panel
displays that the null hypothesis of cointegration cannot be rejected for model 2 and model 6.
(Table 5 about here)
Based on these results, two main statements can be advanced. On the one hand, there is strong
evidence of a long-run relationship among variables associated to the degree of trade
openness and the average annual wage. For the bivariate analysis, cointegration among these
variables exists whether exports and imports are taken separately or together (the sum of
exports and imports, i.e. trade) with average real wages. In fact, the calculated F-statistics
associated to model 3, 4 and 5 are all higher than the upper critical values. On the other hand,
foreign direct investments seem not to have a long-run relationship with the annual average
wage. When taken together (models 1 and 2), the ARDL bound testing suggests the existence
of a long-run convergence relationship between international trade, FDI and wages but not
between exports, imports, FDI and wages. I fact, the calculated F-statistics associated to
model 2 ranges between the lower bound and the upper bound. In this case, no conclusion
about the existence of cointegration can be advanced. It is important to note that, according to
results presented in the table 5, panel B, the six estimated ARDL models well pass all the
computed diagnostics tests (the Breusch–Godfrey serial correlation test, the heteroscedasticity
test and the functional form test). As suggested by Pesaran and Pesaran (1997), the
cumulative sum of recursive residuals (CUSUM) is used to check for parameters stability.
According to graphs, not reported here, the CUSUM plots cross the 5% critical bounds,
suggesting the absence of any structural instability in the estimated ARDL models.
June 27-28, 2012Cambridge, UK 22
2012 Cambridge Business & Economics Conference ISBN : 9780974211428
We move now to the estimation of the long-run relationships between the economic
globalization indicators and the annual wages for models for which cointegration exists. Thus,
models 2 and 6 are excluded from the analysis at this stage of the study. Results are displayed
in table 6.
(Table 6 about here)
It is clear from the estimation of the first model that the coefficient associated to trade
openness is positive and statistically significant at 1% level, while that of FDI is negative but
no statistically significant. The estimated trade openness coefficient implies that a 1%
increase in trade openness will result in about 2% increase in the annual real wages. These
findings are in line with the HOS predictions which stipulate that trade openness improves the
absolute wages in the long-run. Despite the coefficient associated to FDI is not significant, it
seems to have the sign anticipate by the political economy partisans. More FDI induce a
reduction in the bargaining power of local trade unions, and consequently a fall in wages. The
positive effects of trade openness on annual wages are confirmed in models 3, 4 and 5. In fact,
the estimation of the bivariate regressions between trade, exports, imports on the one hand
and the average annual wage on the other hand shows that the associated coefficients are all
positive and statistically significant. Both exports and imports affect positively the average
wage in the long-run. Based on a sample composed by 5 Central and Eastern European
countries, Onoran and Stockhammer (2008) find that imports from the European Union
enhance the real wages in long-run. They argue that intermediate goods constitute a big part
of imports, which will be transformed and then exported. We think that Tunisia plays the
same role such as these countries. For example, the textile and the electrical industries
constitute the two main exporting sectors in the country. The big share of imports in these two
sectors is composed by intermediate inputs which will be transformed by local firms or by
outsourced companies coming from the European Union.
June 27-28, 2012Cambridge, UK 23
2012 Cambridge Business & Economics Conference ISBN : 9780974211428
Having determined the stable long-run relationships between economic globalization
variables and real wages, we proceed now to the estimation of the short-run effects, via the
implementation of the error correction model. It is important to note here that the error
correction term represents the speed of adjustments to return to the long-run equilibrium. In
other words, this term gives an idea about the extent with which the deviation from the long-
run equilibrium is corrected through partial short-run adjustments. Results are displayed in
table 7.
(Table 7 about here)
Results displayed in this table suggest that the lagged error-correction term obtained from the
long-run equilibrium relationship is negative and statistically significant at 1% confidence
level in all cases. These findings substantiate those relative to the bounds testing technique for
cointegration previously presented. Approximately, 25% of the disequilibria from the long-
run relationship between FDI, international trade and real wages are corrected. Similar results
are found in models 3, 4 and 5. In addition, the speed of adjustment is found to be higher in
the import-equation (-0.234) than that in the export-equation (-0.194). Coefficients associated
to trade, FDI, exports and imports are negative but not statistically significant. Thus, these
variables didn’t exert any effect on real wages in the short-run.
5.2. Trade openness, FDI and real wages in the manufacturing sector
As for the moment, the same methodology employed in the section 5.1 will be applied, but for
the manufacturing sub-sectors. This allows us to empirically test the validity of our second
assumption, based essentially on the developments conducted by Edwards (1988).
The first step is to classify the subsectors into exportable and importable sectors. To do this,
we were referred to Haouas et al. (2005). Thus, only the textiles, clothing and leather industry
and the pottery, glass and other construction materials industry are considered as exportable
sectors, while other sectors are qualified as importable. The data covers only the period 1990-
June 27-28, 2012Cambridge, UK 24
2012 Cambridge Business & Economics Conference ISBN : 9780974211428
2008. We were confronted to a lack of data on disaggregated FDI by sub-sectors, which exist
only for this period. To start, we test the stationarity status of all variables included in the
regressions. Table 8 reports the results from the ADF, PP and Ng-Perron unit root tests.
(Table 8 about here)
It can been observed that, except the other manufacturing industries, the unit root tests reveals
that real wages, international trade and FDI are either integrated of order zero or order one.
For the other manufacturing industries, all unit root tests reveal the non-stationarity of the
sectoral real wages, even in first difference, which means that this variable is integrated of
order two or more. Thus, the ARDL bounds testing procedure cannot be applied for this
subsector. The next step is to check for the existence of cointegration relationships among
variables. For each sector, three different models are estimated, so that both bivariate and
multivariate cointegration tests are implemented.
(Table 9 about here)
The panel A of table 10 reports the calculated F-statistics and the appropriate asymptotic
critical values at 5% and 10% statistical levels. We start by searching for long-run
relationships between economic globalization and real wages for the whole manufacturing
sector. The F-statistics is found to be below the 5% and 10% lower bounds, which suggest
that no long-run relationships between trade, FDI and real wages exist. We move then to the
application of the ARDL procedure to the five sub-sectors constituting the manufacturing
sector.
(Table 10 about here)
As shown in this table, cointegration between international trade, FDI and real wages seems
to be verified only in the textiles, clothing and leather industry. Once we estimate bivariate
versions of the ARDL model (models 2 and 3), we found that only trade openness and real
wages are cointegrated at 10% level. For the other subsectors, the calculated F-statistics are
June 27-28, 2012Cambridge, UK 25
2012 Cambridge Business & Economics Conference ISBN : 9780974211428
generally too small and never exceeded the upper bound. These results are rigorous, since the
battery of diagnostic tests shows that the estimated ARDL models are adequately specified.
The CUSUM test proves that the estimated parameters are stable for all sectors. Thus, one can
advance that the long-run equilibrium relationship between international trade and real wages
in the textiles, clothing and leather industry is robust. The estimation of the long-run
coefficients will either confirm or invalidate this statement. Table 11 summarizes the long-run
coefficients for the textiles, clothing and leather industry.
(Table 11 about here)
Results drawn from this table display that, in the long-run, both international trade and FDI
exert a positive impact on real wages in the textiles, clothing and leather industry. The
coefficient associated to international trade is more important and statistically more
significant than the one associated to FDI. The positive impact of international trade on real
wages is confirmed even when we estimated the second model. Coefficient associated to
international trade did not vary significantly in the two regressions. Thus, as in the whole
economy, we conclude that international trade positively impacts real wages in the long-run.
The novelty here is that FDI seems to enhance the real wages in the long term only in sector.
The final step in our analysis is to conduct the short-run dynamics between international trade,
FDI and real wages. The table 12 deals with coefficients obtained from the error correction
model estimation.
(Table 12 about here)
Based on the estimation of the first model, one can advance that FDI inflows were able to
improve the real wages in the textiles, clothing and leather industry in the short-run. The
coefficient assigned to international trade is not statistically significant. Even when we
estimated the second model, its coefficient is significant only at 10% level. The error
correction term has the expected sign and is statistically significant. The speed of adjustment
June 27-28, 2012Cambridge, UK 26

2012 Cambridge Business & Economics Conference ISBN : 9780974211428
is relatively high, since 56.1% of the disequilibria from the long-run relationship between real
wages, FDI and international trade are corrected. These findings support the results of the
bounds test for cointegration previously presented.
These findings support the fact that both FDI and international trade positively impacts real
wages in the textiles, clothing and leather industry in the short-run and in the long-run. As
mentioned previously, this sector is considered as an exportable sector. The predictions of the
Edwards model are only verified in the long-run, since international trade enhances the real
wages. In the short-run, the same model predicts negative effects of international trade on real
wages, a prediction not verified in our case. At the same time, foreign direct investments have
supported the real wage in the same sector during the last four decades. The collapse of real
wages induced by the deterioration of the bargaining power hypothesis (due to the surge of
FDI) is not confirmed in the case of the Tunisian textile, clothing and leather industry. As
suggested by Onoran and Stockhammer (2008), the predictions of the political economists
may be observed only in the medium-run. Even if the chemical industry and the electrical and
electronic industry still considered as the most important manufacturing recipients of foreign
direct investments (in 2009, these two sectors received about 60 % of total manufacturing
foreign investments), their effects on real wages still obvious.
5.3. Trade openness, FDI and wage inequality
The final assumption we have the intention to investigate treats the effects of international
trade and FDI on the dynamics of wage inequality over the period 1970-2009. The HOS
model stipulates that trade liberalization reduces the wage inequality between skilled and
unskilled workers, while Feenstra and Hanson (1996) support the opposite point of view.
As mentioned in the previous section, three different wage inequality indicators are
constructed, in order to check for the robustness of our results. The stationarity of these
indicators, as well as of the proxies of economic globalization are presented in the table 13.
June 27-28, 2012Cambridge, UK 27
2012 Cambridge Business & Economics Conference ISBN : 9780974211428
(Table 13 about here)
The ADF, PP and Ng-Perron unit root tests indicate that the three wage inequality indicators
and the trade openness are stationary in first-difference, which means that they are all
integrated of order one. Nevertheless, FDI are found to be stationary in level. We can now use
the ARDL procedure to test for the existence of cointegration relationships among them. For
each wage inequality indicator, three different models are estimated.
(Table 14 about here)
The table 15 reports the F-statistics computed from the ARDL model and the related
validation tests.
(Table 15 about here)
From the results reported in this table, it is clear that the F-statistics associated to the first and
second wage inequality indicators (WII1 and WII2) are characterized by low values, which
not exceed the upper bounds. Thus, the null hypothesis of no cointegration cannot be rejected.
Bigsten and Durevall (2006) employed the same wage inequality indicator (WII1) for the case
of Kenya between 1964 and 2000. Their results demonstrate that trade liberalization reduces
wage inequality between skilled and unskilled workers. The divergence of results may be due
to the choice of the trade liberalization indicators. We use the sum of exports and imports to
GDP in our study, while these authors employ the trade tariffs. The estimated ARDL bounds
testing models for cointegration associated to the third indicator (WII3) shows mixed results.
When both trade openness and FDI variables are regressed together on the wage inequality
indicator, the calculated F-statistics falls within the two bounds, then we cannot make
conclusive decision about the existence of cointegration or not. However, FDI are not
cointegrated with wage inequality. Finally, our results reveal that international trade and wage
inequality converge together to a unique long-run equilibrium. According to a range of
diagnostic tests, it seems that there are no violation problems in all models. As for the
June 27-28, 2012Cambridge, UK 28
2012 Cambridge Business & Economics Conference ISBN : 9780974211428
moment, we will estimate the long-run parameters associated to FDI and trade openness
variables for the bivariate and multivariate models. Since cointegration relationships exist
only when we have used the third wage inequality indicator, our analysis will be based only
on this indicator.
(Table 16 about here)
An interesting finding is that the estimates of the trade openness parameters in the long-run
wage equation are moderately significant with a negative sign in both the bivariate and
multivariate analysis. This suggests that trade openness seems to reduce wage inequality
between skilled and unskilled workers, which corroborate with the predictions of the HOS
model. Contrariwise, the coefficient associated to FDI is negative too, but not statistically
significant. Finally, we move to the estimation of the error correction model, in order to check
for the short-run dynamics among variables. In table 17, results drawn from the estimation of
the error correction model are reported.
(Table 17 about here)
Results are similar to those found in the long-run, since FDI have no effects on wage
inequality and trade openness reduces its extent. It is important to note that the magnitude of
the coefficients associated to trade openness in the long-run estimates is higher than that
found in the error correction model, which imply that the variables have a stronger impact in
the long-run. The error correction term is negative and statistically significant at 5% level,
which means that any disequilibrium due to a short-run shock on the relationship will be
adjusted to converge to the long-run equilibrium. Moreover, the negative magnitude of the
error correction term, ranging between -0.14 and -0.17, reflects a low adjustment speed from
the short-run disequilibrium towards the state of long-run equilibrium. With respect to WII1
and WII2, the absence of cointegration between them and economic globalization indicators is
explained by the fact that they deal essentially with intersectoral wage inequality relative to
June 27-28, 2012Cambridge, UK 29
2012 Cambridge Business & Economics Conference ISBN : 9780974211428
agriculture, a sector not considered in the free trade agreement concluded between Tunisia
and the European Union. We think that the wage inequality indicator based on the
manufacturing sector is more representative of the skills/wages relation in general and more
appropriate for the Tunisian context.
6. CONCLUDING REMARKS
This paper has triple aims. The first one is to check for the effects of trade liberalization and
foreign direct investments on the real economy-wide wages in Tunisia between 1970 and
2009. The second objective is to establish the industry-specific effects of trade liberalization
and FDI in the manufacturing subsectors. Finally, we search to determinate the implications
of both trade liberalization and FDI on the dynamics of wage inequality. The ARDL bounds
testing procedure has been used in order to distinguish between short-run effects and long-run
effects. Our results suggest that trade liberalization have enhanced the real wages in Tunisia
only in the long-run. No effects have been detected in the short-run. At the same time, foreign
direct investments flows are not cointegrated with real wages. The second finding is that trade
liberalization and FDI positively impacts real wages only in the textiles, clothing and leather
industry. So, the predictions of the Edwards model are verified in the Tunisian manufacturing
sector. When moving to the third objective, the analysis suggests that trade liberalization, FDI
and wage inequality are cointegrated. There is a strong support to the HOS model predictions,
since trade liberalization reduces wage inequality between skilled and unskilled workers in
the long-run. On the other hand, we found that FDI didn’t interact with wage inequality.
Thus, one can conclude that trade liberalization has been beneficial for the Tunisian labor
market, in the sense that it has improved the level and the distribution of wages among
workers.
June 27-28, 2012Cambridge, UK 30
2012 Cambridge Business & Economics Conference ISBN : 9780974211428
REFERENCES
Agénor, P. R. & Aizenman, J. (1996). Trade liberalization and unemployment. The Journal of
International Trade and Economic Development, 5(3), 265-286.
Amusa, H., Amusa, K., & Mabugu, R. (2009). Aggregate demand for electricity in South
Africa. Energy policy, 37(10), 4167–4175.
Anderson, E., Tang, P. & Wood, A. (2006). Globalization, co-operation costs and wage
inequalities. Oxford Economic Paper, 58(4), 569-595.
Ang, J. B. (2008). Determinants of foreign direct investment in Malaysia. Journal of policy
Modeling, 30(1), 185-189.
Arbache, J. S., Dickerson, A. & Green, F. (2004). Trade liberalisation and wages in
developing countries. The Economic Journal, 114(493), F73-F96.
Beyer, H., Rojas, P. & Vergara, R. (1999). Trade liberalization and wage inequality. Journal
of Development Economics, 59(1), 103-123.
Bigsten, A. & Durevall, D. (2006). Openness and wage inequality in Kenya, 1964–2000;
World Development, 34(3), 465-480.
Damijan, J. P., Knell, M., Majcen, B. & Rojec, M. (2003). Technology transfer through FDI
in Top-10 transition countries: how important are direct effects, horizontal and vertical
spillovers?. William Davidson Institute Working Paper Series n° 17.
Dickey, D. A. & Fuller, W. A. (1979). Distribution of the estimators for autoregressive time
series with a unit root. Journal of the American Statistical Association, 74(366), 427- 431.
Duasa, J. (2007). Determinants of Malaysian trade balance: An ARDL bound testing
approach. Journal of Economic Cooperation, 28 (3), 21-40.
Edwards, E. (1988). Terms of trade, tariffs, and labor market adjustment in developing
countries. World Bank Economic Review, 2(2), 165-185.
June 27-28, 2012Cambridge, UK 31
2012 Cambridge Business & Economics Conference ISBN : 9780974211428
Egger. P., & Stehrer, R. (2001). International Outsourcing and the Skill-Specific Wage Bill in
Eastern Europe. The Vienna Institute for International Economic Studies, Working Paper No.
17.
Feenstra, R. C. & Hanson, G. H. (1997). Foreign direct investment and relative wages:
Evidence from Mexico's maquiladoras. Journal of International Economics, 42(3-4), 371-393.
Figini, P. & Gorg, H. (2006). Does foreign direct investment affect wage inequality? an
empirical investigation. IZA Discussion Paper n°. 2336.
Fosu, A. K. (2000). International trade and labor market adjustment in developing countries.
Paper presented at the International Economic Association
Ghose, A. K. (2000). Trade liberalization and manufacturing employment. ILO Employment
Paper n° 03.
Gorg, H. & Strob, E. (2002). Relative wages, openness and skill-biased technological change.
IZA Discussion Paper n° 596.
Gouider, A. (2010). Le marché du travail en Tunisie entre segmentation et flexibilité.
Revue Européenne du Droit social, 4(1).
Grenier, G. & Tavakoli, A. (2006). Globalization and wage inequality in the Canadian
manufacturing sector: a time series analysis. Global Economy Journal, 6(2).
Haouas, I., Yagoubi, M. & Heshmati, A. (2005). The impacts of trade liberalization on
employment and wages in Tunisian industries. Journal of International Development, 17(4),
527-551.
Harris, R., Sollis, R. (2003). Applied Time Series Modelling and Forecasting. West Sussex:
Wiley.
International Labour Organization (2011). Trade and employment: from myths to facts.
Janicki, H. P. & Wunnava, P. V. (2004). Determinants of foreign direct investment: empirical
evidence from EU accession candidates. Applied Economics, 36(5), 505-509.
June 27-28, 2012Cambridge, UK 32
2012 Cambridge Business & Economics Conference ISBN : 9780974211428
Jaumotte, F., Lall, S. & Papageorgiou, C. (2008). Rising Income Inequality: Technology, or
Trade and Financial Globalization?. International Monetary Fund Working Paper n°. 185.
Jayasuriya, R. (2008). The effects of globalization working conditions in developing
countries: An analysis framework and country study results. World Bank Employment Policy
Primer n° 9.
Johansen, S. & Juselius, K. (1990). Maximum likelihood estimation and inference on
cointegration-with applications to the demand for money. Oxford Bulletin of Economics and
Statistics, 52(2), 169- 210.
Krueger, A. (1983. Trade and Employment in Developing Countries, 3 Synthesis and
Conclusions. Chicago: University of Chicago Press.
Lall S., (2002). The employment impact of globalisation in developing countries. QEH
Working Paper Series n°. QEHWPS93.
Landesmann, M., Vidovic, H., & Ward, T. (2004). Economic restructuring and labor market
developments in the new EU member states. WIIW Research Report, n°. 312.
Leamer, E. L. (1995). The Heckscher-Ohlin model in theory and practice. Princeton Studies
in International Finance n°. 77.
Lee, E. & Vivarelli, M. (2006). The social impact of globalization in the developing countries.
International Labour Review, 145(3), 167-184.
Meschi, E. & Vivarelli, M. (2009). Trade and income inequality in developing countries.
World Development, 37(2), 287-302.
Ng, S., & Perron, P. (2001). Lag length selection and the construction of unit root tests with
good size and power. Econometrica, 69(6), 1519-1554.
Onaran, O. & Stockhammer, E. (2008). The effect of FDI and foreign trade on wages in the
Central and Eastern European Countries in the post-transition era: A sectoral analysis for the
manufacturing industry. Structural Change and Economic Dynamics, 19(1), 66-80.
June 27-28, 2012Cambridge, UK 33
2012 Cambridge Business & Economics Conference ISBN : 9780974211428
Paus E. A. & Robinson M. D. (1997). The implications of increasing economic openness for
real wages in developing countries, 1973–1990. World Development, 25(4), 537-547.
Peneder, M. (2001). Entrepreneurial competition and industrial location. Edward Elgar,
Northampton.
Pesaran, M. H., Shin, Y. & Smith, R. (2001). Bound testing approaches to the analysis of
level relationships. Journal of Applied Econometrics, 16(3), 289-326.
Pesaran, M. H., Pesaran, B. (1997). Working with Microfit 4.0: Interactive Economic
Analysis. Oxford: Oxford University Press.
Pesaran, M. H., Shin, Y. (1999). An autoregressive distributed lag modelling approach to
cointegration analysis. In Strom, S. (Ed.), Econometrics and Economic Theory in the 20th
Century: The Ragnar Frisch Centennial Symposium. Cambridge University Press, Cambridge.
Philips, P. C. B., & Perron, P. (1988). Testing for a unit root in time series regressions.
Biometrika, 75(2), 335-46.
Ramasamy, B. & Yeung. M. (2010). A causality analysis of the FDI-wages- productivity
nexus in China. Journal of Chinese Economic and Foreign Trade Studies, 3(1), 5-23.
Redjeb, M.S. & Ghobentini, M. (2005). L’intermédiation sur le marché du travail en Tunisie.
Cahiers de la Stratégie de l’Emploi n°.19, Unité de recherches et analyses sur l’emploi,
Département de la Stratégie en matière d’emploi.
Singh, A. & Dhumale, R. (2000). Globalization, technology, and income inequality.
UNU/WIDER Working Paper n°. 210.
Stampini, M. & Verdier-Chouchane, A. (2011). Labor Market Dynamics in Tunisia: The Issue
of Youth Unemployment. Review of Middle East Economics and Finance, 7(2).
Taylor, K. & Driffield, N. (2005). Wage inequality and the role of multinationals: evidence
from UK panel data. Labour Economics, 12(2), 223-249.
UNCTAD (2010). International merchandise trade indicators.
June 27-28, 2012Cambridge, UK 34
2012 Cambridge Business & Economics Conference ISBN : 9780974211428
Velde, D. W. & Morrissey, O. (2001). Foreign ownership and wages: Evidence from five
African countries. CREDIT Research paper n° 19.
Wood, A. (2002). Globalization and wage inequalities: A synthesis of three theories. Review
of World Economics, 138(1), 54-82.
World Bank (2004). Republic of Tunisia Employment Strategy, Vol.1.
World Bank (2008). Tunisia’s global integration: second generation of reforms to boost
growth and employment. Draft Report n°. 40129-TN.
Zivot, E. & Wang, J. (2002). Modelling financial time series with S-PLUS. New York:
Springer.
June 27-28, 2012Cambridge, UK 35

2012 Cambridge Business & Economics Conference ISBN : 9780974211428
Table 1. Jobs distribution according to economic sectors and the level of educational attainment 1989 1994 2000 2007
level % level % level % level %Whole economy 1900.6 100% 2186.4 100% 2552.8 100% 3085.2 100%
no schooling 619.6 32.6% 505.7 23.1% 443.1 17.3% 392.5 12.7%primary 730.1 38.5% 859.1 39.3% 1035.8 40.6% 1137.1 36.8%secondary 452 23.8% 654.6 30% 815.8 32% 1114.4 36.1%university 91.9 4.8% 161.4 7.4% 257.6 10.1% 436.8 14.1%
Agriculture 478.6 100% 462.5 100% 499.5 100% 565.9 100%no schooling 289.1 60.4% 244.7 53% 226.4 45.3% 214.2 37.8%primary 159.1 33.2% 173.8 37.6% 212.3 42.5% 245.4 43.4%secondary 28.2 5.9% 40.5 8.7% 57.4 11.5% 98.6 17.4%university 1.2 0.3% 2.7 0.6% 3.4 0.7% 7.1 1.2%
Industry 634.8 100% 727.2 100% 870.9 100% 993.9 100%no schooling 178.3 28.1% 146.1 20% 125.3 14.4% 87.0 8.8%primary 310.1 48.9% 373.7 51.4% 455.9 52.4% 469.7 47.3%secondary 133.7 21.1% 187.5 25.8% 285.5 32.8% 375.5 37.8%university 10.9 1.7% 18.7 2.6% 31.2 3.6% 61 6.2%
Services 757.6 100% 960.9 100% 1162.7 100% 1496.2 100%no schooling 144.8 19.1% 108.0 11.2% 90 7.8% 85.5 5.7%primary 250.2 33% 298.1 31.1% 358.1 30.8% 411.9 27.5%secondary 282.6 37.3% 415.2 43.2% 492.8 42.4% 613.7 41%university 76.1 10% 137.2 14.3% 221.6 19.1% 364 24.3%
Source: The Tunisian Institute of Competitiveness and Quantitative Studies
June 27-28, 2012Cambridge, UK 36
Table 2. Annual real wage before and after the conclusion of the FTA with the European UnionAverage
(1983-2009)Pre-liberalization
(1983-1995)Post-liberalization
(1996-2009) Whole economy 6050,840 5373,364 6679,926 Agriculture 2414,298 1606,403 3164,487 Manufacturing sectors 5797,539 5673,037 5913,147 Non-manufacturing sectors 4514,475 3798,826 5179,006 Services 6596,701 6306,164 6866,485Notes: Data are expressed in constant Tunisian dinar and are obtained from the Tunisian Institute of Competitiveness and Quantitative Studies.
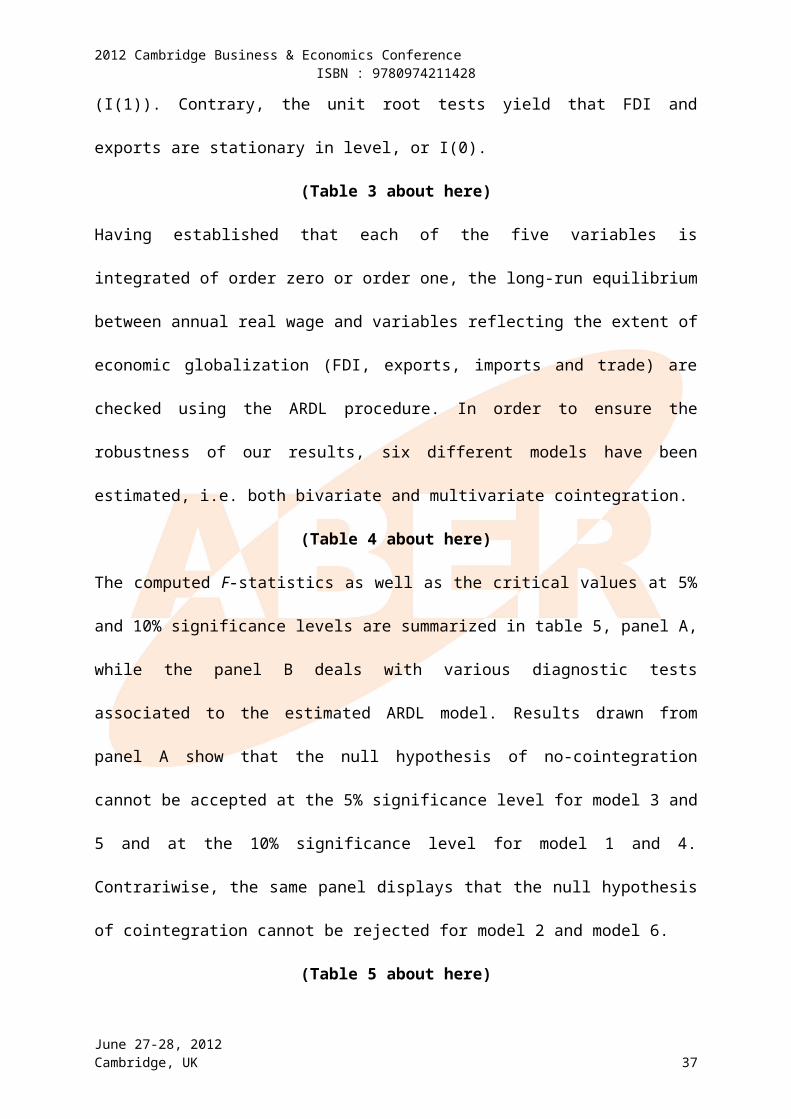
2012 Cambridge Business & Economics Conference ISBN : 9780974211428
Table 3. Unit root tests
Variables ADF PP Ng-PerronMZa MZt
AW -1.752 -1.760 -4.570 -1.434FDI -3.751** -3.652** -15.765* -2.806*
EXP -4.047** -3.459 -18.700* -3.041*
IMP -2.419 -2.361 -6.082 -1.717TRD -3.341 -2.665 -7.519 -1.911Δ (AW) -5.669** -5.650** -18.930** -3.075**
Δ (FDI) -7.905** -18.757** -17.516** -2.922**
Δ (EXP) -5.516** -6.552** -18.731** -2.902**
Δ (IMP) -5.430** -5.419** -18.626** -2.920**
Δ (TRD) -5.272** -5.112** -18.864** -2.890**
ADF and PP refer, respectively, to the Augmented Dickey-Fuller and the Phillips-Perron unit root tests. MZa and MZt are two statistics related to the Ng-Perron unit root test. AW, FDI, EXP, IMP and TRD stand respectively for annual average wage, foreign direct investments, exports, imports and trade. Δ is the first difference operator. The max lag order is set to be 9 for the ADF and the Ng-Perron tests. The Schwarz information criterion and the autoregressive GLS-detrented spectral estimation method are used to select the optimal lag length, respectively, for the ADF and the Ng-Perron unit root tests. The Newey-West Bandwidth method using Bartlett kernel is used for the PP test. Critical values for the ADF and PP tests are obtained from McKinnon (1996), while those associated to the Ng-Perron test are from Ng and Perron (2001). The null hypothesis is the existence of unit root. ** and * denote, respectively, the rejection of the null hypothesis at 5% and 10% significance levels. All specifications include a constant term, but the deterministic trend is included only in levels.
June 27-28, 2012Cambridge, UK 37
Table 4. Estimated models Model Specification Model 1 AW=f (TRD, FDI) Model 2 AW=f (EXP, IMP, FDI) Model 3 AW=f (TRD) Model 4 AW=f (EXP) Model 5 AW=f (IMP) Model 6 AW=f (FDI)
2012 Cambridge Business & Economics Conference ISBN : 9780974211428
Table 5. Bounds F-tests for cointegration with diagnostic testsPanel A: Bounds testing for cointegration
Models F-statistic
Critical bounds0.10 0.05
Lower bound I (0)
Upper bound I (1)
Lower bound I (0)
Upper bound I (1)
F (AW|TRD,FDI) 4.788* 3.354 4.343 4.101 5.256F (AW|EXP,IMP,FDI) 3.759 2.923 4.036 3.560 4.836F (AW|TRD) 6.965** 4.229 5.059 5.266 6.159F (AW|EXP) 5.134* 4.229 5.059 5.266 6.159F (AW|IMP) 6.959** 4.229 5.059 5.266 6.159F (AW|FDI) 3.816 4.229 5.059 5.266 6.159Panel B: Diagnostic tests of the underlying the ARDL model
LM test ARCH test RESET test CUSUM Adjusted R²Statistic p-value Statistic p-value Statistic p-valueModel 1 (AW-TRD-FDI) .148 .700 .431 .511 .001 .986 Stable .961Model 2 (AW-EXP-IMP- .072 .787 .481 .488 .008 .926 Stable .961Model 3 (AW-TRD) .213 .644 .507 .476 .054 .816 Stable .961Model 4 (AW-EXP) .287 .592 .534 .465 .640 .424 Stable .958Model 5 (AW-IMP) .011 .913 .514 .473 .033 .855 Stable .960Model 6 (AW-FDI) .017 .895 .755 .385 2.055 .152 Stable .948The Schwarz information criterion is used to select the optimal lag length for the ARDL model. ** and * denote the presence of cointegration at the level of 0.05 and 0.10, respectively. LM test, ARCH test and RESET test refer, respectively, to the Breusch–Godfrey Lagrange multiplier test for residual serial correlation, the autoregressive conditional heteroscedasticity test and the Ramsey's test for functional misspecification. CUSUM is the test of parameter instability (decision based on graph inspection).
June 27-28, 2012Cambridge, UK 38
Table 6. Long-run coefficients estimatesRegressors Coefficients Standard Error ProbabilityModel 1 (AW-TRD-FDI)FDI -.079 .120 .515TRD 1.938*** .406 .000constant .145 1.757 .935Model 3 (AW-TRD)TRD 1.783*** .3554 .000constant 0.775 1.5838 .627Model 4 (AW-EXP)EXP 1.675*** .4375 .001constant 2.535 1.6271 .129Model 5 (AW-IMP)IMP 1.747 *** .3530 .000constant 2.051 1.3435 .136Notes: the ARDL lag selection is based on SBC. ***, ** and * denote, respectively, the statistical significance at the 1%, 5% and 10% levels.
2012 Cambridge Business & Economics Conference ISBN : 9780974211428
Table 7. The error correction representation model Regressor Coefficients Standard error T-ratio ProbabilityModel 1 (AW-TRD-FDI)Δ FDIt -.0198 .031 -.631 .532Δ TRDt -.0952 .222 -.428 .671ECTt-1 -.2498*** .068 -3.641 .001Model 3 (AW-TRD)Δ TRDt -.1045 .2196 -.4758 .637ECTt-1 -.2363*** .0645 -3.6593 .001Model 4 (AW-EXP)Δ EXPt -.0558 .1948 -.2867 .776ECTt-1 -.1945*** .0624 -3.1169 .004Model 5 (AW-IMP)Δ IMPt -.1318 .2183 -.6040 .550ECTt-1 -.2345*** .0639 -3.6842 .001***, ** and * denote, respectively, the statistical significance at the 1%, 5% and 10% levels.
Table 8. Unit root tests
Variables ADF PPNg-Perron
MZa MZtAll manufacturing industriesAW -1.695 -1.720 -2.864 -1.173FDI -2.854 -2.139 -32.359** -4.013**
TRD -1.345 -1.271 -16.352* -2.673*
Δ(AW) -3.271** -3.271** -7.918* -1.915*
Δ (FDI) -6.251** -5.880** -6.851* -1.849*
Δ (TRD) -3.420 -3.365** -8.064** -1.976*
Pottery, glass and other construction materials industryAW -1.683 -1.772 -4.443 -1.482FDI -1.625 -3.981** -8.974 -2.104TRD -3.006 -3.003 -5.844 -1.520Δ (AW) -3.616** -3.600** -8.105** -1.924*
Δ (FDI) -9.016** -10.042** -4.449 -1.486Δ (TRD) -3.126** -6.238** -7.037* -1.833*
Agro-food industryAW -1.818 -1.914 -4.551 -1.507FDI -1.778 -1.868 -5.764 -1.610TRD -3.323 -3.328 -8.488 -1.982Δ (AW) -3.140** -3.089** -8.305** -1.918*
Δ (FDI) -5.887** -5.727** -7.627* -1.931*
Δ (TRD) -6.984** -7.263** -6.803* -1.825*
Mechanical, electrical and electronic industryAW -2.051 -2.051 -7.353 -1.728FDI -3.713** -1.457 -3.163 -1.083TRD -2.269 -2.358 -6.737 -1.834Δ (AW) -3.990** -3.945** -8.365** -1.853*
Δ (FDI) -3.214** -3.230** -7.471* -1.886*
Δ (TRD) -4.016** -4.117** -8.386** -2.045**
Chemical industryAW -2.833 -2.848 -8.004 -1.978FDI -3.713* -3.703** -8.045 -1.925TRD -1.218 -1.149 -1.700 -.607Δ (AW) -4.662** -5.007** -8.075* -1.901*
Δ (FDI) -6.736** -7.008** -6.472* -1.787*
Δ (TRD) -3.471** -3.471** -5.360 -1.431Textiles, clothing and leather industryAW -1.779 -1.727 -2.603 -1.063FDI -2.718 -2.069 -21.228** -3.212**
June 27-28, 2012Cambridge, UK 39
2012 Cambridge Business & Economics Conference ISBN : 9780974211428
TRD -2.789 -2.789 -6.787 -1.836Δ (AW) -3.934** -3.934** -8.105** -2.012**
Δ (FDI) -3.455** -3.128** -8.249** -1.963*
Δ (TRD) -5.274** -5.326** -7.921* -1.651*
Other manufacturing industries AW -.983 -1.606 -3.352 -1.245FDI -3.859** -2.074 -28.814** -3.793**
TRD -1.796 -.369 -3.003 -.909Δ (AW) -2.063 -4.829** -3.679 -1.293Δ (FDI) -4.269** -2.939* -33.944** -4.104**
Δ (TRD) -.851 -4.382** 5.303 5.104For notes and abbreviations, see table 3.
Table 10. Bounds F-tests for cointegration with diagnostic testsPanel A: Bounds testing for cointegration
Models F-statistic
Critical bounds0.10 0.05
Lower bound I (0)
Upper bound I (1)
Lower bound I (0)
Upper bound I (1)
All manufacturing industriesF (AW|TRD,FDI) 1.479 3.809 4.925 4.904 6.240F (AW|TRD) 1.492 4.640 5.523 5.951 7.082F (AW|FDI) .936 4.640 5.523 5.951 7.082Pottery, glass and other construction materials industryF (AW|TRD,FDI) .395 3.809 4.925 4.904 6.240F (AW|TRD) .206 4.640 5.523 5.951 7.082F (AW|FDI) .636 4.640 5.523 5.951 7.082Agro-food industryF (AW|TRD,FDI) .636 3.809 4.925 4.904 6.240F (AW|TRD) .677 4.640 5.523 5.951 7.082F (AW|FDI) .616 4.640 5.523 5.951 7.082Mechanical, electrical and electronic industryF (AW|TRD,FDI) 2.694 3.809 4.925 4.904 6.240F (AW|TRD) 4.118 4.640 5.523 5.951 7.082F (AW|FDI) .143 2.479 3.688 3.750 4.796Chemical industryF (AW|TRD,FDI) 3.031 3.809 4.925 4.904 6.240F (AW|TRD) .367 2.479 3.688 3.750 4.796F (AW|FDI) 4.137 4.640 5.523 5.951 7.082
June 27-28, 2012Cambridge, UK 40
Table 9. Estimated models Model Specification Model 1 AW=f (TRD, FDI) Model 2 AW=f (TRD) Model 3 AW=f (FDI)
2012 Cambridge Business & Economics Conference ISBN : 9780974211428
Textiles, clothing and leather industryF (AW|TRD,FDI) 13.520** 3.809 4.925 4.904 6.240F (AW|TRD) 6.400* 4.640 5.523 5.951 7.082F (AW|FDI) .309 4.640 5.523 5.951 7.082
Panel B: Diagnostic tests of the underlying ARDL modelLM test ARCH test RESET test CUSUM Adjusted R²Statistic p-value Statistic p-value Statistic p-value
All manufacturing industriesModel 1 (AW-TRD-FDI) .219 .639 .525 .819 .134 .714 Stable .892Model 2 (AW-TRD) .006 .936 .095 .757 .102 .749 Stable .880Model 3 (AW FDI) .198 .656 .508 .476 2.024 .155 Stable .875
Pottery, glass and other construction materials industryModel 1 (AW-TRD-FDI) .802 .370 .584 .444 .004 .945 Stable .894Model 2 (AW-TRD) .453 .501 .340 .559 .041 .839 Stable .860Model 3 (AW FDI) .641 .423 .510 .475 .030 .860 Stable .899
Agro-food industryModel 1 (AW-TRD-FDI) .209 .647 .562 .453 .582 .445 Stable .859Model 2 (AW-TRD) .320 .572 .367 .544 .103 .748 Stable .845Model 3 (AW FDI) .383 .536 .224 .635 .811 .368 Stable .854
Mechanical, electrical and electronic industryModel 1 (AW-TRD-FDI) 1.138 .286 .179 .672 .012 .912 Stable .367Model 2 (AW-TRD) .552 .457 .705 .401 .047 .827 Stable .346Model 3 (AW FDI) .347 .556 1.090 .296 3.466 .063 Stable -.146Chemical industryModel 1 (AW-TRD-FDI) .981 .322 .610 .435 3.698 .054 Stable .298Model 2 (AW-TRD) .921 .337 .010 .918 6.108 .011 Stable -.423Model 3 (AW FDI) 1.711 .191 1.084 .298 1.725 .189 Stable .249
Textiles, clothing and leather industryModel 1 (AW-TRD-FDI) .478 .489 .395 .530 .137 .711 Stable .977Model 2 (AW-TRD) .005 .943 1.085 .297 2.160 .142 Stable .931Model 3 (AW FDI) .052 .819 .110 .740 .0003 .979 Stable .871
For notes and abbreviations, see table 5.
Table 12. The error correction representation model
June 27-28, 2012Cambridge, UK 41
Table 11. Long-run coefficients for the ARDL modelRegressors Coefficients Standard Error ProbabilityModel 1 (AW-TR-FDI)FDI .121** .051 .041TRD 3.064*** .399 .000constant -9.960*** 2.387 .002Model 2 (AW-TR)TRD 3.220*** .485 .000constant -10.822*** 2.895 .003
For notes and abbreviations, see table 6.
2012 Cambridge Business & Economics Conference ISBN : 9780974211428
Regressor Coefficients Standard error T-ratio ProbabilityModel 1 (AW-TR-FDI)ΔFDIt .081*** .021 3.783 .003Δ TRDt -.029 .302 -.099 .923ECTt-1 -.561*** .161 -3.466 .005Model 2 (AW-TR)ΔTRDt .629* .346 1.815 .093ECTt-1 -.2656*** .0776 -3.4208 .002
For notes and abbreviations, see table 7.
Table 13. Unit root tests
Variables ADF PP Ng-PerronMZa MZt
WII1 -3.130 -3.050 -12.794 -2.519WII2 -2.922 -2.922 -11.448 -2.389WII3 -1.879 -1.879 -2.680 -.954FDI -3.751** -3.652** -15.765* -2.806*
TRD -3.341 -2.665 -7.519 -1.911Δ (WII1) -7.839** -16.289** -18.1.6** -2.995**
Δ (WII2) -7.842** -9.055** -18.483** -3.013**
Δ (WII3) -6.184** -6.184** -18.970** -3.027**
Δ (FDI) -7.905** -18.757** -17.516** -2.922**
Δ (TRD) -5.272** -5.112** -18.864** -2.890**
WII1, WII2 and WII3 stand for wage inequality indicators. FDI and TRD are respectively foreign direct investments and trade. For notes, see table 3
Table 15. Bounds F-tests for cointegration with diagnostic testsPanel A: Bounds testing for cointegration
June 27-28, 2012Cambridge, UK 42
Table 14. Estimated models Model Specification Model 1 WII=f (TRD, FDI) Model 2 WII=f (TRD) Model 3 WII=f (FDI)
2012 Cambridge Business & Economics Conference ISBN : 9780974211428
Models F-statistic
Critical bounds0.10 0.05
Lower bound I (0)
Upper bound I (1)
Lower bound I (0)
Upper bound I (1)
F (WII1|TRD,FDI) 1.1249 3.354 4.3436 4.1018 5.2566F (WII1|FDI) .6785 4.2292 5.0595 5.2666 6.1598F (WII1|TRD) 1.7338 4.2292 5.0595 5.2666 6.1598F (WII2|TRD,FDI) 1.4537 3.354 4.3436 4.1018 5.2566F (WII2|FDI) 1.0538 4.2292 5.0595 5.2666 6.1598F (WII2|TRD) 2.1731 4.2292 5.0595 5.2666 6.1598F (WII3|TRD,FDI) 3.6610 3.354 4.3436 4.1018 5.2566F (WII3|FDI) 2.7062 4.2292 5.0595 5.2666 6.1598F (WII3|TRD) 5.1471* 4.2292 5.0595 5.2666 6.1598
Panel B: Diagnostic tests of the underlying ARDL modelLM ARCH RESET CUSUM R-
squaredStatistic p-value Statistic p-value Statistic p-valueModel 1A (WII1-TRD-FDI) 1.8778 .171 1.4821 .223 .2509 .616 Stable .879Model 2A (WII1-FDI) 1.9503 .163 1.5010 .221 .5091 .476 Stable .877Model 3A (WII1-TRD) 1.9285 .165 1.5049 .220 .2553 .612 Stable .879Model 1B (WII2-TRD-FDI) 2.6587 .103 1.2704 .260 .5037 .478 Stable .853Model 2B (WII2-FDI) 1.9151 .166 1.8732 .171 .2966 .586 Stable .832Model 3B (WII2-TRD) 2.6566 .103 1.2634 .261 .4883 .485 Stable .853Model 1C (WII3-TRD-FDI) 1.1037 .293 .0329 .856 .1158 .734 Stable .848Model 2C (WII3-FDI) .0560 .813 .8011 .371 2.4774 .115 Stable .809Model 3C (WII3-TRD) 1.3028 .254 .0137 .906 .0240 .877 Stable .843WII1, WII2 and WII3 stand for wage inequality indicators. FDI and TRD are respectively foreign direct investments and trade. For notes, see table 5.
June 27-28, 2012Cambridge, UK 43
Table 16. Long-run coefficients for ARDL modelRegressors Coefficients Standard Error ProbabilityModel 1C (WII3 -TRD-FDI)FDI -.0921 .0873 .299TRD -.8658* .4931 .088constant 4.1987* 2.1607 .060Model 3C (WII3-TRD)TRD -1.2105* .6140 .057constant 5.6498** 2.0834 .045For notes, see table 6
2012 Cambridge Business & Economics Conference ISBN : 9780974211428
June 27-28, 2012Cambridge, UK 44
Table 17. The error correction representation model Regressor Coefficients Standard error T-ratio ProbabilityModel 1C (WII3 -TRD-FDI)ΔFDIt -.0159 .0164 -.9675 .340Δ TRDt -.1497*** .0510 -2.9353 .006ECTt-1 -.1729** .0763 -2.2659 .030Model 3C (WII3-TRD)Δ TRDt -.1736*** .0446 -3.8910 .000ECTt-1 -.1434** .0699 -2.0519 .048For notes, see table 7.
0.0E+00
5.0E+09
1.0E+10
1.5E+10
0
20
40
60
80
1960 1965 1970 1975 1980 1985 1990 1995 2000 2005
Imports of goods and services Imports as a share of GDP (%)Exports of goods and services Exports as a share of GDP (%)
1
2
3
4
5
6
1970 1975 1980 1985 1990 1995 2000 2005
WII1
2
4
6
8
10
1970 1975 1980 1985 1990 1995 2000 2005
WII2
0.8
1.0
1.2
1.4
1.6
1970 1975 1980 1985 1990 1995 2000 2005
WII3
2012 Cambridge Business & Economics Conference ISBN : 9780974211428
Figure 1. Exports and imports of goods and services in Tunisia (1961-2009)
Notes: The left axis is for imports and exports of goods and services in constant 2000 US dollar, while the right one is for imports and exports of goods and services as a share of gross domestic product (%). Data are from World Development Indicators online, March 2011.
Figure 2. The evolution of wage inequality in Tunisia according to three indicators (1970-2009)
June 27-28, 2012Cambridge, UK 45
2012 Cambridge Business & Economics Conference ISBN : 9780974211428
ENDNOTES
Several recent reports emphasize importance of labor markets impacts of economic globalization, such as the World Economic Outlook (International Monetary Fund, April 2007), the OECD Employment Outlook (Organization for Economic Co-operation and Development, 2007) or the project on ‘Trade and employment: challenges for policy research’ (International Labor Office and the World Trade organization, 2010).2 As motioned by the World Bank (2008), the quality of human capital is considered as one of the comparative advantages of Tunisia in the industrial activities (World Bank (2008), p. 96-97)). 3 Exception is the study of Haouas et al. (2005), but which deals, only, with the effects of trade liberalization on wages using data for the period 1971-1996, i.e. before the signature of the free-trade agreement between Tunisia and the European Union. So, it cannot capture the effects of this agreement on the evolution of wages.4 ILO (2011), Trade and employment: From myths to facts.5 Edwards treated the effects of falling import prices on wages and employment during the transition period too. For details, see Edwards (1988), p.175-176.
6 The factors intensity of sectors is such a way that: 7 Since capital is immobile in the short term, Edwards argue that four production factors are used: labor and sector -specific capital: capital in exportable, capital in importable and capital in non-tradable.8 The sample is composed by: Brazil, Chili, Colombia, Ivory-Coast, Indonesia, South Korea, Pakistan, Thailand, Tunisia and Uruguay.9 In fact, the authors classified manufacturing sectors into four sub-groups, depending on two criterions: the capital/labor intensity and the level of skill needed in the industry. Sub-sectors are capital intensive using unskilled labor, capital intensive using skilled labor, labor intensive using unskilled labor and capital intensive using skilled labor. For the classification, authors are based on Peneder (2001) and Landesmann et al. (2004).10 According to the World Bank, in 2010, Tunisia’s fiscal deficit and public debt were, respectively, about 1.3% and 40% of GDP. Starting from 1990, inflation was generally between 2% and 5%.11 Values expressed in constant 2000 US dollars12 For an overview of the determinants of FDI in developing countries, see Asiedu (2002) and Ang (2008).13 In 2006, the national telecommunication company was privatized, 35% of its capital (3052 million dinars, the equivalent of 2290 million US$) was transferred to the Tecom-Dubai Investment Group.14 Statistics are based on a study conducted by the World Bank and the Tunisian ministry of employment and professional integration of youth. The global sample is composed by 4763 youth graduates. 15 According to definition used in the Key Indicators of the Labour Market database, youth are persons aged between 15 and 24 years.16 According to Doing Business.17 Until January 2011, all trade unions are centralized in the Union Générale des Travailleurs Tunisiens (UGTT). After this date, two supplementary institutions have been created.18 For further information, see the development previously presented dealing with the Edwards model (1988).19 Six subsectors are considered in this study, i.e. pottery, glass and other construction materials industry, agro-food industry, mechanical, electrical and electronic industry, chemical industry, textiles, clothing and leather industry and other manufacturing industries.
June 27-28, 2012Cambridge, UK 46