economic growth and competitiveness: a franco-german tale - here
TRANSCRIPT

Economic growth and competitiveness: a Franco-German tale
Stefan Collignon

p. 2Imprint
Imprint
© 2012 Bertelsmann Stiftung
Economic growth and competitiveness: a Franco-German tale
Stefan Collignon, September 2012
Bertelsmann Stiftung
Carl Bertelsmann Straße 256
D-33311 Gütersloh
www.bertelsmann-stiftung.de
Isabell Hoffmann
Telefon +49 5241 81 81313
Joachim Fritz-Vannahme
Telefon +49 5241 81 81421
Design:
Lucid, Berlin
Cover Illustration:
Andrea Ventura
1
2
34
56
7
8
9
10
1. Aristotle (384 BC - 322 BC)2. Thomas Robert Malthus (1766 - 1834)3. John Locke (1632 – 1704)4. Karl Marx (1818 - 1883)5. John Maynard Keynes (1883 - 1946)
6. Adam Smith (1723 - 1790)7. Friedrich August von Hayek (1899 - 1992)8. Jean-Baptiste Colbert, Marquis de Seignelay (1619 - 1683)9. Thomas von Aquin (1225 – 1274)10. Carl Menger (1840 - 1921)
p. 3
Abstract
For years France’s economy outshined Germany’s. Only recently did that change. France must now take German competitiveness as a benchmark, while Germany could learn a thing or two about sustaining productivity growth. Friendship is a two-way street.
German authorities should embrace French demands for stimulating growth in Europe. Germany has always had a tendency to suffer from structural stagnation. Germany’s product portfolio is about to become out-dated and its supply-side advantages are erod-ing. Indeed, the German economy relies much less on comparative advantages than it does on demand from within the Euro Area. Thus, if the Euro Area disintegrates, Ger-many’s trade surpluses will dwindle and it will lose out.
The Germans could actually benefit by following France’s example in sustaining produc-tivity growth, which Paris has done much better than Germany in the past. Indeed, Ger-many’s comparative advantage might erode as a result of the high influx of cheap euro-flight capital. This though might even aid the European recovery process as a whole
– and ultimately Germany, too. In the end, it is in Germany’s interest to do more to help the south overcome its present difficulties instead of burdening it with ever more debt.
France, on the other hand, has to take German competitiveness as a benchmark, but not the German model as such. It must accelerate growth because it must create more jobs, especially for young people. Yet at the same time it has to reduce its budget deficit. For that it has three options: A quick solution would grant generous tax deductions for investment in equipment and housing, somewhat similar to what Germany did imme-diately after unification to redress East Germany. The danger is that this may support demand for the non-tradable sector without improving competitiveness and end in an unsustainable asset bubble. The second option would, therefore, focus on the difficult task of restoring competitive levels of unit labour costs by fostering productivity com-bined with moderate wage restraint. A third option is a delicate balance of the two.
Stefan Collignon
Stefan Collignon is ordinary professor of political economy at Sant’Anna School of Advanced Studies, Pisa, since Oc-
tober 2007, and International Chief Economist of the Centro Europa Ricerche (CER), Roma, since July 2007. He is the
founder of Euro Asia Forum at Sant’Anna School of Advanced Studies. Stefan Collignon was born in 1951 and received
his Ph.D. and Habilitation from the Free University of Berlin. He also studied at the Institut d‘Etudes Politiques (Paris),
the University of Dar es Salaam, Queen Elizabeth House in Oxford and the London School of Economics.
Abstract
p. 4Index
Index
Abstract
Introduction
1. Economic growth and employment
1.1. Growth performances
1.2. Jobs
2. Competitiveness
2.1. Trade balances
2.2. Constant market share analysis
2.3. Unit labour costs
3. Public finances
4. Conclusion
Annex 1
References
3
5
6
6
8
10
10
11
15
18
20
22
22
Economic growth and competitiveness: a Franco-German tale
Stefan Collignon

p. 5Introduction
Introduction
Rarely have economic policy debates between France and Germany been more contro-versial and more political than during the recent elections in France. While Nicolas Sarkozy has painted Germany as a model, his challenger François Hollande promised an alternative to German austerity. Yet since his election, he has received more German en-trepreneurs in one month than his predecessor in a year. No doubt, Germany is Europe’s économie dominante and this fact shapes the ideological controversy between France and Germany: here the superior German Social Market Economy with its ordo-liberal principles, there either stifling dirigisme or a “laxiste” penchant toward (Anglo-Saxon?) Keynesianism. However, while the debate in earlier years used to be framed in purely national terms, it has taken a more political-ideological turn recently. Chancellor Merkel found it “natural” to support her conservative counterpart Nicolas Sarkozy because they “belonged to the same political family”. President Hollande has received the three lead-ers of the German Social Democratic Party at the Elysée Palace. This social-democratic “axis” seems to have forced Mrs Merkel, who needed parliamentary support at home, to accept a solution for Spanish banks during the recent European Council that she had previously resisted. It may turn out that ideological colourings will become “normal” politics in a future Europe. However, behind these apparently partisan political position-ing, fundamental factors are still important for long run policy orientations. This paper attempts to bring some clarifications on the fundamental interests and problems con-fronting the French and German sections of the Euro Area economy.

p. 6Economic growth and employment
Economic growth and employment
In the recent crisis, Germany has emerged as Europe’s dominant actor and was able to im-pose strict austerity policies, because it has pulled out of the crisis faster than most other Euro-member states. However, German economic strength is a rather recent phenomenon and one cannot exclude the possibility that it will remain only a temporary boom.
Growth performances
For most of the last 50 years, economic growth has been higher in France than in Germany. The only significant three exceptions were the boom 1987-91, which was am-plified by German unification and quickly extinguished by the Bundesbank; the short bubble boom before the Global Financial Crisis, from which Germany benefitted more than France; and the recent return to normal out-put levels, which is documented by Figures 1 and 2.
From 1994-2005, economic growth in France was near-ly a full percentage point higher than in Germany. This rapid expansion was stimulated by the reduction of in-terest rates in the run up to monetary union, but also by the competitive advantages accumulated by the social-ist governments’ policies of “competitive disinflation”. During this time, Germany was still suffering from the after-effects of re-unification and the structural adjust-ments it required. In fact, Germany’s stagnation in the late 1990s and early 2000s can be explained by the consequences of a burst property price bubble, simi-lar to what is presently happening in southern Europe. Buoyed by the generous tax breaks to stimulate the reconstruction of East Germany, Germany’s property market had boomed in the early 1990s and the price of buy-to-let properties rose by around 70 percent. The tax incentives expired after 1996 and a sobering of the market set in.1 Investors’ exuberance turned to gloom, which was only temporarily broken during the dot.com boom in 2000.
The German policy response was to seek compensation from the tradable sector (exports) for the problems in the non-tradable sector (construction). However, as we will see below, this strategy was actually less success-ful than commonly assumed. By contrast, in France the
1.
1. See Waffel, 2008 and the Fördergebietsgesetz on: http://www.gesetze-im-internet.de/bundesrecht/f_gbg/gesamt.pdf
480,000
440,000
400,000
360,000
Source: Eurostat
France Gemany
Figure 1: GDP for France and Germany
600,000
560,000
520,000
Lehm
an
Schröder Sarkozy
EURO
1994 1996 1998 2000 2002 2004 2006 2008 2010
Figure 2: Economic growthSource: AMECO
Lehm
an
Bret
ton
Woo
ds
.08
.06
.04
.02
.00
-.02
-.04
-.06
Lehm
an
Ger
man
U
nific
atio
n
Euro
pean
Mon
etar
y Sy
sem
Schröder Sarkozy
EURO
1965 1970 1975 1980 1985 1990 1995 2000 2005 2010
France growth rateGermany growth rate
France trend growthGermany trend growth

p. 7Economic growth and employment
fall in interest rates in the run-up to monetary union and its early phase stimulated the property market and contributed to an expansion of the construction sector. Here, demand in the non-tradable sector covered the deterioration in international competi-tiveness. This can be seen from Figure 3, which shows that the share of construction in total value added as a proxy for non-tradable goods. This share rose by approximately 3 percentage points in France from 17.5 to 20.7 percent, while it fell by 21 points (!) in Ger-many. In 1995, the share of construction was of equal size (37.5%) to manufacturing in the German economy. The importance of this shrinking is clear when one observes that in 1995 the German share was double of France, but without having risen substantially, the French share is now 20% higher than the German. This development went against the European trend, which saw a rise of the construction industry share, while France exceeded it by widening its share with the Euro Area economy from 10.2 to 13.9 percent. Since the Lehman crisis, Europe’s property boom has collapsed and this is a major fac-tor in the recent poor growth performance in France and southern Europe.
On the supply side, economic growth is a long run phenomenon. It can be decomposed into the contribution made by improved productivity and higher employment. With an-nual GDP per employee of €80500 against €65112 in 2012, France’s productivity is 23.6% higher than Germany’s. This is the consequence of a long-run trend. For 50 years, French productivity has grown by nearly half a percentage point faster than in Germany. Em-ployment has also performed better, but this factor was less significant for economic growth than productivity. Since the beginning of monetary union in 1999, however, la-bour productivity has fallen in both countries and the French advantage has melted away.
The volatility of productivity (measured by the standard deviation of its growth rate) has also fallen in France, while it has remained stable in Germany. In general, labour pro-ductivity is more volatile in Germany than in France, which could be interpreted as a sign of greater labour market flexibility in France.2 As a mirror image, employment has become more stable in Germany (the standard deviation for 1999-2012 is lower than for 1961-2012), but more uncertain in France (the standard deviation has increased). See Ta-
2. Productivity is more volatile when the labour force cannot be adjusted to changes in output.
Figure 3: Share of construction in total value added
.21
.20
.19
.18
.17Le
hman
EURO
1994 1998 2002 2006 2010
1994 1998 2002 2006 2010
.015
.014
.013
.012
.011
.010
French construction/France VA
French construction/EA12 VA
1994 1998 2002 2006 2010
1994 1998 2002 2006 2010
.40
.35
.30
.25
.20
.15
.028
.024
.020
.016
.012
.008
German construction/German VA
German construction/EA12 VA
.40
.35
.30
.25
.20
.15
.072
.068
.064
.060
.056
1994 1998 2002 2006 2010
1994 1998 2002 2006 2010
French construction/German construction
EA12 construction/EA12VA
Source: AMECO

p. 8Economic growth and employment
ble 1. It has been argued that Germany has undertaken structural reforms because it is anticipating unfavourable demographic trends. Yet, German labour market reforms have lowered productivity growth, and there is nothing that shields better against the burden of an aging population than greater productivity. The higher productivity may also justify to some degree, why France may be more generous about retirement age. Nevertheless, employment is the foundation of social and political stability and job creation must there-fore have priority.
Jobs
The advent of European monetary union was the largest job creation program in Eu-rope’s history and France has benefitted generously. By 2008, the Euro Area had cre-ated 17.463 million new jobs, of which 3.5 mn were lost again during the financial crisis (i.e. by 2012). As Figure 4 shows, with a net balance of 3.719 million newly created jobs over the period 1999-2012 France was the second largest job creator in the Euro Area,
Figure 4: New jobs created since 1999 in thousandsSource: AMECO
15,000
10,000
5,000
0
2000 2001 2002 2003 2004 2005 2006 2007 2008 2009 2010
Italy
France
Spain
Germany
Finland
Slovakia
Slovenia
Portugal
Austria
NetherlandsLuxembourg
Cyprus
Italy
France
Spain
Greece
Estonia
Germany
Belgium
Ireland
Table 1: Growth rates: Labour productivity and employment
1964–2012 1999–2012 1995–2004 2005–2008 2007–2012
Mean Std. Dev. Mean Std. Dev. Mean Std. Dev. Mean Std. Dev. Mean Std. Dev.
Productivitiy FR 2.45% 1.81% 0.77% 0.96% 1.25% 0.82% 0.67% 0.82% 0.46% 1.17%
Productivitiy DE 2.02% 1.83% 0.75% 1.84% 1.05% 0.45% 1.04% 1.27% 0.34% 2.79%
Difference FR-DE 0.44% -0.02% 0.02% -0.88% 0.20% 0.37% -0.36% -0.45% 0.12% -1.62%
Employement FR 0.57% 0.76% 0.77% 0.96% 1.10% 0.87% 0.92% 0.41% 0.31% 0.84%
Employement DE 0.47% 1.20% 0.56% 0.82% 0.36% 0.85% 0.83% 0.80% 0.85% 0.63%
Difference FR-DE 0.10% -0.44% 0.21% 0.14% 0.74% 0.02% 0.10% -0.39% -0.54% 0.21%
Growth FR 3.03% 2.57% 1.54% 1.92% 2.34% 1.70% 1.60% 1.23% 0.77% 2.01%
Growth DE 2.49% 3.03% 1.31% 2.66% 1.40% 1.30% 1.86% 2.07% 1.20% 3.42%
Difference FR-DE 0.54% -0.46% 0.23% -0.74% 0.94% 0.39% -0.26% -0.84% -0.42% -1.41%
p. 9Economic growth and employment
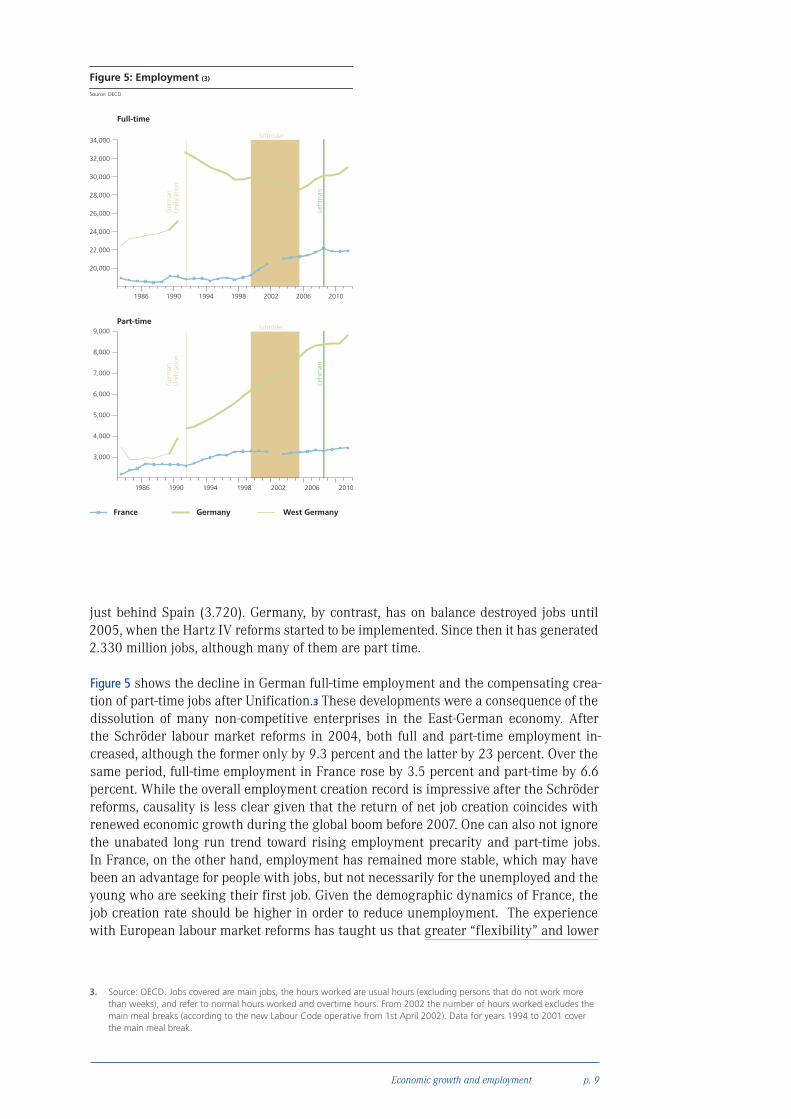
just behind Spain (3.720). Germany, by contrast, has on balance destroyed jobs until 2005, when the Hartz IV reforms started to be implemented. Since then it has generated 2.330 million jobs, although many of them are part time.
Figure 5 shows the decline in German full-time employment and the compensating crea-tion of part-time jobs after Unification.3 These developments were a consequence of the dissolution of many non-competitive enterprises in the East-German economy. After the Schröder labour market reforms in 2004, both full and part-time employment in-creased, although the former only by 9.3 percent and the latter by 23 percent. Over the same period, full-time employment in France rose by 3.5 percent and part-time by 6.6 percent. While the overall employment creation record is impressive after the Schröder reforms, causality is less clear given that the return of net job creation coincides with renewed economic growth during the global boom before 2007. One can also not ignore the unabated long run trend toward rising employment precarity and part-time jobs. In France, on the other hand, employment has remained more stable, which may have been an advantage for people with jobs, but not necessarily for the unemployed and the young who are seeking their first job. Given the demographic dynamics of France, the job creation rate should be higher in order to reduce unemployment. The experience with European labour market reforms has taught us that greater “flexibility” and lower
3. Source: OECD. Jobs covered are main jobs, the hours worked are usual hours (excluding persons that do not work more than weeks), and refer to normal hours worked and overtime hours. From 2002 the number of hours worked excludes the main meal breaks (according to the new Labour Code operative from 1st April 2002). Data for years 1994 to 2001 cover the main meal break.
Figure 5: Employment (3)
France Germany West Germany
Source: OECD
1986 1990 1994 1998 2002 2006 2010
Schröder
Lehm
an
Ger
man
U
nific
atio
n
34,000
32,000
30,000
28,000
26,000
24,000
22,000
20,000
Part-time
Full-time
Lehm
an
Ger
man
U
nific
atio
n
Schröder9,000
8,000
7,000
6,000
5,000
4,000
3,000
1986 1990 1994 1998 2002 2006 2010

p. 10
2.
Competitiveness
wage costs can increase the job creation dynamic, but usually at the cost of reduced pro-ductivity growth (European Commission, 2007). The reason why France has not been able to benefit more from the boom 2005-7 and returned to employment-driven growth after the Global Financial Crisis, as Germany did, is found in the deteriorating position of competitiveness.
CompetitivenessFrance has lost its traditional advantage over Germany in the mid-2000s. The reason is a dramatic loss of competitiveness in France and the restoration of cost advantages in Germany. There are a number of indicators for measuring competitiveness. We will here focus on trade balances, market shares and unit labour costs.
Trade balances
The trade balances for our two countries are shown in Figure 6. Overall, the French econo-my has seen their continuous deterioration for the last fifteen years, and especially since 2002. Its trade deficit is now close to -5% of GDP. Germany, on the other hand, has dramati-cally increased its net exports, which stood close to 8% of GDP before the Global Financial Crisis started; since then it has lost nearly half of its trade surplus again. Developments in French and German trade are mainly driven by intra-European trade. The external trade of France with the non-European countries has been close to balance or in sur-plus. The French deficit, as that of many other member states, is mirrored in German trade surpluses with the Euro Area. Thus, while it is true that Germany runs a trade surplus with the non-EU world, its main source of surpluses is intra-EU trade. Only in the last few years has demand from China and other emerging economies somewhat compensated from the loss of European demand.4 By contrast, intra-European trade has
4. Germany has gained and France has lost approximately 3 percentage points in China’s import market since 1999 (own calculations based on Chelem data base). However, nearly all of the French losses occurred in 2000, while the German progression was continuous.
Figure 6: Trade balances as percent of GDP
GermanyFrance
Total trade balance Trade balance with EU
Trade balance with opt-outsTrade balance with non-EU
Lehm
an
2
1
0
-1
-2
-3
-4
-5
-6
Sarkozy
EURO
1994 1998 2002 2006 2010
9
8
7
6
5
4
3
2
1
0
Lehm
an
Schröder
EURO
1994 1998 2002 2006 2010

p. 11Competitiveness
suffered from the global financial crisis and the ensuing Euro-crisis has caused a collapse of demand for German exports from Southern Europe that has helped to rebal-ance intra-EU trade. This indicates that German trade surpluses rely less on competitive advantages than on demand from within the Euro Area. Hence, German au-thorities should embrace French demands for stimulat-ing growth in Europe. Furthermore, our data prove how strongly the German economy depends on European in-tegration. If trade surpluses are a measure of economic success, Germany has a lot to lose from the disintegra-tion of the Euro Area.
It is sometimes claimed that Germany does not need the euro because it is a “big international player” who successfully trades with emerging economies. This is not true. Figure 7 shows that with the exception of equip-ment exports, Europe is the most important destination for German and French exports, although Germany is more important for France than France for Germany.
Constant market share analysis
How can the evolution of these trade balances be ex-plained? Constant market share analysis provides us with the tools for analysing broad demand factors and supply-side competitive advantages. A country can ben-efit from world demand either by specializing in prod-ucts for which there are significant increases in demand (the product effect), or by focusing on expanding mar-kets (market effect). The net residual between these two demand effects and the overall change in market shares is a measure of the competitiveness due to supply-side factors.5 Figure 8 shows an index of the change in market shares according to these three effects.
5. There is also a “mixed effect”, which is however only relevant in very rapidly expanding situations.
Figure 7: Export OrientationSource: Chelem
RoW
BRA
IND
CHN
DASIA
JPN
USA
NMS
other EU
SPA
ITA
GER
France
Consumption
20.58
0.590.291.695.52.65
7.33
4.55
30.98
6.83
8.11
10.94
Intermediary
17.91
1.420.742.778.221.484.31
7.9
22
10.04
7.21
16
Other
17.6 0.630.51.735.141.854.293.62
30.54
7.83
11.48
14.79
Equipment
21.87
1.231.575.41
12.37
0.86
9.13
3.62
14.83
4.154.39
20.57
Germany
Consumption
15.25
0.660.294.757.742.62
8.78
7.06
34.19
3.68
6.87
8.15
Intermediary
12.181.371.216.41
12.75
1.086.14
14.14
26.42
4.15
6.01
8.14
Other
14.310.810.922.796.320.923.75
12.91
37.58
3.02
7.18
9.49
Equipment
14.471.56
1.5
8.84
15.16
1.34
7.58
9.93
21.46
2.634.63
10.9
.1
.0
-.1
-.2
-.3
-.4
-.5
France
Lehm
an
EURO
Figure 8: Cumulative market share indices: total world trade
TOTAL PROD
MARKETCOMP
MIX
1996 2000 2004 2008
.08
.04
.00
-.04
-.08
-.12
-.16
Lehm
an
EURO
Germany
1996 2000 2004 2008
Source: CHELEM and own calculations

p. 12Competitiveness
France has lost market shares continuously and world-wide primarily due to deteriorating supply-side com-petitiveness; in addition, the orientation of the French product portfolio and market orientation has also led to some losses. Thus, supply-side conditions are the Achil-les heel of the French economy. Germany, on the other hand, has experienced a more volatile performance in world markets. It has lost competitiveness in the second half of the 1990s, improved it again with the Schröder labour market reforms, and has experienced renewed losses under Merkel. In this respect, the German expe-rience resembles the French, where Socialists restored competitiveness under Mitterrand and Jospin, while conservative governments wasted the accumulated capital. On the demand side, Germany has experienced a gradual deterioration in its product portfolio, but ex-ports benefit from expanding markets. Yet, while it is true that Germany has successfully penetrated emerg-ing markets, this is only part of the story because the German product portfolio is becoming outdated and the supply-side advantages are gradually eroding again.
As discussed above, trade balances depend largely on the evolution of intra-European trade. Table 2 shows the gains and losses of market shares in trade within the Eu-ropean Union. Not surprisingly, the new member states are the biggest winners. Yet, remarkably, the Euro Area as a whole has experienced only minor losses, while the opt-out states in Scandinavia and the UK have taken the brunt. Thus, being outside the euro and being able to use the exchange rate for competitive advantages does not translate in larger market shares but actually dam-ages the economy.
Within the Euro Area, the Netherlands and Slovakia have been the largest winners of trade shares worth 54.4 billion of euros, followed by Germany with 24 billion. The Dutch economy gained in supply-side effi-ciency, but lost in its market orientation. Germany lost market share due to its product portfolio, but gained by being close to the dynamic markets in central and East-ern Europe and by improving its cost competitiveness. These data suggest that outsourcing to Eastern Europe is one of the explanations for German success.
Table 2: Market share gains and losses in bn €
Total Product Market Competition
Austria 3.5 -1.9 10.1 -4.7
Belgium 7.6 11.3 3.4 -7.1
Cyprus 0.3 0.0 0.1 0.2
Germany 24.0 -35.3 26.8 32.5
Spain 5.8 -3.8 -11.2 20.8
Finland -14.0 -0.9 -1.8 -11.3
France -92.5 2.6 -24.0 -71.1
Greece -1.4 0.6 -2.6 0.8
Ireland -23.5 0.0 -20.0 -3.4
Italy -41.5 -13.9 -6.7 -20.9
Malta -0.7 0.0 -0.1 -0.6
Netherlands 54.4 25.4 -35.4 64.5
Portugal -4.7 -2.6 -3.2 1.2
Slovenia 6.0 -0.4 2.2 4.2
Slovakia 27.4 0.5 23.8 3.1
EURO -49.2 -18.4 -38.8 8.1
Denmark -6.6 3.4 -8.5 -1.6
UK -92.9 13.7 -69.8 -36.8
Sweden -14.4 2.5 -2.9 -14.0
Opt-outs -113.9 19.7 -81.3 -52.4
Bulgaria 5.9 0.3 3.8 1.8
Czech Republic 47.9 -0.6 36.9 11.7
Estonia 2.8 -0.2 2.2 0.8
Hungary 22.5 -2.3 12.8 12.1
Lithuania 6.5 0.4 2.6 3.5
Latvia 2.7 -0.1 1.4 1.4
Poland 57.5 1.5 30.0 26.0
Romania 17.2 -0.4 17.0 0.6
NMS 163.1 -1.3 106.5 57.9

p. 13Competitiveness
France, on the other hand, is the biggest loser of European trade shares, because of the negative supply side evolution and because of the insufficient orientation of trade towards the expanding markets in the new member states. Political chauvinism and economic illiteracy are also a handicap, which President Sarkozy exemplified, when he said: “It is justifiable if a Renault factory is built in India so that Renault cars may be sold to the Indians, but it is not justifiable if a factory of a certain producer is built in the Czech Republic and its cars are sold in France”.6 With this attitude France’s economic power disappears.
Because they are “big” countries, the gains and losses for Germany and France are rela-tively small when measured in relation to GDP, but often big for small member states. With -6.8 percentage points of GDP, France is in the 4th position as a loser; Germany is close to the median with +1.2% gain. See Figure 9. By contrast, Ireland and Malta have lost close to 20% of GDP and Central and Eastern Europe have gained in excess of 20 percentage points.
Nevertheless, in bilateral comparison, France is nearly always losing out against Germany. Figure 10 presents the overall gains and losses in trade shares (last column) for specific products and reveals the relative impact of supply-side competitiveness (first column) and market demand (second column). With the exception of aeronautics, where Franco-German cooperation is strong, France is losing market shares in all major industrialised product categories. Positive demand developments in French markets are nearly always annihilated by supply-side handicaps. This negative picture even extends to classical French trademarks, such as beverages, food and cereals.7
6. See : http://www.spiegel.de/international/europe/concern-about-national-economic-bailouts-europeans-fear-wave-of-protectionism-a-606917.html
7. For reasons of space, these products are not shown here.
Figure 9: Gain/Loss of Market Share in % of MS GDP of 1999
0-40 20 40 60 80 100 120 140 150
Ireland
Malta
Finland
France
UK
Sweden
Denmark
Portugal
Italy
Greece
Spain
Germany
Austria
Belgium
Cyprus
Netherlands
Slovakia
Poland
Latvia
Bulgaria
Hungary
Romania
Estonia
Lithunania
Czech Republic
Slovakia
product market competitive effect

p. 14Competitiveness
Figure 10: Competitiveness by products
Competitiveness effect Market effect Total change in product market share
Source: own calculations; data from Chelem
Aeronautics France Aeronautics Germany
.4
.2
.0
-.2
-.41994 1998 2002 2006 2010
1.6
1.2
0.8
0.4
0.0
-0.41994 1998 2002 2006 2010
2.0
1.5
1.0
0.5
0.0
-0.51994 1998 2002 2006 2010
2.0
1.5
1.0
0.5
0.0
-1.0
-0.5
1994 1998 2002 2006 2010
2
1
0
-1
-2
1994 1998 2002 2006 2010
2
1
0
-1
-2
1994 1998 2002 2006 2010
Ships France Ships Germany
Cars & cycles France
.4
.2
.0
-.2
-.4
-.6
1994 1998 2002 2006 2010
.20
.15
.10
.05
.00
-.05
1994 1998 2002 2006 2010
.4
.2
.0
-.2
-.4
-.6
1994 1998 2002 2006 2010
Cars & cycles Germany
Telecom equip. France Telecom equip. Germany
.8
.4
.0
-.4
-.8
1994 1998 2002 2006 2010
.30
.25
.20
.15
.10
.05
.00
-.05
1994 1998 2002 2006 2010
.4
.2
.0
-.2
-.4
-.6
1994 1998 2002 2006 2010
Electricity France Electricity Germany
3
2
1
0
-1
-2
1994 1998 2002 2006 2010
1.2
0.8
0.4
-0.0
-0.4
-0.8
1994 1998 2002 2006 2010
1.0
1.0
0.5
0.0
-0.5
-1.5
-1.0
1994 1998 2002 2006 2010

p. 15Competitiveness
Although these losses seem important, they must be seen in the context of the important restructuring that is going on simultaneously in the global and the European econo-my: transition economies in Asia and Eastern Europe are becoming competitive and are rebuilding their industrial base. This takes away market shares from old established suppliers and the share of European manufacturing is shrinking. While it is true that the manufacturing sector in France has fallen since 1999 by 2 percentage points to 15% and the German share has remained roughly sta-ble with variations around 36%, this must be seen in a broader context. First of all, in a single European mar-ket there is nothing wrong in having a strong industrial hub, which supplies products to the global economy and earns foreign currency for the Euro Area, as long as oth-er Euro member states are efficiently integrated into the supply chain. For example, each car sold abroad could automatically sell four tires from France. This is common knowledge, since David Ricardo explained the principle of comparative advantage.8 Second, France is doing bet-ter than some other European partners, for the share of manufacturing in Euro Area value added has fallen by 4.9 percentage points, but in France only by 1.1 points. See Figure 11. We must now explain the causes for these competitive divergences between France and Germany.
Unit labour costs
Explaining competitiveness is a complex endeavour. One of the main indicators, frequently used by the Eu-
8. For an explanation for how such a system is financially viable, see Collignon, 2012.
Figure 11: Share of manufacturing in total value addedSource: AMECO
.50
.48
.46
.44
.42
.40
.38
.36
.22
.20
.18
.16
.14
French manufacturing/German manufacturing
EA12 manufacturing/EA12VA
1994 1998 2002 2006 2010
1994 1998 2002 2006 2010
.40
.39
.38
.37
.36
.35
.34
.09
.08
.07
.06
.05
German manufacturing/German VA
German manufacturing/EA12 VA
1994 1998 2002 2006 2010
1994 1998 2002 2006 2010
Lehm
an
EURO
.040
.036
.032
.028
.024
.020
.19
.18
.17
.16
.15
.14
French manufacturing/France VA
French manufacturing/EA12 VA
1994 1998 2002 2006 2010
1994 1998 2002 2006 2010
Figure 12: Nominal unit labour cost indices and inflation targetSource: AMECO
Euro area (12 countries)AustriaFinlandGermanyIrelandNetherlandsSpain
Inflation TargetBelgiumFranceGreeceItalyPortugal
2001 2003 2005 2007 2009 2011
1.4
1.3
1.2
1.1
1.0
0.9

p. 16Competitiveness
ropean authorities, is relative prices and relative unit labour costs, i.e. the real exchange rate. As long as coun-tries have different currencies, the real exchange rate is strongly affected by nominal exchange rate variations; in monetary union, however, it depends only on rela-tive inflation and unit labour costs. We will first look at intra-Euro Area relations.
Traditionally, unit labour costs are measured by an in-dex based on an arbitrary base year. Its evolution then shows how cumulative changes are changing competi-tiveness advantage. Figure 12, for example, reveals that unit labour costs in France have been growing faster than in Germany although they have been very close to the inflation target of the ECB of 2% and well below those of troubled southern member states. Germany is the main outlier in the Euro Area with either stagnant, or even falling, unit labour costs in the recent years.
The use of unit labour cost indices like in Figure 12 is, however, seriously handicapped by the fact that it does not indicate the absolute levels in costs’ comparative-ness. In principle, it would be acceptable to have larg-er increases in labour costs if a particular economy is starting at a lower level than its competitors. For this reason it is necessary to find a bench mark, against which one can measure the over- or undervaluation of unit labour costs. Within the Euro Area, where the ECB is committed to maintaining price stability, the standard of measurement must be the average of the monetary union and the proper indicator is the return on capital.
In Figure 13 we see the so calculated evolution of unit labour costs in Germany and France. The three vertical shades reflect the three crises: ERM in 1992-3; crash of dot.com boom in 2000; and global financial crisis 2007-9. In Germany, real unit labour costs have been above equilibrium level until the labour market reforms in 2004 started to transform the situation. France shows the opposite picture with equilibrium unit labour costs being persistently above the actual level until 2006, af-ter which the equilibrium level fell significantly below the actual level.
We can compress our measure of comparative advan-tages of unit labour costs into the difference between
Source: own calculations based on Chelem
Figure 13: Actual equilibrium unit labour cost levels relative to Euro Area
1.06
1.04
1.02
1.00
0.98
0.96
0.94
Actual ULC relative to EA
Equilibrium ULC
1.20
1.15
1.10
1.05
1.00
0.95
France
Germany
20082004200019961992
20082004200019961992
p. 17
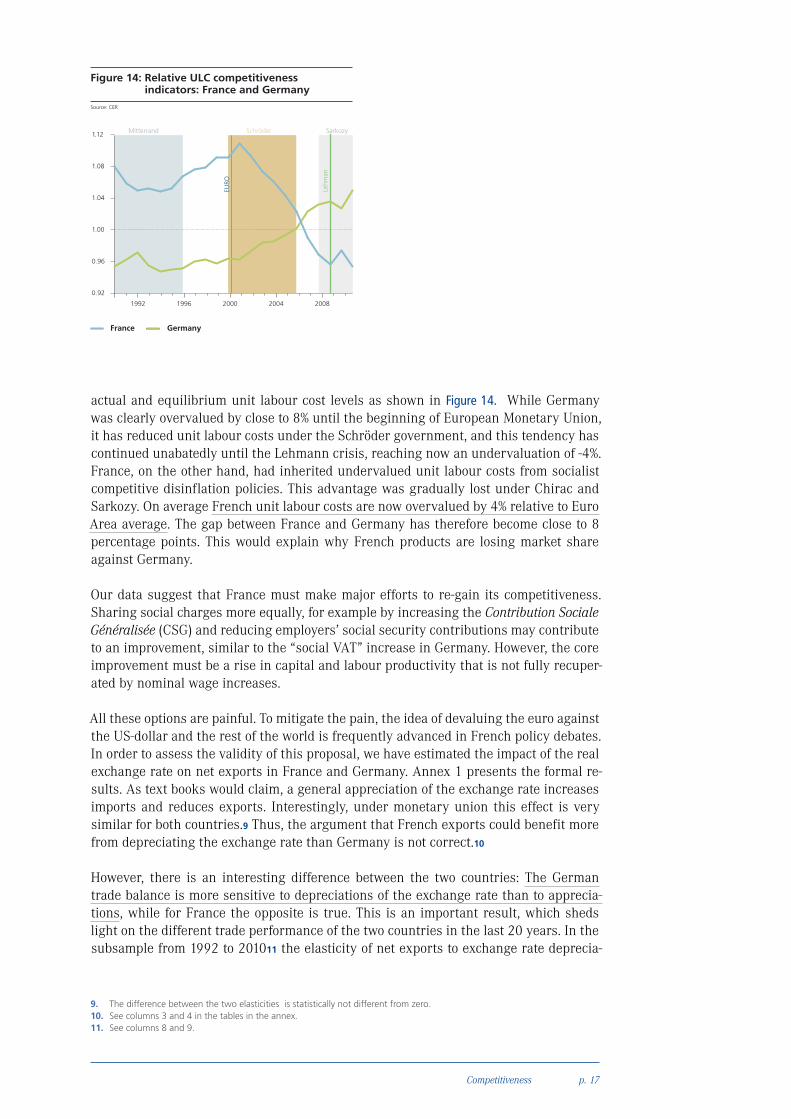
actual and equilibrium unit labour cost levels as shown in Figure 14. While Germany was clearly overvalued by close to 8% until the beginning of European Monetary Union, it has reduced unit labour costs under the Schröder government, and this tendency has continued unabatedly until the Lehmann crisis, reaching now an undervaluation of -4%. France, on the other hand, had inherited undervalued unit labour costs from socialist competitive disinflation policies. This advantage was gradually lost under Chirac and Sarkozy. On average French unit labour costs are now overvalued by 4% relative to Euro Area average. The gap between France and Germany has therefore become close to 8 percentage points. This would explain why French products are losing market share against Germany.
Our data suggest that France must make major efforts to re-gain its competitiveness. Sharing social charges more equally, for example by increasing the Contribution Sociale Généralisée (CSG) and reducing employers’ social security contributions may contribute to an improvement, similar to the “social VAT” increase in Germany. However, the core improvement must be a rise in capital and labour productivity that is not fully recuper-ated by nominal wage increases.
All these options are painful. To mitigate the pain, the idea of devaluing the euro against the US-dollar and the rest of the world is frequently advanced in French policy debates. In order to assess the validity of this proposal, we have estimated the impact of the real exchange rate on net exports in France and Germany. Annex 1 presents the formal re-sults. As text books would claim, a general appreciation of the exchange rate increases imports and reduces exports. Interestingly, under monetary union this effect is very similar for both countries.9 Thus, the argument that French exports could benefit more from depreciating the exchange rate than Germany is not correct.10
However, there is an interesting difference between the two countries: The German trade balance is more sensitive to depreciations of the exchange rate than to apprecia-tions, while for France the opposite is true. This is an important result, which sheds light on the different trade performance of the two countries in the last 20 years. In the subsample from 1992 to 201011 the elasticity of net exports to exchange rate deprecia-
9. The difference between the two elasticities is statistically not different from zero.10. See columns 3 and 4 in the tables in the annex.11. See columns 8 and 9.
Source: CER
Figure 14: Relative ULC competitiveness indicators: France and Germany
SchröderMitterrand Sarkozy
Lehm
an
EURO
1.12
1.08
1.04
1.00
0.96
0.92
France Germany
20082004200019961992
Competitiveness

p. 18Public finances
tions increases substantially for Germany, from roughly -0.6 to -0.83 and to -0.91 when the Euro Area is excluded. The positive effect of exchange rate depreciations is reduced when we exclude the crisis years from the sample, but the difference between the two impacts is still statistically significant.12 French net exports by contrast, while not re-acting significantly before monetary union,13 suffer significantly from exchange rate appreciations, with elasticity around -0.4 while there is no significant benefit for them from depreciation (the coefficient is insignificant). Thus, Germany would benefit most from depreciation but does not care about appreciations, while France suffers most from an appreciation of the euro but does not really benefit from depreciation.
There can be several explanations for this result: first, higher quality of German exports may cause demand to be relatively insensitive to price increases while a price reduction increases their demand; second and connected to the first point, the restructuring of the production chain, with a strong increase in outsourcing activities, especially with eastern Europe, has increased German competitiveness not only within the Euro Area but with the rest of the world and simultaneously made the German economy depend-ent on European supply networks and therefore less price elastic; thirdly, the sectoral specialization of German exports, which are relatively more concentrated in equipment goods and are an essential part of the production processes in many emerging econo-mies, especially in Asia, may render the demand less sensitive to price increases than to price reductions. The change in the structural composition of exports may be an ex-planation for the asymmetric reaction to exchange rate movements, as France has kept a comparative advantage only in high technology products, while it has lost competitive-ness in medium and low technology products, especially against emerging economies (DG Trésor, 2012). In this context a depreciation of the euro against the dollar may not have the desired effect.
Public finances Contrary to most other Euro Area member states, espe-cially in the South, public debt levels have risen contin-uously in Germany and France since the start of Euro-pean monetary union in 1999. Their evolution has been closely matched, first with Germany in the lead, then France. Thus, when growth slowed down in Germany, debt increases accelerated. This is what we also observe today in France and other southern member states. Yet, the most dramatic debt increases in France and Germa-ny from 65% to above 80% occurred as a consequence of the financial crisis. See Figure 15. We must now explain the causes for this development.
12. See columns 10 and 11.13. See column 7.
3. Source: CER
Figure 15: Dept-GDP Ratios France-Germany
Schröder Sarkozy
Lehm
an
EURO
85
80
75
70
65
60
55
France Germany
20102006 2008200420021996 1998 2000

p. 19Public finances
France and Germany have followed similar budget poli-cies in the early phase of monetary union. They both violated the Stability and Growth Pact rule of not ex-ceeding deficits of more than 3% in the first half of the 2000s. Because Germany benefitted more of the 2006-7 boom than France, it was able to cut back the deficit in those years, but the global financial crisis with the severe recession was the main reason for high deficits since 2008, although with nearly 8% French deficits were nearly the double of the German level.
Weak growth in France has slowed down the consoli-dation of public finances, because the fall in GDP has caused a loss of revenue, as Figure 16 shows. In Ger-many, by contrast, revenue was quickly restored after GDP returned to its previous levels. Interestingly, dur-ing the recession in 2009, public spending in Germany increased much more than in France. Thus, Germany is hardly the champion of public “saving” it pretends to be. In fact the fiscal stimulus was stronger in Germany than in France and this may explain the more rapid exit from the global financial crisis in Germany. Thus, al-though German authorities preach against Keynesian-ism, when they actually put it into practice, it works.
Yet, even without extra spending the loss of revenue has led to high deficits in France. The size of French public borrowing is mind-boggling when one considers the ab-solute amounts. In 2009, France has borrowed as much as Italy and Germany together (see Figure 17) and that has not changed substantially in the following years. France
Figure 17: GDP, Revenue, Expenditure in bn €
France
Sarkozy
Lehm
an
EURO
GDP
REV
EXP
1996 1998 2000 2002 2004 2006 2008 2010
2,600
2,400
2,200
2,000
1,800
1,600
1,400
1,200
1,000
800
400
600
Schröder
Germany
1996 1998 2000 2002 2004 2006 2008 2010
2,600
2,400
2,200
2,000
1,800
1,600
1,400
1,200
1,000
800
400
600
Lehm
an
EURO
Source: AMECO
Figure 16: Deficit-GDP Ratios: France-Germany
Schröder Sarkozy2
0
-2
-4
-6
-8
-10
Lehm
an
EURO
2008 2012200419961992 2000
France Germany

p. 20Conclusion
and Spain absorbed nearly half of the total Euro Area borrowing. These amounts exceed by far the relative weights of the respective economies.
Nevertheless, the data in Figures 15-17 clearly indicate that fiscal policy in France has closely matched with German behaviour before the financial crisis. But due to its dete-riorated competitiveness, France has not been able to grow as quickly out of the crisis as Germany and that is the main reason for sustained high deficits. In this context, adopting tough austerity programmes, which kill growth, as witnessed for example in Italy, would be counterproductive. The real issue for French public finances is how to accelerate growth.
ConclusionThis study has two messages: over the long run, France has been doing better than Germany, but over the most recent period it was, the opposite. This may explain why President Sarkozy has failed to convince his voter that they needed to adopt the Ger-man model. One does not easily change engrained habits and structures. Yet, in the short run, France must take German competitiveness as a bench mark. Nevertheless, by taking a longer view, German authorities could actually learn something from France about sustaining productivity growth. Friendship is a two-way street.
Germany has always had a tendency to suffer from structural stagnation, although this is presently masked by the high influx of euro-flight capital into Germany that has pushed bond yields close to zero. With high likelihood, this will ignite a property mar-ket bubble, as previously experienced in Europe’s south, and might gradually erode Germany’s competitive advantage. This is, however, a normal and maybe ultimately even desirable adjustment process in monetary union. It is in the joint interest of all in the Euro Area that Germany makes a stronger contribution to the development of aggregate demand in the Euro Area; this would increase welfare in Germany and help the south to overcome its present difficulties more rapidly, instead of burdening the south by debt and fuelling resentment among German taxpayers.
France needs to accelerate growth because it must create more jobs, especially for the young, and because it must reduce its budget deficit. For that it has three options: A quick solution would grant generous tax deductions for investment in equipment and housing, somewhat similar to what Germany did immediately after unification to re-dress East Germany. The danger is that this may support demand for the non-tradable sector without improving competitiveness and end in an unsustainable asset bubble. The second option would, therefore, focus on the difficult task of restoring competitive levels of unit labour costs by fostering productivity combined with moderate wage re-straint. A third option is a delicate balance between the two. No doubt, it will take time and political courage to implement the necessary reforms, but ultimately, they can only be achieved by distributing the burden for all citizens more equally. As Prime Minister Ayrault said in his inaugural speech to Parliament: “Social justice is a factor for growth and progress”. This is true in France, in Germany and anywhere in Europe.
4.

p. 21Annex 1
Estimates Germany
Estimates France
1992-2010 1999-2010 1992-2010 1992-1998 1999-2010 1999-2007 all no Euro area all no Euro Area all no Euro Area all all no Euro Area all no Euro Area
∆relgdpk 0.560* 0.613* 1.022** 1.342*** 0.868** 0.984** 0.614 1.188** 1.583*** 1.418** 1.505** [0.314] [0.368] [0.317] [0.318] [0.355] [0.419] [0.529] [0.369] [0.355] [0.490] [0.541]∆Inrerbil -0.360*** -0.359*** -0.421*** [0.096] [0.099] [0.089] [0.090] Indist -0.004 -0.006 0 -0.002 -0.006 -0.008 -0.007 -0.004 -0.007 -0.012 -0.015* [0.006] [0.007] [0.005] [0.006] [0.006] [0.006] [0.012] [0.005] [0.006] [0.007] [0.008]∆Inrerbil_pl -0.161* -0.151 -0.075 -0.432** -0.404** -0.400** -0.371** [0.093] [0.093] [0.098] [0.173] [0.176] [0.174] [0.176]∆Inrerbil_mn -0.593*** -0.595*** -0.584*** -0.835*** -0.906*** -0.705** -0.824** [0.025] [0.027] [0.013] [0.228]² [0.270] [0.259] [0.297]Const. 0.099 0.119* 0.066 0.086 0.146** 0.161** 0 0.125** 0.146** 0.071 0.023 [0.064] [0.070] [0.056] [0.066] [0.061] [0.067] [.] [0.057] [0.069] [0.068] [0.029]N 1450 1325 972 547 1450 1325 478 972 847 729 638R²w 0.171 0.177 0.155 0.165 0.161 0.169 0.282 0.133 0.145 0.131 0.140t
Standard errors in brackets; *significant at 10% level, ** significant at 5% level; *** significiant at 1% level.
∆relgdpk = log difference of the partners and reporter‘s GDPs; ∆Inrerbil = log of the bilateral exchange rate (partner‘s currency on domestic currency);∆Inrerbil_pl = log of bilateral exchange rate with positive changes (appreciation);∆Inrerbil_mn = log of bilateral exchange rate with negative changes (depreciation); Indist = log of the distance between capital cities. Estimation method: panel random effects.
1992-2010 1999-2010 1992-2010 1992-1998 1999-2010 1999-2007 all no Euro area all no Euro Area all no Euro Area all all no Euro Area all no Euro Area
∆relgdpk 1.210** 1.233** 1.135** 1.172** 1.340*** 1.371*** 1.429*** 1.336** 1.384** 1.629** 1.729** [0.393] [0.405] [0.480] [0.527] [0.352] [0.362] [0.417] [0.490] [0.529] [0.621] [0.690] ∆Inrerbil -0.212** -0.207** -0.370*** -0.365*** [0.079] [0.079] [0.087] [0.090]Indist 0.001 0 0.006 0.005 -0.001 -0.002 -0.007 0.004 0.002 -0.005 -0.006 [0.006] [0.007] [0.006] [0.007] [0.006] [0.007] [0.014] [0.007] [0.007] [0.008] [0.009]∆Inrerbil_pl -0.156* -0.150* -0.058 -0.444** -0.442** -0.380** -0.366** [0.090] [0.090] [0.085] [0.145] [0.151] [0.139] [0.141]∆Inrerbil_mn -0.487 -0.476 -0.348 -0.416 -0.371 -0.537 -0.515 [0.325] [0.337] [0.593] [0.407] [0.435] [0.432] [0.462]Const. -0.034 -0.022 -0.1 -0.091 -0.020 -0.01 0.212 -0.06 -0.042 0.000 0.000 [0.066] [0.075] [0.071] [0.084] [0.066] [0.075] [0.138] [0.074] [0.086] [0.000] [0.000]N 1449 1325 971 847 1449 1325 478 971 847 729 638 R²w 0.075 0.077 0.083 0.086 0.067 0.070 0.075 0.075 0.078 0.080 0.086

p. 22Annex 1
Annex 1. Methodology and results.14
We estimate the impact of the exchange rate of bilateral trade balances for Germany and France against 85 partner countries over the period 1992-2010. The main purpose of the analysis is to test for the presence of asymmetries in the response of sectoral trade balances to exchange rate movements. To this aim we dichotomise the exchange rate by creating two variables representing respectively the effect of appreciations (erbil_pl) and depreciations (erbil_mn). The estimated equation is basically given by the difference between the export and import demand functions (see Guerrieri and Esposito 2012a), hence together with the exchange rate, a regressor accounting for the relative demand is introduced. This is given by the log difference between the partner’s and reporter’s GDP. All data are from the CEPII-Chelem database. The estimation technique is a panel random effect estimator (RE) in log differences, which partly accounts for the endogeneity of the relative demand variable and return consistent and more efficient estimates compared to the fixed effects estimator (FE). The preference of the RE against the FE is confirmed by the Hausman test (available upon request).
14. I thank Piero Esposito for doing the econometrics.
References
Collignon, S. 2012. Macroeconomic imbalances and comparative advantages in the Euro Area; ETUI and Bertels-mann Foundation, Brussels
DG Trésor, (2012) “Export specialization of France and four other leading countries of the European Union between 1990 and 2009” Trésor Economics, n.98, February. Ministère de l’Économie, des Finances et de l’Industrie.
European Commission, 2007. Quarterly Report on the Euro Area. Vol. 6.4, DG ECFIN, Brussels.
Guerrieri, P., and Esposito P. (2012a) “Is Germany a model to copy for Italy? A comparison between two export led growth models” Economia e Politica Industrial/Journal of Industrial and Business Economics, vol. 39 n.2
Guerrieri, P., and Esposito, P. (2012a) “Italy and the European and global competition” Economia Italiana/Review of Economic Conditions in Italy, forthcoming
Waffel, M. 2008. Why the Global Housing Market Boom Bypassed Germany; http://www.spiegel.de/international/business/real-estate-doldrums-why-the-global-housing-market-boom-bypassed-germany-a-552901-druck.html
