economic growth of fiji
TRANSCRIPT


FIJIthe diamond that has yet to shine
Team Gold Diggers:
1. Jacob Sreekumaran
2. Anand S Ravisankar
3. Kritika Rajeev
4. Ma Moru
5. Ni Chao
6. Zhu Ye
7. Natasha Singhal

Indians
46%Indige
nous
Fijians
50%
Others
4%
Ethnic Groups in Fiji
Location Oceania, Melanesia
Capital City Suva (+12 GMT)
Chief of State
President Epeli Nailatikau
Head of Govt.
Prime Minister Frank Bainimarama
Currency Fijian dollar (FJD)
Major Languages
English (official), Fijian (official), Hindi
Source: globalEDGE.msu.edu and EXPORT.GOV
Source: fijiguide.com

12.712.22
-5.98-6.62
8.8
2.74
-10
-5
0
5
10
15
197
0
197
1
197
2
197
3
197
4
197
5
197
6
197
7
197
8
197
9
198
0
198
1
198
2
198
3
198
4
198
5
198
6
198
7
198
8
198
9
199
0
199
1
199
2
199
3
199
4
199
5
199
6
199
7
199
8
199
9
200
0
200
1
200
2
200
3
200
4
200
5
200
6
200
7
200
8
200
9
201
0
201
1
201
2
201
3
GDP Growth Rate
Source: The World Bank

Key Economic Facts
Income Level (by per capita GNI): Upper Middle Income
GDP, PPP (current international $): $7.00 billion (2013)
GDP growth (annual %): 2.74% (2013)
GDP per capita, PPP (current international $): $7,948.26 (2013)
External debt stocks, total (DOD, current US$): $731,688,000.00 (2012)
Manufacturing, value added (% of GDP): 13.57% (2012)
Current account balance (BoP, current US$): -$0.06 billion (2012)
Inflation, consumer prices (annual %): 2.91% (2013)
Labor force, total: 342,174 (2012)
Unemployment, total (% of total labor force) (modeledILO estimate): 8.40% (2012)
Imports of goods and services (current US$): $2.54 billion (2012)
Exports of goods and services (current US$): $2.43 billion (2012)
Source: globalEDGE.msu.edu and EXPORT.GOV

Resources
Ideas
Implementation
The three pillars of the conceptual
political-economy framework

Re
sou
rce
s • Sugar & Confectionery
• Fisheries
• TourismId
ea
s • Gains Independence in 1970
• Unstable leadership and economic growth
• New constitution created
Po
licy Im
ple
me
nta
tio
n • Balanced growth approach
• Involvement of mainly the government in the spending –leading to deficit
Phase I: 1970-1987

Phase I: 1970-1987
IDEAS
Political Highlights
Became Independent in 1970 and a new constitution was
created.
In 1987, the Fiji Labor Party formed a Coalition to contest
election after the coup.

Phase I: 1970-1987
IDEAS
Economic Highlights
Economic growth: slow
and unstable.
Partially attributed
towards the unstable
leadership prevalent.
Inflation has been on an
unstable trend during
this period owing to
economic growth being
hampered

Conclusion – Ideas
Ethnic Clashes around land issues.
Increased factors of production leading to growth
General desire among public was - sustainable economic
growth.
Military coups hampered the growth
High levels of dissatisfaction of people and expectations
from leaders.
Phase I: 1970-1987

Phase I: 1970-1987
RESOURCES
During the initial years of Fiji’s new-found freedom, the sugar industry was known as an important contributor to the economy’s growth.
Although tourism has seen a steady growth, this growth was periodically disrupted by military coups.
Growth in tourism has been mainly due to Fiji’s four rounds of national tourism development since 1973 which targeted different aspects.

Phase I: 1970-1987POLICIES
1970 - Balanced growth approach to development
Agriculture development
Urban industrial sector through protection of domestic industries through import substitution measures.
Overall objective of all development plans was to achieve high growth levels & equitable distribution of income
Creating employment opportunities
Diversification of economic base
Regional and rural development
Development plan Six (DP6) [1970-1975] & Development Plan Seven (DP7) [1976-1980] – focused on agricultural sector and public infrastructure
Development plan Eight (DP8) [1981-1985] – focused more on diversification with continued emphasis on agricultural & industrial development

Phase I: 1970-1987
Development plan Nine (DP9) [1986-1990] articulated goals for the
economy which were vague at best and lacked focus.
- Achieve economic growth, including growth in real per-capita
incomes
- Generate job opportunities for Fiji’s growing labor force
- Promote a more equitable distribution of the benefits of development
and improve social conditions, especially in the rural areas
- Maintain greater financial stability
- Foster a greater sense of national unity and national identity.
Overly ambitious targets for structural changes seem to lack a
sense focus

Phase I: 1970-1987
While plans & policies were formulated, the lack of an
agency/ministry to ensure implementation and overall co-
ordination greatly reduced the effectiveness of these policies.
Most of the policies that the government formulated to spur
economic growth involved government spending, this eventually
led to fiscal constraints vis-à-vis a deficit situation.

Phase II: 1987-1999R
eso
urc
es • Land
• Sugar & Confectionery
• Serenity that drives tourism
Ide
as • Minimal to Zero
technological growth & advancement.
• New constitution created with changes to ethnic representation
Po
licy Im
ple
me
nta
tio
n • World Bank & IMF encouraged SAPs
• Deregulation
• Vague policy formulation

Phase II: 1987-1999
IDEAS
This phase in the history of Fiji saw minimal technological
advancement.
The philosophy of the Fiji Constitution of 1990 was to give
protection to the interests of indigenous Fijians, thus ethnic
groups received representation in parliament.

The figure besides displays
the percentage of land
that is used for pasture &
crops.
While Fiji saw a steady rise in this variable in the run up to
1990, it plateaued after a
specific level.
This can be seen to have
had a direct impact on output.
Phase II: 1987-1999

Value of sugar cane production: While there is some sort of an
upward trend prior to 1990, the period after 1990 sees nothing but a
downward trend.
A lack of technological growth to augment the already increased
factors of production can be a cause for this.
Phase II: 1987-1999
Phase II: 1987-1999RESOURCES
LAND:
Leases under the Agricultural Landlords and Tenant Act began
expiring in 1997.
Between 1997 and 2002, while some leases were renewed, the
majority of them reverted back to Native Lands Trust Board (NLTB).
The role of the NLTB has been controversial over the last 10 years.
SUGAR:
Experienced a fall in production towards the end of this period due to land lease issues in the industry.

Phase II: 1987-1999
POLICIES
World Bank and IMF imposed agenda for Structural
Adjustment Policies (SAPs) before the military coup in 1987
Deregulation of economy to bring domestic prices in line with
the world prices
Government expenditure growth restraint to ensure resource
availability for growth sector
Taxation system reform – to minimize market distortions and
improve incentives for risk taking and effort
Wages policy that recognizes importance of international
competitiveness
Increased Fijian participation in commerce and industry
Reorientation of sector policies in accordance to the above

Phase II: 1990-1999
POLICIES
Deregulation - of product and factor markets
Reduction of tariffs and removal of import quotas
Increase exports: Towards end 1980s, tax-free factories receiving
heavy concessions if exports were more than 95%
Fijian garment export: F$8.8m in 1987 -> F$141m in 1994 -> F$332m
in 1999
Despite government efforts, Fiji’s economic growth since 1987 has
been poor
Most policies were formulated with the idea that the Indo-Fijians were
rich & the Indigenous Fijians were poor. However, it was noted in a
study that not all Indo-Fijians were rich, it was only a part. Thus, we see
that the basis for policy formulation wasn’t accurate and
representative of the country’s demographic.

Phase III: 2000-PresentR
eso
urc
es • Sugar &
Confectionery
• Serenity that drives tourism
• Fisheries resources
Ide
as • Military Coups
• Ethnic Clashes causing unresolved land agreements.
Po
licy Im
ple
me
nta
tio
n
• Independence of the judiciary called into question
• Foreign exchanged controls relaxed
• Land regulation reforms

Phase III: 2000-PresentIDEAS
Ethnic Clashes and Military Coups
• This period saw two military coups take place adversely affecting economic growth.
• Besides this, a long standing impasse between Indo-Fijians &
Indigenous Fijians categorized the country’s economic problems.
• Disagreements over long-term extensions of the land leases have
led to a lack of investments in the sugar industry, which urgently
requires modernization.
• Rapid economic growth can lead to a curb in the ethnic clashes.
However, that can only be brought about by effective Leadership,
Acquiring the consensus of the people and taking small steps as opposed to big bang changes.
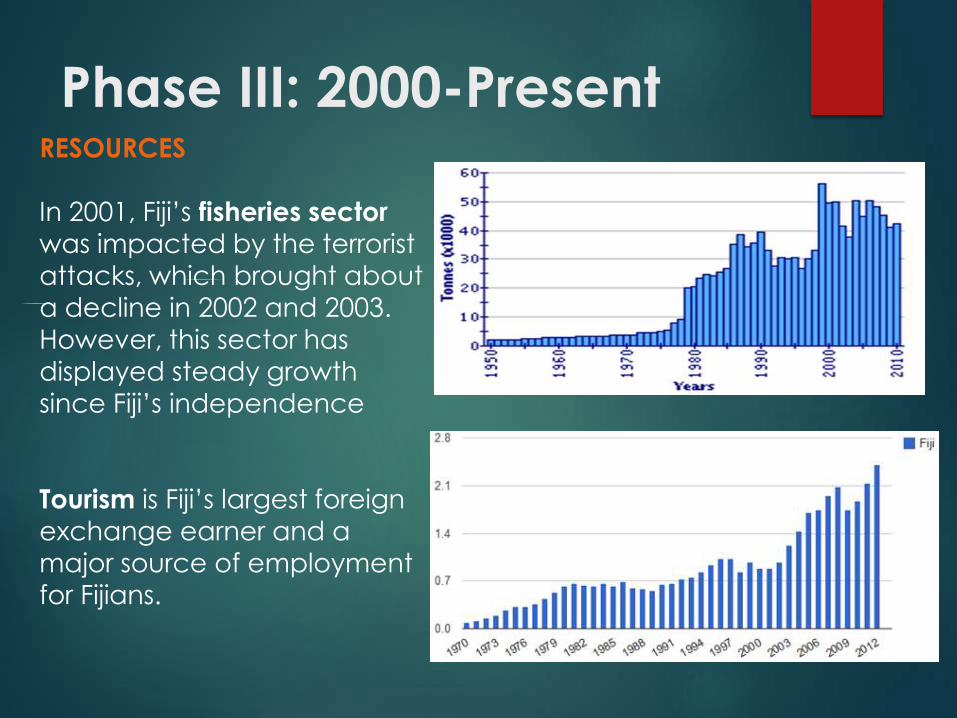
Phase III: 2000-PresentRESOURCES
In 2001, Fiji’s fisheries sector
was impacted by the terrorist
attacks, which brought about
a decline in 2002 and 2003.
However, this sector has
displayed steady growth
since Fiji’s independence
Tourism is Fiji’s largest foreign
exchange earner and a
major source of employment
for Fijians.

Phase III: 2000-PresentRESOURCES
• Australia & New Zealand continue to be main market sources with
regards to tourism• India & China however are emerging markets in this regard. India
especially has been noticed as a “low-income, high-yield”
market. • Unlike other sectors in the country, the tourism sector has seen
some amount development.
• The Tourism Emergency Management and Communication
Taskforce was formed in January 2012 during a tropical depression
that affected the western region of Fiji. It acts as a channel for
information between the tourism industry and Government
emergency and other services.

Phase III: 2000-PresentPOLICIES
Military coup in 2000 – Got garment industry in turmoil as investor
lost confidence and faced market difficulties
Sep 2002: 20-Year Development Plan – aimed to give indigenous
Fijians a great stake in the economy:
- Tax-relief to businesses owned or managed by ethnic Fijians
- Greater protection for indigenous land and fishery rights
The judiciary which had a tradition of being unbiased and strong
was a positive sign for investors. However, post-coup, the
independence of the judiciary had been called into question.
Various forex controls were relaxed. Foreign investors bringing in
funds or equipment to invest in Fiji are guaranteed repatriation of their investment profits and capital provided regulations are
adhered to.

Phase III: 2000-PresentPOLICIES
Three types of land – iTaukei land, Crown land & Freehold land
iTaukei land is the close to 88% of the land held by indigenous fijians
and is administered by Lands Trust Board (TLTB). It cannot be sold
and can only be leased.
Crown land refers to around 4% of the land owned by the
government. Here again, land cannot be sold.
Freehold land accounts for about 8% of the land. Investors may
lease land, though different leases have different terms &
conditions. Leases may be sold, transferred and amended, subject
to approvals from TLTB & Land departments.
Land ownership & usage is a highly complex and sensitive issue that has hampered growth of business. In 2006, the government
dismissed several TLTB officials during an anti-corruption drive and
initiated reforms on land regulations.

Recent Happenings
4.6% growth in 2013 (Revised estimates)
Broad-based growth:
1. Led by service sectors - finance, insurance, and transport
and storage
2. Supported by greater construction and manufacturing
activity
3. Doubled lending for investment, as construction picked up,
mainly on tourism and infrastructure projects

Recent Happenings
Jan – May 2014: Imports of consumption goods, mainly
vehicles, rose by 15.6%
Personal remittances increased by 13.2% year on year in the
second quarter, boosting consumption expenditure
Tourism Sector – continued strong performance
Visitor arrival increased 4% year-on-year
First 6 weeks of the annual sugar-crushing season - 48.8% increase in output due to government investment in
technology in 2013
Current account deficit widened in the second quarter as
imports rose and exports were flat however, it is expected to narrow due to remittances and tourism receipts in the
second half.

Looking Ahead Growth is expected to remain robust, but is seen to ease slightly
as sharp increases in consumption and investment expenditures
in 2013 are likely to moderate.
The 2015 growth projection is maintained at 3.0% subject to
upside and downside risks:-
Upsides
• Greater investment and tourism due to reduced uncertainty following the September 2014 elections
• Reintegration and renewed engagement with development partners
Downsides
• Ongoing dry weather conditions that are expected to persist into next year and lower output of agricultural goods besides sugar
• Possible fiscal tightening after recent expansions in public expenditure

Looking Ahead
International Monetary Fund assessed Fiji’s “potential GDP
growth rate” to be only about 2.5%.
The assessment suggests that, despite the positive growth outlook in the near term, investment and policy reforms
are needed to address supply-side capacity constraints
and improve productivity.
Institute further structural reforms to improve the country’s
growth potential.

Thank you
Q & A

References Fiji: Economy, http://www.adb.org/countries/fiji/economy
Institutions, Economic Performance and Sustainable Development: A
Case Study of the Fiji Islands, By Biman C. Prasad, Clement Allan Tisdell
TheGlobalEconomy.Com,
http://www.theglobaleconomy.com/Fiji/Economic_growth/
Parliament of Australia, Constitutional and Political Change in Fiji,
http://www.aph.gov.au/About_Parliament/Parliamentary_Department
s/Parliamentary_Library/pubs/rp/RP9798/98RP07
Fiji’s economy: a view over 25 years, http://devpolicy.org/fijis-
economy-a-view-over-25-years/