economic impact of the texas forest sector - texas forest service
TRANSCRIPT
Economic Impact of
the Texas Forest Sector
Publication 161 Weihuan Xu
Economic Impact of the Texas Forest Sector
Weihuan Xu, Ph.D.
Principal Economist
Forest Resource Development
Texas Forest Service
College Station, Texas
Publication 161 June 2002
Economic Impact of the Texas Forest Sector INTRODUCTION
The forest sector is important to the Texas economy, especially in East Texas where most
of the state’s commercial forests are located. In 1999, Texas produced 699 million cubic
feet of timber. Timber stumpage value was $606 million and the delivered value was
$1.06 billion. In 1999, Texas produced 1.51 billion board feet of lumber, 3.26 billion
square feet of structural panel, and 3.22 billion tons of pulp and paper products. The
Texas forest sector also produces many value-added forest products such as millwork,
wood kitchen cabinets, prefabricated wood buildings, wood furniture, and various paper
products.
This study evaluates the forest sector’s direct and total impacts in 1999 to the overall
Texas economy in terms of total industry output, value-added, employment, and labor
income. Total industry output is the total value of production by industry for a given
time period. Value-added consists of four components: employee compensation,
proprietor income, other property income, and indirect business tax. Employment
includes full-time and part-time employees, and self-employed. Labor income includes
wages, salary and benefits of employees as well as income for self-employed individuals.
The economic activities in one sector have three kinds of effects to the over all economy:
direct effects, indirect effects, and induced effects. The direct effects refer to the sector’s
own production, value-added, employment and labor incomes. The indirect effects refer
to the economic activities in other sectors impacted by the forest sector’s purchase of
goods and services. The induced effects are economic activities from consumption of
goods and services using incomes generated from the direct and indirect effects. While
direct economic impact of a sector includes only direct effects, total economic impact
of a sector includes all three effects generated by the sector.
Since most of the commercial forestland base and primary wood product manufacturing
activities are in East Texas (Figure 1), this study also estimates the impact of the forest
sector in this region to the East Texas economy.
2
METHODS
This study uses the input-output method to estimate the direct and total economic impact
of the Texas forest sector in 1999. The input-output method, an empirical tool introduced
by Wassily Leontief in the late 1930s, is designed to measure the interdependencies of
industries in the economy. The input-output analysis can be used to analyze the impact
of changes of economic activities (demand or production) in one sector of the economy to
other sectors of the economy.
The IMPLAN system, a computerized input-output modeling system, and associated
databases were utilized for estimating the direct and total economic impact of the Texas
forest sector. The IMPLAN system was developed by the U.S. Forest Service in the
early 1980s in response to the need for economic analyses of national forest management
plans. The system was later transferred to the private sector and is now maintained by
the Minnesota IMPLAN Group (MIG). For any region, the IMPLAN system creates an
input-output model that estimates the impacts of the sector of interest to the regional
economy by using the input-output relationships among sectors and deriving multipliers
for output, value-added, employment, and labor income of the sector. The multipliers
used in this study are type SAM multipliers1. The type SAM multipliers capture the total
economic impact of economic sectors including direct, indirect and induced effects. The
databases used by the IMPLAN system were compiled by the MIG based on data from
various US governmental agencies such as Bureau of Economic Analysis, Bureau of
Labor Statistics, Census Bureau, Department of Agriculture, and Geological Survey. The
IMPLAN databases consist of the following components: employment, industry output,
value added, final demands, national structural matrices, and inter-institutional transfers
(MIG, Inc. 2002). The data set used in this study is for 1999. All values estimated here
are in 1999 dollars.
The Texas forest sector is divided into six sub-industries, including forestry, logging,
primary solid wood products, secondary solid wood products, primary paper &
paperboard products, and secondary paper & paperboard products. Each sub-industry 1 SAM is the acronym for Social Accounting Matrices, a macro accounting system widely used by many countries for analyzing relationships of economic activities such as production, consumption and trade between various economic entities.
3
includes several IMPLAN sectors as defined by the MIG in Table 1. Most of the
IMPLAN sectors are self-explanatory, with the exception of sector 22, forest products,
and sector 24, forestry products. The two sectors have the same economic activities, such
as producing seeds, seedlings, planting trees, growing stumpage, hunting leases and other
by-products of forestry. However, sector 24 reports these activities from firms that are
principally engaged in stumpage production, while sector 22 includes activities from
farms, where stumpage production is not their primary economic function.
The direct and total economic impacts for industry output, value added, employment and
labor income are estimated for East Texas and Texas for 1999. The estimated economic
impacts from the input-output models were analyzed for consistency with data from other
sources, such as data from Harvest Trends and Texas Timber Price Trends published by
the Texas Forest Service. Economic activities in sector 24 are underestimated in the
IMPLAN databases due to difficulties in collecting data from small landowners. The
output of sector 24 in East Texas was therefore adjusted based on the stumpage values of
timber harvested in East Texas from Harvest Trends, 1999. Proprietary income, other
property income, and indirect business tax of the sector were adjusted proportionally to
output. Employee compensation and employment of sector 24 remained unchanged.
Since there is little commercial forest outside of East Texas, the direct economic impact
of sector 24 for Texas was adjusted to be the same as that in East Texas. Some non-
forest based economic activities such as hunting leases on non-forestland outside of East
Texas that was originally a part of sector 24 were excluded.
RESULTS
Direct Economic Impact of the Texas Forest Sector
The direct economic impact of the Texas forest sector in 1999 is reported in Table 2. The
Texas forest sector produced $12.9 billion of industry outputs, $4.6 billion of which were
value-added. It employed 79,500 workers and paid $2.9 billion wages, salaries and
benefits in the same year.
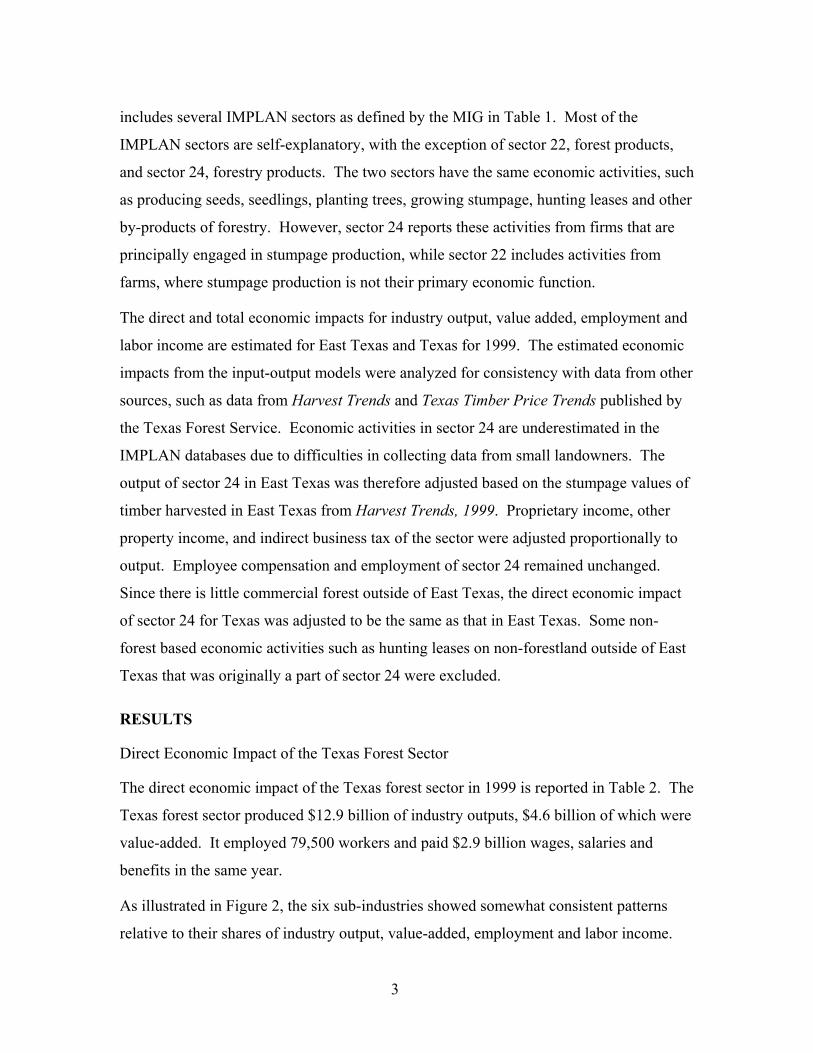
As illustrated in Figure 2, the six sub-industries showed somewhat consistent patterns
relative to their shares of industry output, value-added, employment and labor income.
4
The largest industry output came from the secondary paper & paperboard products
industry. In terms of value-added, employment and labor income, the secondary paper &
paperboard products industry ranked second. The secondary solid wood products
industry ranked second in industry output. Yet, it produced the largest value-added,
employed the most labor force, and generated the highest labor income in the forest
sector. Primary paper & paperboard products and primary solid wood products industries
took the third and fourth places by industry output, value-added, employment and labor
income. The smallest industries were forestry and logging with forestry having higher
economic impact than logging in all economic indicators except labor income.
Figure 2. Shares of Direct Economic Impact ofTexas Forest Sector by Sub-industry, 1999
0%
20%
40%
60%
80%
100%
Industry Output Value-Added Employment Labor IncomeForestry LoggingPrimary Solid Wood Secondary Solid WoodPrimary Paper & Paperboard Secondary Paper & Paperboard
Value-added to output ratio was calculated to measure the percentage of returns to capital
and labor in a sector (Figure 3). The difference between value-added and output is the
intermediate inputs, such as raw materials and energy. Forestry had the highest ratio of
value-added to output (57.1%), followed by logging (42.5%) and secondary solid wood
(38.0%). The ratios in the other three sub-industries were slightly lower.
5
Figure 3. Value-added to Output Ratio of the Texas Forest Sector
42.5%31.5%
39.5%32.4%33.1%
36.0%
57.1%
0% 10% 20% 30% 40% 50% 60%
ForestryLogging
Primary Solid WoodSecondary Solid Wood
Primary Paper & PaperboardSecondary Paper & Paperboard
Average
The output to employment ratio in Figure 4, a labor productivity index, measures annual
output per employee. Primary paper & paperboard products industry boasted the highest
labor productivity at $384,200 output per employee per year in 1999. The second highest
labor productivity was from secondary paper & paperboard products industry at $224,200
output per employee per year. Logging and forestry ranked third and fourth at $167,900
and $160,100 output per employee per year, respectively. Secondary solid wood
products and primary solid wood products industries had the lowest labor productivity in
the Texas forest sector with $112,600 and $111,300 output per employee, respectively.
Figure 4. Output to Employment Ratio of the Texas Forest Sector
160.1167.9178.8
94.4384.2
224.2162.2
0 100 200 300 400 500
ForestryLogging
Primary Solid WoodSecondary Solid Wood
Primary Paper & PaperboardSecondary Paper & Paperboard
Average
($1000/person)
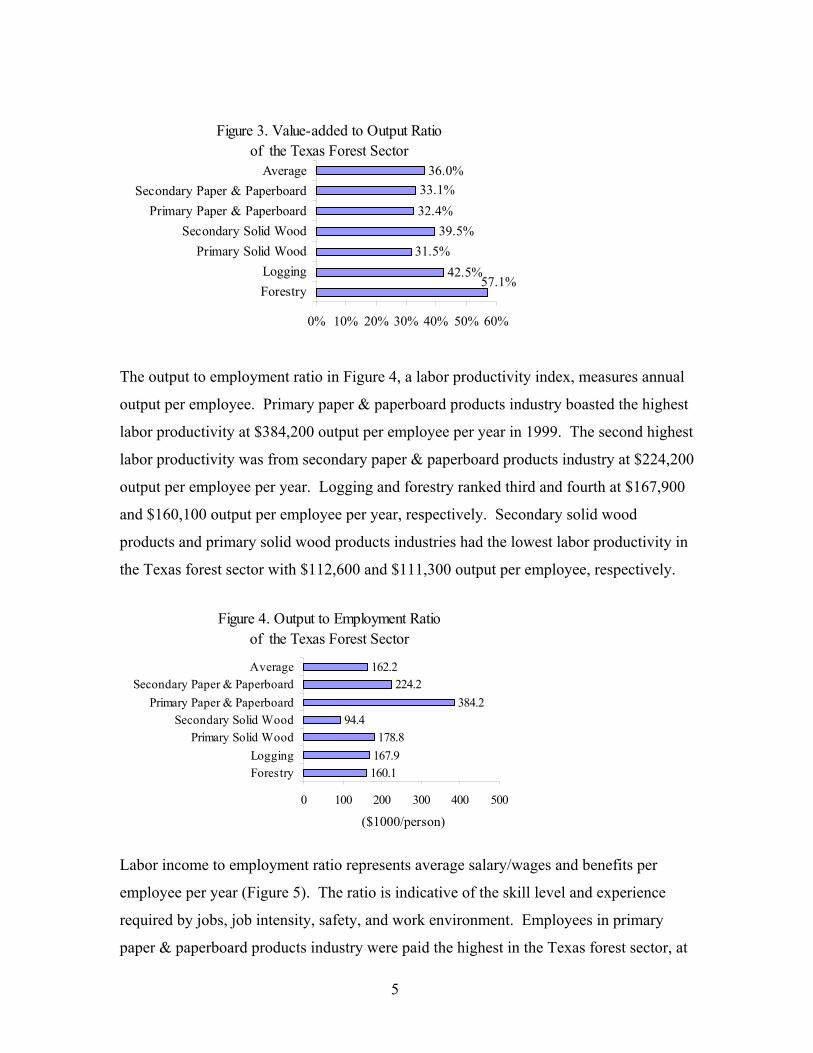
Labor income to employment ratio represents average salary/wages and benefits per
employee per year (Figure 5). The ratio is indicative of the skill level and experience
required by jobs, job intensity, safety, and work environment. Employees in primary
paper & paperboard products industry were paid the highest in the Texas forest sector, at
6
$67,500/person/year. Secondary paper & paperboard products industry was the second in
average employee compensation, at $44,700/person/year. Average employee
compensations in logging, secondary solid wood products and primary solid wood
products industries were fairly close, at $37,100, $32,600 and $31,600 per person per
year, respectively. The lowest payroll was in forestry --- average pay was only
$16,200/person/year, possibly reflecting the seasonal and low-skill nature of forestry
jobs.
Figure 5. Labor Income to Employment Ratioof the Texas Forest Sector
16.237.138.6
30.567.5
44.737.1
0 10 20 30 40 50 60 70 80
ForestryLogging
Primary Solid WoodSecondary Solid Wood
Primary Paper & PaperboardSecondary Paper & Paperboard
Average
($1000/person)
Total Economic Impact of the Texas Forest Sector
The annual total economic impact of the Texas forest sector was $22.1 billion in 1999,
$9.9 billion of which were value-added. In the same year, the Texas forest sector
generated 169,200 jobs and created $6.0 billion in labor income (Table 3). These impacts
were estimated based on type SAM multipliers for output, value-added, employment and
labor income in Table 4.
Direct Economic Impact of the Forest Sector in East Texas
The forest sector in East Texas produced $6.1 billion of goods and services in 1999. It
generated $2.2 billion in value-added, 32,600 jobs and $1.2 billion in labor income
(Table 5). The characteristics of the forest sector in East Texas in terms of value-added
to output ratio, output to employment ratio, and labor income to employment ratio in each
sub-industry were similar to Texas as a whole.
7
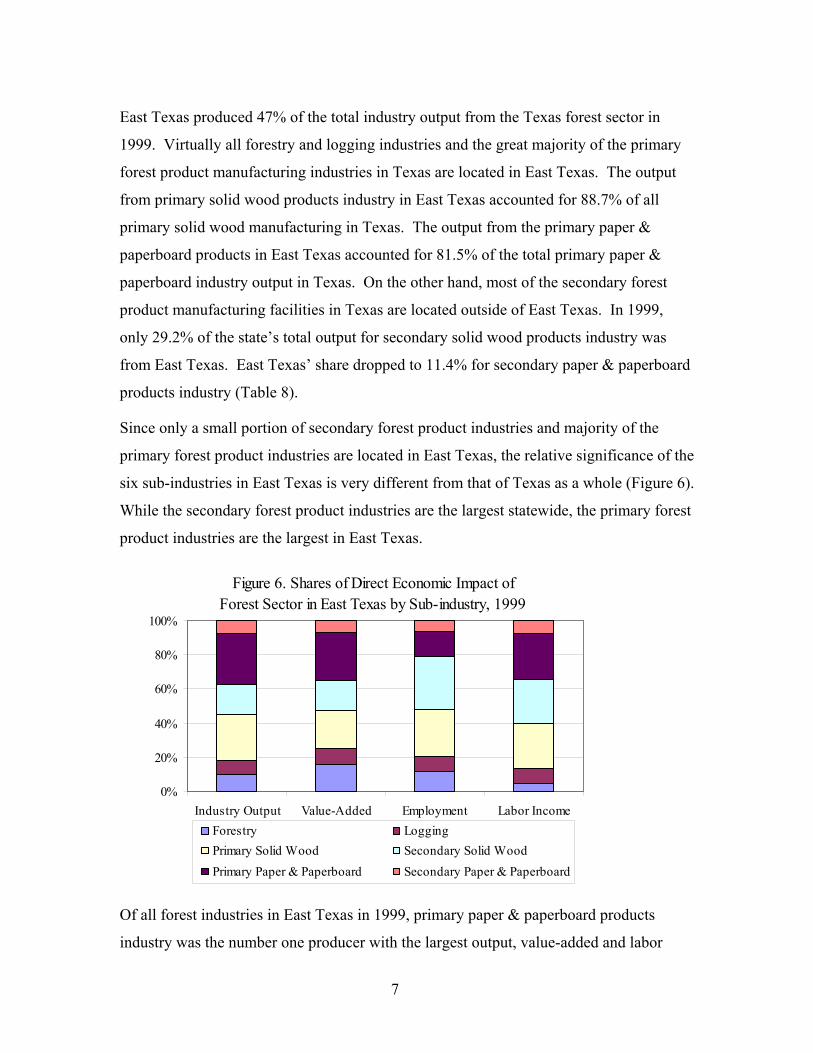
East Texas produced 47% of the total industry output from the Texas forest sector in
1999. Virtually all forestry and logging industries and the great majority of the primary
forest product manufacturing industries in Texas are located in East Texas. The output
from primary solid wood products industry in East Texas accounted for 88.7% of all
primary solid wood manufacturing in Texas. The output from the primary paper &
paperboard products in East Texas accounted for 81.5% of the total primary paper &
paperboard industry output in Texas. On the other hand, most of the secondary forest
product manufacturing facilities in Texas are located outside of East Texas. In 1999,
only 29.2% of the state’s total output for secondary solid wood products industry was
from East Texas. East Texas’ share dropped to 11.4% for secondary paper & paperboard
products industry (Table 8).
Since only a small portion of secondary forest product industries and majority of the
primary forest product industries are located in East Texas, the relative significance of the
six sub-industries in East Texas is very different from that of Texas as a whole (Figure 6).
While the secondary forest product industries are the largest statewide, the primary forest
product industries are the largest in East Texas.
Figure 6. Shares of Direct Economic Impact of Forest Sector in East Texas by Sub-industry, 1999
0%
20%
40%
60%
80%
100%
Industry Output Value-Added Employment Labor IncomeForestry LoggingPrimary Solid Wood Secondary Solid WoodPrimary Paper & Paperboard Secondary Paper & Paperboard
Of all forest industries in East Texas in 1999, primary paper & paperboard products
industry was the number one producer with the largest output, value-added and labor
8
income. It was the third largest employer in the sector. Primary solid wood products
industry was the second largest industry in the same year by all four economic indicators.
Secondary solid wood products industry was the largest employer in the sector and
ranked third based on output, value-added and labor income. Forestry, logging and
secondary paper & paperboard products ranked fourth, fifth and sixth, respectively, based
on all economic indicators but labor income. In terms of payroll size, logging ranked
fourth, secondary paper & paperboard products ranked fifth and forestry ranked sixth.
Total Economic Impact of the Forest Sector in East Texas
The total estimated output impact of the East Texas forest sector was $10.9 billion of
output in 1999, $4.9 billion of which was value-added impact. The total employment
impact of the East Texas forest sector was 77,300 jobs. The East Texas forest sector
provided $2.9 billion in payroll in 1999 for the region (Table 6). The total economic
impact of the forest sector in East Texas was estimated based on type SAM multipliers in
Table 7.
CONCLUSION
This study analyzed the importance of the Texas forest sector to the Texas economy and
to the economy of East Texas in particular. It estimated the direct and total economic
impacts of the forest sector in thirty-three IMPLAN sectors and six sub-industries for
both Texas and East Texas. It assessed the structure of the sector by the IMPLAN sectors
and sub-industry, and by industry locations inside and outside of East Texas. The
multipliers published in this study can be used for assessing the economic impact of
individual projects in the Texas forest sector.
LITERATURE
MIG, Inc. 2002. User’s Guide, Analysis Guide, Data Guide for IMPLAN Professional
Version 2.0
Weihuan Xu, 1999, Harvest Trends, Texas Forest Service, Publication 158
Texas Forest Service, 1999, Timber Price Trends

HARRIS
POLK
LEON
CASS
RUSK
SMITH
TYLER
BOWIE
LIBERTY
JASPER
HOUSTON
JEFFERSON
HARDIN
WOOD
NEWTON
SHELBY
GRIMES
RED RIVER
PANOLA
CHEROKEEANDERSON
WALKER
HARRISON
TRINITY
ANGELINA
SABINE
HENDERSON
CHAMBERS
TITUS
UPSHUR
VAN ZANDT
MONTGOMERY
NACOGDOCHES
WALLER
MARION
MADISON
SAN JACINTO
ORANGE
GREGG
SAN
AU
GU
STIN
E
CAMP
MO
RR
IS
FRA
NK
LIN
Figure 1. East Texas Counties
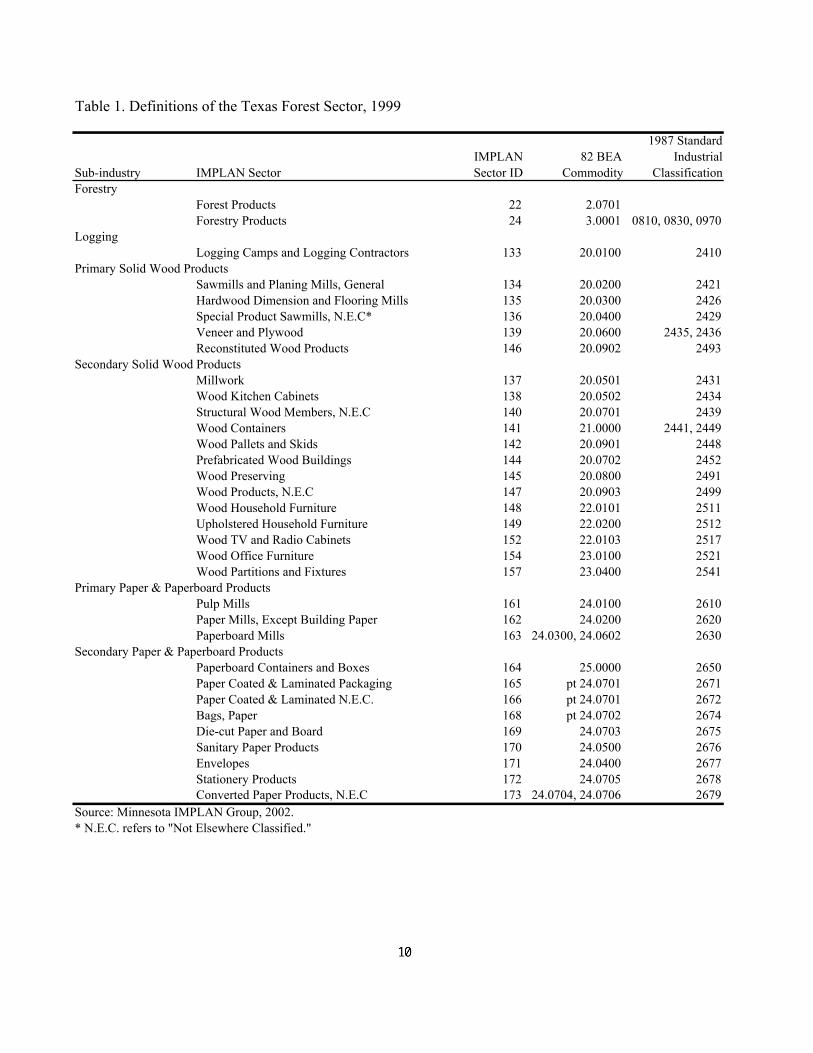
Table 1. Definitions of the Texas Forest Sector, 1999
Sub-industry IMPLAN SectorIMPLAN Sector ID
82 BEA Commodity
1987 Standard Industrial
ClassificationForestry
Forest Products 22 2.0701Forestry Products 24 3.0001 0810, 0830, 0970
LoggingLogging Camps and Logging Contractors 133 20.0100 2410
Primary Solid Wood ProductsSawmills and Planing Mills, General 134 20.0200 2421Hardwood Dimension and Flooring Mills 135 20.0300 2426Special Product Sawmills, N.E.C* 136 20.0400 2429Veneer and Plywood 139 20.0600 2435, 2436Reconstituted Wood Products 146 20.0902 2493
Secondary Solid Wood ProductsMillwork 137 20.0501 2431Wood Kitchen Cabinets 138 20.0502 2434Structural Wood Members, N.E.C 140 20.0701 2439Wood Containers 141 21.0000 2441, 2449Wood Pallets and Skids 142 20.0901 2448Prefabricated Wood Buildings 144 20.0702 2452Wood Preserving 145 20.0800 2491Wood Products, N.E.C 147 20.0903 2499Wood Household Furniture 148 22.0101 2511Upholstered Household Furniture 149 22.0200 2512Wood TV and Radio Cabinets 152 22.0103 2517Wood Office Furniture 154 23.0100 2521Wood Partitions and Fixtures 157 23.0400 2541
Primary Paper & Paperboard ProductsPulp Mills 161 24.0100 2610Paper Mills, Except Building Paper 162 24.0200 2620Paperboard Mills 163 24.0300, 24.0602 2630
Secondary Paper & Paperboard ProductsPaperboard Containers and Boxes 164 25.0000 2650Paper Coated & Laminated Packaging 165 pt 24.0701 2671Paper Coated & Laminated N.E.C. 166 pt 24.0701 2672Bags, Paper 168 pt 24.0702 2674Die-cut Paper and Board 169 24.0703 2675Sanitary Paper Products 170 24.0500 2676Envelopes 171 24.0400 2677Stationery Products 172 24.0705 2678Converted Paper Products, N.E.C 173 24.0704, 24.0706 2679
Source: Minnesota IMPLAN Group, 2002.* N.E.C. refers to "Not Elsewhere Classified."
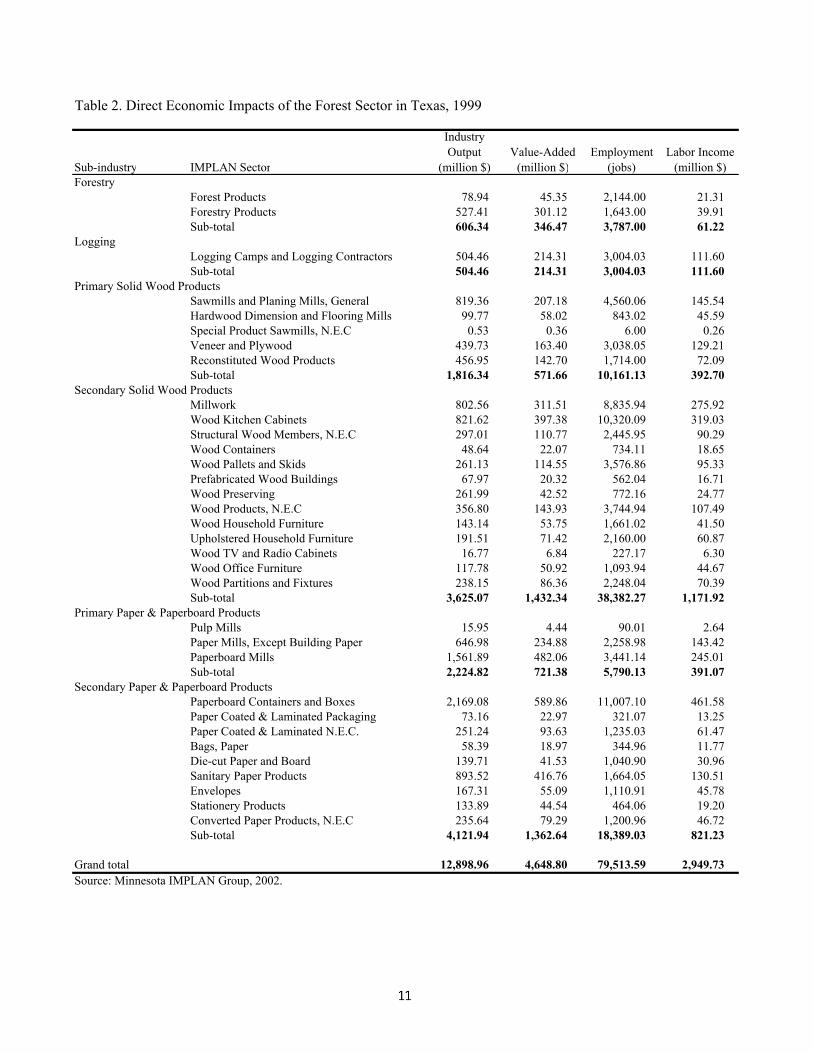
Table 2. Direct Economic Impacts of the Forest Sector in Texas, 1999
Sub-industry IMPLAN Sector
Industry Output
(million $)Value-Added
(million $)Employment
(jobs)Labor Income
(million $)Forestry
Forest Products 78.94 45.35 2,144.00 21.31 Forestry Products 527.41 301.12 1,643.00 39.91 Sub-total 606.34 346.47 3,787.00 61.22
LoggingLogging Camps and Logging Contractors 504.46 214.31 3,004.03 111.60 Sub-total 504.46 214.31 3,004.03 111.60
Primary Solid Wood ProductsSawmills and Planing Mills, General 819.36 207.18 4,560.06 145.54 Hardwood Dimension and Flooring Mills 99.77 58.02 843.02 45.59 Special Product Sawmills, N.E.C 0.53 0.36 6.00 0.26 Veneer and Plywood 439.73 163.40 3,038.05 129.21 Reconstituted Wood Products 456.95 142.70 1,714.00 72.09 Sub-total 1,816.34 571.66 10,161.13 392.70
Secondary Solid Wood ProductsMillwork 802.56 311.51 8,835.94 275.92 Wood Kitchen Cabinets 821.62 397.38 10,320.09 319.03 Structural Wood Members, N.E.C 297.01 110.77 2,445.95 90.29 Wood Containers 48.64 22.07 734.11 18.65 Wood Pallets and Skids 261.13 114.55 3,576.86 95.33 Prefabricated Wood Buildings 67.97 20.32 562.04 16.71 Wood Preserving 261.99 42.52 772.16 24.77 Wood Products, N.E.C 356.80 143.93 3,744.94 107.49 Wood Household Furniture 143.14 53.75 1,661.02 41.50 Upholstered Household Furniture 191.51 71.42 2,160.00 60.87 Wood TV and Radio Cabinets 16.77 6.84 227.17 6.30 Wood Office Furniture 117.78 50.92 1,093.94 44.67 Wood Partitions and Fixtures 238.15 86.36 2,248.04 70.39 Sub-total 3,625.07 1,432.34 38,382.27 1,171.92
Primary Paper & Paperboard ProductsPulp Mills 15.95 4.44 90.01 2.64 Paper Mills, Except Building Paper 646.98 234.88 2,258.98 143.42 Paperboard Mills 1,561.89 482.06 3,441.14 245.01 Sub-total 2,224.82 721.38 5,790.13 391.07
Secondary Paper & Paperboard ProductsPaperboard Containers and Boxes 2,169.08 589.86 11,007.10 461.58 Paper Coated & Laminated Packaging 73.16 22.97 321.07 13.25 Paper Coated & Laminated N.E.C. 251.24 93.63 1,235.03 61.47 Bags, Paper 58.39 18.97 344.96 11.77 Die-cut Paper and Board 139.71 41.53 1,040.90 30.96 Sanitary Paper Products 893.52 416.76 1,664.05 130.51 Envelopes 167.31 55.09 1,110.91 45.78 Stationery Products 133.89 44.54 464.06 19.20 Converted Paper Products, N.E.C 235.64 79.29 1,200.96 46.72 Sub-total 4,121.94 1,362.64 18,389.03 821.23
Grand total 12,898.96 4,648.80 79,513.59 2,949.73 Source: Minnesota IMPLAN Group, 2002.
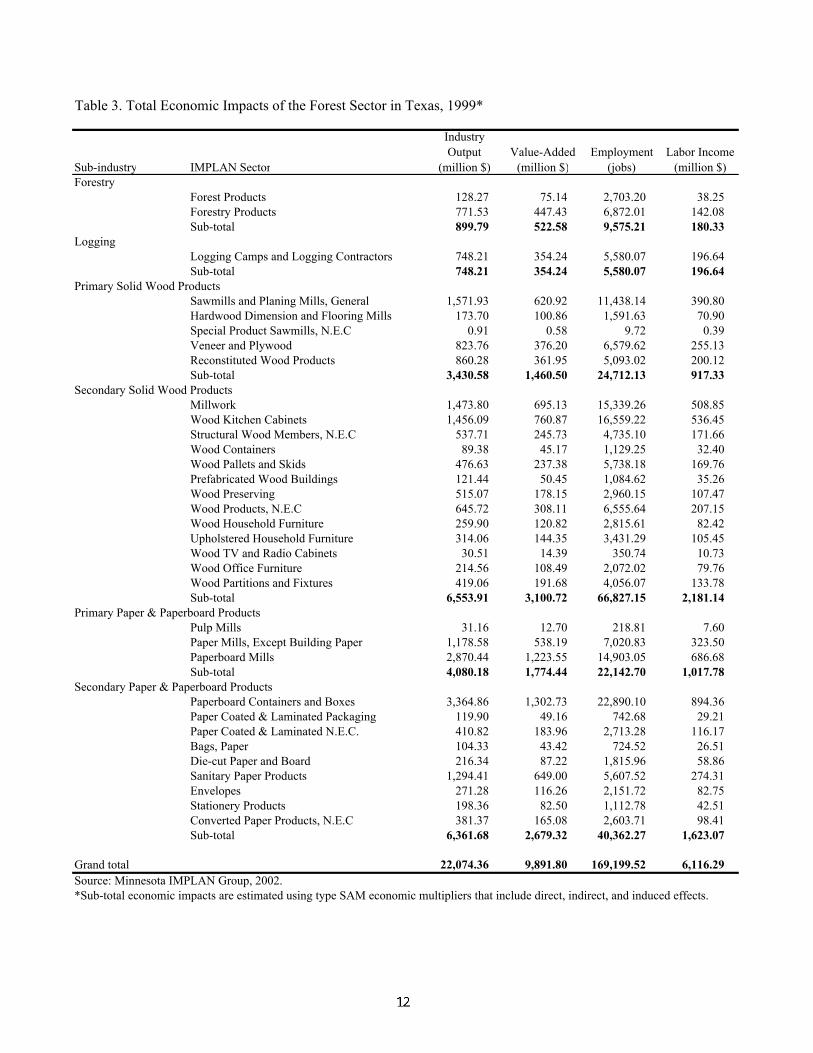
Table 3. Total Economic Impacts of the Forest Sector in Texas, 1999*
Sub-industry IMPLAN Sector
Industry Output
(million $)Value-Added
(million $)Employment
(jobs)Labor Income
(million $)Forestry
Forest Products 128.27 75.14 2,703.20 38.25 Forestry Products 771.53 447.43 6,872.01 142.08 Sub-total 899.79 522.58 9,575.21 180.33
LoggingLogging Camps and Logging Contractors 748.21 354.24 5,580.07 196.64 Sub-total 748.21 354.24 5,580.07 196.64
Primary Solid Wood ProductsSawmills and Planing Mills, General 1,571.93 620.92 11,438.14 390.80 Hardwood Dimension and Flooring Mills 173.70 100.86 1,591.63 70.90 Special Product Sawmills, N.E.C 0.91 0.58 9.72 0.39 Veneer and Plywood 823.76 376.20 6,579.62 255.13 Reconstituted Wood Products 860.28 361.95 5,093.02 200.12 Sub-total 3,430.58 1,460.50 24,712.13 917.33
Secondary Solid Wood ProductsMillwork 1,473.80 695.13 15,339.26 508.85 Wood Kitchen Cabinets 1,456.09 760.87 16,559.22 536.45 Structural Wood Members, N.E.C 537.71 245.73 4,735.10 171.66 Wood Containers 89.38 45.17 1,129.25 32.40 Wood Pallets and Skids 476.63 237.38 5,738.18 169.76 Prefabricated Wood Buildings 121.44 50.45 1,084.62 35.26 Wood Preserving 515.07 178.15 2,960.15 107.47 Wood Products, N.E.C 645.72 308.11 6,555.64 207.15 Wood Household Furniture 259.90 120.82 2,815.61 82.42 Upholstered Household Furniture 314.06 144.35 3,431.29 105.45 Wood TV and Radio Cabinets 30.51 14.39 350.74 10.73 Wood Office Furniture 214.56 108.49 2,072.02 79.76 Wood Partitions and Fixtures 419.06 191.68 4,056.07 133.78 Sub-total 6,553.91 3,100.72 66,827.15 2,181.14
Primary Paper & Paperboard ProductsPulp Mills 31.16 12.70 218.81 7.60 Paper Mills, Except Building Paper 1,178.58 538.19 7,020.83 323.50 Paperboard Mills 2,870.44 1,223.55 14,903.05 686.68 Sub-total 4,080.18 1,774.44 22,142.70 1,017.78
Secondary Paper & Paperboard ProductsPaperboard Containers and Boxes 3,364.86 1,302.73 22,890.10 894.36 Paper Coated & Laminated Packaging 119.90 49.16 742.68 29.21 Paper Coated & Laminated N.E.C. 410.82 183.96 2,713.28 116.17 Bags, Paper 104.33 43.42 724.52 26.51 Die-cut Paper and Board 216.34 87.22 1,815.96 58.86 Sanitary Paper Products 1,294.41 649.00 5,607.52 274.31 Envelopes 271.28 116.26 2,151.72 82.75 Stationery Products 198.36 82.50 1,112.78 42.51 Converted Paper Products, N.E.C 381.37 165.08 2,603.71 98.41 Sub-total 6,361.68 2,679.32 40,362.27 1,623.07
Grand total 22,074.36 9,891.80 169,199.52 6,116.29 Source: Minnesota IMPLAN Group, 2002.*Sub-total economic impacts are estimated using type SAM economic multipliers that include direct, indirect, and induced effects.
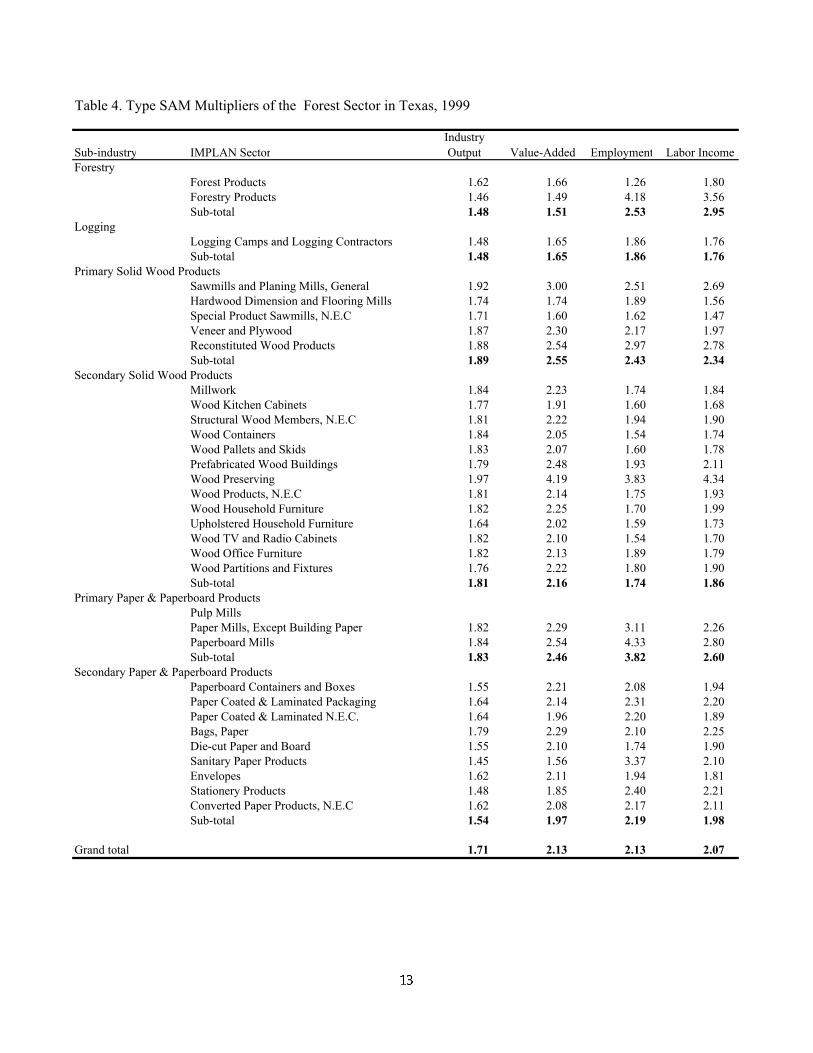
Table 4. Type SAM Multipliers of the Forest Sector in Texas, 1999
Sub-industry IMPLAN SectorIndustry Output Value-Added Employment Labor Income
ForestryForest Products 1.62 1.66 1.26 1.80 Forestry Products 1.46 1.49 4.18 3.56 Sub-total 1.48 1.51 2.53 2.95
LoggingLogging Camps and Logging Contractors 1.48 1.65 1.86 1.76 Sub-total 1.48 1.65 1.86 1.76
Primary Solid Wood ProductsSawmills and Planing Mills, General 1.92 3.00 2.51 2.69 Hardwood Dimension and Flooring Mills 1.74 1.74 1.89 1.56 Special Product Sawmills, N.E.C 1.71 1.60 1.62 1.47 Veneer and Plywood 1.87 2.30 2.17 1.97 Reconstituted Wood Products 1.88 2.54 2.97 2.78 Sub-total 1.89 2.55 2.43 2.34
Secondary Solid Wood ProductsMillwork 1.84 2.23 1.74 1.84 Wood Kitchen Cabinets 1.77 1.91 1.60 1.68 Structural Wood Members, N.E.C 1.81 2.22 1.94 1.90 Wood Containers 1.84 2.05 1.54 1.74 Wood Pallets and Skids 1.83 2.07 1.60 1.78 Prefabricated Wood Buildings 1.79 2.48 1.93 2.11 Wood Preserving 1.97 4.19 3.83 4.34 Wood Products, N.E.C 1.81 2.14 1.75 1.93 Wood Household Furniture 1.82 2.25 1.70 1.99 Upholstered Household Furniture 1.64 2.02 1.59 1.73 Wood TV and Radio Cabinets 1.82 2.10 1.54 1.70 Wood Office Furniture 1.82 2.13 1.89 1.79 Wood Partitions and Fixtures 1.76 2.22 1.80 1.90 Sub-total 1.81 2.16 1.74 1.86
Primary Paper & Paperboard ProductsPulp MillsPaper Mills, Except Building Paper 1.82 2.29 3.11 2.26 Paperboard Mills 1.84 2.54 4.33 2.80 Sub-total 1.83 2.46 3.82 2.60
Secondary Paper & Paperboard ProductsPaperboard Containers and Boxes 1.55 2.21 2.08 1.94 Paper Coated & Laminated Packaging 1.64 2.14 2.31 2.20 Paper Coated & Laminated N.E.C. 1.64 1.96 2.20 1.89 Bags, Paper 1.79 2.29 2.10 2.25 Die-cut Paper and Board 1.55 2.10 1.74 1.90 Sanitary Paper Products 1.45 1.56 3.37 2.10 Envelopes 1.62 2.11 1.94 1.81 Stationery Products 1.48 1.85 2.40 2.21 Converted Paper Products, N.E.C 1.62 2.08 2.17 2.11 Sub-total 1.54 1.97 2.19 1.98
Grand total 1.71 2.13 2.13 2.07
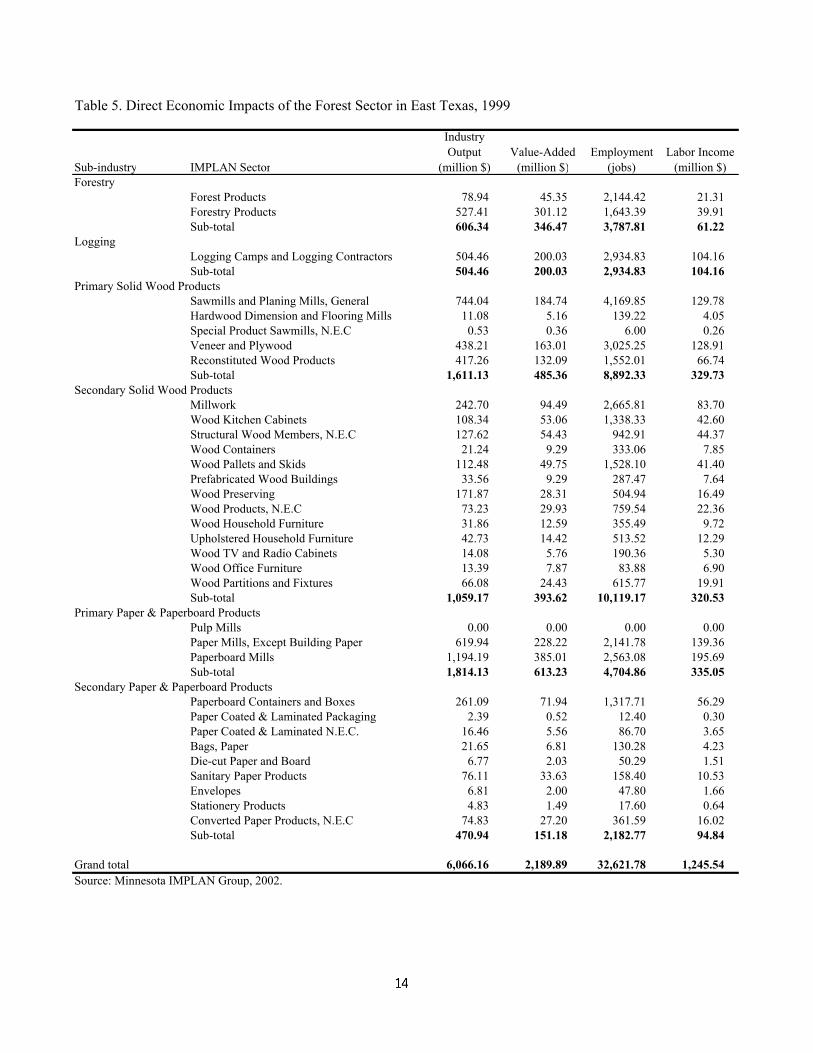
Table 5. Direct Economic Impacts of the Forest Sector in East Texas, 1999
Sub-industry IMPLAN Sector
Industry Output
(million $)Value-Added
(million $)Employment
(jobs)Labor Income
(million $)Forestry
Forest Products 78.94 45.35 2,144.42 21.31 Forestry Products 527.41 301.12 1,643.39 39.91 Sub-total 606.34 346.47 3,787.81 61.22
LoggingLogging Camps and Logging Contractors 504.46 200.03 2,934.83 104.16 Sub-total 504.46 200.03 2,934.83 104.16
Primary Solid Wood ProductsSawmills and Planing Mills, General 744.04 184.74 4,169.85 129.78 Hardwood Dimension and Flooring Mills 11.08 5.16 139.22 4.05 Special Product Sawmills, N.E.C 0.53 0.36 6.00 0.26 Veneer and Plywood 438.21 163.01 3,025.25 128.91 Reconstituted Wood Products 417.26 132.09 1,552.01 66.74 Sub-total 1,611.13 485.36 8,892.33 329.73
Secondary Solid Wood ProductsMillwork 242.70 94.49 2,665.81 83.70 Wood Kitchen Cabinets 108.34 53.06 1,338.33 42.60 Structural Wood Members, N.E.C 127.62 54.43 942.91 44.37 Wood Containers 21.24 9.29 333.06 7.85 Wood Pallets and Skids 112.48 49.75 1,528.10 41.40 Prefabricated Wood Buildings 33.56 9.29 287.47 7.64 Wood Preserving 171.87 28.31 504.94 16.49 Wood Products, N.E.C 73.23 29.93 759.54 22.36 Wood Household Furniture 31.86 12.59 355.49 9.72 Upholstered Household Furniture 42.73 14.42 513.52 12.29 Wood TV and Radio Cabinets 14.08 5.76 190.36 5.30 Wood Office Furniture 13.39 7.87 83.88 6.90 Wood Partitions and Fixtures 66.08 24.43 615.77 19.91 Sub-total 1,059.17 393.62 10,119.17 320.53
Primary Paper & Paperboard ProductsPulp Mills 0.00 0.00 0.00 0.00 Paper Mills, Except Building Paper 619.94 228.22 2,141.78 139.36 Paperboard Mills 1,194.19 385.01 2,563.08 195.69 Sub-total 1,814.13 613.23 4,704.86 335.05
Secondary Paper & Paperboard ProductsPaperboard Containers and Boxes 261.09 71.94 1,317.71 56.29 Paper Coated & Laminated Packaging 2.39 0.52 12.40 0.30 Paper Coated & Laminated N.E.C. 16.46 5.56 86.70 3.65 Bags, Paper 21.65 6.81 130.28 4.23 Die-cut Paper and Board 6.77 2.03 50.29 1.51 Sanitary Paper Products 76.11 33.63 158.40 10.53 Envelopes 6.81 2.00 47.80 1.66 Stationery Products 4.83 1.49 17.60 0.64 Converted Paper Products, N.E.C 74.83 27.20 361.59 16.02 Sub-total 470.94 151.18 2,182.77 94.84
Grand total 6,066.16 2,189.89 32,621.78 1,245.54 Source: Minnesota IMPLAN Group, 2002.
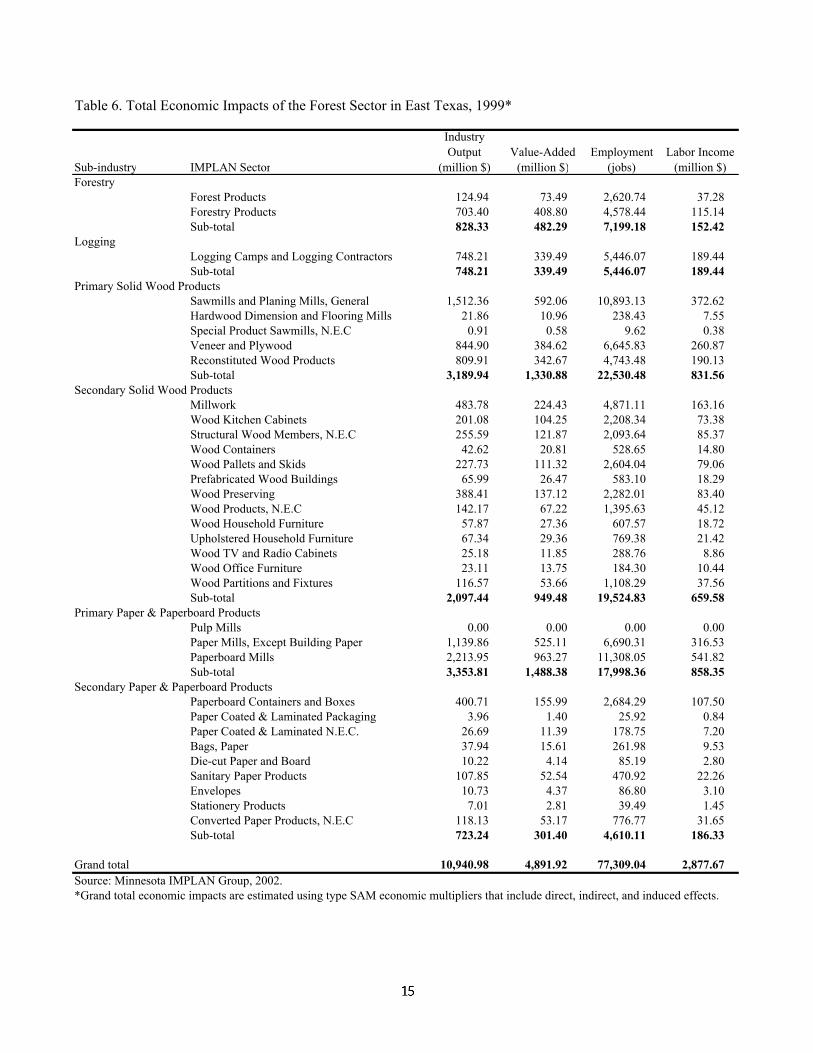
Table 6. Total Economic Impacts of the Forest Sector in East Texas, 1999*
Sub-industry IMPLAN Sector
Industry Output
(million $)Value-Added
(million $)Employment
(jobs)Labor Income
(million $)Forestry
Forest Products 124.94 73.49 2,620.74 37.28 Forestry Products 703.40 408.80 4,578.44 115.14 Sub-total 828.33 482.29 7,199.18 152.42
LoggingLogging Camps and Logging Contractors 748.21 339.49 5,446.07 189.44 Sub-total 748.21 339.49 5,446.07 189.44
Primary Solid Wood ProductsSawmills and Planing Mills, General 1,512.36 592.06 10,893.13 372.62 Hardwood Dimension and Flooring Mills 21.86 10.96 238.43 7.55 Special Product Sawmills, N.E.C 0.91 0.58 9.62 0.38 Veneer and Plywood 844.90 384.62 6,645.83 260.87 Reconstituted Wood Products 809.91 342.67 4,743.48 190.13 Sub-total 3,189.94 1,330.88 22,530.48 831.56
Secondary Solid Wood ProductsMillwork 483.78 224.43 4,871.11 163.16 Wood Kitchen Cabinets 201.08 104.25 2,208.34 73.38 Structural Wood Members, N.E.C 255.59 121.87 2,093.64 85.37 Wood Containers 42.62 20.81 528.65 14.80 Wood Pallets and Skids 227.73 111.32 2,604.04 79.06 Prefabricated Wood Buildings 65.99 26.47 583.10 18.29 Wood Preserving 388.41 137.12 2,282.01 83.40 Wood Products, N.E.C 142.17 67.22 1,395.63 45.12 Wood Household Furniture 57.87 27.36 607.57 18.72 Upholstered Household Furniture 67.34 29.36 769.38 21.42 Wood TV and Radio Cabinets 25.18 11.85 288.76 8.86 Wood Office Furniture 23.11 13.75 184.30 10.44 Wood Partitions and Fixtures 116.57 53.66 1,108.29 37.56 Sub-total 2,097.44 949.48 19,524.83 659.58
Primary Paper & Paperboard ProductsPulp Mills 0.00 0.00 0.00 0.00 Paper Mills, Except Building Paper 1,139.86 525.11 6,690.31 316.53 Paperboard Mills 2,213.95 963.27 11,308.05 541.82 Sub-total 3,353.81 1,488.38 17,998.36 858.35
Secondary Paper & Paperboard ProductsPaperboard Containers and Boxes 400.71 155.99 2,684.29 107.50 Paper Coated & Laminated Packaging 3.96 1.40 25.92 0.84 Paper Coated & Laminated N.E.C. 26.69 11.39 178.75 7.20 Bags, Paper 37.94 15.61 261.98 9.53 Die-cut Paper and Board 10.22 4.14 85.19 2.80 Sanitary Paper Products 107.85 52.54 470.92 22.26 Envelopes 10.73 4.37 86.80 3.10 Stationery Products 7.01 2.81 39.49 1.45 Converted Paper Products, N.E.C 118.13 53.17 776.77 31.65 Sub-total 723.24 301.40 4,610.11 186.33
Grand total 10,940.98 4,891.92 77,309.04 2,877.67 Source: Minnesota IMPLAN Group, 2002.*Grand total economic impacts are estimated using type SAM economic multipliers that include direct, indirect, and induced effects.
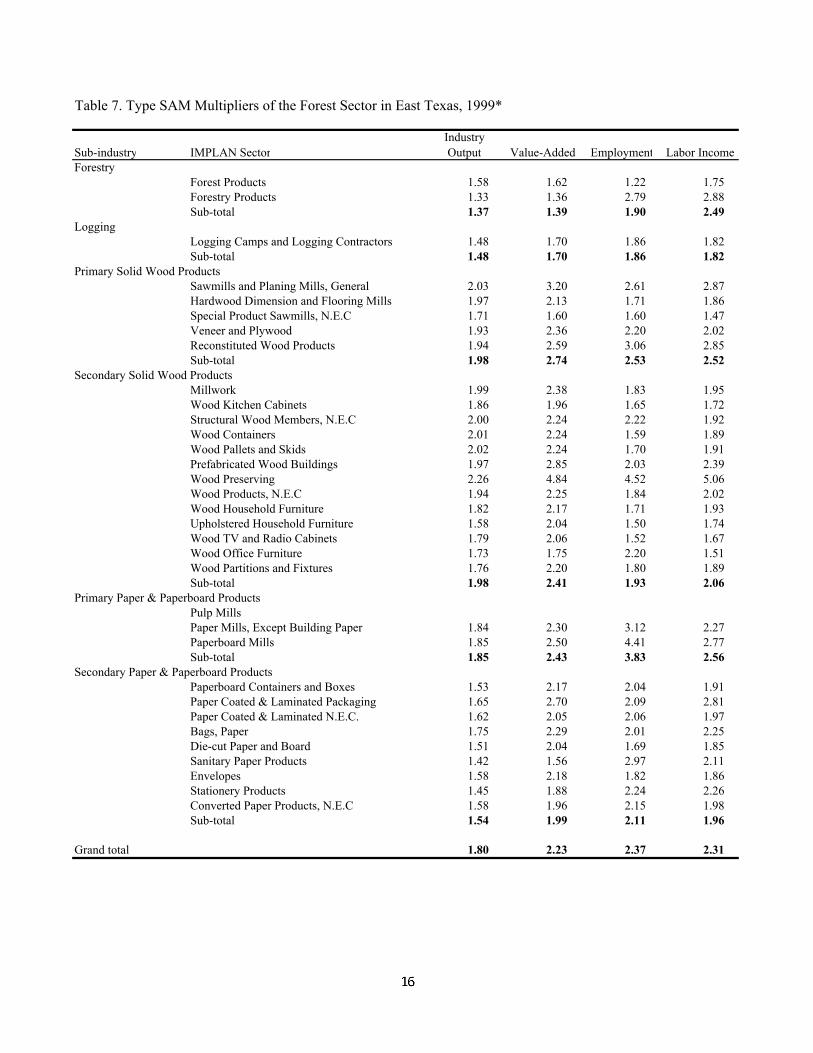
Table 7. Type SAM Multipliers of the Forest Sector in East Texas, 1999*
Sub-industry IMPLAN SectorIndustry Output Value-Added Employment Labor Income
ForestryForest Products 1.58 1.62 1.22 1.75 Forestry Products 1.33 1.36 2.79 2.88 Sub-total 1.37 1.39 1.90 2.49
LoggingLogging Camps and Logging Contractors 1.48 1.70 1.86 1.82 Sub-total 1.48 1.70 1.86 1.82
Primary Solid Wood ProductsSawmills and Planing Mills, General 2.03 3.20 2.61 2.87 Hardwood Dimension and Flooring Mills 1.97 2.13 1.71 1.86 Special Product Sawmills, N.E.C 1.71 1.60 1.60 1.47 Veneer and Plywood 1.93 2.36 2.20 2.02 Reconstituted Wood Products 1.94 2.59 3.06 2.85 Sub-total 1.98 2.74 2.53 2.52
Secondary Solid Wood ProductsMillwork 1.99 2.38 1.83 1.95 Wood Kitchen Cabinets 1.86 1.96 1.65 1.72 Structural Wood Members, N.E.C 2.00 2.24 2.22 1.92 Wood Containers 2.01 2.24 1.59 1.89 Wood Pallets and Skids 2.02 2.24 1.70 1.91 Prefabricated Wood Buildings 1.97 2.85 2.03 2.39 Wood Preserving 2.26 4.84 4.52 5.06 Wood Products, N.E.C 1.94 2.25 1.84 2.02 Wood Household Furniture 1.82 2.17 1.71 1.93 Upholstered Household Furniture 1.58 2.04 1.50 1.74 Wood TV and Radio Cabinets 1.79 2.06 1.52 1.67 Wood Office Furniture 1.73 1.75 2.20 1.51 Wood Partitions and Fixtures 1.76 2.20 1.80 1.89 Sub-total 1.98 2.41 1.93 2.06
Primary Paper & Paperboard ProductsPulp MillsPaper Mills, Except Building Paper 1.84 2.30 3.12 2.27 Paperboard Mills 1.85 2.50 4.41 2.77 Sub-total 1.85 2.43 3.83 2.56
Secondary Paper & Paperboard ProductsPaperboard Containers and Boxes 1.53 2.17 2.04 1.91 Paper Coated & Laminated Packaging 1.65 2.70 2.09 2.81 Paper Coated & Laminated N.E.C. 1.62 2.05 2.06 1.97 Bags, Paper 1.75 2.29 2.01 2.25 Die-cut Paper and Board 1.51 2.04 1.69 1.85 Sanitary Paper Products 1.42 1.56 2.97 2.11 Envelopes 1.58 2.18 1.82 1.86 Stationery Products 1.45 1.88 2.24 2.26 Converted Paper Products, N.E.C 1.58 1.96 2.15 1.98 Sub-total 1.54 1.99 2.11 1.96
Grand total 1.80 2.23 2.37 2.31
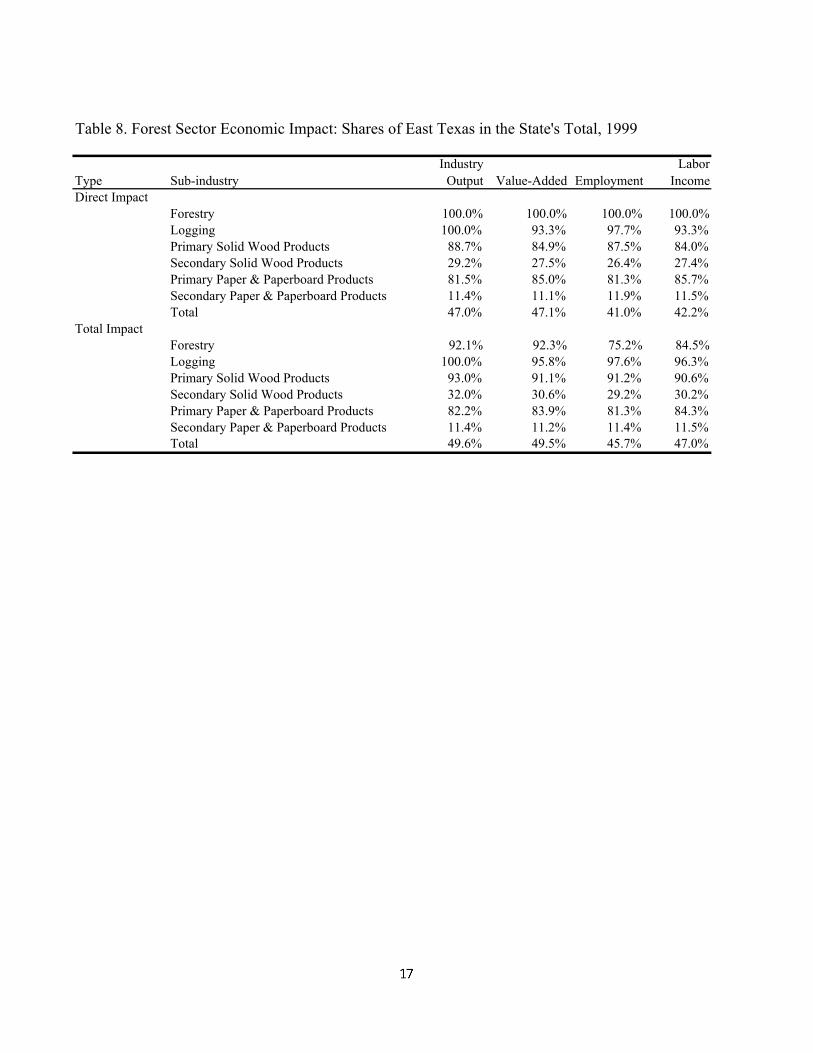
Type Sub-industryIndustry
Output Value-Added EmploymentLabor
IncomeDirect Impact
Forestry 100.0% 100.0% 100.0% 100.0%Logging 100.0% 93.3% 97.7% 93.3%Primary Solid Wood Products 88.7% 84.9% 87.5% 84.0%Secondary Solid Wood Products 29.2% 27.5% 26.4% 27.4%Primary Paper & Paperboard Products 81.5% 85.0% 81.3% 85.7%Secondary Paper & Paperboard Products 11.4% 11.1% 11.9% 11.5%Total 47.0% 47.1% 41.0% 42.2%
Total ImpactForestry 92.1% 92.3% 75.2% 84.5%Logging 100.0% 95.8% 97.6% 96.3%Primary Solid Wood Products 93.0% 91.1% 91.2% 90.6%Secondary Solid Wood Products 32.0% 30.6% 29.2% 30.2%Primary Paper & Paperboard Products 82.2% 83.9% 81.3% 84.3%Secondary Paper & Paperboard Products 11.4% 11.2% 11.4% 11.5%Total 49.6% 49.5% 45.7% 47.0%
Table 8. Forest Sector Economic Impact: Shares of East Texas in the State's Total, 1999