economic impacts of freshwater weeds in the pnw and a ... · pdf fileeconomic impacts of...
TRANSCRIPT

Columbia River Estuary Science-Policy Exchange 10-11 September 2009
Economic Impacts of
Freshwater Weeds in the PNW and
a Regional Approach to Managing
Flowering Rush
Mark Sytsma
Center for Lakes and Reservoirs
Portland State University
Justin Bush
Washington Invasive Species Council
Washington Recreation and Conservation Office
PNWER • 26 July 2017 • Portland, OR
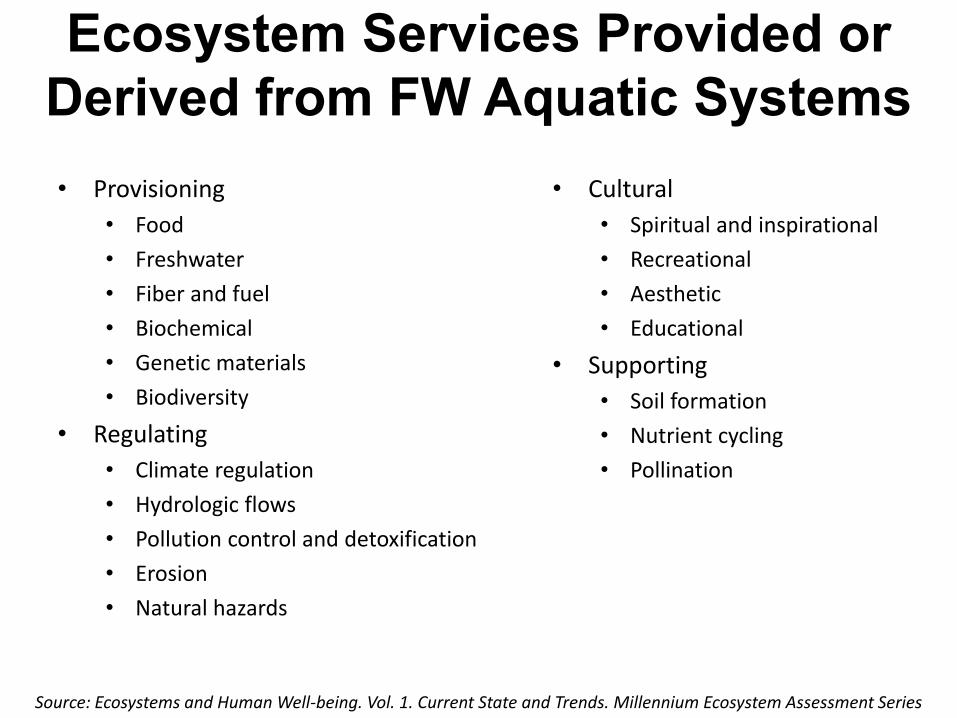
Ecosystem Services Provided or
Derived from FW Aquatic Systems
• Provisioning
• Food
• Freshwater
• Fiber and fuel
• Biochemical
• Genetic materials
• Biodiversity
• Regulating
• Climate regulation
• Hydrologic flows
• Pollution control and detoxification
• Erosion
• Natural hazards
• Cultural
• Spiritual and inspirational
• Recreational
• Aesthetic
• Educational
• Supporting
• Soil formation
• Nutrient cycling
• Pollination
Source: Ecosystems and Human Well-being. Vol. 1. Current State and Trends. Millennium Ecosystem Assessment Series

Total Economic Value of Ecosystem
Services Provided by Wetlands
$/ha/yr
Provisioning services 601
Cultural services 1373
Regulating services 1086
Supporting services 214
Total value 3,274
(1,325/ac/yr)
Source: Ecosystems and Human Well-being. 2005. Vol. 1. Current State and Trends. Millennium Ecosystem Assessment Series
Ph
oto
: USE
PA.2
00
9. N
ati
on
al L
ake
s A
sses
smen
t

Economic Impacts of Weeds in
Oregon
From: Economic Analysis of Containment Programs, Damages, and Production Losses from Noxious Weeds in Oregon (ODA 2001)

Loss of Ecosystem Services Due To
Aquatic Weeds
• Flood control $1 billion (est) in 11 counties in south FL (Rockwell 2003)
• Recreation
$1.3 million, 3 lakes in IL (Singh et al 1984)
> $10 million, 2 lakes in FL (Milon et al 1986)
>$100 million, Guntersville Res, AL (Henderson 1995)
$30-45 million, 4 lakes in Truckee watershed, California (Eiswerth et al. 2000)
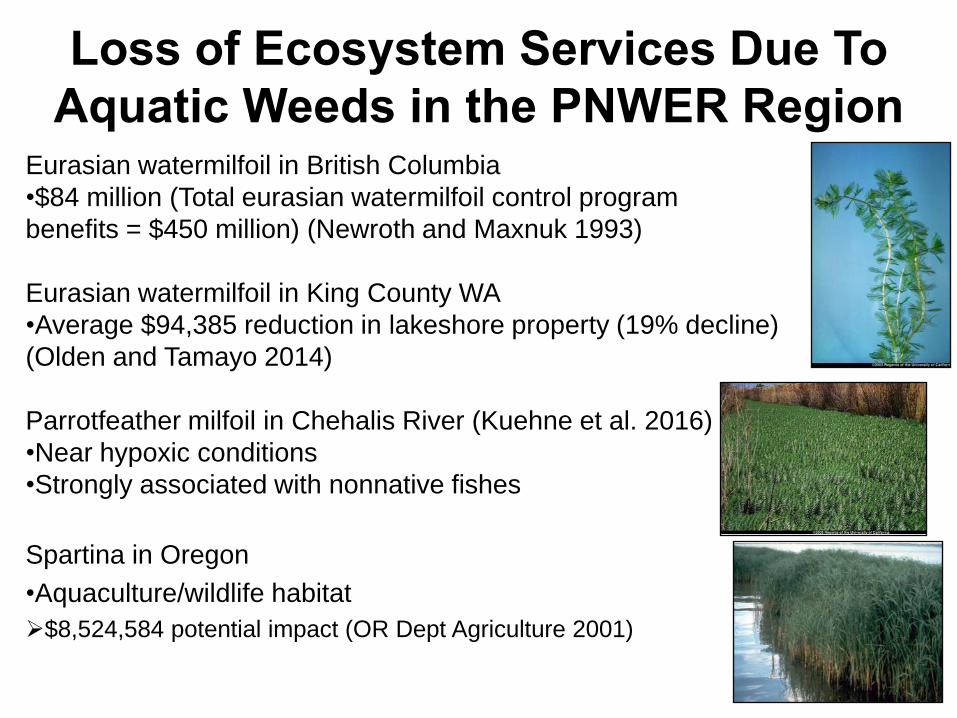
Loss of Ecosystem Services Due To
Aquatic Weeds in the PNWER Region Eurasian watermilfoil in British Columbia
•$84 million (Total eurasian watermilfoil control program
benefits = $450 million) (Newroth and Maxnuk 1993)
Eurasian watermilfoil in King County WA
•Average $94,385 reduction in lakeshore property (19% decline)
(Olden and Tamayo 2014)
Parrotfeather milfoil in Chehalis River (Kuehne et al. 2016)
•Near hypoxic conditions
•Strongly associated with nonnative fishes
Spartina in Oregon
•Aquaculture/wildlife habitat
$8,524,584 potential impact (OR Dept Agriculture 2001)

Loss of Ecosystem Services Due To
Elodea Invasion of Alaska
http://www.fairbanksweeds.org/elodea-photos.php
Luizza et al. 2016. DOI: 10.1007/s00267-016-0692-4
High risk to subsistence harvest of Chinook and whitefish, which make up 24% of
harvest in Athabascan cultural linguistic domain.
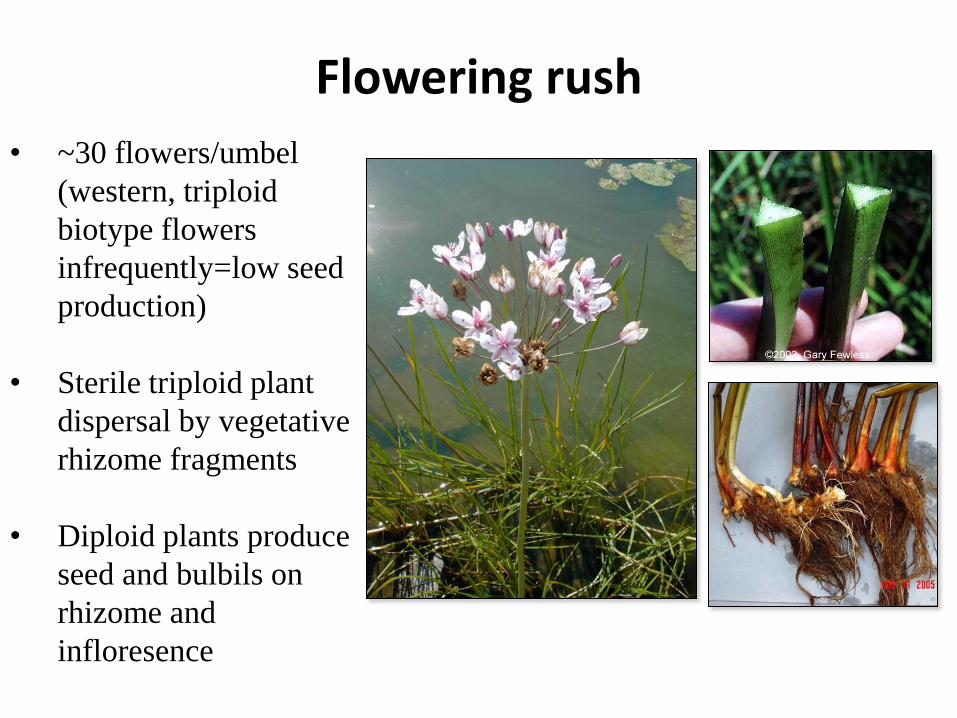
Flowering rush
• ~30 flowers/umbel
(western, triploid
biotype flowers
infrequently=low seed
production)
• Sterile triploid plant
dispersal by vegetative
rhizome fragments
• Diploid plants produce
seed and bulbils on
rhizome and
infloresence

Eurasian Origin
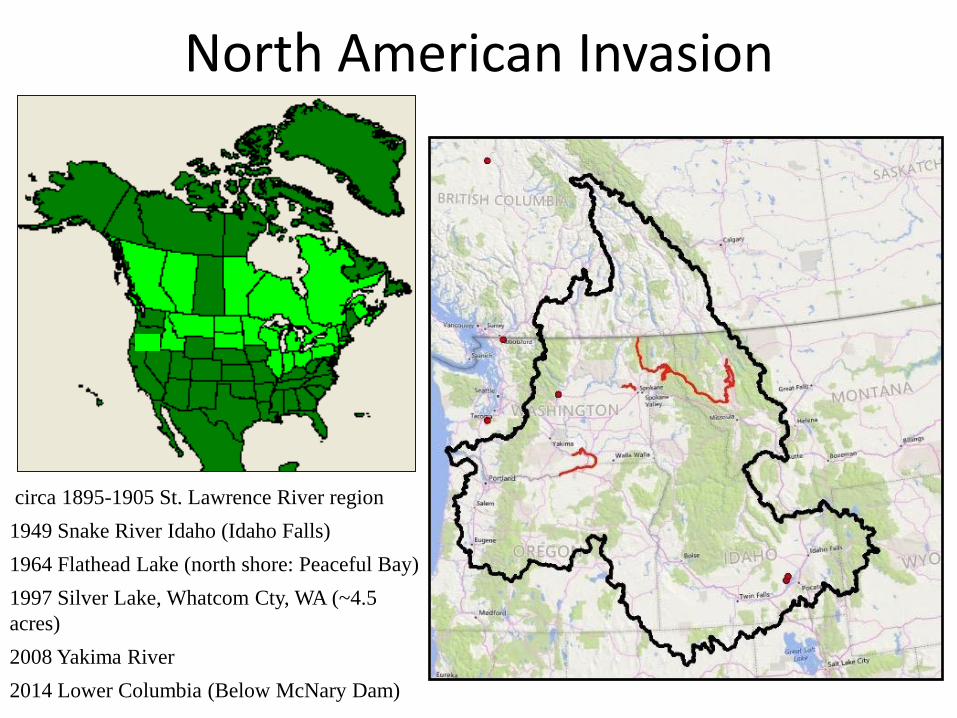
North American Invasion
circa 1895-1905 St. Lawrence River region
1949 Snake River Idaho (Idaho Falls)
1964 Flathead Lake (north shore: Peaceful Bay)
1997 Silver Lake, Whatcom Cty, WA (~4.5
acres)
2008 Yakima River
2014 Lower Columbia (Below McNary Dam)

East Bay, Flathead Lake, MT
Flathead Valley Pablo Reservoir Irrigation Canal
6.7 Million Acres Irrigated by Withdrawals From
Columbia River System
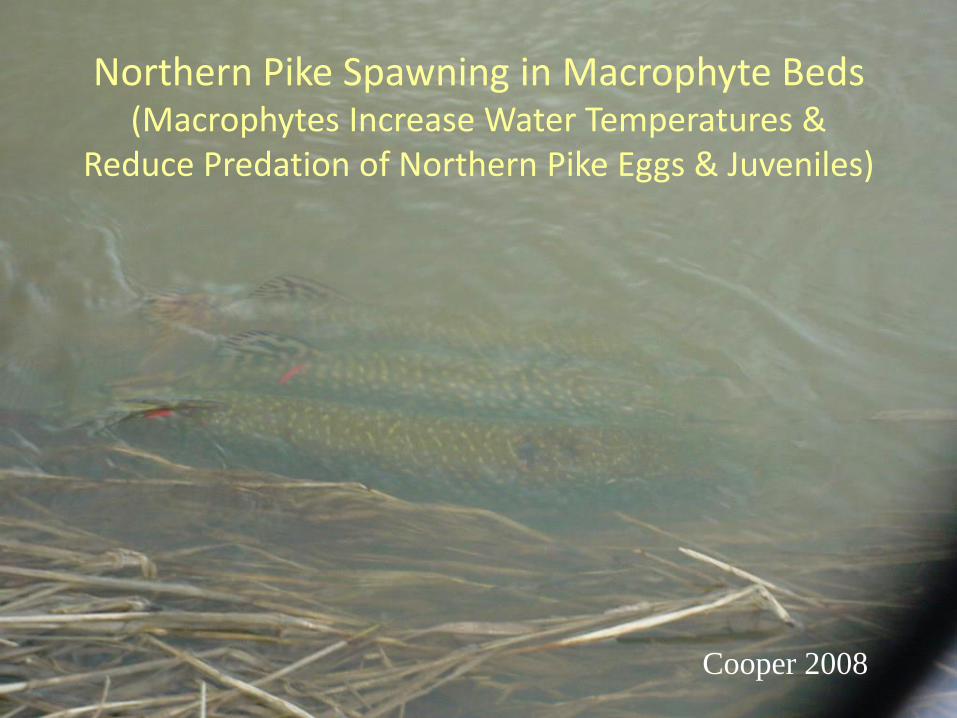
Cooper 2008
Northern Pike Spawning in Macrophyte Beds (Macrophytes Increase Water Temperatures &
Reduce Predation of Northern Pike Eggs & Juveniles)

(Dibble et al 1997)
Native Salmonids Are Open Water Species
Introduced Piscivorous Fish
Are Adapted to Vegetated Habitats

Northern Pike Predation on Salmonids
McMahon & Bennett 1996

Northern Pike Bioenergetics Study
Prey items
Season WCT* BULL**
Winter 686 380
Spring 2,015 2,922
Summer 9,428 0
Fall 1,250 156
Totals 13,379 3,457
Muhlfeld et al. (2008)
Bull Trout & Cutthroats Are Being
Significantly Depredated by
Northern Pike

• There are multiple economic and ecological impacts of invasive aquatic plants
• Management of aquatic plants is complicated
– Invasive plants degrade salmonid habitat
– Presence of T&E salmonids inhibits management
• Management of existing widespread species and management of species with currently limited distribution in the Columbia River Basin requires regional coordination
• The CRB Cooperative Weed Management Area serves this purpose

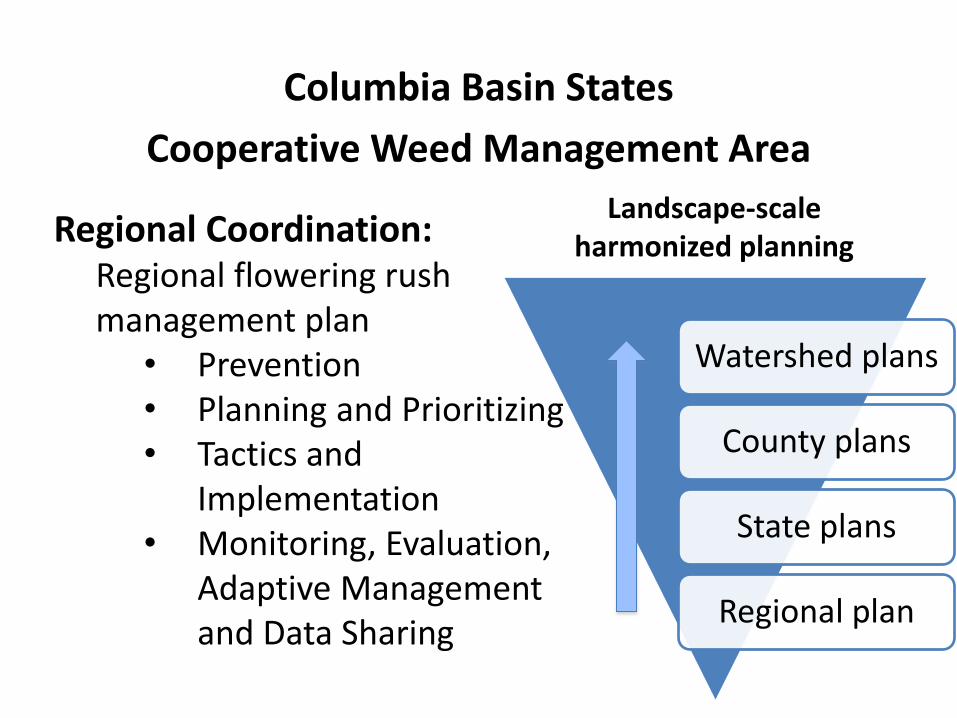
Columbia Basin States
Cooperative Weed Management Area
CWMA Next
Steps
Regional Managem-
ent Plan
Regional Summit
Create CWMA
• National Fish and Wildlife Foundation Pulling Together Initiative Funded
• January 2, 2017 to December 31, 2019
• $65,000 awarded; $66,320 non-federal matching funds
2017
2019

Columbia Basin States
Cooperative Weed Management Area
Outcomes: •Sustainable leadership
• Steering Committee
•Information sharing • Regional Email Listserv • Regional flowering rush
summit
•Regional coordination • Regional management plan

Columbia Basin States
Cooperative Weed Management Area
Steering Committee:

Columbia Basin States
Cooperative Weed Management Area
Information sharing: • Regional Email Listserv
• [email protected] • 58 members
• 2018 Regional flowering rush summit • Location TBD • 1.5 days within
• February 5th to 9th • February 29th to March 2nd
Columbia Basin States
Cooperative Weed Management Area
Regional Coordination: Regional flowering rush management plan
• Prevention • Planning and Prioritizing • Tactics and
Implementation • Monitoring, Evaluation,
Adaptive Management and Data Sharing
Watershed plans
County plans
State plans
Regional plan
Landscape-scale harmonized planning

Willingness to pay to prevent invasive
species problems
• Condition 1
• Delay low impacts 1 year
• Condition 2
• Delay high impacts 1 year
• Condition 3
• Delay high impacts 10 years
US$/household
Source: McIntosh et al. 2010. Ecological Economics
$54 $74 $189
1,533,430 households in Oregon (2011-2015, US Census Bureau)