economic impacts of fusarium head blight in wheat and...
TRANSCRIPT

Agribusiness and Applied Economics Report No 538 July 2004
Economic Impacts of Fusarium Head Blight in
Wheat and Barley: 1993-2001
William E. Nganje, Simeon Kaitibie, William W. Wilson,
F. Larry Leistritz, and Dean A. Bangsund
Department of Agribusiness and Applied Economics ! Agricultural Experiment StationNorth Dakota State University ! Fargo, ND 58105-5636

Acknowledgments
The authors thank the following individuals for providing information about crop lossesdue to FHB: Paul Schwarz, cereal science, NDSU; Marcia McMullen, plant pathologist, NDSU;Terry Gregoire, NDSU area extension specialist/cropping systems, Devils Lake, ND; JochumWiersma, University of Minnesota-Crookston; Roger Jones, University of Minnesota; GregShaner, Purdue University; Frederic L. Kolb, University of Illinois; Patrick Hart, Michigan StateUniversity; and Patrick Lipps, Ohio State University. We thank our colleagues in theDepartment of Agribusiness and Applied Economics for constructive comments: Bruce Dahl,George Flaskerud, and Cole Gustafson. Research assistance provided by Mafany Mongoh andDiomo Motuba is acknowledged. The authors assume responsibility for any remaining errors. This research was funded by the U.S. Wheat and Barley Scab Initiative Grant #59-0790-0-075.
We would be happy to provide a single copy of this publication free of charge. You canaddress your inquiry to: Carol Jensen, Department of Agribusiness and Applied Economics,North Dakota State University, PO Box 5636, Fargo, ND 58105-5636, (Ph. 701-231-7441, Fax701-231-7400), (e-mail: [email protected]) or electronically at:http://agecon.lib.umn.edu/.
NDSU is an equal opportunity institution.
NOTICE:
The analyses and views reported in this paper are those of the author(s). They are not necessarilyendorsed by the Department of Agribusiness and Applied Economics or by North Dakota StateUniversity.
North Dakota State University is committed to the policy that all persons shall have equal accessto its programs, and employment without regard to race, color, creed, religion, national origin, sex, age,marital status, disability, public assistance status, veteran status, or sexual orientation.
Information on other titles in this series may be obtained from: Department of Agribusiness andApplied Economics, North Dakota State University, P.O. Box 5636, Fargo, ND 58105. Telephone: 701-231-7441, Fax: 701-231-7400, or e-mail: [email protected].
Copyright © 2004 by William E. Nganje, Simeon Kaitibie, and William W. Wilson. All rightsreserved. Readers may make verbatim copies of this document for non-commercial purposes by anymeans, provided that this copyright notice appears on all such copies.

Table of ContentsPage
List of Tables . . . . . . . . . . . . . . . . . . . . . . . . . . . . . . . . . . . . . . . . . . . . . . . . . . . . . . . . . . . . . . . . ii
List of Appendix Tables . . . . . . . . . . . . . . . . . . . . . . . . . . . . . . . . . . . . . . . . . . . . . . . . . . . . . . . iii
List of Figures . . . . . . . . . . . . . . . . . . . . . . . . . . . . . . . . . . . . . . . . . . . . . . . . . . . . . . . . . . . . . . . iv
Abstract . . . . . . . . . . . . . . . . . . . . . . . . . . . . . . . . . . . . . . . . . . . . . . . . . . . . . . . . . . . . . . . . . . . . . v
Highlights . . . . . . . . . . . . . . . . . . . . . . . . . . . . . . . . . . . . . . . . . . . . . . . . . . . . . . . . . . . . . . . . . . . vi
1. Introduction . . . . . . . . . . . . . . . . . . . . . . . . . . . . . . . . . . . . . . . . . . . . . . . . . . . . . . . . . . . . . . . . 1
2. Illustration of Price and Quantity Effects . . . . . . . . . . . . . . . . . . . . . . . . . . . . . . . . . . . . . . . . . 2
3. Methodology and Data . . . . . . . . . . . . . . . . . . . . . . . . . . . . . . . . . . . . . . . . . . . . . . . . . . . . . . . 3Estimating ‘Normal’ Production . . . . . . . . . . . . . . . . . . . . . . . . . . . . . . . . . . . . . . . . . . . . 5Estimating Price Impacts for HRS, SRW, and Durum Wheat . . . . . . . . . . . . . . . . . . . . . . 9Adjustment for Imports . . . . . . . . . . . . . . . . . . . . . . . . . . . . . . . . . . . . . . . . . . . . . . . . . . 10Impacts on Wheat Futures and Basis . . . . . . . . . . . . . . . . . . . . . . . . . . . . . . . . . . . . . . . . 12Estimating Price Impacts of Malting and Feed Barley . . . . . . . . . . . . . . . . . . . . . . . . . . 13Estimating Direct and Secondary Revenue Losses Due to FHB . . . . . . . . . . . . . . . . . . . 14Data Sources . . . . . . . . . . . . . . . . . . . . . . . . . . . . . . . . . . . . . . . . . . . . . . . . . . . . . . . . . . 15
4. Results . . . . . . . . . . . . . . . . . . . . . . . . . . . . . . . . . . . . . . . . . . . . . . . . . . . . . . . . . . . . . . . . . . . 16Production Losses Due to FHB . . . . . . . . . . . . . . . . . . . . . . . . . . . . . . . . . . . . . . . . . . . . 16Price Effect Due to FHB . . . . . . . . . . . . . . . . . . . . . . . . . . . . . . . . . . . . . . . . . . . . . . . . . 22Regional Economic Effects . . . . . . . . . . . . . . . . . . . . . . . . . . . . . . . . . . . . . . . . . . . . . . . 26
Direct Economic Impacts . . . . . . . . . . . . . . . . . . . . . . . . . . . . . . . . . . . . . . . . . . . 26Hard Red Spring Wheat . . . . . . . . . . . . . . . . . . . . . . . . . . . . . . . . . . . . . . . . . . . . 26
Durum . . . . . . . . . . . . . . . . . . . . . . . . . . . . . . . . . . . . . . . . . . . . . . . . . . . . . . . . . 26Barley . . . . . . . . . . . . . . . . . . . . . . . . . . . . . . . . . . . . . . . . . . . . . . . . . . . . . . . . . . 29Soft Red Winter Wheat . . . . . . . . . . . . . . . . . . . . . . . . . . . . . . . . . . . . . . . . . . . . 29
Total Direct Impacts . . . . . . . . . . . . . . . . . . . . . . . . . . . . . . . . . . . . . . . . . . . . . . . . . . . . 32Total Economic Impacts . . . . . . . . . . . . . . . . . . . . . . . . . . . . . . . . . . . . . . . . . . . . . . . . . 35
Hard Red Spring Wheat . . . . . . . . . . . . . . . . . . . . . . . . . . . . . . . . . . . . . . . . . . . . 35Durum . . . . . . . . . . . . . . . . . . . . . . . . . . . . . . . . . . . . . . . . . . . . . . . . . . . . . . . . . 35Barley . . . . . . . . . . . . . . . . . . . . . . . . . . . . . . . . . . . . . . . . . . . . . . . . . . . . . . . . . . 36Soft Red Winter Wheat . . . . . . . . . . . . . . . . . . . . . . . . . . . . . . . . . . . . . . . . . . . . 36
Total Direct and Secondary Economic Impacts . . . . . . . . . . . . . . . . . . . . . . . . . . . . . . . 36Economic Impacts by Sector . . . . . . . . . . . . . . . . . . . . . . . . . . . . . . . . . . . . . . . . . . . . . . 39Secondary Employment . . . . . . . . . . . . . . . . . . . . . . . . . . . . . . . . . . . . . . . . . . . . . . . . . . 41
5. Summary and Discussion . . . . . . . . . . . . . . . . . . . . . . . . . . . . . . . . . . . . . . . . . . . . . . . . . . . . 42
References . . . . . . . . . . . . . . . . . . . . . . . . . . . . . . . . . . . . . . . . . . . . . . . . . . . . . . . . . . . . . . . . . . 44
Appendix Tables . . . . . . . . . . . . . . . . . . . . . . . . . . . . . . . . . . . . . . . . . . . . . . . . . . . . . . . . . . . . . 46

ii
List of TablesTable Page
1 Imports From Canada and Estimated U.S. Production Losses from Fusarium Head Blight, HRS and Durum . . . . . . . . . . . . . . . . . . . . . . . . . . . . . . . . . . . . . . . . . . . . . 11
2 Production Losses Due to Fusarium Head Blight by State, Crop, and Year . . . . . . . . . . 21
3a Price Effect for HRS Wheat in Fusarium Head Blight Affected Regions . . . . . . . . . . . . 23
3b Price Effect for Durum Wheat in Fusarium Head Blight Affected Regions . . . . . . . . . . 24
3c Price Effect for SRW Wheat in Fusarium Head Blight Affected Regions . . . . . . . . . . . 25
4 Direct Economic Impacts from Fusarium Head Blight in Hard Red Spring Wheat in theNorthern Great Plains, 1993 through 2001 . . . . . . . . . . . . . . . . . . . . . . . . . . . . . . . . . . . 27
5 Direct Economic Impacts from Fusarium Head Blight in Durum Wheat in the NorthernGreat Plains, 1993 through 2001 . . . . . . . . . . . . . . . . . . . . . . . . . . . . . . . . . . . . . . . . . . . 28
6 Direct Economic Impacts from Fusarium Head Blight in Barley in the Northern GreatPlains, 1993 through 2001 . . . . . . . . . . . . . . . . . . . . . . . . . . . . . . . . . . . . . . . . . . . . . . . . 30
7 Direct Economic Impacts from Fusarium Head Blight in Soft Red Winter Wheat inCentral United States, 1993 through 2001 . . . . . . . . . . . . . . . . . . . . . . . . . . . . . . . . . . . . 31
8 Total Direct Economic Impacts from Fusarium Head Blight, by Crop, in the NorthernGreat Plains and Central United States, 1993 through 2001 . . . . . . . . . . . . . . . . . . . . . . 33
9 Total Direct Economic Impacts from Fusarium Head Blight, by State, in the Northern Great Plains and Central United States, 1993 through 2001 . . . . . . . . . . . . . . 34
10 Total (Direct and Secondary) Economic Impacts from Fusarium Head Blight, by Crop and State, in the Northern Great Plains and Central United States,
1993 through 2001 . . . . . . . . . . . . . . . . . . . . . . . . . . . . . . . . . . . . . . . . . . . . . . . . . . . . . . 37
11 Total (Direct and Secondary) Economic Impacts from Fusarium Head Blight, All Crops, by State, in the Northern Great Plains and Central United States, 1993 through 2001 . . . . . . . . . . . . . . . . . . . . . . . . . . . . . . . . . . . . . . . . . . . . . . . . . . . . . . 38
12 Total (Direct and Secondary) Economic Impacts for Fusarium Head Blight in All Crops,by Economic Sector and Year, Northern Great Plains and Central United States, 1993 through 2001 . . . . . . . . . . . . . . . . . . . . . . . . . . . . . . . . . . . . . . . . . . . . . . . . . . . . . . 40
13 Secondary Employment Losses from Fusarium Head Blight, All Crops, by State in theNorthern Great Plains and Central United States, 1993 through 2001 . . . . . . . . . . . . . . 41

iii
List of Appendix TablesTable Page
A1 HRS Wheat Yield Equation Parameter Estimates, by State . . . . . . . . . . . . . . . . . . . . . . 46
A2 Durum Wheat Yield Equation Parameter Estimates, by State . . . . . . . . . . . . . . . . . . . . . 47
A3 SRW Wheat Yield Equation Parameter Estimates, by State . . . . . . . . . . . . . . . . . . . . . . 48
A4 Barley Yield Equation Parameter Estimates, by State . . . . . . . . . . . . . . . . . . . . . . . . . . 50
A5 Fraction of HRS, Durum, SRW, and Barley Yield and Area Loss Attributable toFusarium Head Blight ("ijt), by Crop Reporting District and Year . . . . . . . . . . . . . . . . . 51
A6 Malting Barley Premium Parameter Estimates by Crop Reporting District . . . . . . . . . . 52
A7 Feed Grain Barley Parameter Estimates by Crop Reporting District . . . . . . . . . . . . . . . 53
iv
List of FiguresFigure Page
1 Change in Crop Value When Net Price Impact Is Positive . . . . . . . . . . . . . . . . . . . . . . . . 2
2 Change in Crop Value When Net Price Impact Is Negative . . . . . . . . . . . . . . . . . . . . . . . 3
3 Crop Reporting Districts Included in HRS Wheat, Durum Wheat, and Barley Study Area . . . . . . . . . . . . . . . . . . . . . . . . . . . . . . . . . . . . . . . . . . . . . . . . . . . . . . . 4
4 Crop Reporting Districts Included in Soft Red Winter Wheat Study Area . . . . . . . . . . . . . . . . . . . . . . . . . . . . . . . . . . . . . . . . . . . . . . . . . . . . . . . . . . . . . 4
5 Predicted, Actual, and Adjusted Yields of Soft Red Winter Wheat for the Illinois WestCrop Reporting District . . . . . . . . . . . . . . . . . . . . . . . . . . . . . . . . . . . . . . . . . . . . . . . . . . . 6
6 Predicted, Actual, and Adjusted Yields of Hard Red Spring Wheat for the North DakotaNorth East Crop Reporting District . . . . . . . . . . . . . . . . . . . . . . . . . . . . . . . . . . . . . . . . . . 7
7 Predicted, Actual, and Adjusted Yields of Durum Wheat for the North Dakota North EastCrop Reporting District . . . . . . . . . . . . . . . . . . . . . . . . . . . . . . . . . . . . . . . . . . . . . . . . . . . 7
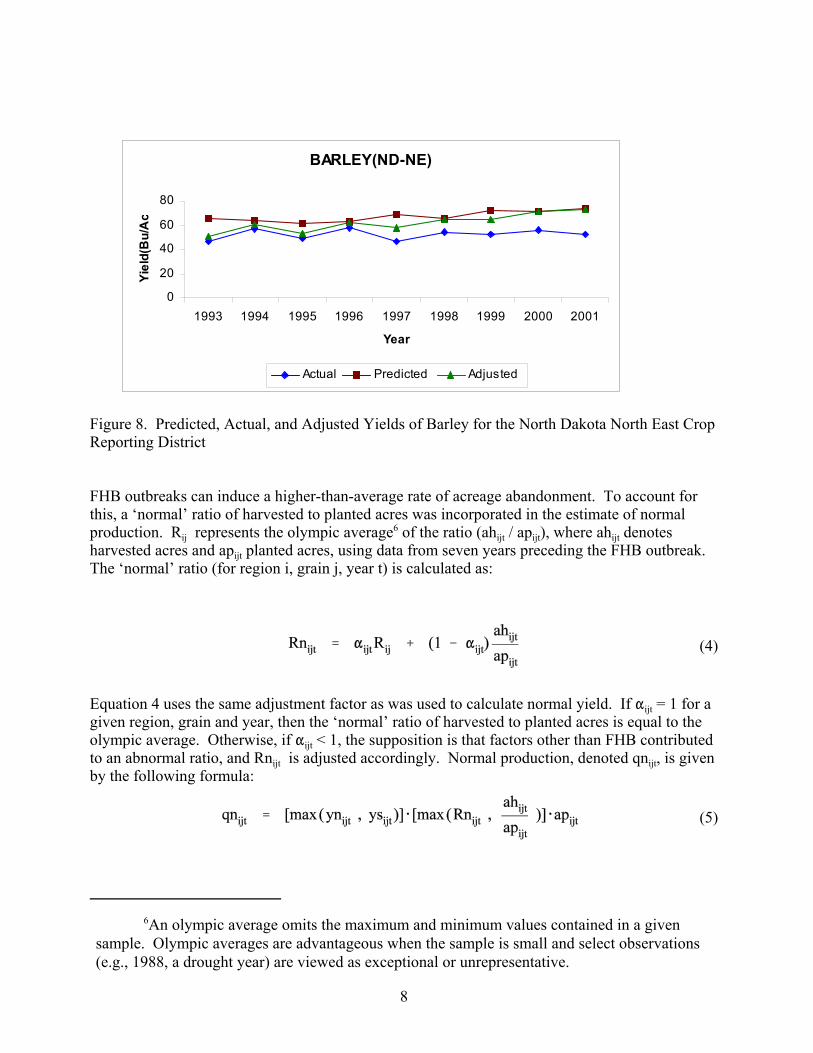
8 Predicted, Actual, and Adjusted Yields of Barley for the North Dakota North East CropReporting District . . . . . . . . . . . . . . . . . . . . . . . . . . . . . . . . . . . . . . . . . . . . . . . . . . . . . . . 8
9 Distribution of Soft Red Winter Wheat Total Production Losses ($) for all CropReporting Districts and Years . . . . . . . . . . . . . . . . . . . . . . . . . . . . . . . . . . . . . . . . . . . . . 17
10 Distribution of Hard Red Spring Wheat Total Production Losses ($) for all CropReporting Districts and Years . . . . . . . . . . . . . . . . . . . . . . . . . . . . . . . . . . . . . . . . . . . . . 18
11 Distribution of Durum Wheat Total Production Losses ($) for all Crop ReportingDistricts and Years . . . . . . . . . . . . . . . . . . . . . . . . . . . . . . . . . . . . . . . . . . . . . . . . . . . . . . 19
12 Distribution of Barley Total Production Losses ($) for all Crop Reporting Districts andYears . . . . . . . . . . . . . . . . . . . . . . . . . . . . . . . . . . . . . . . . . . . . . . . . . . . . . . . . . . . . . . . . 20

v
Abstract
Fusarium Head Blight (FHB), commonly known as scab, has been a severe problem forwheat and barley producers since 1993. This study provides an update of economic lossessuffered by wheat and barley producers in scab-affected regions in the United States. Emphasisis placed on estimating direct and secondary economic impacts of yield and price losses sufferedby wheat and barley producers from 1993 to 2001. Nine states are included in the analysis forthree wheat classes. Three of the nine states were also used for the analysis of malting and feedbarley. The cumulative direct economic losses from FHB in hard red spring (HRS) wheat, softred winter (SRW) wheat, durum wheat, and barley are estimated at $2.492 billion from 1993through 2001. The combined direct and secondary economic losses for all the crops wereestimated at $7.7 billion. Two states, North Dakota and Minnesota, account for about 68 percentof the total dollar losses.
Key Words: Fusarium Head Blight, scab, vomitoxin, crop losses, wheat, barley

vi
Highlights
This study provides an update of economic losses suffered by wheat and barley producersin scab-affected regions in the United States from 1993 through 2001. Wheat and barleyproducers in several states have experienced significant yield losses due to Fusarium HeadBlight (FHB), or scab, since 1993. Losses have been especially severe in the spring wheat andbarley regions, but soft red winter (SRW) wheat producers have also experienced majoroutbreaks. Three wheat classes, malting and feed barley were included in the analysis for ninestates in the United States.
Losses were calculated as the decline in producer revenue due to FHB in affected cropdistricts. This entails estimating production losses (bushels) as well as the impact of FHB on netprices ($/bushel) received by producers. The price impact of FHB can be either positive ornegative, as a production shortfall puts upward pressure on market prices while, at the sametime, a larger share of production may be discounted for poor quality. The average pricereceived by producers in a given region can, therefore, be lower than normal despite favorablequoted prices for benchmark grades.
Production losses were estimated for each Crop Reporting District (CRD) by comparingactual yields to regression forecasts. Adjustments (based on input from extension specialists)were made to account for the contribution of other factors to yield shortfalls. The analysis alsoconsiders the impact of FHB on the ratio of harvested to planted acres. Price impacts wereestimated for both futures and basis. Regression models were used to quantify the (positive)impact of FHB-related supply reductions on futures prices. Impacts on basis (either positive ornegative) were measured by comparing actual basis values in a scab year to historical averages.
The direct combined effects of price discounts and yield reductions from FHB in hard redspring (HRS) wheat, SRW wheat, durum wheat, and barley were estimated at $2.492 billionfrom 1993 through 2001. Direct economic losses over the period were greatest for HRS wheat($1.261 billion), followed by SRW wheat ($589 million) and barley ($484.7 million). Losses fordurum wheat were estimated at $156 million. Combined losses with the four crops were greatestin 1998 ($467 million) and lowest in 2000 ($159 million). Losses in 1998 accounted for about19 percent of the nine-year total.
Despite a significant decrease in direct economic losses from FHB in 2000, cumulativeeconomic effects over the period 1993 to 2001 were substantial. The cumulative direct losses of$2.492 billion represent a substantial loss in crop revenue for small grain producers in theaffected areas. To put the losses in perspective, the average annual value of all winter wheatproduction in the United States from 1993 through 2001 was about $5.1 billion. The averageannual losses from FHB over the same period for all crops in this study was estimated at $277million. Thus, annual losses from FHB represented, on average, 5.4 percent of the total value ofall U.S. winter wheat production. When compared to the annual value of all wheat (spring,winter, durum, and other) production in the United States over the same period, annual lossesfrom FHB represented 3.7 percent of the U.S. total.
The combined direct and secondary economic losses for all crops were estimated at $7.7billion. North Dakota had $3.5 billion or about 45 percent of those losses during the period 1993to 2001. Losses in other states were not as large, but substantial losses still occurred in

vii
Minnesota ($1.8 billion), South Dakota ($620 million), Ohio ($606 million), Illinois ($514million), Missouri ($297 million), Michigan ($195 million), Indiana ($133 million) andKentucky ($69 million).
Scab remains a major economic problem, whether measured in relative terms to othercrop sales or measured by overall direct and secondary economic impact. The scab problem isnot limited to a narrow geographic region, adversely impacting producers in both the northernGreat Plains and central states. Scab continues to affect several classes of wheat and barley,constituting a serious economic problem in several regions of the United States.
Impacts from scab affect not only producers, but other areas of the economy as well. Asubstantial portion of the impacts affect the businesses that are dependent upon revenues fromcrop sales (for every $1 dollar of scab losses incurred by the producer, $2.08 in losses areincurred in other areas of rural and state economies). Depressed farm economies are furtheraffected by scab. Scab occurs in many regions of the northern Great Plains that are not onlyreliant on agriculture, but are predominately dependent upon small grain production. Thus, scabis having an extenuating effect in those areas. Furthermore, income losses from scab areoccurring during periods of depressed farm prices and low net farm income. (Net farm incomehas decreased significantly since 1996.)
The level of impacts (magnitude), the relative impact (comparisons to wheat/other smallgrain sales), and the geographic size of the problem all suggest that continued research intodeveloping scab resistant varieties of wheat and barley is warranted. Clearly, expenditures onscab research would be easily offset by future benefits of a reduction in scab losses.

*Nganje is an assistant professor, Kaitibie is research assistant professor, Wilson andLeistritz are professors, and Bangsund is research scientist in the Department of Agribusinessand Applied Economics, North Dakota State University, Fargo.
1See McMullen, Jones, and Gallenberg (1997) for an overview of FHB in small grains.
2Michigan also produces white wheat; however, this is not differentiated from SRWwheat in state-level price data.
Economic Impacts of Fusarium Head Blight in Wheat and Barley: 1993-2001
William E. Nganje, Simeon Kaitibie, William W. Wilson, F. Larry Leistritz, and Dean A. Bangsund*
1. Introduction
Fusarium Head Blight (FHB), commonly known as scab, has been a severe problem forU.S. wheat and barley producers since 1993 (Johnson et al. 1998). Yield losses due to FHB havebeen widely reported.1 Johnson et al. (1998) and the U.S. General Accounting Office (U.S.GAO 1999) quantified the economic losses suffered by producers in scab affected regions,from1993-1997 for wheat and barley, respectively. The objective of this study is to update thework of Nganje et al (2001), Johnson et al. and the U.S. GAO (1999) for 1993-2001 and, inaddition, assess the secondary impact of losses incurred in other sectors of the economy.
The study focused on nine states where substantial FHB outbreaks have occurred duringthe 1990s, involving three wheat classes and barley. The affected states for hard red spring(HRS) wheat, durum wheat, and barley include Minnesota, North Dakota, and South Dakota. For soft red winter (SRW) wheat, the affected states include Illinois, Indiana, Kentucky,Michigan,2 Missouri, and Ohio. In these states, major yield losses began in 1993 and continuedthrough 2001.
Direct and secondary losses due to FHB by Crop Reporting District (CRD) for eachwheat class and barley were estimated. Estimation of the direct impact (first-round effects)entails two quantities: first, the production (bushels) that might have been expected under normalconditions, and second, the price ($/bushel) that might have been expected under normalconditions. The ‘price effects’ of FHB are an important component of the analysis, as these caneither magnify or reduce the value of economic losses in individual regions. Secondary impacts(sometimes further categorized into indirect and induced effects, also known as multipliereffects) result from subsequent rounds of spending and re-spending within an economy. Aninput-output model developed by Coon and Leistritz (2000) was used to estimate the secondary(multiplier) and total economic effects of FHB in the affected states.
The paper is organized into five sections including the introduction. Section 2 provides abrief explanation of the conceptual approach and delineates the ‘price’ and ‘quantity’ effects ofFHB. Methodology and data sources are described in Section 3. Estimates of direct andsecondary economic loss by state, year, wheat class, and barley are presented in Section 4. Thepaper concludes with a short summary and discussion of implications.

2
quantity
price
qnqs
psA B
C D
pn
2. Illustration of Price and Quantity Effects
The following illustration of price and quantity effects is based on Johnson et al. (1998).To estimate the change in producer revenue due to FHB, it is not sufficient to know the size of aproduction shortfall; the impact on prices received must also be estimated. In principle, scab caneither raise or lower the net price received by producers. This depends on two opposing factors. A production shortfall puts upward pressure on futures prices and can lead to higher premiumsfor protein and other quality factors. In addition, in scab-affected areas, a larger share ofproduction is discounted for poor quality. As a result, the price received by producers can belower than normal despite favorable quoted prices for benchmark grades.
Figures 1 and 2 provide an illustration of the potential impacts of FHB on producerrevenue. In Figure 1, it is assumed that the price received by producers is higher than normal asa result of FHB-related production shortfalls. Thus, ps > pn, where ps and pn are prices in ‘scab’and ‘normal’ years. The production shortfall is measured by (qn ! qs), where qn is normalproduction, based on planted acreage and trend yields, and qs is the actual production in a scabyear. The change in producer revenue due to scab is given by
)R = (ps × qs) ! (pn × qn) (1)
Producer revenue in a scab year is given by areas A + C, while producer revenue in a normalyear is given by areas C + D. The change in revenue is A ! D. Thus, producers would gainrevenue if the positive price impact more than offsets the value of lost production (i.e., if A > D).
Figure 1. Change in Crop Value When Net Price Impact Is Positive

3
quantity
price
qnqs
psE F
G H
pn
In Figure 2, it is assumed that the net price received by producers is lower than normalbecause of scab-related quality problems. Producer revenue in a scab year is given by area G,while producer revenue in a normal year is given by the area (E + F + G + H). The change inrevenue is ! (E + F + H), a negative amount. Producers lose two ways, from productionshortfalls and lower prices.
Figure 2. Change in Crop Value When Net Price Impact Is Negative
The revenue impact can be divided into separate price and quantity effects. Estimates ofthese effects vary, depending on whether actual prices (ps) or normal prices (pn) are used tovalue production shortfalls; the choice is somewhat arbitrary. In this study, we value productionshortfalls as the average of the two prices. That is the area F in Figure 2 divided equally betweenprice and quantity effects. Thus, the price effect equals ! (E + ½F) while the quantity effectequals ! (½F + H). Similarly, when the net price effect is positive as in Figure 1, it is measuredas (A + ½B), while the quantity effect is ! (½B + D).
3. Methodology and Data
Crop Reporting Districts (CRDs) where substantial FHB outbreaks occurred during the1990s were identified with the help of researchers and extension specialists. The study area forSRW wheat, spring wheat, durum wheat, and barley are shown in Figures 3 and 4.
To estimate the economic losses due to FHB in a given CRD, the value of productionunder ‘normal’ conditions was estimated (i.e., if there had been no outbreak). Normal crop valueis the product of two variables: pn, the price that farmers would have received, and qn, theirexpected production in absence of scab. For years of scab outbreak, both variables areunobserved and must be estimated. The lost crop value is then calculated as the differencebetween actual and normal crop value.

4
SE
C EC
NC NE
NW
CNC NE
C
WC
SW SC SE
E
NE
W
W SWESE
SWSE
PURMW
NE
C
SWSC
SE
NW NCNE
W C C
C EC
\SWSC SE
Figure 3. Crop Reporting Districts included in HRS Wheat, Durum Wheat, and Barley StudyArea
Figure 4. Crop Reporting Districts Included in Soft Red Winter Wheat Study Area

3For HRS and durum wheat growing areas, rainfall and temperature data are for Aprilthrough July. For SRW wheat growing areas, these data are for March through June.
4Data from 1970-92 were used to estimate yield models for HRS, durum wheat, andbarley. Data for 1970-90 were used for SRW yield models. A restricted and an unrestrictedmodel were estimated for Equation 2. The unrestricted model incorporated a squareprecipitation term because there is an optimal level of precipitation, beyond which yields maydecrease. However, only the barley model was unrestricted, Equation 2 was the robust model forHRS, durum, and SRW (Appendix Table A4).
5Input from extension experts for all CRDs were requested to obtain data on thedifference between normal and actual production that was due to scab. For barley, this data iscollected annually for North Dakota, Minnesota, and South Dakota by Dr. Paul Schwarz of the NDSU Cereal Science Department.
5
Estimating ‘Normal’ Production
Estimated normal production is comprised of yield and harvested acres. To derive yield inthe absence of FHB, the following regression model was used:
(2)
where yfijt is expected harvested yield (or forecasted yield) for grain j in region i, Rijt is rainfallinches received during the growing season,3 Tijt is average temperature during the growing season,t is the year, and e is the error term. The last parameter ($3) is a measure of trend yield growthcaused by changes in technology, input use, and farm size. Separate equations were estimated foreach CRD, using data for years preceding severe FHB outbreak.4 Results of estimatedcoefficients–$s and model fitness are shown in Appendix Tables A1 to A4. Regression modelswere then used to derive estimates of the yields that would have occurred in later years (givengrowing conditions) in the absence of FHB.
A complicating factor was that, in some producing regions, FHB occurred simultaneouslywith other wheat diseases or in conjunction with other factors reducing yields (e.g., floods). Itwould be misleading to attribute all of the estimated yield shortfall in these regions to FHB. Forthat reason, researchers and extension specialists provided input about the relative contribution ofscab to yield shortfalls.5 Their judgments were incorporated as follows. Let ynijt denote thenormal yield in absence of FHB in production region i and year t. Let yfijt denote the forecastvalue from the regression equation and ysijt the actual yield in a scab-affected year. The fractionof a yield shortfall attributable to scab is denoted "ijt (0#"ijt#1). Normal yields (i.e., theestimated yields that would have occurred in the absence of FHB) are given by
(3)
Normal yield is a weighted average of the regression forecast and actual yield. If "ijt = 1 for agiven region and crop year, then normal yield equals the forecast value, and any estimated yield

6
SRW(IL-W)
0
20
40
60
80
1993 1994 1995 1996 1997 1998 1999 2000 2001
Year
Yiel
d (b
u/ac
Actual Predicted Adjusted
shortfall (yfijt ! ysijt) is attributed entirely to FHB. If "ijt < 1, then normal yield lies between theregression forecast and actual yield, and part of the estimated yield shortfall is attributed to otherfactors. For example, suppose the yield forecast (yfijt) is 40 bu/acre, actual production (ysijt) is 28bu/acre, but only 80 percent of the shortfall is attributed to FHB. The (adjusted) normal yield isthen calculated as ynijt = 0.8 × (40) + (1! 0.8) × (28) = 37.6 bu/acre.
Figures 5, 6, 7, and 8 show actual yield, forecasted yield, and the (adjusted) normal yieldfor four CRDs included in the study. Figure 5 shows SRW wheat yields in western Illinois (SRWIL - W), Figure 6 shows HRS wheat yields in north-east North Dakota (HRS ND-NE), Figure 7shows durum wheat yields in north-east North Dakota (Durum ND-NE), and Figure 8 showsbarley yields in north-east North Dakota (Barley ND-NE). For SRW and Durum, 1998 and 1999predicted and adjusted yields in the respective CRDs coincided, hence the estimated yieldshortfalls are attributable to FHB (i.e., "ijt= 1). For HRS yields in northeastern North Dakota (ND- NE), only a small fraction of the yield shortfall was attributable to FHB in 1999, hence the lowadjustment factor of "ijt = 0.037. Adjustment factors for all producing regions are provided inAppendix Table A5.
Figure 5. Predicted, Actual, and Adjusted Yields of Soft Red Winter Wheat for the Illinois WestCrop Reporting District

7
HRS(ND-NE)
0102030405060
1993 1994 1995 1996 1997 1998 1999 2000 2001
Year
Yiel
d(B
u/A
c
Actual Predicted Adjusted
DURUM(ND-NE)
01020304050
1993 1994 1995 1996 1997 1998 1999 2000 2001
Year
Yiel
d(B
u/A
c
Actual Predicted Adjusted
Figure 6. Predicted, Actual, and Adjusted Yields of Hard Red Spring Wheat for the North DakotaNorth East Crop Reporting District
Figure 7. Predicted, Actual, and Adjusted Yields of Durum Wheat for the North Dakota NorthEast Crop Reporting District
6An olympic average omits the maximum and minimum values contained in a givensample. Olympic averages are advantageous when the sample is small and select observations(e.g., 1988, a drought year) are viewed as exceptional or unrepresentative.
8
BARLEY(ND-NE)
0
20
40
60
80
1993 1994 1995 1996 1997 1998 1999 2000 2001
Year
Yiel
d(B
u/A
c
Actual Predicted Adjusted
Figure 8. Predicted, Actual, and Adjusted Yields of Barley for the North Dakota North East CropReporting District
FHB outbreaks can induce a higher-than-average rate of acreage abandonment. To account forthis, a ‘normal’ ratio of harvested to planted acres was incorporated in the estimate of normalproduction. Rij represents the olympic average6 of the ratio (ahijt / apijt), where ahijt denotesharvested acres and apijt planted acres, using data from seven years preceding the FHB outbreak. The ‘normal’ ratio (for region i, grain j, year t) is calculated as:
(4)
Equation 4 uses the same adjustment factor as was used to calculate normal yield. If "ijt = 1 for agiven region, grain and year, then the ‘normal’ ratio of harvested to planted acres is equal to theolympic average. Otherwise, if "ijt < 1, the supposition is that factors other than FHB contributedto an abnormal ratio, and Rnijt is adjusted accordingly. Normal production, denoted qnijt, is givenby the following formula:
(5)

7Basis is defined as the difference between a local cash price and the futures price, for thesame commodity. As used here, basis refers to the difference between weighted average cashprice received (net of premiums and discounts) and average futures price, during a marketingyear.
9
The first bracketed term represents harvested yield. The second bracketed term is the ratio ofharvested-to-planted acres. The product of the second term and acres planted (apijt) equals normalharvested acres. The max function is used to correct for two types of data anomalies. If theestimated normal yield falls below actual yield in a scab year (i.e., ynijt < ysijt), the latter value isselected. Similarly, if the normal ratio falls below the actual ratio of harvested-to-planted acres(i.e., Rnijt < [ahijt / apijt]), the latter value is used. Thus, in the unlikely event that production ishigher than normal during a scab year, the analysis will not (falsely) attribute a positive impact tothe disease.
Estimating Price Impacts for HRS, SRW, and Durum Wheat
In estimating the impact of FHB on the net price received by producers, two factors wereconsidered. First, the impact of a production shortfall on market prices was estimated. Second,the effects of crop quality on prices were considered. To capture these effects, the average pricereceived was divided into futures and basis.7 While FHB outbreak is expected to have a positiveimpact on futures (by reducing wheat supply), the impact on local basis (averaged over all wheatsold) can be either positive or negative, depending on crop quality and the premiums anddiscounts assessed by elevators in a given region.
SRW wheat is priced with respect to wheat futures on the Chicago Board of Trade (CBT). To derive the price impact of FHB on CBT wheat futures, a regression equation was used. Theregression analysis explains the CBT futures price as a function of total wheat supply and the loanrate (a farm program parameter), using annual data from 1980 through 1999. The estimatedequation follows, with t-values in parentheses:
LCBT = 13.250 ! 1.004 LTWS + 0.211 LLR R2 = .67 (8.996)* (!4.004)* (2.116)* Obs. 20
* significant at 1% levelVariables are defined as:
LCBT logarithm of average CBT wheat futures price (c/bu), nearby contracts LTWS logarithm of total U.S. wheat supply (million bu), all classesLLR logarithm of loan rate for wheat (c/bu) in given marketing year.
The coefficient of interest is that which describes the relationship between future prices and totalwheat supply (otherwise known as the ‘flexibility’ coefficient). In this case, a 1 percent change intotal wheat supply would change the CBT price by 1.004 percent (in the opposite direction).
A similar equation was estimated for wheat futures on the Minneapolis Grain Exchange(MGE), which provides the futures price for HRS wheat. In this case, HRS supply (in place oftotal wheat supply) was used as an explanatory variable. For MGE futures, the estimatedequation follows, with t-ratios in parentheses:

8HRS is a U.S. classification; the comparable Canadian wheat classification is CanadianWestern Red Spring (CWRS).
10
LMGE = 9.115 ! 0.836 LHRS + 0.112 LLR R2 = .59 (7.121)* (!4.055)* (2.334)** Obs. 20
* significant at 1% level** significant at 5%
Variables are defined as:
LMGE logarithm of average MGE wheat futures price (c/bu), nearby contracts LHRS logarithm of HRS wheat supply (million bu), defined as the sum of
production, stocks and importsLLR logarithm of loan rate for wheat (c/bu) in given marketing year.
The ‘flexibility’ coefficient is !0.836, indicating that a 1 percent change in the supply of HRSwheat is expected to change the MGE futures price by 0.836 percent in the opposite direction.
Adjustment for Imports
If U.S. wheat supplies were determined solely by domestic production and beginningstocks, the change in supplies due to scab would be equal to the sum of estimated productionshortfalls in affected CRDs. However, imports of wheat from Canada represent anothercomponent of U.S. supply. Canada is a large surplus producer of spring wheat (HRS8 anddurum), and the surge in U.S. imports since 1993 is partly explained by disease problems in theU.S. spring wheat region (Johnson et al. 1998). Higher imports offset part of U.S. productionshortfalls, thereby changing U.S. supply and reducing the positive impact of U.S. productionshortfalls on futures prices.
To account for imports induced by scab, it was assumed that 20 million bushels of HRSwheat would be imported annually from Canada under ordinary conditions, which is the averagelevel of HRS imports during the three marketing years preceding 1993. Imports of durum werelarger than estimated production shortfalls from 1993 to 2001. However, imports of HRS wheatwere lower than estimated production shortfalls in 1993-1995 and in 1997, but exceededestimated production shortfalls in 1996, and from 1998 to 2001 (Table 1). Of the importsexceeding 20 million bushels, the part that is attributed to scab is reflected in the followingformula for expected HRS supply in absence of a scab outbreak:
(6)

9For 1998-2000, values of 2tHRS are 0.5317, 0.112, and 0.2092.
11
where variables are defined
Qnt HRS hypothetical supply (million bushels) of HRS wheat in absence of scab
outbreakQst
HRS actual supply of HRS during year of scab outbreak*t
HRS estimated U.S. production shortfall of HRS wheat due to scab 2t
HRS proportion of production losses due to scab, a weighted average ofadjustment factors " it in HRS regions9
Mt HRS actual imports of HRS wheat.
The quantity selected by the min function (Equation 6) represents imports attributable to scab, partially offsetting the impact of a production loss on U.S. HRS supply. The hypothetical supplyof all wheat in absence of scab, Qnt
ALL, is calculated as:
(7)
where QstALL is the actual U.S. supply of all wheat classes and *t
SRW is the estimated SRW production shortfall due to scab. Note that Qnt
ALL reflects the production shortfall for SRW andsupply reduction for HRS; it does not reflect reduced durum production. Based on recent history,any lost U.S. durum production was assumed to be entirely offset by imports from Canada.
Table 1. Imports From Canada and Estimated U.S. Production Losses from Fusarium HeadBlight, HRS and Durum
Imports from Canada(million bu)
Estimated U.S. ProductionLosses (million bu)
Ratio of Imports toLosses
Marketing Year HRSWheat
DurumWheat
HRSWheat
DurumWheat
HRSWheat
DurumWheat
1993
1994
1995
1996
1997
1998
1999
2000
2001
62.0
49.0
30.0
53.0
54.0
58.2
54.5
52.0
50.0
30.0
22.0
18.0
24.0
26.0
25.9
23.7
25.1
21.1
119.6
90.4
47.0
23.5
63.5
8.4
5.8
9.4
27.5
10.2
4.0
6.4
8.4
4.4
0.7
4.0
4.6
2.9
0.5
0.5
0.6
2.3
0.9
6.9
9.4
5.5
1.8
2.9
5.5
2.8
2.9
5.9
37.0
5.9
5.5
7.3

10The price flexibility coefficient is defined: ( = ()P/P)/ ()Q/Q). The formula is derivedby substituting (Fs ! Fn)/Fn for the numerator, (Qs ! Qn)/Qn for the denominator, and re-arranging to solve for Fn.
11Approximately a 50 cents/bushel price premium is necessary to induce farmers to plantdurum instead of HRS wheat, given differences in yield and risk factors.
12
Impacts on Wheat Futures and Basis
Given the flexibility coefficients and supply estimates, the futures prices that would havebeen observed in the absence of a scab outbreak are estimated as follows:10
(8)
where j indicates the futures exchange (MGE or CBT) or appropriate supply definition, andvariables are defined:
(j price flexibility coefficient (for indicated futures supply category)Qst
j actual wheat supply (HRS wheat for MGE futures, all wheat classes for CBT)Qnt
j estimated supply in absence of scab outbreakFst
j futures price (annual average, nearby contracts) in a scab yearFnt
j estimated futures price in absence of scab outbreak.
For SRW wheat growing regions, basis is defined as the difference between the averageprice received by producers and the average CBT futures. For HRS growing regions, basis is thedifference between average price received and average MGE futures. Normal basis relationshipsfor these wheat classes are represented by seven-year olympic averages, using data from yearspreceding the first scab outbreak.
Durum wheat was not traded on any futures exchange during the period under study. However, a long-term relationship exists between durum and spring wheat cash prices–durumtends to trade at about 50 cents/bushel above the spring wheat price.11 The long-term pricerelationship between durum and HRS was built into the estimate of the ‘normal’ cash price fordurum.
Expected cash prices in absence of scab are calculated as follows:
(9)

12 The U.S. GAO procedure was used to estimate the impact of FHB on malting premiumprice and feed barley price because it incorporates the proportion of malting and feed barleyproduction in the absence of FHB. These proportions were necessary to estimate the shift ofmalting barley to feed barley due to FHB.
13Appendix Tables A6 and A7 provide regression equations for the CRDs in NorthDakota.
13
where variables are defined: pnit normal (expected) cash price in absence of scab for indicated wheat classFnt
C Chicago wheat futures price (annual average)Fnt
M Minneapolis spring wheat futures price (annual average)bni
C normal (olympic average) SRW basis relative to CBT futuresbni
M normal (olympic average) HRS basis relative to MGE futures.
The analysis allows estimated basis effects to be either positive or negative in individual regions. Positive basis effects could arise because of large price premiums, induced by supply shortages,for wheat that meets milling specifications. Conversely, negative basis effects could result ifquality-related price discounts apply to a larger-than-average portion of local production.
Estimating Price Impacts for Malting and Feed Barley
In estimating the impact of FHB on the net price received by barley producers, two factorswere considered–the impact on malting premium price, and the impact on feed grain prices.12 Theprocedure to estimate both malting barley premiums and feed grain prices for 1993 through 2001,had there been no FHB, uses two steps (U.S. GAO 1999)–step one involves estimating priceequations for both malting barley premiums and feed prices in the absence of scab, while step twoinvolves predicting the malting and feed barley prices that should have been obtained in theabsence of the FHB epidemic.13
In step one, regression analysis and historical data on price and production from 1959through 1992 was used. Since the proportion of malting barley in the entire crop was fairly stablein the years prior to the FHB epidemic, increases in total barley production translate intoincreases in quantities of malting barley. Moreover, while there are differences in premiums fromregion to region, prices are generally transmitted from the malting and brewing industries at amore aggregate market level. Therefore, in Equation 10, the historical association betweenmalting premiums, Pjm, and total U. S. barley production, Qj, for each CRD analyzed wereestimated.
(10)Pjm
0 1Q j= +α α
A negative and statistically significant relationship exists between malting barleypremiums and total barley production at the national level for all CRDs (Appendix Table A1). Other variations of this regression model, including those using combinations of stocks as well asbarley yields for independent variables, did not perform as well as the total barley production

14The Yule-Walker regression technique starts by forming the ordinary least-squareestimate of parameters. Next, given the vector of auto-regressive parameters (using the Yule-Walker equations) and the variance matrix of the error vector, efficient estimates of theregression parameters are computed using generalized least squares.
14
variable. Because of the presence of positive serial correlation in all CRDs, the Yule-Walker14
regression technique is used to derive the parameter estimates. In general, serial correlationcauses standard errors to be biased downward, thus indicating that parameter estimates are moreprecise than indicated. Therefore, correcting this problem leads to more efficient parameterestimates.
In the feed grain market, corn is the primary feed grain product accounting for more than80 percent of total feed grain consumption (U.S. GAO 1999). Because barley feed grain prices,Pi
f, are driven primarily by corn prices, in Equation 11, the historical association between feedgrain barley prices, the price of corn, PC, and total U.S. barley production, Qj, was specified as:
(11)Pjf
0 1Pc 2Q j= + +α α α
To correct for first-order serial correlation, as in the malting premium regression models,the Yule-Walker regression technique was used for the feed grain models. The total barleyproduction variable for North Dakota was negative and significant at the 0.10 percent level in allCRDs except 6 (Appendix Table A6). In all CRDs, the price of corn was positively related tobarley feed grain prices and statistically significant (Appendix Table A7).
The second step involved substituting actual values of barley production and corn pricesfor years 1993 through 2001, in Equations 10 and 11, to predict what malting barley and feedgrain barley prices would have been in the absence of FHB. Malting barley prices were the sumof estimated feed grain prices and estimated malting premiums. The malting barley and feedgrain barley price effects as a result of FHB were obtained by subtracting the actual prices fromthe estimated prices in the absence of scab.
Estimating Direct and Secondary Revenue Losses Due to FHB
Economic activity from a project, program, policy, or event can be categorized into directand secondary impacts. Direct impacts are those changes in output, employment, or income thatrepresent the initial or first-round effects of the activity. Secondary impacts (sometimes furthercategorized into indirect and induced effects, also known as multiplier effects) result fromsubsequent rounds of spending and re-spending within an economy.
In estimating the direct economic losses, production shortfalls were multiplied by theaverage of the actual and estimated price (price that would have been observed in the absence ofscab) to obtain the production losses due to FHB for each CRD and for each year (1993-2001). To obtain the revenue shortfall from price effect, the price difference (estimated price if therewere no FHB, less actual price) was multiplied by the average of the actual production and theestimated production if there were no FHB.

15An economic sector is a group of similar economic units (e.g., communications andpublic utilities, retail trade, construction).
15
The secondary economic effects were estimated using input-output (I-O) analysis. I-Oanalysis is a mathematical tool that traces linkages among sectors15 of an economy and calculatesthe total business activity resulting from a direct impact in a basic sector (Coon et al. 1985). TheNorth Dakota I-O Model was used to estimate the secondary (multiplier) and total economiceffects in the affected states. Empirical testing has shown the North Dakota I-O Model issufficiently accurate in estimating economic impacts in neighboring states (Coon and Leistritz1994; Coon et al. 1984; Leistritz et al. 1990). The model was assumed to also be sufficientlyaccurate to estimate regional economic losses stemming from FHB in the central United States.
The North Dakota I-O Model has 17 economic sectors, is closed with respect tohouseholds (households are included within the model), and was developed from primary(survey) data from firms and households in North Dakota (Coon and Leistritz 2000). Themodel’s transactions table (and the resulting technical coefficients and interdependencecoefficients) reflect purchases made by firms in each sector from other sectors within NorthDakota. Thus, imports of goods and services are not included in the transactions table andresultant coefficients.
The North Dakota I-O Model has two features which merit special comment. First, themodel is closed with respect to households; households are included in the model as both aproducing and a consuming sector. Second, the total gross business volume (gross receipts) oftrade sectors was used (for both expenditures and receipts) in the transactions tables rather thanthe value added (margins) by those sectors. This procedure results in larger activity levels forthose sectors than would be obtained if the margins were used, but this is offset bycorrespondingly larger levels of expenditures outside the region (state) by those sectors for goodspurchased for resale. The advantage of this procedure is that the results of the analysis areexpressed in terms of the gross business volumes of the respective sectors, which is generallymore meaningful to most users.
Data Sources
Data on temperature and precipitation by region were obtained from the National ClimaticData Center (U.S. Department of Commerce). Data on planted and harvested acres, harvestedyield, production, and average prices received by producers were obtained from the NationalAgricultural Statistics Service (U.S. Department of Agriculture). Average CBT and MGE futuresprices were derived from a database of weekly quotes collected from Grain Market News (U.S.Department of Agriculture) and the Wall Street Journal. Basis was calculated as the differencebetween average price received in a region and the average futures price. For North Dakota,prices received were available by crop reporting district; in other states, prices are based on stateaverages. Data on national wheat and barley supplies were from the Wheat Yearbook publishedby the Economic Research Service of the U.S. Department of Agriculture.

16
4. Results
Production Losses Due to FHB
Production losses due to FHB, by state and wheat class, and for barley were estimated (seeFigures 9, 10, 11, 12 and Table 2). Aggregate losses for wheat and barley were largest in 1993,followed by 1994 and 1997. Of the total estimated losses, for all wheat classes (498.0 millionbushels), HRS wheat accounted for 397.1 million bushels. During the entire period (1993-2001),HRS wheat growers incurred the greatest loss, 79.8 percent; followed by SRW wheat, 11.1percent; and durum, 9.1 percent. North Dakota and Minnesota incurred the largest losses for allwheat classes combined, 84.9 percent.
Of the total estimated losses for malting and feed barley (123.8 million bushels), NorthDakota incurred 71.2 percent, Minnesota incurred 27.4 percent, and South Dakota incurred lossesof 1.4 percent.
Price impacts, future and basis effects, also account for significant losses due to FHB.Price impacts must be incorporated in the economic impact analysis. The proceeding section onprice effects presents the results of the economic losses due to futures or market price and pricediscounts.

17
Figure 9. Distribution of Soft Red Winter Wheat Total Production Losses ($) for all CropReporting Districts and Years

18
Figure 10. Distribution of Hard Red Spring Wheat Total Production Losses ($) for all CropReporting Districts and Years

19
Figure 11. Distribution of Durum Wheat Total Production Losses ($) for all Crop ReportingDistricts and Years

20
Figure 12. Distribution of Barley Total Production Losses ($) for all Crop Reporting Districtsand Years

21
Table 2. Production Losses Due to Fusarium Head Blight by State, Crop, and YearState/Crop Year
1993 1994 1995 1996 1997 1998 1999 2000 2001 Total
HRS (000 bu)
NDMNSD
58,701.1147,815.7713,080.43
40,037.5147,947.532,368.15
25,928.9320,610.33
505.39
16,279.487,217.72
-
34,167.0628,057.74
1,305.71
4,767.44 3,381.36 242.14
2,009.433,766.45
-
5,859.673,504.20
-
12,642.6514,361.63
477.65
200,393.28176,662.7417,979.47
Total HRS 119,597.31 90,353.19 47,044.65 23,497.20 65,530.51 8,390.94 5,775.88 9,363.87 27,481.93
Durum (000 bu)
NDMNSD
10,021.98162.70
-
3,823.65180.17
-
6,283.51143.03
-
8,360.5044.76
-
4,375.21--
706.56 12.14
-
3,942.64 15.84
-
4,556.92 1.42
-
2,885.75--
44,956.71560.07
-
Tot Durum 10,184.68 4,003.82 6,426.54 8,405.26 4,375.21 718.70 3,958.48 4,558.34 2,885.75
SRW (000 bu)
ILINKYMIMOOH
753.60-
20.07-
263.06249.86
------
4,708.9361.5720.38
-2,758.991,299.92
10,263.031,049.81
13.433,421.814,572.69
11,499.67
------
2,111.89 583.10 306.52 2,302.22 286.64 1,307.47
226.99 189.92 352.03 496.13 138.78 109.13
449.78 204.49 725.39 656.71 599.27
-
630.52109.46
-933.30
1,059.25673.24
19,144.732,198.351,437.817,810.179,678.67
15,139.29
Total SRW 1,286.59 - 8,849.79 30,820.44 - 6,897.84 1,512.98 2,635.64 3,405.77
All Classes of Wheat (000 bu)
Total 131,068.58 94,357.01 62,320.98 62,722.90 69,905.72 16,007.48 11,247.34 16,557.85 33,773.45
Barley (000 bu)
NDMNSD
20,578.518,250.82
848.25
4,521.67989.35315.50
5,691.4982.48
101.13
3,472.36321.64
29.08
14,934.294,710.11
136.61
7,768.1813,222.84
147.18
8,200.924,559.74
75.39
13,654.221,059.88
21.61
9,399.00757.68
-
88,220.6333,954.531,674.76
Total Barley 29,677.58 5,826.52 5,875.10 3,823.08 19,781.01 21,138.20 12,836.05 14,735.71 10,156.68

22
Price Effect Due to FHB
Tables 3a, 3b, and 3c present estimated price effects, on futures and basis for all wheatclasses (for estimated price effects on futures and basis for malting/feed barley, see Table 6). Although FHB caused futures price to increase for wheat (decrease losses), the basis effects weregenerally negative for all wheat classes and years except for the earlier years (1993 toapproximately 1997) for Durum wheat in North Dakota. The aggregate price effects for all wheatclasses were generally negative, except, once again, the case of Durum wheat. The occasionalpositive price effect for all wheat classes draws attention to what may be termed an ‘aggregationproblem.’ The analysis used CRD-level production data and CRD or state-level price data toderive the economic losses suffered by producers. Data at this level of aggregation do not conveythe severity of losses for individual producers whose yields and prices were lower than average. Moreover, in some CRDs where producers benefitted (on average) from higher prices, scab-related production losses were fairly small or localized.
Estimates of economic loss are affected, unavoidably, by the inclusion of positive priceeffects for all crops sold in a CRD–even crops sold by producers who suffered no yield losses. Low impact on futures price may be due partly to imports from Canada that exceed the yieldshortfall.
Price impacts on malting barley premiums and feed barley are negative and substantial. Aggregate price effects for barley range from 0 to 80.3 cents/bushel for some CRDs and years. Quality shortfall due to FHB remains a major source of loss for barley producers.

23
Table 3a. Price Effect for HRS Wheat in Fusarium Head Blight Affected Regions
Price Effect for HRS
ND-NC ND-NE ND-C ND-EC ND-SE MN SD
Year Weighted Futures Price Effect (cents/bu)
199319941995199619971998199920002001
4.105.286.58
12.933.491.971.042.082.26
4.366.09
11.2217.90
6.235.284.976.405.93
4.136.078.03
14.904.012.602.142.752.76
4.165.559.41
16.914.834.533.804.794.84
4.146.078.65
16.034.853.332.833.654.16
2.143.277.31
14.323.763.123.193.792.96
2.363.455.01
12.833.162.012.002.072.14
Weighted Basis Effect (cents/bu)
199319941995199619971998199920002001
71.10-27.72-16.42-15.07-26.51-61.03-53.96-21.92
-105.61
36.36-40.91-62.7831.90
-23.77-43.72-40.03-17.60-47.00
66.13-12.93-22.97-12.10-25.99-43.40-37.86-21.25-22.17
7.16-17.45-23.5915.91
-25.17-42.47-38.20-19.21-24.09
15.14-5.93
-15.355.03
-25.15-70.67-55.17-20.35-32.77
-13.86-31.73-25.69
9.32-20.24-44.88-42.81-10.21-12.97
14.36-2.55
-15.99-9.17
-24.84-55.99-57.00-21.93
-123.79
Total Price Effect (cents/bu)
199319941995199619971998199920002001
75.20-22.45
-9.85-2.14
-23.01-59.06-52.91-19.84
-103.35
40.71-34.83-51.5649.80
-17.54-38.45-35.07-11.20-41.06
70.27-6.86
-14.952.80
-21.98-40.80-35.72-18.49-19.41
11.31-11.90-14.1932.81
-20.35-37.95-34.40-14.42-19.24
19.280.14
-6.6921.07
-20.30-67.34-52.34-16.70-28.61
-11.73-28.46-18.3823.63
-16.47-41.76-39.63
-6.42-10.01
16.720.91
-10.973.67
-21.69-53.97-55.01-19.86
-121.64

24
Table 3b. Price Effect for Durum Wheat in Fusarium Head Blight Affected Regions
Price Effect for Durum
ND-NC ND-NE ND-C ND-EC ND-SE MN
Year Weighted Futures Price Effect (cents/bu)
199319941995199619971998199920002001
30.0023.0024.00 6.0021.00 1.51 0.67 1.20 1.00
1.303.035.35
10.21 1.611.371.431.261.04
1.032.063.959.911.380.600.610.410.99
0.901.783.599.691.260.320.520.300.85
0.891.783.679.711.270.320.290.300.70
0.601.172.376.190.830.170.070.090.54
Weighted Basis Effect (cents/bu)
199319941995199619971998199920002001
164.00125.00 51.00 4.00104.00 -89.49 -70.33 -42.80 -66.93
79.30 69.03 17.35 -22.79124.61 -69.63
-106.57 -42.74 -66.89
61.0331.06
-51.05 -14.09 124.38 -55.40 -15.39 -43.59 -66.94
116.90151.78 33.59 10.69124.26-52.68-86.48-43.70-67.08
116.89151.78 33.67 10.71124.27 -52.68 -48.71 -43.70 -67.23
69.94 -2.83 -8.96 8.86 98.16-37.83-63.93 -6.24-23.42
Total Price Effect (cents/bu)
199319941995199619971998199920002001
194.00148.00 75.00 10.00125.00 -87.99 -69.65 -41.60 -65.94
80.59 72.06 22.70 -12.58126.22 -68.23-105.14 -41.47 -65.85
62.07 33.13 -47.10 -4.19125.76 -54.80 -14.79 -43.18 -65.94
117.81153.56 37.18 20.38125.51 -52.36 -85.97 -43.40 -66.23
117.78153.55 37.34 20.42125.55 -52.36 -48.43 -43.39 -66.54
70.54 -1.66 -6.59 15.06 99.00-37.65-63.86 -6.16-22.88

25
Table 3c. Price Effect for SRW Wheat in Fusarium Head Blight Affected Regions
Price Effect for SRW
IL IN KY MI MO OH
Year Weighted Futures Price Effect (cents/bu)
199319941995199619971998199920002001
3.053.407.13
13.163.411.671.741.663.15
2.012.965.77
12.462.461.080.931.112.10
2.403.606.58
13.792.911.601.451.523.22
1.883.086.25
12.502.481.161.361.352.84
2.533.256.43
13.452.801.631.832.003.49
2.754.228.18
13.853.762.362.172.523.82
Weighted Basis Effect (cents/bu)
199319941995199619971998199920002001
4.10-29.25
0.229.11
-55.31-89.88-33.70
-0.30-64.78
40.01-58.04-79.23
-3.5434.46
-91.87-32.51
-9.85-99.86
4.40-24.40
1.5834.79
-47.09-101.35
-25.99 -0.44
-53.74
54.994.05
-77.3810.41
-11.81-94.79-33.08
-9.61-74.07
-26.06-4.02
-104.9323.41
3.69-110.37
-28.21-10.00
-116.38
-34.05-15.47-94.77
5.62-10.57
-100.59-43.27
-8.97-109.82
Total Price Effect (cents/bu)
199319941995199619971998199920002001
7.15-25.85
7.3522.27
-51.90-88.22-31.97
1.37-61.63
42.01-55.07-73.47
8.9336.92
-90.79-31.58
-8.75-97.76
6.80-20.81
8.1748.58
-44.58-99.74-24.54
1.08-50.53
56.877.13
-71.1322.91-9.33
-93.62-31.72
-8.26-71.23
-23.53-0.77
-98.5036.86
6.50-108.74
-26.39-8.00
-112.89
-31.30-11.25-86.5919.47-6.81
-98.23-41.10
-6.45-106.00

26
Regional Economic Effects
Economic activity from a project, program, policy, or event can be categorized into directand secondary impacts. Direct impacts are those changes in output, employment, or income thatrepresent the initial or first-round effects of the activity. Secondary impacts (sometimes furthercategorized into indirect and induced effects, also known as multiplier effects) result fromsubsequent rounds of spending and re-spending within an economy.
Direct Economic Impacts
Fusarium Head Blight (FHB) affects small grain producers through price discounts andyield reductions on hard red spring (HRS) wheat, soft red winter (SRW) wheat, durum, andbarley. The combined effects of price discounts and yield reductions represent a loss of revenueto small grain producers and also represent direct economic losses to regional economies. Theselosses may be offset when farmers shift to other crops.
Hard Red Spring Wheat
Yield reductions and price discounts from FHB in HRS wheat were estimated at $1.262billion in North Dakota, Minnesota, and South Dakota from 1993 through 2001 (Table 4). Totaldirect losses were greatest in North Dakota ($630 million), followed by Minnesota ($571million) and South Dakota ($60 million) over the period. Direct losses in the three states weregreatest in 1994 and lowest in 1996. Of the total losses over the period, about one-third ($389million) occurred in 1994 and 1997, with only 25 percent ($310 million) occurring from 1999through 2001.
Durum
Yield reductions and price discounts from FHB in durum were estimated at $156 millionin North Dakota and Minnesota from 1993 through 2001 (Table 5). The economic losses fromFHB in durum were limited primarily to North Dakota. Losses in North Dakota represented over99 percent of the two-state total. Annual direct losses in North Dakota peaked in 1996 ($37.8million), were lowest in 1997 ($1 million).

27
Table 4. Direct Economic Impacts from Fusarium Head Blight in Hard Red Spring Wheat inthe Northern Great Plains, 1993 through 2001
State Economic Effect ND MN SD Total
-------------------------------------- millions $ ------------------------------------1993 Production Loss (205) (145) (40) (390)
Price Effect 156 38 31 226Total (49) (107) (8) (164)
1994 Production Loss (129) (164) (7) (300)Price Effect 24 15 15 55
Total (104) (149) 9 (245)1995 Production Loss (125) (99) (2) (226)
Price Effect 28 15 6 49Total (96) (84) 3 (176)
1996 Production Loss (66) (30) 0 (97)Price Effect 38 22 0 60
Total (28) (8) 0 (37)1997 Production Loss (134) (102) (4) (240)
Price Effect 28 22 5 55Total (107) (79) 1 (185)
1998 Production Loss (14) (10) (1) (26)Price Effect (66) (28) (24) (119)
Total (81) (39) (25) (144)1999 Production Loss (8) (12) 0 (20)
Price Effect (46) (27) (25) (97)Total (53) (38) (25) (117)
2000 Production Loss (25) (11) 0 (37)Price Effect (24) 0 (9) (33)
Total (49) (12) (9) (70)2001 Production Loss (35) (43) 0 (78)
Price Effect (28) (12) (6) (47)Total (63) (55) (6) (124)
Total Production Loss (741) (617) (54) (1,411)Price Effect 111 45 (6) 150
Total (630) (572) (60) (1,262)Note: Totals may not equal due to rounding.

28
Table 5. Direct Economic Impacts from Fusarium Head Blight in DurumWheat in the Northern Great Plains, 1993 through 2001
State Economic Effect ND MN Total
-------------------------- millions $ ---------------------------1993 Production Loss (39.52) (0.73) (40.25)
Price Effect 32.06 0.76 32.82Total (7.46) 0.03 (7.43)
1994 Production Loss (16.17) (0.90) (17.07)Price Effect 12.45 0.85 13.30
Total (3.72) (0.05) (3.77)1995 Production Loss (32.70) (0.66) (33.36)
Price Effect 9.39 0.84 10.23Total (23.31) 0.18 23.13
1996 Production Loss (36.47) (0.17) (36.64)Price Effect (1.47) 0.31 (1.16)
Total (37.94) 0.14 (37.80)1997 Production Loss (19.46) 0.00 (19.46)
Price Effect 18.41 0.00 18.41Total (1.05) 0.00 (1.05)
1998 Production Loss (1.98) (0.04) (2.02)Price Effect (18.40) 0.10 (18.50)
Total (20.38) (0.14) (20.52)1999 Production Loss (10.06) (0.04) (1.10)
Price Effect (18.69) (0.15) (18.84)Total (28.74) (0.19) (28.94)
2000 Production Loss (12.53) (0.01) (12.54)Price Effect (8.35) (0.01) (8.37)
Total (20.88) (0.02) (20.90)2001 Production Loss (7.56) 0.00 (7.56)
Price Effect (4.98) 0.00 (4.98)Total (12.54) 0.00 (12.54)
Total Production Loss (176.45) (2.54) (178.99)Price Effect 20.43 2.49 22.92
Total (156.02) (0.05) (156.07)Note: Totals may not equal due to rounding.

29
Barley
Yield reductions and price discounts from FHB in barley were estimated at $484.7million in North Dakota, Minnesota, and South Dakota from 1993 through 2001 (Table 6). Totaldirect losses over the period were greatest in North Dakota ($338.9 million), followed byMinnesota ($141.3 million) and South Dakota ($4.5 million). Direct losses in the three stateswere greatest in 1993 ($121 million), were lowest in 1995 ($27 million), and have averaged $39million from 1999 through 2001. Of the total losses over the period, about 25 percent occurredin 1993.
Soft Red Winter Wheat
Yield reductions and price discounts from FHB in SRW wheat were estimated at $589million in Illinois, Indiana, Kentucky, Michigan, Missouri, and Ohio from 1993 through 2001(Table 7). Total direct losses over the period were greatest in Ohio ($196.8 million), followedby Illinois ($167 million), Missouri ($96.6 million each), Michigan ($63.3 million), Indiana($43.1 million), and Kentucky ($22.3 million). Direct losses in the SRW wheat producing stateswere highest in 1998 with $235 million. In 1994 and 1997, no losses due to FHB were reported. Of the total losses over the period, 65 percent ($383.8 million) occurred in two years, 1995 and1998.

30
Table 6. Direct Economic Impacts from Fusarium Head Blight in Barley in the NorthernGreat Plains, 1993 through 2001
State Economic Effect ND MN SD Total
-------------------------------------- millions $ --------------------------------------1993 Production Loss (26.66) (15.10) (1.50) (43.26)
Price Effect (35.34) (41.20) (1.30) (77.84)Total (62.00) (56.30) (2.80) (121.10)
1994 Production Loss (12.74) (1.67) (0.55) (14.96)Price Effect (13.26) (13.30) (0.05) (26.61)
Total (26.00) (14.97) (0.60) (41.57)1995 Production Loss (9.00) (0.16) (0.55) (9.35)
Price Effect (11.00) (6.85) (0.03) (17.88)Total (20.00) (7.01) (0.22) (27.23)
1996 Production Loss (9.50) (0.77) 0.08 (10.19)Price Effect (15.50) (3.52) (0.05) (19.07)
Total (25.00) (4.29) 0.03 (29.26)1997 Production Loss (32.64) (8.86) (0.35) (41.85)
Price Effect (35.36) (4.85) (0.01) (40.22)Total (68.00) (13.71) (0.36) (82.07)
1998 Production Loss (15.94) (21.42) (0.33) (37.69)Price Effect (21.11) (7.49) (0.03) (28.63)
Total (38.05) (28.91) (0.36) (66.32)1999 Production Loss (13.32) (7.02) (0.14) (20.48)
Price Effect (8.39) (1.43) 0.00 (9.82)Total (21.71) (8.45) (0.14) (30.30)
2000 Production Loss (23.19) (1.77) (0.04) (25.00)Price Effect (21.71) (3.77) 0.00 (25.48)
Total (44.90) (5.54) (0.04) (50.48)2001 Production Loss (15.90) (1.17) 0.00 (17.07)
Price Effect (18.30) (0.98) 0.00 (19.28)Total (34.20) (2.15) 0.00 (36.35)
Total Production Loss (158.89) (57.94) (3.02) (219.85)Price Effect (179.97) (83.39) (1.47) (264.83)
Total (338.86) (141.33) (4.48) (484.67)Note: Totals may not equal due to rounding.

31
Table 7. Direct Economic Impacts from Fusarium Head Blight in Soft Red Winter Wheat in Central United States, 1993 through2001
State Economic Effect 1993 1994 1995 1996 1997 1998 1999 2000 2001 Total
------------------------------------------------------------------- millions $ ----------------------------------------------------------IL Production Loss (2.180) 0.0 (19.970) (40.720) 0.0 (4.963) (0.479) (0.945) (0.960) (70.217)
Price Effect (8.820) 0.0 (36.850) 10.710 0.0 (43.665) (16.979) 0.638 (1.900) (96.856)Total (11.000) 0.0 (56.820) (30.010) 0.0 (48.618) (17.458) (0.307) (2.860) (167.073)
IN Production Loss 0.0 0.0 (0.270) (6.290) 0.0 (1.376) (0.405) (0.411) (0.380) (9.132)Price Effect 0.0 0.0 (6.190) 6.020 0.0 (22.400) (7.576) (2.182) (1.690) (34.013)
Total 0.0 0.0 (6.460) (0.270) 0.0 (23.771) (7.981) (2.593) (2.070) (43.145)KY Production Loss (0.060) 0.0 (0.070) (0.040) 0.0 (0.693) (0.771) (1.523) (0.980) (4.137)
Price Effect (0.570) 0.0 (4.650) 12.460 0.0 (19.999) (4.830) 0.203 (0.800) (18.190)Total (63.000) 0.0 (4.720) 12.420 0.0 (20.692) (5.605) (1.320) (1.780) (22.327)
MI Production Loss 0.0 0.0 0.000 (13.040) 0.0 (5.364) (1.052) (1.320) (1.450) (22.226)Price Effect 0.0 0.0 0.000 4.590 0.0 (27.707) (12.701) (2.879) (2.400) (41.097)
Total 0.0 0.0 0.000 (8.450) 0.0 (33.071) (13.753) (4.199) (3.850) (63.323)MO Production Loss (0.720) 0.0 (11.550) (12.860) 0.0 (0.660) (0.290) (1.348) (2.200) (29.630)
Price Effect (4.660) 0.0 (20.720) 10.750 0.0 (38.150) (8.440) (2.649) (3.100) (66.969)Total (5.380) 0.0 (32.270) (2.110) 0.0 (38.812) (8.730) (3.997) (5.300) (96.599)
OH Production Loss (0.890) 0.0 (5.980) (44.650) 0.0 (2.955) (0.219) 0.000 (1.600) (56.194)Price Effect (2.470) 0.0 (42.650) 5.960 0.0 (67.091) (27.155) (5.068) (2.160) (140.634)
Total (3.360) 0.0 (48.530) (38.690) 0.0 (70.046) (27.374) (5.068) (3.760) (196.828)
All Production Loss (3.850) 0.0 (37.740) (117.60 0.0 (16.013) (3.216) (5.547) (7.570) (191.536)Price Effect (16.520) 0.0 (111.06 50.490 0.0 (218.997) (77.685) (11.937) (12.050) (397.759)
Total (20.370) 0.0 (148.80 (67.110) 0.0 (235.010) (80.901) (17.484) (19.620) (589.295)
Note: Totals may not equal due to rounding.
32
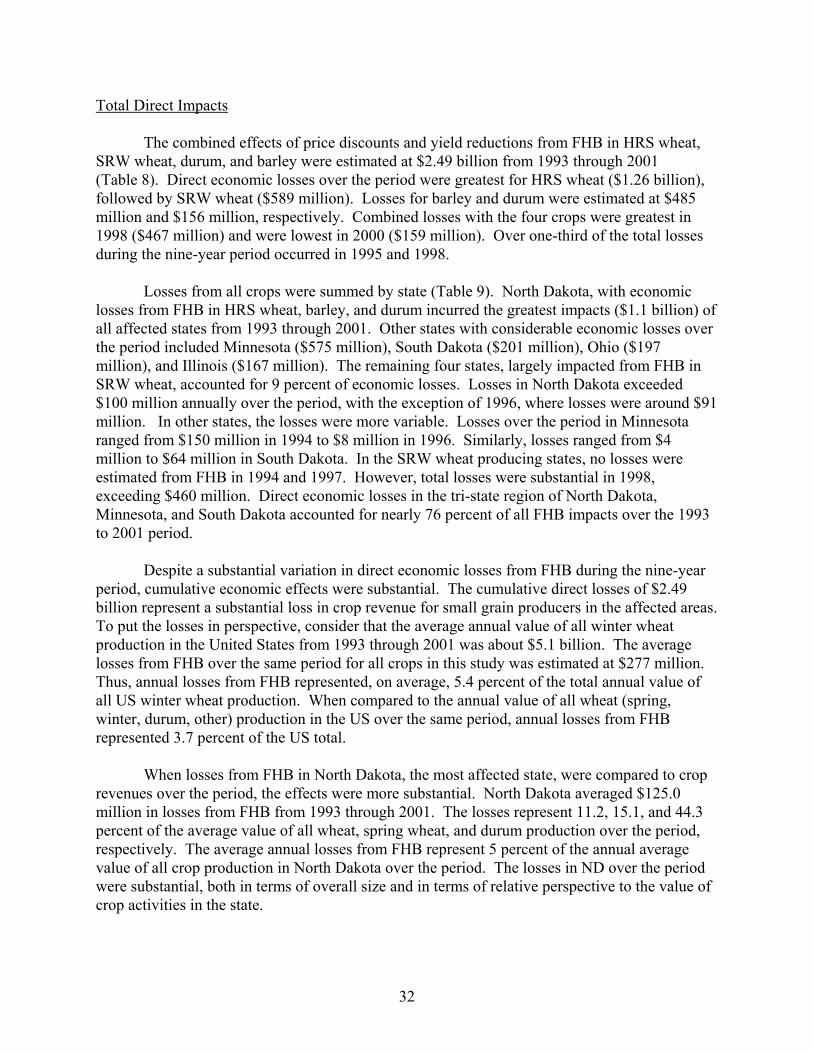
Total Direct Impacts
The combined effects of price discounts and yield reductions from FHB in HRS wheat, SRW wheat, durum, and barley were estimated at $2.49 billion from 1993 through 2001(Table 8). Direct economic losses over the period were greatest for HRS wheat ($1.26 billion),followed by SRW wheat ($589 million). Losses for barley and durum were estimated at $485million and $156 million, respectively. Combined losses with the four crops were greatest in1998 ($467 million) and were lowest in 2000 ($159 million). Over one-third of the total lossesduring the nine-year period occurred in 1995 and 1998.
Losses from all crops were summed by state (Table 9). North Dakota, with economiclosses from FHB in HRS wheat, barley, and durum incurred the greatest impacts ($1.1 billion) ofall affected states from 1993 through 2001. Other states with considerable economic losses overthe period included Minnesota ($575 million), South Dakota ($201 million), Ohio ($197million), and Illinois ($167 million). The remaining four states, largely impacted from FHB inSRW wheat, accounted for 9 percent of economic losses. Losses in North Dakota exceeded$100 million annually over the period, with the exception of 1996, where losses were around $91million. In other states, the losses were more variable. Losses over the period in Minnesotaranged from $150 million in 1994 to $8 million in 1996. Similarly, losses ranged from $4million to $64 million in South Dakota. In the SRW wheat producing states, no losses wereestimated from FHB in 1994 and 1997. However, total losses were substantial in 1998,exceeding $460 million. Direct economic losses in the tri-state region of North Dakota,Minnesota, and South Dakota accounted for nearly 76 percent of all FHB impacts over the 1993to 2001 period.
Despite a substantial variation in direct economic losses from FHB during the nine-yearperiod, cumulative economic effects were substantial. The cumulative direct losses of $2.49billion represent a substantial loss in crop revenue for small grain producers in the affected areas. To put the losses in perspective, consider that the average annual value of all winter wheatproduction in the United States from 1993 through 2001 was about $5.1 billion. The averagelosses from FHB over the same period for all crops in this study was estimated at $277 million. Thus, annual losses from FHB represented, on average, 5.4 percent of the total annual value ofall US winter wheat production. When compared to the annual value of all wheat (spring,winter, durum, other) production in the US over the same period, annual losses from FHBrepresented 3.7 percent of the US total.
When losses from FHB in North Dakota, the most affected state, were compared to croprevenues over the period, the effects were more substantial. North Dakota averaged $125.0million in losses from FHB from 1993 through 2001. The losses represent 11.2, 15.1, and 44.3percent of the average value of all wheat, spring wheat, and durum production over the period,respectively. The average annual losses from FHB represent 5 percent of the annual averagevalue of all crop production in North Dakota over the period. The losses in ND over the periodwere substantial, both in terms of overall size and in terms of relative perspective to the value ofcrop activities in the state.

33
Table 8. Total Direct Economic Impacts from Fusarium Head Blight, by Crop, in the Northern Great Plains and Central UnitedStates, 1993 through 2001Crop State 1993 1994 1995 1996 1997 1998 1999 2000 2001 Total By crop
----------------------------------------------------------------------------------------- 000s $ ----------------------------------------------------------------------- ---- % --
HRS ND 49,000 104,000 96,000 28,000 107,000 81,000 53,000 49,000 63,000 630,000 - - -
MN 107,000 149,000 84,000 8,000 79,000 39,000 38,000 12,000 55,000 571,000 - - -
SD 8,000 (9,000) (3,000) 0 (1,000) 25,000 25,000 9,000 6,000 60,000 - - -
Total 164,000 244,000 177,000 36,000 185,000 145,000 116,000 70,000 124,000 1,261,000 50.5
Barley ND 62,000 26,000 20,000 25,000 68,000 37,050 21,710 44,900 34,200 338,860 - - -
MN 2,800 600 220 (30) 360 360 140 40 0 4,490 - - -
SD 56,300 14,970 7,010 4,290 13,710 28,910 8,450 5,540 2,150 141,330 - - -
Total 121,100 41,570 27,230 29,260 82,070 66,320 30,300 50,480 36,350 484,680 19.5
Durum ND 7,460 3,720 23,310 37,940 1,050 20,380 28,740 20,880 12,540 156,020 - - -
MN (30) 50 (180) (140) 0 140 190 20 0 50 - - -
Total 7,430 3,770 23,130 37,800 1,050 20,520 28,930 20,900 12,540 156,070 6.3
SRW IL 11,000 0 56,820 30,010 0 45,618 17,458 307 2,860 167,073 - - -
IN 0 0 6,460 270 0 23,771 7,981 2,593 2,070 43,145 - - -
KY 630 0 4,720 (12,420) 0 20,692 5,605 1,320 1,780 22,327 - - -
MI 0 0 0 8,450 0 33,071 13,753 4,199 3,850 63,323 - - -
MO 5,380 0 32,270 2,110 0 38,812 8,730 3,997 5,300 96,599 - - -
OH 3,360 0 48,530 38,690 0 70,046 27,374 5,068 3,760 196,828 - - -
Total 20,370 0 148,800 67,110 0 235,010 80,901 17,484 19,620 589,295 23.7
All All 312,900 289,340 376,160 170,170 268,120 466,850 256,131 158,864 192,510 2,491,045 - - -
% 12.6 11.6 15.1 6.8 10.8 18.7 10.3 6.4 7.7 - - - - - -

34
Table 9. Total Direct Economic Impacts from Fusarium Head Blight, by State, in the Northern Great Plains and Central UnitedStates, 1993 through 2001
State Crop 1993 1994 1995 1996 1997 1998 1999 2000 2001 Total By
----------------------------------------------------------------------------------------- 000s $ ------------------------------------------- ---- % -ND HRS 49,000 104,000 96,000 28,000 107,000 81,000 53,000 49,000 63,000 630,000
Duru 7,460 3,720 23,310 37,940 1,050 20,380 28,740 20,880 12,540 156,020
Barley 62,000 26,000 20,000 25,000 68,000 37,050 21,710 44,900 34,200 338,860
Total 118,460 133,720 139,310 90,940 176,050 138,430 103,450 114,780 109,740 1,124,88 45.2
MN HRS 107,000 149,000 84,000 8,000 79,000 39,000 38,000 12,000 55,000 571,000
Duru (30) 50 (180) (140) 0 140 190 20 0 50
Barley 2,800 600 220 (30) 360 360 140 40 0 4,490
Total 109,770 149,650 84,040 7,830 79,360 39,500 38,330 12,060 55,000 575,540 23.1
SD HRS 8,000 (9,000) (3,000) 0 (1,000) 25,000 25,000 9,000 6,000 60,000
Barley 56,300 14,970 7,010 4,290 13,710 28,910 8,450 5,540 2,150 141,330
Total 64,300 5,970 4,010 4,290 12,710 53,910 33,450 14,540 8,150 201,330 8.1
IL SRW 11,000 0 56,820 30,010 0 48,618 17,458 307 2,860 167,073 6.7
IN SRW 0 0 6,460 270 0 23,771 7,981 2,593 2,070 43,145 1.7
KY SRW 630 0 4,720 (12,420) 0 20,692 5,605 1,320 1,780 22,327 0.9
MI SRW 0 0 0 8,450 0 33,071 13,753 4,199 3,850 63,323 2.5
MO SRW 5,380 0 32,270 2,110 0 38,812 8,730 3,997 5,300 96,599 3.9
OH SRW 3,360 0 48,530 38,690 0 70,046 27,374 5,068 3,760 196,828 7.9

35
Total Economic Impacts
Economic activity from a project, program, or policy can be categorized into direct andsecondary impacts. Direct impacts are those changes in output, employment, or income thatrepresent the initial or first-round effects of the activity. Secondary impacts (sometimes furthercategorized into indirect and induced effects, also known as multiplier effects) result fromsubsequent rounds of spending and respending within an economy. The secondary economiceffects were estimated using input-output analysis. Input-output (I-O) analysis is a mathematicaltool that traces linkages among sectors of an economy and calculates the total business activityresulting from a direct impact in a basic sector (Coon et al. 1985). An economic sector is a groupof similar economic units (e.g., communications and public utilities, retail trade, construction).
The North Dakota I-O Model was used to estimate the secondary (multiplier) and totaleconomic effects of Fusarium Head Blight in the affected states. Empirical testing has shownthe North Dakota Input-Output Model is sufficiently accurate in estimating economic impacts inneighboring states (Coon and Leistritz 1994; Coon et al. 1984; Leistritz et al. 1990). The modelwas assumed to also be sufficiently accurate to estimate regional economic losses stemmingfrom FHB in the Central United States.
Fusarium Head Blight affects small grain producers in the northern Great Plains andCentral United States through price discounts and yield reductions on hard red spring wheat,durum, barley, and soft red winter wheat. The effects of FHB were assumed to reduce producernet revenues, as the economic linkages and activities associated with crop production (e.g.,planting, harvesting) are largely covered through the dispersal of revenues that producers arecurrently receiving from crop sales. Reductions in producer net revenues were treated as directeconomic impacts and allocated to the Households sector of the North Dakota I-O Model toestimate the secondary and total economic impacts.
Hard Red Spring Wheat
Direct economic impacts (reductions in producer net revenues) from FHB on HRS wheattotaled $1.26 billion in North Dakota, Minnesota, and South Dakota from 1993 to 2001 (Table9). Total direct and secondary economic impacts (total economy-wide losses) from FHB onHRS wheat in the three-state region were estimated at $3.88 billion over the period (Table 10). In the case of HRS wheat, North Dakota sustained the greatest level of overall economic loss($1.94 billion) over the period. Economy-wide losses in Minnesota and South Dakota wereestimated at $1.76 billion and $185 million, respectively (Table 10).
Durum
Direct economic impacts of FHB in durum totaled about $156 million in North Dakotaand Minnesota from 1993 to 2001. Total direct and secondary economic impacts (totaleconomy-wide losses) from FHB in durum in the two-state region were estimated at $480million over the period (Table 10). Nearly all (over 99 percent) of the economic losses fromFHB in durum occurred in North Dakota. The greatest losses occurred in 1995 and 1996, and1998 through 2001.

36
Barley
Direct economic impacts of FHB in barley were estimated at $485 million in NorthDakota, Minnesota, and South Dakota from 1993 through 2001. Total direct and secondaryeconomic impacts in the tri-state region were estimated at $1.49 billion over the period (Table10). About 70 percent or $1 billion of those losses occurred in North Dakota. Over the period,overall economic losses in the three states were greatest in 1993, followed by losses in 1997.
Soft Red Winter Wheat
Direct economic impacts of FHB in SRW wheat were estimated at $589 million inIllinois, Indiana, Kentucky, Michigan, Missouri, and Ohio from 1993 through 2001. Totalregional losses (direct and secondary economic impacts) in the affected states were estimated at$1.81 billion over the period (Table 10). About 62 percent of the regional losses occurred inOhio and Illinois. Of the $1.81 billion in regional economic losses, $606 million occurred inOhio. Unlike durum and barley, the economic losses from FHB in SRW wheat largely occurredin only four years, 1995, 1996, 1998, and 1999.
Total Direct and Secondary Economic Impacts
Total direct and secondary economic losses from FHB in HRS wheat, barley, durum, andSRW wheat from 1993 to 2001 were estimated at $7.67 billion (Table 11). Overall losses weregreatest in 1998, but losses remained mostly consistent over the period, except losses werenoticeably lower in 1996, 2000, and 2001. Total economic impacts were greatest for SRW andHRS wheat, which accounted for nearly three-quarters of all losses.
Direct and secondary economic losses for all crops were summed by state (Table 11). Ofthe $7.67 billion in economic losses associated with FHB, North Dakota had $3.46 billion orabout 45 percent of those losses during the 1993 to 2001 period. Losses in the other states werenot as large, but substantial losses still occurred Minnesota ($1.77 billion), South Dakota ($620million, Ohio ($606 million), Illinois ($514 million), and Missouri ($297 million). Relativelylower losses occurred in Michigan ($195 million), Indiana ($133 million), and Kentucky ($69million).

37
Table 10. Total (Direct and Secondary) Economic Impacts from Fusarium Head Blight, by Crop and State, in the Northern GreatPlains and Central United States, 1993 through 2001
Crop State 1993 1994 1995 1996 1997 1998 1999 2000 2001 Total By
----------------------------------------------------------------------------------------- 000s $ -------------------------------------------- ----HRS ND 150,837 320,143 295,517 86,192 329,378 249,342 163,150 150,837 193,933 1,939,329 - - -
MN 329,378 458,667 258,577 24,626 243,186 120,054 116,975 36,940 169,307 1,757,710 - - -
SD 24,626 (27,705) (9,235) 0 (3,078) 76,958 76,958 27,705 18,470 184,699 - - -
Total 504,841 751,105 544,859 110,818 569,486 446,354 357,083 215,482 381,710 3,881,738 50.5
Barle ND 190,855 80,036 61,566 76,958 209,324 114,051 66,830 138,216 105,278 1,043,114 - - -
MN 8,619 1,847 677 (92) 1,108 1,108 431 123 0 13,821 - - -
SD 173,308 46,082 21,579 13,206 42,203 88,994 26,012 17,054 6,618 435,056 - - -
Total 372,782 127,965 83,822 90,072 252,635 204,153 93,273 155,393 111,896 1,491,991 19.5
Duru ND 22,964 11,451 71,755 116,791 3,232 62,736 88,470 64,275 38,602 480,276 - - -
MN (92) 154 (554) (431) 0 431 585 62 0 155 - - -
Total 22,872 11,605 71,201 116,360 3,232 63,167 89,055 64,337 38,602 480,431 6.3
SRW IL 33,861 0 174,909 92,380 0 149,661 53,741 945 8,804 514,301 - - -
IN 0 0 19,886 831 0 73,174 24,568 7,982 6,372 132,813 - - -
KY 1,939 0 14,530 (38,232) 0 63,696 17,254 4,063 5,479 68,729 - - -
MI 0 0 0 26,012 0 101,802 42,336 12,926 11,851 194,927 - - -
MO 16,561 0 99,337 6,495 0 119,475 26,874 12,304 16,315 297,361 - - -
OH 10,343 0 149,390 119,099 0 215,623 84,265 15,601 11,574 605,895 - - -
Total 62,704 0 458,052 206,585 0 723,431 249,038 53,821 60,395 1,814,026 23.7
Totals All 963,199 890,675 1,157,93 523,835 825,353 1,437,10 788,449 489,033 592,603 7,668,186 - - -
% 12.6 11.6 15.1 6.8 10.8 18.7 10.3 6.4 7.7 - - - - - -

38
Table 11. Total (Direct and Secondary) Economic Impacts from Fusarium Head Blight, All Crops, by State, in the Northern GreatPlains and Central United States, 1993 through 2001
State 1993 1994 1995 1996 1997 1998 1999 2000 2001 Total By State
----------------------------------------------------------------------------------------- 000s $ -------------------------------------- ---- % --
ND 364,656 411,630 428,838 279,941 541,934 426,129 318,450 353,328 337,813 3,462,71 45.2
MN 337,905 460,668 258,700 24,103 244,294 121,593 117,991 37,125 169,307 1,771,68 23.1
SD 197,934 18,377 12,344 13,206 39,125 165,952 102,970 44,759 25,088 619,755 8.1
OH 10,343 0 149,390 119,099 0 215,623 84,265 15,601 11,574 605,895 7.9
IL 33,861 0 174,909 92,380 0 149,661 53,741 945 8,804 514,301 6.7
MO 16,561 0 99,337 6,495 0 119,475 26,874 12,304 16,315 297,361 3.9
MI 0 0 0 26,012 0 101,802 42,336 12,926 11,851 194,927 2.5
IN 0 0 19,886 831 0 73,174 24,568 7,982 6,372 132,813 1.7
KY 1,939 0 14,530 (38,232) 0 63,696 17,254 4,063 5,479 68,729 0.9
Total 963,199 890,675 1,157,93 523,835 825,353 1,437,10 788,449 489,033 592,603 7,668,18 - - -

39
Economic Impacts by Sector
Input-output analysis provides for estimates of the lost business activity by economicsector. The combined effects (direct and secondary) of FHB by economic sector for all affectedcrops was summed by year for the 1993 to 2001 period (Table 12). The economic sectors of theindividual state and regional economies with the greatest loss of business activity during theperiod were Households (which represents economy-wide personal income) ($3.87 billion) andRetail Trade ($1.86 billion). Other sectors which incurred substantial loss of economic activityas a result of FHB in small grains included Finance, Insurance, and Real Estate ($419million), Government ($269 million), Communication and Public Utilities ($263 million) andAgriculture ($234 million). Since all effects (direct economic losses) of FHB were allocated tothe Households sector for each crop and each state, lost business activity by sector withinindividual states would be in proportion to the aggregate totals for each year (i.e., state-leveleffects by economic sector would be largely in the same ratio as found in Table 12).
Based on the North Dakota I-O Model, each dollar of direct economic loss or each dollarof lost producer net revenues would result in an additional $2.08 of lost business activity in thestate and regional economies. Thus, not only are producers affected by FHB through lostrevenues, but numerous sectors of the state and regional economies also are affected.

40
Table 12. Total (Direct and Secondary) Economic Impacts for Fusarium Head Blight in All Crops, by Economic Sector and Year,Northern Great Plains and Central United States, 1993 through 2001
Hard Red Spring and Soft Red Winter Wheat, Durum, and Barley
Economic Sector 1993 1994 1995 1996 1997 1998 1999 2000 2001 Totals
----------------------------------------------------------------------------------------- 000s $ ------------------------------------------------------------------Agriculture 29,412 27,197 35,358 15,996 25,204 42,884 24,075 14,932 18,095 234,153
Construction 28,223 26,099 33,930 15,349 24,185 42,109 23,104 14,331 17,365 224,695
Communication & Public Utilities 33,012 30,524 39,685 17,954 28,287 49,255 27,022 16,761 20,311 262,811
Retail Trade 233,016 215,471 280,126 126,727 199,669 347,662 190,740 118,306 143,364 1,855,081
Finance, Insurance,& Real Estate 52,599 48,637 63,232 28,606 45,073 78,479 43,057 26,706 32,361 418,750
Households 485,746 449,173 583,951 264,172 416,230 724,737 397,617 246,621 298,851 3,867,098
Government 33,791 31,252 40,629 18,372 28,951 50,418 27,662 17,155 20,790 269,020
Other sectorsa 67,400 62,322 81,023 36,659 57,754 100,561 55,172 34,221 41,466 536,578
Total 963,199 890,675 1,157,934 523,835 825,353 1,437,105 788,449 489,033 592,603 7,668,186
Total DirectImpacts 312,900 289,340 376,160 170,170 268,120 466,850 256,131 158,864 192,510 2,491,045
Total SecondaryImpacts 650,299 601,335 781,774 353,665 557,233 970,255 532,318 330,169 400,093 5,177,141
a Includes sectors such as business, professional, personal, and social services, transportation, and manufacturing.

16A measure of the amount of economic activity needed in an economic sector to supportone full-time job within that sector.
41
Secondary Employment
Secondary employment estimates represent the number of full-time jobs generated basedon the volume of business activity created by an industry. Productivity ratios16 were used withestimates of business activity to obtain secondary employment. The loss of producer revenuesfrom FHB in small grains in the Northern Great Plains and Central United States had substantialeffects on secondary employment in the state and regional economies (Table 13). Over theperiod, secondary employment losses ranged from 4,800 FTE in 2000 to 14,300 FTE in 1998. Other years with substantial employment losses due to FHB included 1995 (12,100 FTE), 1993(10,000 FTE), and 1994 (9,300 FTE).
Table 13. Secondary Employment Losses from Fusarium Head Blight, All Crops, byState in the Northern Great Plains and Central United States, 1993 through 2001
State 1993 1994 1995 1996 1997 1998 1999 2000 2001
------------------------------------------------ full-time equivalent jobs -------------------------
ND 3,796 4,287 4,470 2,856 5,445 4,262 3,169 3,507 3,338
MN 3,525 4,807 2,699 246 2,453 1,206 1,170 363 1,677
SD 2,059 192 128 131 394 1,653 1,020 435 238
OH 101 0 1,557 1,217 0 2,161 837 149 109
IL 349 0 1,824 941 0 1,497 531 6 82
MO 168 0 1,035 61 0 1,193 261 116 156
MI 0 0 0 263 0 1,016 418 124 111
IN 0 0 202 4 0 729 239 75 58
KY 15 0 147 (387)a 0 635 168 34 49
Total 10,013 9,286 12,062 5,332 8,292 14,352 7,813 4,809 5,818a Indicates an increase in jobs due to positive economic effects from FHB. All other effectsrepresent job losses.

42
5. Summary and Discussion
This study provides an update of economic losses suffered by wheat and barley producersin scab-affected regions in the United States from 1993 to 2001. Wheat and barley producers inseveral states have experienced significant yield and price losses due to Fusarium Head Blight(FHB), or scab, since 1993. Yield and price effects of FHB are estimated in this study usingchange in crop value after accounting for reduced yields, higher abandoned acres, and priceimpacts on futures and basis, and malting and feed barley prices.
One of the main difficulties in measuring economic losses due to FHB is estimating theprice effects. While supply reductions tend to increase the futures price, the effects on averagebasis (difference between local cash price and futures) are less certain. Shortages of milling-quality grains can induce large price premiums, which favor producers who have high qualitywheat or barley to sell. However, many producers in scab-affected regions face qualitydiscounts due to damaged kernels, low test weight, or vomitoxin. The average basis in a regiondepends on the quality of crop sold by all producers and the premiums and discounts applied bylocal elevators. To measure the impact of FHB on basis, deviations from olympic-average basis valueswere used in years preceding the scab outbreak in the case of wheat. In the case of barley, themalting and feed barley prices were estimated. The actual prices were deducted from theestimated prices to obtain the price effects. An input-output model was used to estimatesecondary and total economic impacts of FHB on state economies, individual economic sectors,and secondary employment.
The direct combined effects of price discounts and yield reductions from FHB in HRSwheat, SRW wheat, durum wheat, and barley were estimated at $2.492 billion from 1993through 2001. Direct economic losses over the period were greatest for HRS wheat ($1.262billion), followed by SRW wheat ($589 million). Losses for barley and durum wheat wereestimated at $484.7 million and $156 million, respectively. Combined losses for the four cropswere greatest in 1998, followed by 1995, and 1993, with 2000 losses being the lowest. Lossesin 1998 accounted for over 19 percent of the nine-year total.
Cumulative economic losses from FHB over the period 1993 to 2001 were very high. The cumulative direct losses of $2.492 billion represent a substantial loss in crop revenue forsmall grain producers in the affected areas. To put the losses in perspective, consider that theaverage annual value of all winter wheat production in the United States from 1993 to 2001 wasabout $5.1 billion. The average annual losses from FHB over the same period for all crops inthis study was estimated at $277 million. Thus, annual losses from FHB over the nine years represent on average 5.4 percent of the total value of all U.S. winter wheat production. Whencompared to the annual value of all wheat (spring, winter, durum, and other) production in theUnited States over the same period, annual losses from FHB represented 3.7 percent of the U.S.total.
The combined direct and secondary economic losses for all crops were estimated at $7.7billion. North Dakota had $3.5 billion or about 45 percent of those losses during the period 1993to 2001. Losses in the other states were not as large, but substantial losses still occurred in

43
Minnesota ($1.8 billion), South Dakota ($620 million), Ohio ($606 million), Illinois ($514million), Missouri ($297 million), Michigan ($195 million), Indiana ($133 million) andKentucky (69 million).
Johnson et al. (1998) estimated FHB losses for the period 1993 to 1997. The estimates inthis study are more comprehensive, and they show that revenue loss due to FHB decreasedsubstantially for wheat in 1993-2001. The most likely reason for the decrease in revenue was theintroduction of FHB resistant varieties in North Dakota and Minnesota combined with lowprecipitation recorded during these periods. However, barley producers continue to suffersignificant losses. North Dakota and Minnesota had the largest cumulative yield losses for allwheat classes and barley, followed by Michigan and Illinois.
Scab is still a major economic problem, whether measured in relative terms to other cropsales or measured by overall direct and secondary economic impact. The scab problem is notlimited to a narrow geographic region, hurting producers in both the northern Great Plains andcentral states. Scab continues to effect several classes of wheat and barley, constituting a seriouseconomic problem in several regions of the United States.
Impacts from scab affect not only producers, but other areas of the economy as well. Asubstantial portion of the impacts affect the businesses that are dependent upon revenues fromcrop sales (for every $1 dollar of scab losses incurred by the producer, $2.08 in losses areincurred in other areas of rural and state economies). Depressed farm economies are furtheraffected by scab. Scab occurs in many regions of the northern Great Plains that are not onlyreliant on agriculture, but are predominately dependent upon small grain production. Thus, scabis having an extenuating effect in those areas. Furthermore, income losses from scab areoccurring during periods of depressed farm prices and low net farm income. (Net farm incomehas decreased significantly since 1996.)
The level of impacts (magnitude), the relative impact (comparisons to wheat/other smallgrain sales), and the geographic size of the problem all suggest that continued research intodeveloping scab resistant varieties of wheat and barley is warranted. Clearly, several milliondollars spent on scab research would be easily offset by future benefits of a reduction in scablosses.
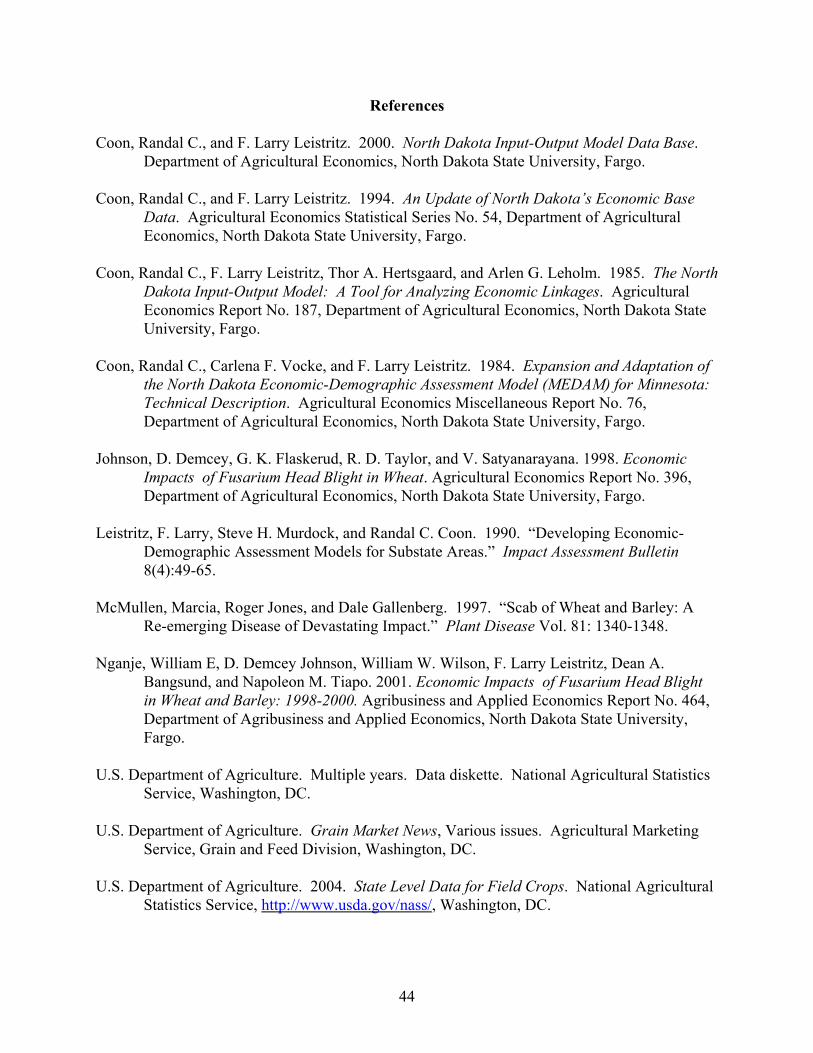
44
References
Coon, Randal C., and F. Larry Leistritz. 2000. North Dakota Input-Output Model Data Base. Department of Agricultural Economics, North Dakota State University, Fargo.
Coon, Randal C., and F. Larry Leistritz. 1994. An Update of North Dakota’s Economic BaseData. Agricultural Economics Statistical Series No. 54, Department of AgriculturalEconomics, North Dakota State University, Fargo.
Coon, Randal C., F. Larry Leistritz, Thor A. Hertsgaard, and Arlen G. Leholm. 1985. The NorthDakota Input-Output Model: A Tool for Analyzing Economic Linkages. AgriculturalEconomics Report No. 187, Department of Agricultural Economics, North Dakota StateUniversity, Fargo.
Coon, Randal C., Carlena F. Vocke, and F. Larry Leistritz. 1984. Expansion and Adaptation ofthe North Dakota Economic-Demographic Assessment Model (MEDAM) for Minnesota: Technical Description. Agricultural Economics Miscellaneous Report No. 76,Department of Agricultural Economics, North Dakota State University, Fargo.
Johnson, D. Demcey, G. K. Flaskerud, R. D. Taylor, and V. Satyanarayana. 1998. EconomicImpacts of Fusarium Head Blight in Wheat. Agricultural Economics Report No. 396,Department of Agricultural Economics, North Dakota State University, Fargo.
Leistritz, F. Larry, Steve H. Murdock, and Randal C. Coon. 1990. “Developing Economic-Demographic Assessment Models for Substate Areas.” Impact Assessment Bulletin8(4):49-65.
McMullen, Marcia, Roger Jones, and Dale Gallenberg. 1997. “Scab of Wheat and Barley: ARe-emerging Disease of Devastating Impact.” Plant Disease Vol. 81: 1340-1348.
Nganje, William E, D. Demcey Johnson, William W. Wilson, F. Larry Leistritz, Dean A.Bangsund, and Napoleon M. Tiapo. 2001. Economic Impacts of Fusarium Head Blightin Wheat and Barley: 1998-2000. Agribusiness and Applied Economics Report No. 464,Department of Agribusiness and Applied Economics, North Dakota State University,Fargo.
U.S. Department of Agriculture. Multiple years. Data diskette. National Agricultural StatisticsService, Washington, DC.
U.S. Department of Agriculture. Grain Market News, Various issues. Agricultural MarketingService, Grain and Feed Division, Washington, DC.
U.S. Department of Agriculture. 2004. State Level Data for Field Crops. National AgriculturalStatistics Service, http://www.usda.gov/nass/, Washington, DC.

45
U.S. Department of Agriculture. Various years. Wheat Yearbook. Economic Research Service,Washington, DC.
U.S. Department of Commerce. National Climatic Data Center, Office of Environmental Information Service, National Oceanic and Atmospheric Administration, Washington,DC.
U.S. General Accounting Office. March 1999. Grain Fungus Creates Financial Distress for North Dakota Barley Producers. Washington, DC.
Wall Street Journal. Various issues. Dow Jones & Company, Inc., New York, NY.

46
Appendix Tables
Table A1. HRS Wheat Yield Equation Parameter Estimates, by StateState / CRD Intercept Trend Temperature Precipitation R2 Adj. R2 Sample Size
ND - NC 94.227 0.32133 -1.4173 0.64874 0.4029 0.2976 21( 3.305) ( 1.685) (-2.890) ( 1.297)
ND - NE 85.402 0.5673 -1.0613 0.47697 0.3101 0.1883 21( 2.285) ( 2.337) (-1.698) (0.7834)
ND - C 75.725 0.33886 -1.0997 1.0742 0.4323 0.3321 21( 2.423) ( 1.669) (-2.103) ( 2.110)
ND - EC 93.574 0.63324 -1.2613 0.60845 0.3619 0.2493 21( 2.415) ( 2.590) (-1.922) ( 1.138)
ND - SE 78.095 0.40425 -1.0025 0.26589 0.2333 0.098 21( 1.935) ( 1.803) (-1.511) (0.5233)
MN - NW 70.111 0.72676 -0.88439 1.0175 0.4083 0.3039 21( 1.522) ( 2.842) (-1.157) ( 1.528)
MN - WC ** 46.37 0.61307 -0.54676 1.2211 0.3581 0.2448 21( 0.9857) ( 2.788) (-0.7331) ( 2.189)
MN - C ** -26.752 0.20103 0.91152 0.46975 0.1508 0.001 21(-0.4797) ( 0.6544) ( 1.017) ( 0.9343)
SD - NC 79.998 0.36576 -1.134 0.58488 0.3396 0.223 21( 1.714) ( 1.710) (-1.571) (0.8920)
SD - NE ** 36.78 0.47997 -0.47984 1.2704 0.3232 0.2037 21( 0.8842) ( 2.576) (-0.7205) ( 2.563)
SD - C 84.557 0.32151 -1.1035 -0.047464 0.291 0.1659 21(-1.702) (-1.289) ( -1.452 ) (-0.079)
Numbers in the parentheses are t-values.** Indicates error structure corrected for first order auto-correlation.

47
Table A2. Durum Wheat Yield Equation Parameter Estimates, by StateState / CRD Intercept Trend Temperature Precipitation R2 Adj. R2 Sample Size
ND - NC 98.817 0.32251 -1.4729 0.70589 0.4058 0.3009 21( 3.332) ( 1.625) (-2.887) ( 1.356)
ND - NE 84.35 0.36631 -1.1761 0.82275 0.3616 0.2489 21( 2.798) ( 1.829) (-2.275) ( 1.475)
ND - C 82.668 0.46442 -1.2943 1.3865 0.5387 0.4573 21( 2.616) ( 2.263) (-2.449) ( 2.693)
ND - EC 94.682 0.85496 -1.3889 0.87211 0.4673 0.3733 21( 2.348) ( 3.360) (-2.033) ( 1.567)
ND - SE 65.407 0.5025 -0.89617 0.83324 0.3908 0.2832 21( 1.750) ( 2.420) (-1.459) ( 1.771)
MN - NW 61.129 0.6421 -0.82059 1.4907 0.4763 0.3838 21( 1.416) ( 2.678) (-1.145) ( 2.387)
MN - WC ** 35.806 0.42769 -0.39002 1.2589 0.4217 0.3197 21( 1.044) ( 2.674) (-0.7170) ( 3.084)
Numbers in the parentheses are t-values.** Indicates error structures corrected for first order auto-correlation.

48
Table A3. SRW Wheat Yield Equation Parameter Estimates, by StateState / CRD Intercept Trend Temperature Precipitation R2 Adj. R2 Sample Size
IL - W 56.233 1.2241 -0.24502 -0.58471 0.6816 0.6179 19(1.279) (4.483) (-0.3298) ( -1.742)
IL - WSW 75.505 0.93293 -0.4845 -0.61913 0.6284 0.5541 19(1.783) (3.799) (-0.6918) ( -1.884)
IL - ESE 35.662 0.85432 0.21217 -0.73802 0.6479 0.5775 19(0.8517) (3.77) (0.3069) (-2.286)
IL - SW 80.715 0.80986 -0.55467 -0.83165 0.6176 0.5412 19(1.86) (3.643) (-0.7916) ( -2.814)
IL - SE -2.2713 0.79954 0.7623 -0.62178 0.5553 0.4664 19(-0.04404) (3.272) (0.9269) ( -1.910)
IN - NE ** 70.906 0.89601 -0.57457 -0.17975 0.6339 0.5606 19(2.351) (6.03) ( -1.111) (-0.4213)
IN - C ** 90.46 1.0548 -0.7959 -0.36563 0.7873 0.7447 19(3.339) (9.376) (-1.763) (-1.292)
IN - SW 29.112 0.76875 0.22551 -0.39652 0.4521 0.3426 19(0.5295) (3.081) (0.2547) (-1.101)
IN - SC ** 42.918 0.66552 -0.16107 -0.073021 0.4488 0.3386 19(1.015) (3.651) (-0.2327) (-0.2520)
IN - SE 33.704 0.90967 0.013917 -0.25987 0.6554 0.5864 19(0.7634) (4.818) (0.01932) (-0.8592)
KY - PUR ** 4.975 0.74822 0.46648 -0.27356 0.5624 0.4749 19(0.0909) (2.577) (0.5423) (-1.060)
KY - MW 63.983 0.6774 -0.40115 -0.37702 0.4075 0.2889 19(0.8769) (2.169) (-0.3477) (-0.8993)
MI - C 46.362 0.7124 -0.33776 0.51998 0.3094 0.1713 19(1.105) (2.529) (-0.4099) (0.9605)
MI - EC 33.645 1.3381 -0.087447 0.79063 0.6995 0.6394 19(0.9666) (5.78) (-0.1301) (1.771)
MI - SW 57.557 0.88435 -0.52123 0.093666 0.4865 0.3838 19(1.543) (3.208) (-0.7884) (0.1458)
MI - SC 76.68 0.88382 -0.8258 0.013682 0.4688 0.3626 19(1.805) (3.181) (-1.081) (0.02038)
MI - SE 54.808 0.99427 -0.46167 0.36915 0.6047 0.5257 19(1.64) (4.657) (-0.7414) (0.6588)
MO - NE ** 76.348 0.74045 -0.58409 -0.51745 0.3678 0.2414 19(1.543) (2.953) (-0.7318) ( -1.294)

State / CRD Intercept Trend Temperature Precipitation R2 Adj. R2 Sample Size
49
MO - E 42.048 0.54152 -0.005345 -0.47311 0.4246 0.3095 19(0.9438) (2.516) (-0.007128) ( -1.783)
MO - SW 95.491 0.48229 -0.96776 -0.43828 0.4027 0.2832 19(2.16) (2.27) (-1.333) (-1.645)
MO - SC 38.84 0.58563 -0.10129 -0.38543 0.4907 0.3888 19(1.002) (3.128) (-0.1553) ( -1.670)
MO - SE ** 53.13 0.18257 0.0076974 -0.89689 0.3791 0.255 19(1.803) (0.8101) (0.01441) (-2.865)
OH - NW ** 11.227 0.88812 0.42239 0.55772 0.5406 0.4487 19(0.258) (4.883) (0.5589) (0.899)
OH - NC ** 14.405 0.95953 0.41396 0.0062829 0.6824 0.6188 19(0.4492) (6.564) (0.7199) (0.01602)
OH - NE ** 0.68114 0.88102 0.60395 -0.077001 0.7398 0.6877 19(0.0267) (8.242) (1.282) (-0.2230 )
OH - WC ** 30.901 0.92016 0.24147 -0.29203 0.6805 0.6166 19(0.9204) (6.548) (0.4161) (-0.9234)
OH - C ** 17.405 1.0137 0.4663 -0.5433 0.8358 0.803 19(0.6465) (11.11) (1.031) (-2.278)
Numbers in the parentheses are t-values.**Indicates error structures corrected for first order auto-correlation.

50
Table A4. Barley Yield Equation Parameter Estimates, by State
State / CRD Intercept TrendTemperature
DeviationPrecipitation
DeviationPrecipitation
Deviation squared R2 Adj. R2Number of
Observations ND - NC** 25.87* 0.72* -3.89* 4.1* -2.65* 0.71 0.68 34
(9.06) (5.64) (-3.31) (3.72) (-2.47) ND - NE 24.43* 1.15* -3.41* 3.26* -2.31 0.75 0.72 34
(8.48) (9) (-2.47) (2.72) (-1.65) ND - C 21.28* 0.93* -4.56* 5.37* -1.27 0.69 0.64 34
(7.73) (7.02) (-3.44) (4.25) (-1.34) ND - EC 27.2* 1.17* -3.57* 2.96* -2.27 0.76 0.72 34
(10.01) (9.09) (-2.67) (2.33) (-2.14) ND - SE 26.43* 0.92* -2.87* 5.49* -3.6 0.7 0.66 34
(9.66) (7.01) (-2.07) (3.56) (-3.83) MN - NW 12.51 0.94 5.15 0.65 -0.44 0.66 0.62 34
(1.59) (1.03) (2.92) (2.28) (-5.62) MN -WC
19.93 0.76 3.49 1.78 -0.4 0.69 0.65 34
(2.73) (3.83) (4.71) (1.79) (-5.3) MN - C 21.45 0.37 2.94 1.52 -0.08 0.48 0.4 34
(3.17) (3.5) (3.45) (1.67) (-2.79) SD - NC 22.5 0.31 1.19 2.03 0.06 0.45 0.37 34
(2.76) (2.3) (0.62) (0.59) (2.32) SD - NE 11.18 0.68 4.09 0.63 -0.25 0.56 0.5 34
(1.27) (1.01) (2.39) (1.77) (-4.23) SD - C 18.28 0.5 1.47 0.52 0 0.27 0.17 34
(1.81) (0.6) (0.03) (0.61) (2.94) Numbers in the parentheses are t-values.** Indicates error structure corrected for first order auto-correlation.
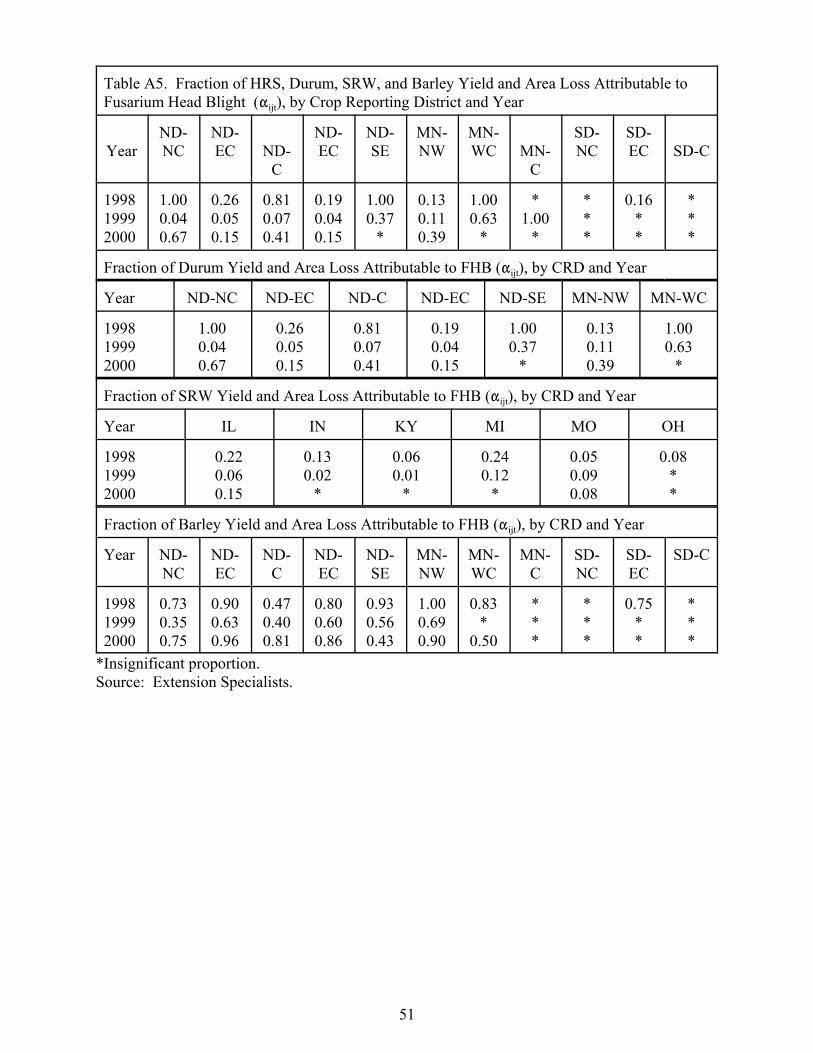
51
Table A5. Fraction of HRS, Durum, SRW, and Barley Yield and Area Loss Attributable toFusarium Head Blight ("ijt), by Crop Reporting District and Year
YearND-NC
ND-EC ND-
C
ND-EC
ND-SE
MN-NW
MN-WC MN-
C
SD-NC
SD-EC SD-C
199819992000
1.000.040.67
0.260.050.15
0.810.070.41
0.190.040.15
1.000.37
*
0.130.110.39
1.000.63
*
*1.00
*
***
0.16**
***
Fraction of Durum Yield and Area Loss Attributable to FHB ("ijt), by CRD and Year
Year ND-NC ND-EC ND-C ND-EC ND-SE MN-NW MN-WC
199819992000
1.000.040.67
0.260.050.15
0.810.070.41
0.190.040.15
1.000.37
*
0.130.110.39
1.000.63
*
Fraction of SRW Yield and Area Loss Attributable to FHB ("ijt), by CRD and Year
Year IL IN KY MI MO OH
199819992000
0.220.060.15
0.130.02
*
0.060.01
*
0.240.12
*
0.050.090.08
0.08**
Fraction of Barley Yield and Area Loss Attributable to FHB ("ijt), by CRD and Year
Year ND-NC
ND-EC
ND-C
ND-EC
ND-SE
MN-NW
MN-WC
MN-C
SD-NC
SD-EC
SD-C
199819992000
0.730.350.75
0.900.630.96
0.470.400.81
0.800.600.86
0.930.560.43
1.000.690.90
0.83*
0.50
***
***
0.75**
***
*Insignificant proportion. Source: Extension Specialists.
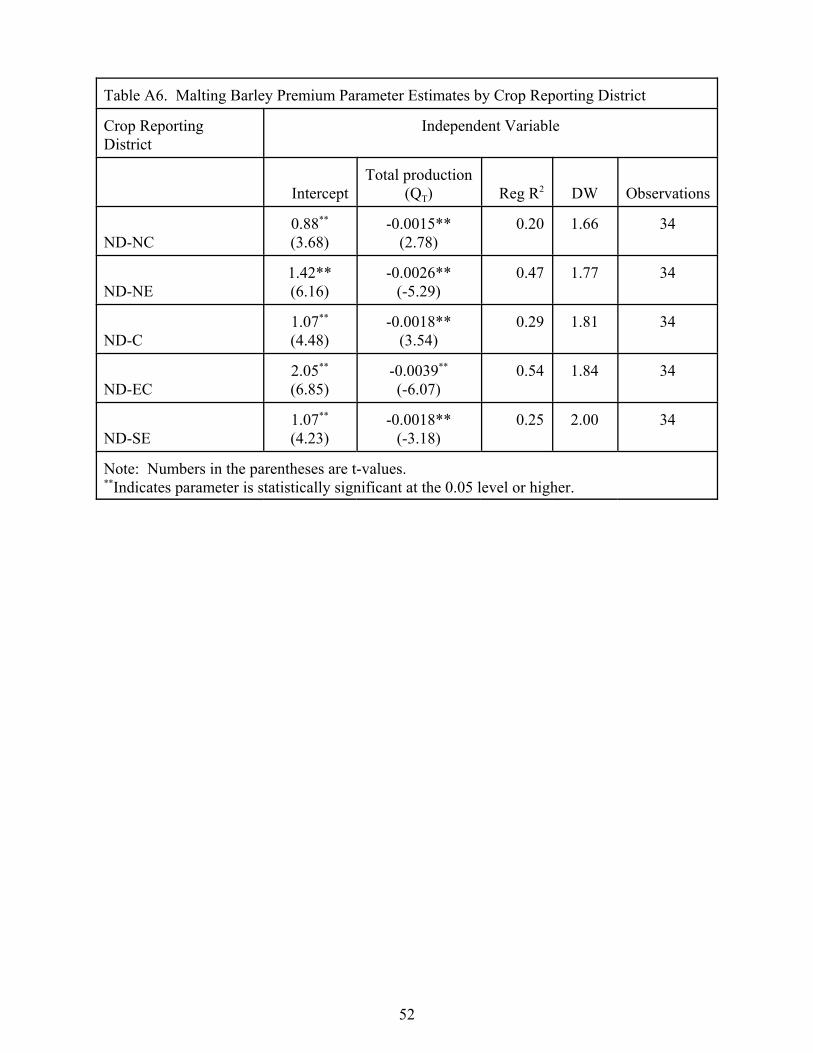
52
Table A6. Malting Barley Premium Parameter Estimates by Crop Reporting District
Crop ReportingDistrict
Independent Variable
InterceptTotal production
(QT) Reg R2 DW Observations
ND-NC0.88**
(3.68)-0.0015**
(2.78)0.20 1.66 34
ND-NE1.42**(6.16)
-0.0026**(-5.29)
0.47 1.77 34
ND-C1.07**
(4.48)-0.0018**
(3.54)0.29 1.81 34
ND-EC2.05**
(6.85)-0.0039**
(-6.07)0.54 1.84 34
ND-SE1.07**
(4.23)-0.0018**
(-3.18)0.25 2.00 34
Note: Numbers in the parentheses are t-values.**Indicates parameter is statistically significant at the 0.05 level or higher.

53
Table A7. Feed Grain Barley Parameter Estimates by Crop Reporting District
CropReportingDistrict
Independent Variable
InterceptCornprice(PC)
Totalproduction
(QT) Reg R2 DW Observations
ND-NC0.24
(1.19)0.78*
(17.75)-0.0009*(-2.07)
0.91 1.94 34
ND-NE0.28
(1.48)0.75*
(18.18)-0.0008*(-2.10)
0.92 1.93 34
ND-C0.21
(1.19)077*
(19.81)-0.0007**
(2.00)0.93 1.91 34
ND-EC0.22
(1.13)0.75*
(17.42)-0.0006(-1.39)
0.91 1.87 34
ND-SE0.21 0.78*
(17.49)-0.0007**
(-1.76)0.91 1.91 34
Note: Numbers in the parentheses are t-values.*Indicates parameter is statistically significant at the 0.05 level or higher.**Indicates parameter is statistically significant at the 0.10 level.