economic importance of the dutch non-commercial small ... · economic importance of the dutch...
TRANSCRIPT

I
Economic importance of the Dutch non-commercial small-scale fleet Heleen Bartelings Hans van Oostenbrugge Project number 30834 January 2007 Report 8.07.01 LEI, The Hague

II
The Agricultural Economics Research Institute (LEI) is active in a wide array of research which can be classified into various domains. This report reflects research within the fol-lowing domain:
Statutory and service tasks Business development and competitive position Natural resources and the environment Land and economics Chains Policy Institutions, people and perceptions Models and data

III
Economic importance of the Dutch non-commercial small-scale fleet Bartelings, H. and H. van Oostenbrugge The Hague, LEI, 2007 Report 8.07.01; ISBN/EAN: 978-90-8615-123-3 Price €11 (including 6% VAT) 48 pp., fig., tab., app. This paper describes the characteristics, costs and revenues of the so-called non-commercial small-scale fleet based on a survey sent to all the skippers owning a vessel that according to the LEI definition falls within the category of non-commercial small-scale fisheries. With this data the economic importance of this part of the fleet can be deter-mined. Orders: Phone: 31.70.3358330 Fax: 31.70.3615624 E-mail: [email protected] Information: Phone: 31.70.3358330 Fax: 31.70.3615624 E-mail: [email protected] © LEI, 2007 Reproduction of contents, either whole or in part:
permitted with due reference to the source not permitted
The General Conditions of the Agricultural Research Department apply to all our research commissions. These are registered with the Central Gelderland Chamber of Commerce in Arnhem.

IV

5
Contents Page Preface 7 Summary 9 Samenvatting 11 1. Introduction 13 2. Response per segment 15 3. Results survey: effort and landings 20 4. Average economic performance per vessel 25 4.1 Gross annual revenue and investment value vessel 25 4.2 Technical costs 26 4.3 Crew costs and employment 28 4.4 Investment value of the vessel and financing 30 5. Total economic importance non-commercial small-scale fleet 32 5.1 Aggregation procedure 32 5.2 Total revenue 31 5.3 Technical costs 33 5.4 Crew costs and employment 35 5.5 Total investment value 36 6. Discussion 38 References 41 Appendix 1. Survey 43 2. Number of vessels that used a certain fishing technique per segment (in percentages) 46 3. Target species per segment (in percentages) 47

6

7
Preface This report describes the economic importance of the non-commercial small-scale fishery in the Netherlands. In the ongoing developments in fisheries science in Europe, there is a growing awareness of the importance of economic research and particularly the importance of economic data. An important goal of economic research is to provide economic incen-tives for the development of fisheries that are sustainable in ecological, economical and social terms. However, within the European fishing fleets, both large-scale economically oriented fishing companies, and non-commercial small-scale fishermen operate. For these two extreme groups and all others in between, incentives to either join the fishing fleet or change fishing behaviour might be very different and therefore different economic and so-cial paradigms might apply. In addition, although the non-commercial small-scale fishermen might not have a large impact on the ecological sustainability of many fisheries, or on national economic performance, they are of importance to many local economies. In the Netherlands, economic research so far has concentrated on the commercial large-scale fishing fleet, although it has been an ongoing struggle to define who is included in this population. As of 2002 the European Commission has defined this population as all vessels included in the vessel register, which resulted in a doubling of the number of vessels for which data had to be gathered. Several discussions have since been held on the distinction between the so-called fully active and less active fishermen, or commercial and non-commercial fishermen; however, this definitional problem remains unresolved. I hope that this report will provide a better understanding of the economic importance of these non-commercial small-scale fisheries and that it will be instrumental within the discussion on the definitions of commercial fisheries.
Dr. J.C. Blom General Manager LEI B.V.

8

9
Summary From 2002 onwards the Netherlands are obliged to gather data on all fishing activities within the framework of the European Data Collection Plan (EU regulation 2001/1639). According to this regulation economic data have to be gathered for all registered fishing vessels irrespective of their activities. Because of this demand, LEI has gathered economic data about vessels that are left out of the regular data collection routine, the so-called com-mercially less active vessels (about 360 vessels). This year, data for the years 2004 and 2005 for this part of the fleet has been collected by means of a survey. The survey has been sent to all the skippers owning a vessel that according to the LEI definition falls into the category non-commercial small-scale fisheries. This paper describes the characteristics, costs and revenues of the so-called non-commercial small-scale fleet and determines the economic importance of this part of the fleet. The main conclusion that can be drawn from this analysis is that the economic impact of the non-commercial small-scale fleet is very limited. Although the non-commercial small-scale fleet represents about 50% of the vessels in the Dutch fleet, they add only about 1% to both the revenue and the total costs of the Dutch fleet. Moreover, the results show that the non-commercial small-scale fleet is a very heterogeneous group of vessels, making it difficult to make a reliable estimation of the total costs and revenue. However, the number of people involved in this sector of the fleet is high (although not if calculated in FTEs). Therefore some further research into why these people consider fisheries as their main profession and whether they have any other means of income (as their average gross annual income is very low) would be interesting.

10
11
Samenvatting Sinds 2002 is Nederland verplicht om te rapporteren over alle visserij activiteiten. Dit is gebaseerd op het Europese data collectie plan (EU-regulatie 2001/1639). Volgens het Eu-ropese data collectie plan moet data verzameld worden over alle visserij schepen, onafhankelijk van de intensiteit van de visserij activiteiten die zij ondernemen. Daarom heeft het LEI economische data verzameld over schepen die buiten de reguliere data-inzameling worden gelaten, de zogenoemde commercieel minder actieve schepen (onge-veer 360 schepen). Dit jaar is er een enquête rondgestuurd naar alle schippers van schepen die volgens de LEI-definitie binnen de niet commerciële kleinschalige vloot vallen. Hier-mee is voor de jaren 2004 en 2005 data verzameld. Dit rapport beschrijft de karakteristieken, kosten en baten van de zogenoemde niet-commerciële kleinschalige vloot. Op basis hiervan kan de economische impact van dit deel van de visserij vloot be-paald worden. De belangrijkste conclusie die getrokken kan worden uit deze analyse is dat de eco-nomische impact van dit deel van de vloot zeer gering is. Hoewel circa 50% van de Nederlandse vloot als niet commercieel, kleinschalig kan worden aangewezen, is het aan-deel van dit gedeelte van de vloot in de totale kosten en opbrengsten slechts circa 1%. Daarnaast laten de resultaten zien dat de niet commerciële kleinschalige vloot bestaat uit een groep zeer heterogene schepen. Hierdoor wordt het zeer lastig om een betrouwbare schatting te geven van de totale kosten en opbrengsten in dit deel van de vloot. Daarentegen is het aantal mensen dat werkzaam is in dit gedeelte van de vloot hoog (alhoewel dit niet het geval is indien gemeten in FTE's). Nader onderzoek in of visserij het hoofdberoep is voor deze mensen en of zij nog andere bronnen van inkomsten hebben, zou interessant zijn.

12

13
1. Introduction From 1946 LEI has gathered economic data from the Dutch fishing fleet for the Ministry of Agriculture, Nature and Food Quality. The extent to which the data have been gathered (fleets involved) has depended on the questions by the ministry and the co-operation by the fishermen, which has been good for most of the fleet and decades. In all these years the ba-sic assumption of the data collection programme has been that the population from which the data were gathered and which the LEI figures represented were the vessels that were commercially fishing. However, the question which vessel is 'commercially fishing' and which is not has been a struggle for many years. Many different criteria have been used to define the activity level; vessel type, effort, landings, income, and in many cases the deci-sion on the level of activity of an individual vessel was mainly based on expert knowledge on the fishing operation. As from 2003 onwards a threshold of 50,000 gross income is used to distinguish between commercial large-scale and non-commercial small-scale fleet. This terminology is also used in this report. Besides, LEI did not collect economic information on shellfish vessels, and therefore these vessels are also included in this study. Despite the fact that the term non-commercial small-scale does not really refer to these vessels, they are included in here for practical reasons. From 2002 onwards the Netherlands are obliged to gather data on all fishing activi-ties within the framework of the European Data Collection Plan (EU regulation 2001/1639). According to this regulation economic data have to gathered for all registered fishing vessels irrespective of there activities. Because of this demand, LEI is working on gathering economic data about vessels that are left out of the regular data collection rou-tine, the so-called commercially less active vessels. This year, data for the years 2004 and 2005 for this part of the fleet has been collected by means of a survey (appendix 1). The survey has been send to all the skippers owning a vessel that according to the LEI defini-tion falls into the category non-commercial small-scale. Information on effort and landings was retained from the official landings database (VIRIS). In this database information is available on effort and landings for all vessels that have to fill in a European log-book. In The Netherlands, also captains of vessels less than 10 m have to fill in a logbook to prove that they are operating on a commercial basis. For these vessels, even landings less than 50 kg have to be reported, in contrast with the EU logbook regulation that requires only land-ings over 50 kg per species and trip to be recorded. Oostenbrugge (2006) made a preliminary analysis of the economic importance of the non-commercial small-scale fleet based on data about landings and technical characteris-tics of the vessels. In this report we will further investigate this economic importance using the results of the survey. Table 1.1 shows which part of the fleet belongs to the so-called non-commercial small-scale fleet. Most of the vessels fishing with passive gear, pots and traps, polyvalent gears and dredges belong to the non-commercial small-scale fleet. Almost half of all the demersal trawls and seiners and the pelagic trawls and seiners belong to the non-

14
commercial small scale sector. Only a small percentage of the beam trawlers are consid-ered to be part of the non-commercial small-scale fleet. Table 1.1 Number of vessels in the total fleet and the non-commercial small-scale fleet per segment Total Non-commercial Non-commercial (N) small-scale small-scale (N) (%) ⎯⎯⎯⎯⎯⎯⎯ ⎯⎯⎯⎯⎯⎯⎯ ⎯⎯⎯⎯⎯⎯⎯ 2004 2005 2004 2005 2004 2005 Beam trawl 377 344 46 48 12.2 14.0 Demersal trawls and seiners 64 51 31 26 48.4 51.0 Pelagic trawls and seiners 36 33 17 16 47.2 48.5 Dredges 45 42 42 39 93.3 92.9 Passive gear (<12 meter) 193 216 189 208 97.9 96.3 Drift and fixed nets 19 20 15 14 78.9 70.0 Pots and traps 9 10 9 10 100.0 100.0 Polyvalent gears 12 11 9 9 75.0 81.8 Total sea fisheries 755 727 358 370 47.4 50.9 Aquaculture and inshore fisheries 104 102 Total fleet 859 829 Note that dredges are not required to register catches and therefore are missing in the VIRIS dataset. Thus although they have a high gross annual revenue, they are registered as non-commercial small-scale due to missing data. Therefore, these vessels are also included in this study. Comparing 2004 and 2005, it seems that part of the commercial large-scale fleet is shifting to the non-commercial small-scale fleet. This section of the fleet has increased with 12 vessels (3%) while the total fleet decreased with 28 vessels (4%).

15
2. Response per segment As mentioned in the previous section, a survey was sent to all vessels belonging to the non-commercial small scale fleet. In this section, an overview of the response per segment is shown. Besides that it will be investigate whether the response has a good coverage of the different segments in the non-commercial small sale fishing fleet. Overall response Table 2.1 shows the response in the different segments. The overall coverage of the re-sponse is good. In most segments the coverage of the response is above 30%. The response of dredges is very low, only about 4%. Table 2.1 Number of vessels per segment in the non-commercial small-scale fleet and the response per
segment (as a percentage) Segment Length 2004 2005 ⎯⎯⎯⎯⎯⎯⎯⎯ ⎯⎯⎯⎯⎯⎯⎯⎯ N response N response (%) (%) Beam trawl 0-12 meter 23 43.5 21 38.1 12-24 meter 20 50.0 22 36.4 24-40 meter 3 33.3 4 0.0 Demersal trawls and seiners 0-12 meter 22 36.4 19 42.1 12-24 meter 7 28.6 4 0.0 24-40 meter 2 100.0 3 66.7 Pelagic trawls and seiners 12-24 meter 17 47.1 16 50.0 Dredges 24-40 meter 24 0.0 20 5.0 >40 meter 18 5.6 19 5.3 Passive gear (<12 m) 0-12 meter 189 33.9 206 31.6 Drift and fixed nets 12-24 meter 15 20.0 14 28.6 Pots and traps 12-24 meter 9 33.3 10 20.0 Polyvalent gears 12-24 meter 9 11.1 9 22.2 Total All 358 31.6 367 29.7 Considering table 2.1 the segments 'Beam trawl 24-40 meter', 'Demersal trawls and seiners 12-24 meter', 'dredges 24-40 meter' and 'dredges >40 meter' have an inadequate re-sponse. For the first two segments this is not as problem as the number of vessels is small compared to the number of commercial vessels in these segments. The response in the other sectors can be considered adequate and the survey should be representative for these segments.
16
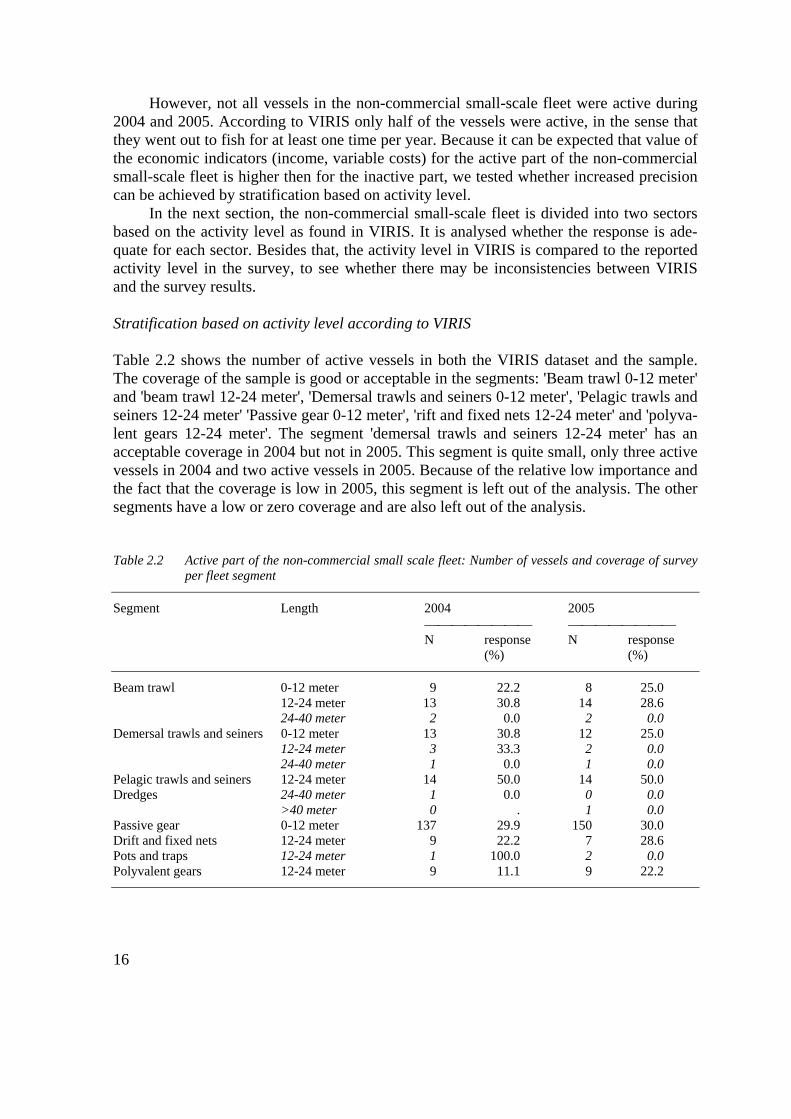
However, not all vessels in the non-commercial small-scale fleet were active during 2004 and 2005. According to VIRIS only half of the vessels were active, in the sense that they went out to fish for at least one time per year. Because it can be expected that value of the economic indicators (income, variable costs) for the active part of the non-commercial small-scale fleet is higher then for the inactive part, we tested whether increased precision can be achieved by stratification based on activity level. In the next section, the non-commercial small-scale fleet is divided into two sectors based on the activity level as found in VIRIS. It is analysed whether the response is ade-quate for each sector. Besides that, the activity level in VIRIS is compared to the reported activity level in the survey, to see whether there may be inconsistencies between VIRIS and the survey results. Stratification based on activity level according to VIRIS Table 2.2 shows the number of active vessels in both the VIRIS dataset and the sample. The coverage of the sample is good or acceptable in the segments: 'Beam trawl 0-12 meter' and 'beam trawl 12-24 meter', 'Demersal trawls and seiners 0-12 meter', 'Pelagic trawls and seiners 12-24 meter' 'Passive gear 0-12 meter', 'rift and fixed nets 12-24 meter' and 'polyva-lent gears 12-24 meter'. The segment 'demersal trawls and seiners 12-24 meter' has an acceptable coverage in 2004 but not in 2005. This segment is quite small, only three active vessels in 2004 and two active vessels in 2005. Because of the relative low importance and the fact that the coverage is low in 2005, this segment is left out of the analysis. The other segments have a low or zero coverage and are also left out of the analysis. Table 2.2 Active part of the non-commercial small scale fleet: Number of vessels and coverage of survey
per fleet segment Segment Length 2004 2005 ⎯⎯⎯⎯⎯⎯⎯⎯ ⎯⎯⎯⎯⎯⎯⎯⎯ N response N response (%) (%) Beam trawl 0-12 meter 9 22.2 8 25.0 12-24 meter 13 30.8 14 28.6 24-40 meter 2 0.0 2 0.0 Demersal trawls and seiners 0-12 meter 13 30.8 12 25.0 12-24 meter 3 33.3 2 0.0 24-40 meter 1 0.0 1 0.0 Pelagic trawls and seiners 12-24 meter 14 50.0 14 50.0 Dredges 24-40 meter 1 0.0 0 0.0 >40 meter 0 . 1 0.0 Passive gear 0-12 meter 137 29.9 150 30.0 Drift and fixed nets 12-24 meter 9 22.2 7 28.6 Pots and traps 12-24 meter 1 100.0 2 0.0 Polyvalent gears 12-24 meter 9 11.1 9 22.2

17
Table 2.3 shows the coverage of the survey for the inactive vessels in the non-commercial small-scale fleet. In accordance with the original assumption that the coverage of the survey could vary according to the activity level, it is clear that apart from some small segments (in terms of the number of vessels) the coverage of the survey is poor for the inactive part of the fleet. It is clear that most of the inactive vessels did not respond to the survey. Therefore, the results of this survey can not be considered representative for the inactive part of the non-commercial small-scale fleet. Table 2.3 Inactive part of the non-commercial small scale fleet: Number of vessels and coverage of sur-
vey per fleet segment Segment Length 2004 2005 ⎯⎯⎯⎯⎯⎯⎯⎯ ⎯⎯⎯⎯⎯⎯⎯⎯ N response N response (%) (%) Beam trawl 0-12 meter 14 14.3 13 15.4 12-24 meter 7 42.9 8 37.5 24-40 meter 1 100.0 2 0.0 Demersal trawls and seiners 0-12 meter 9 0.0 7 0.0 12-24 meter 4 25.0 2 0.0 24-40 meter 1 100.0 2 50.0 Pelagic trawls and seiners 12-24 meter 3 0.0 2 0.0 Dredges 24-40 meter 23 0.0 20 0.0 >40 meter 18 0.0 18 0.0 Passive gear (<12 m) 0-12 meter 52 1.9 56 0.0 Drift and fixed nets 12-24 meter 6 66.7 7 0.0 Pots and traps 12-24 meter 8 0.0 8 0.0 Polyvalent gears 12-24 meter 0 0 0.0 Inconsistency between VIRIS and survey results Stratification based on activity level revealed some inconsistencies between the survey re-sults and the results as found in the VIRIS dataset. Table 2.4 shows a comparison between activity in VIRIS and in the survey. Noticeable is that 31 respondents called themselves ac-tive in 2004 and 2005 but no landings were registered in VIRIS. Thus estimates of activity based on VIRIS data are underestimating the activity level. Table 2.5 shows the underestimation of the active vessels per segment. For example, according to VIRIS, about 40% of the vessels in the segment Beam trawl 0-12 meter are active. According to the sample however, about 60% of the vessels in this segment should be considered active. The underestimation of the activity level is especially high in the segments 'Beam trawl 0-12 meter' and 'Pots and traps 12-24 meter'.

18
Table 2.4 Comparison between activity level in VIRIS and survey (number of vessels) Survey VIRIS 2004 2005 Not active Active 7 7 Active Not active 31 31 Active Active 63 65 Not active Not active 12 6 Total 113 109 Table 2.5 Comparison between activity level according to VIRIS and survey per fleet segment Segment Length 2004 2005 ⎯⎯⎯⎯⎯⎯⎯⎯⎯ ⎯⎯⎯⎯⎯⎯⎯⎯⎯ according- active active active to VIRIS according according according (%) to survey (%) to VIRIS (%) to survey (%) Beam trawl 0-12 meter 39.1 60.9 38.1 57.1 12-24 meter 65.0 75.0 63.6 68.2 24-40 meter 66.7 66.7 50.0 50.0 Demersal trawls and seiners 0-12 meter 59.1 68.2 63.2 84.2 12-24 meter 42.9 42.9 50.0 50.0 24-40 meter 50.0 50.0 33.3 33.3 Pelagic trawls and seiners 12-24 meter 72.7 81.8 87.5 93.8 Dredges 24-40 meter 0.0 0.0 0.0 5.0 >40 meter 5.3 10.5 5.3 10.5 Passive gear (<12 m) 0-12 meter 73.1 81.9 72.8 80.1 Drift and fixed nets 12-24 meter 62.5 68.8 50.0 64.3 Pots and traps 12-24 meter 11.1 33.3 20.0 40.0 Polyvalent gears 12-24 meter 100.0 100.0 100.0 100.0 Total All 59.2 67.9 60.5 68.9 Conclusion coverage survey results The response to the survey was good. About 30% of all surveys were returned. To increase the precision of the survey results, a stratification based on activity level was used. The non-commercial small-scale fleet is divided into two segments based on data available in VIRIS: an active segment, which went to sea at least once in a year and an inactive seg-ment. The overall coverage of the active part of the non-commercial small-scale fleet is good. In the rest of the analysis we will take the following segments into account: 'Beam trawl 0-12 meter', 'beam trawl 12-24 meter', 'Demersal trawls and seiners 0-12 meter', 'pe-lagic trawls and seiners 12-24 meter', 'Passive gear 0-12 meter', 'drift and fixed nets 12-24 meter', 'pots and traps 12-24 meter', 'polyvalent gear 12-24 meter'.

19
The coverage of the survey regarding the inactive part of the non-commercial small-scale fleet is poor. This survey cannot be considered representative for this part of the non-commercial small-scale fleet. VIRIS underestimates the activity level of the non-commercial small-scale fleet. The number of active vessels in the fleet should be corrected. This is done in section 5.1.

20
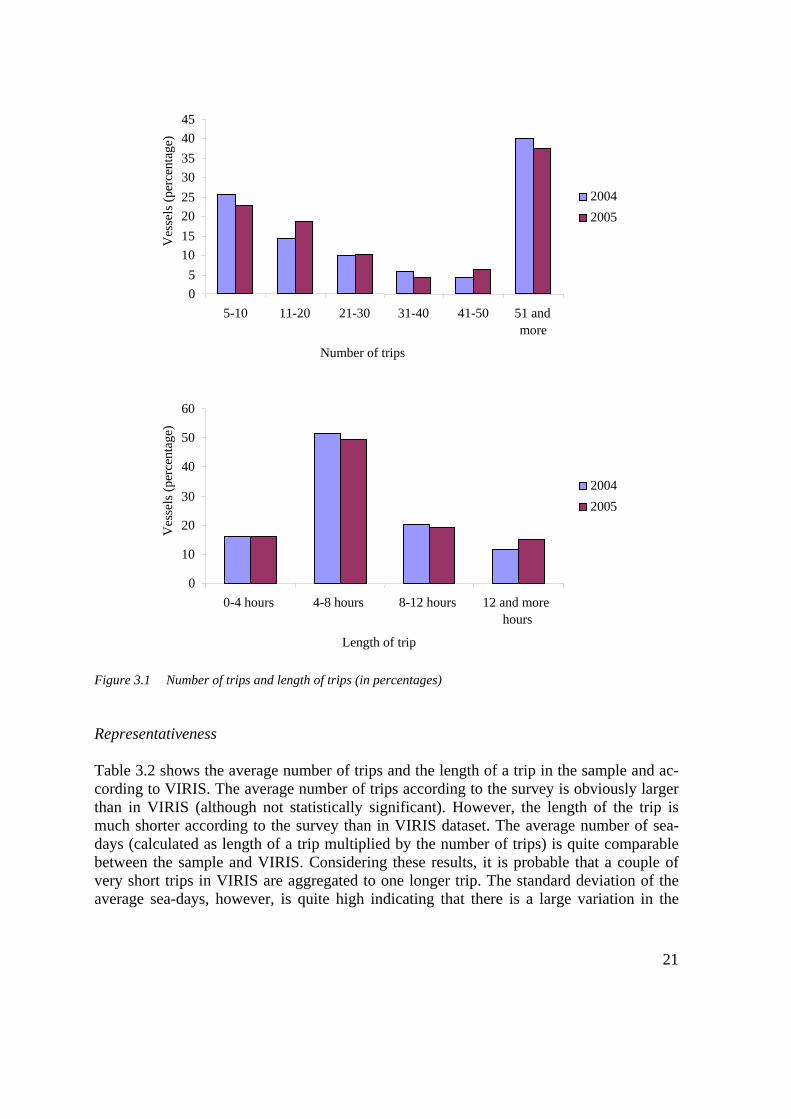
3. Results survey: effort and landings Results Survey About 80% of the respondents said that they were active in 2004 and/or 2005 (see table 3.1). The activity levels are relatively low in the segments 'beam trawl 0-12 meter' and 'beam trawl 12-24 meter', respectively 30 and 41.7% were not active in these segments. The activity levels are high in the segments 'pelagic trawls and seiners 12-24 meter', 'drift nets and fixed nets 12-24 meter' and 'polyvalent gears 12-24 meter'. All respondents in these segments were active in both 2004 and 2005. Of course it should be kept in mind that these segments are relatively small and therefore had only few respondents. One vessel in the segment 'Passive gear 0-12 meter' mentioned that it was only used to transport fish caught by other ships (category 'transport ship' in table). Table 3.1 shows that the segments can be considered homogenous over time. Most of the vessels were either active in 2004 and 2005 or inactive in those years. Only a small number of vessels were active in only one of these years. Table 3.1 Response survey divided in activity level per segment (in percentages) Segment Length Active in Only ac- Only ac- Not ac- Trans- 2004-2005 tive in tive in tive port 2004 2005 vessel Beam trawl 0-12 meter 70.0 0.0 0.0 30.0 0.0 12-24 meter 54.5 0.0 0.0 45.5 0.0 Demersal trawls and seiners 0-12 meter 50.0 8.3 16.7 25.0 0.0 Pelagic trawls and seiners 12-24 meter 100.0 0.0 0.0 0.0 0.0 Passive gear 0-12 meter 89.1 1.6 3.1 4.7 1.6 Drift and fixed nets 12-24 meter 100.0 0.0 0.0 0.0 0.0 Pots and traps 12-24 meter 66.7 33.3 0.0 0.0 0.0 Polyvalent gears 12-24 meter 100.0 0.0 0.0 0.0 0.0 Total All 80.4 2.7 3.6 12.5 0.9 Figure 3.1 shows that 40% of the respondents who were active in 2004 have been to sea more than 51 times. The length of a sea trip was relatively short, Most of the respondents (about 70%) answered that the trips they made were short (0-4 or 4-8 hours). Results show the same pattern for 2005.
21
Figure 3.1 Number of trips and length of trips (in percentages) Representativeness Table 3.2 shows the average number of trips and the length of a trip in the sample and ac-cording to VIRIS. The average number of trips according to the survey is obviously larger than in VIRIS (although not statistically significant). However, the length of the trip is much shorter according to the survey than in VIRIS dataset. The average number of sea-days (calculated as length of a trip multiplied by the number of trips) is quite comparable between the sample and VIRIS. Considering these results, it is probable that a couple of very short trips in VIRIS are aggregated to one longer trip. The standard deviation of the average sea-days, however, is quite high indicating that there is a large variation in the
05
1015202530354045
5-10 11-20 21-30 31-40 41-50 51 andmore
Number of trips
Ves
sels
(per
cent
age)
2004 2005
0
10
20
30
40
50
60
0-4 hours 4-8 hours 8-12 hours 12 and morehours
Length of trip
Ves
sels
(per
cent
age)
2004 2005
22
number of sea-days between different vessels or segments, which makes it hard to show differences statistically. If we compare VIRIS data about the vessels that answered the survey and those that did not, it is noticeable that the vessels that did answer the survey spend on average a longer time at sea. Possibly the more active vessels were higher motivated to return the survey. However, since the standard deviation is quite large it is questionable how much information can be distinguished from the average amount of sea-days for the total fleet. Table 3.2 Average number of trips and sea days (survey and VIRIS) 2004 2005 ⎯⎯⎯⎯⎯⎯⎯⎯⎯⎯⎯ ⎯⎯⎯⎯⎯⎯⎯⎯⎯⎯⎯ mean std. dev. N mean std. dev. N Results survey: - number of trips 31.9 20.8 86 31.8 20.2 90 - length of trip (in days) 0.3 0.3 89 0.4 0.3 93 - number of sea-days 11.4 11.4 85 11.5 11.6 90 VIRIS (only vessels in survey): - number of trips 20.7 26.3 63 19.8 25.2 65 - length of trip (in days) 1.2 1.7 63 1.0 1.5 65 - number of sea-days 14.4 21.7 63 14.1 21.3 65 VIRIS (only vessels not in survey): - number of trips 13.7 20.9 143 14.8 19.1 153 - length of trip (in days) 0.9 1.5 143 0.8 1.1 153 - number of sea-days 9.9 26.2 142 10.5 27.5 151 Table 3.3 Average number of sea-days per segment (survey and VIRIS) Segment Length Survey results VIRIS VIRIS (vessels in (vessels not in survey survey) ⎯⎯⎯⎯⎯ ⎯⎯⎯⎯⎯ ⎯⎯⎯⎯⎯ 2004 2005 2004 2005 2004 2005 Beam trawl 0-12 meter 5.3 2.3 0.5 1.1 1.5 0.9 12-24 meter 9.8 8.5 19.9 19.6 38.8 34.3 Demersal trawls and seiners 0-12 meter 6.7 4.9 3.4 3.5 2.4 2.7 Pelagic trawls and seiners 12-24 meter 12.4 13.6 12.8 12.7 4.4 5.3 Passive gear 0-12 meter 11.9 11.5 15.7 15.2 7.7 9.8 Drift and fixed nets 12-24 meter 20.1 18.5 32.4 22.8 9.9 10.9 Pots and traps 12-24 meter 13.8 13.8 7.0 0.2 Polyvalent gears 12-24 meter 13.8 34.4 7.5 3.1 20.0 9.2 Total All 11.3 11.4 14.4 14.1 9.9 10.6
23
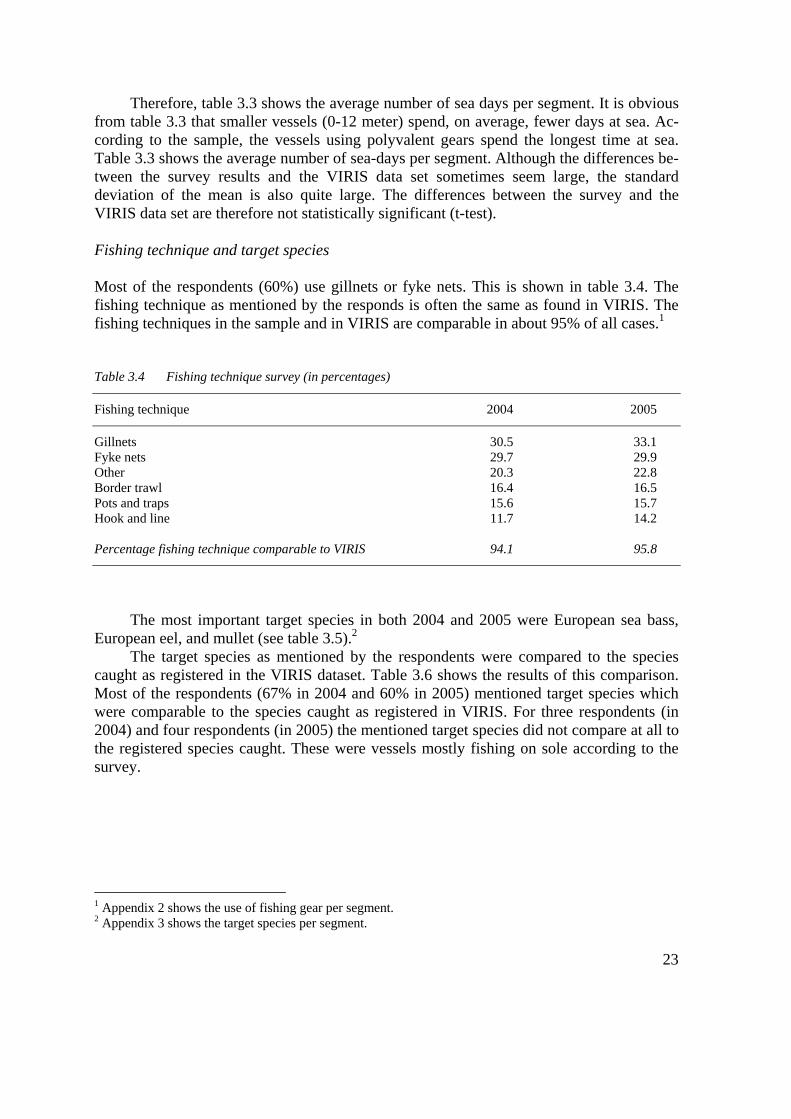
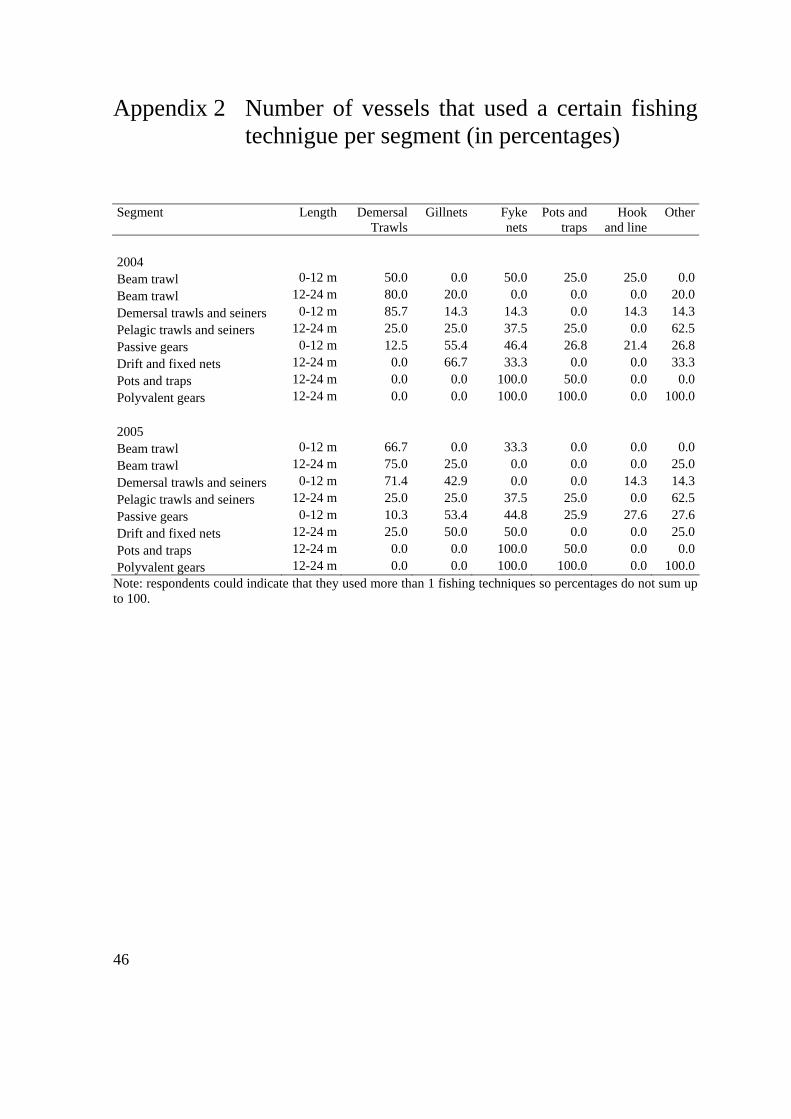
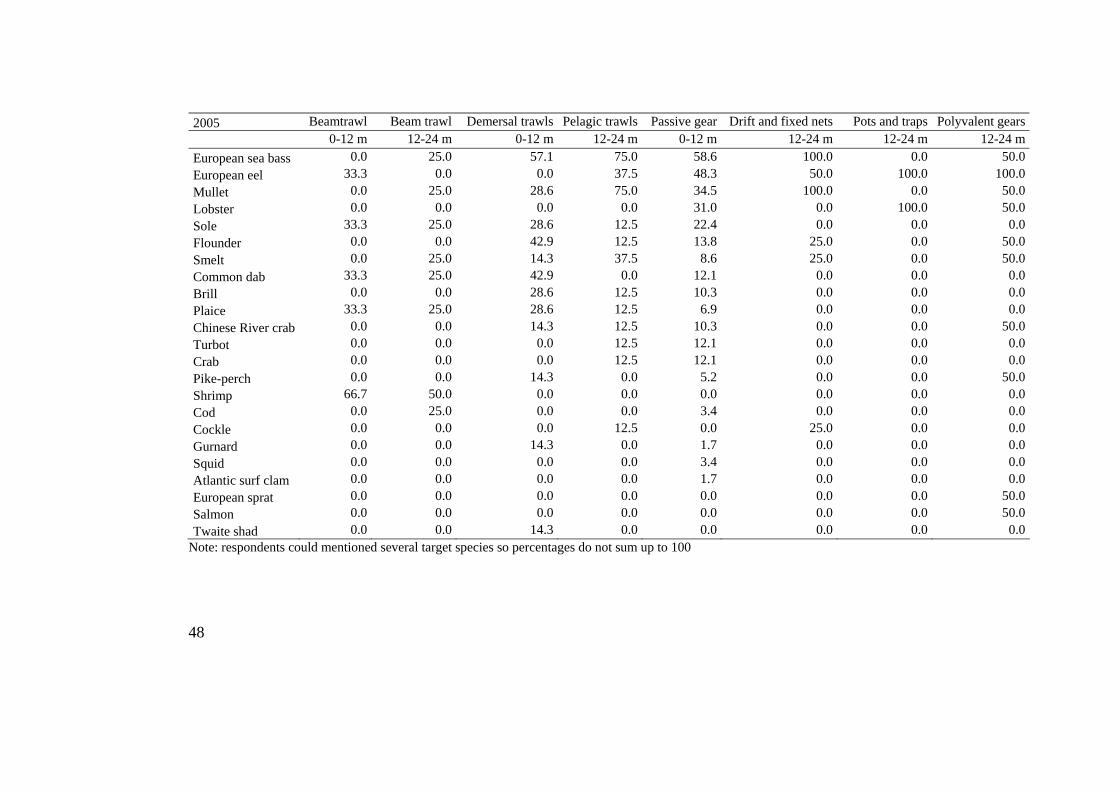
Therefore, table 3.3 shows the average number of sea days per segment. It is obvious from table 3.3 that smaller vessels (0-12 meter) spend, on average, fewer days at sea. Ac-cording to the sample, the vessels using polyvalent gears spend the longest time at sea. Table 3.3 shows the average number of sea-days per segment. Although the differences be-tween the survey results and the VIRIS data set sometimes seem large, the standard deviation of the mean is also quite large. The differences between the survey and the VIRIS data set are therefore not statistically significant (t-test). Fishing technique and target species Most of the respondents (60%) use gillnets or fyke nets. This is shown in table 3.4. The fishing technique as mentioned by the responds is often the same as found in VIRIS. The fishing techniques in the sample and in VIRIS are comparable in about 95% of all cases.1 Table 3.4 Fishing technique survey (in percentages) Fishing technique 2004 2005 Gillnets 30.5 33.1 Fyke nets 29.7 29.9 Other 20.3 22.8 Border trawl 16.4 16.5 Pots and traps 15.6 15.7 Hook and line 11.7 14.2 Percentage fishing technique comparable to VIRIS 94.1 95.8 The most important target species in both 2004 and 2005 were European sea bass, European eel, and mullet (see table 3.5).2 The target species as mentioned by the respondents were compared to the species caught as registered in the VIRIS dataset. Table 3.6 shows the results of this comparison. Most of the respondents (67% in 2004 and 60% in 2005) mentioned target species which were comparable to the species caught as registered in VIRIS. For three respondents (in 2004) and four respondents (in 2005) the mentioned target species did not compare at all to the registered species caught. These were vessels mostly fishing on sole according to the survey.
1 Appendix 2 shows the use of fishing gear per segment. 2 Appendix 3 shows the target species per segment.

24
Table 3.5 Target species survey (percentages) Fish species 2004 2005 European sea bass 50.5 55.8 European eel 42.9 41.1 Mullet 36.3 36.8 Sole 20.9 20.0 Lobster 20.9 21.1 Flounder 14.3 14.7 Smelt 12.1 12.6 Common dab 12.1 12.6 Brill 9.9 10.5 Chinese river crab 9.9 9.5 Turbot 8.8 9.5 Crab 7.7 8.4 Pike-perch 7.7 6.3 Plaice 6.6 9.5 Shrimp 5.5 5.3 Cockle 4.4 4.2 Cod 4.4 3.2 Squid 3.3 2.1 Atlantic surf clam 1.1 2.1 Roach 1.1 1.1 Gurnard 1.1 2.1 Salmon 1.1 1.1 European sprat 0.0 1.1 Pod razor shell 0.0 0.0 Twaite shad 0.0 1.1 Table 3.6 Comparison between target species (in survey) and species caught (in VIRIS): percentage of
vessels Comparison target species and actual catch VIRIS 2004 2005 0%-20% of target species were equal to VIRIS 11.5 12.3 20%-60% of target species were equal to VIRIS 21.3 27.7 60%-100% of target species were equal to VIRIS 67.2 60.0 Conclusion representativeness of the sample The representativeness of the sample is quite good. Although there might be differences in the number of trips and the length of the trips, the average number of sea-days as found in the survey is comparable to the number of sea-days as found in the VIRIS dataset. The fishing techniques and target species as mentioned by the respondents are also comparable to the known data as found in VIRIS.
25
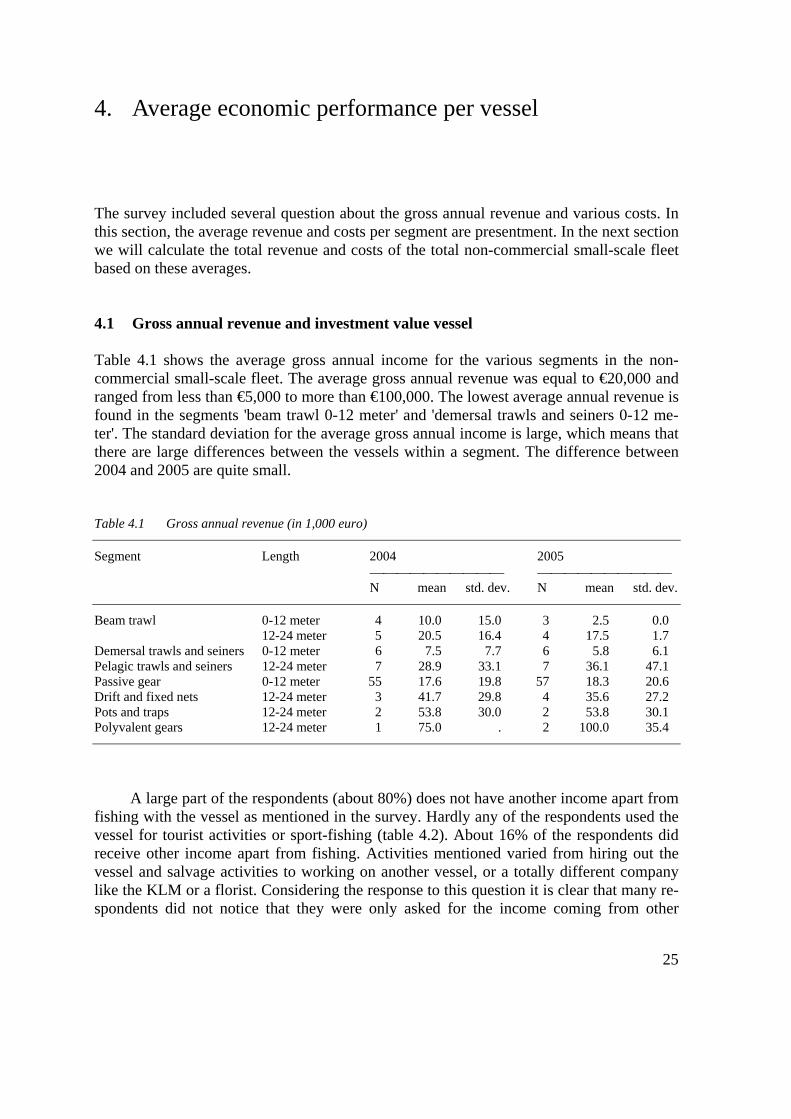
4. Average economic performance per vessel The survey included several question about the gross annual revenue and various costs. In this section, the average revenue and costs per segment are presentment. In the next section we will calculate the total revenue and costs of the total non-commercial small-scale fleet based on these averages. 4.1 Gross annual revenue and investment value vessel Table 4.1 shows the average gross annual income for the various segments in the non-commercial small-scale fleet. The average gross annual revenue was equal to €20,000 and ranged from less than €5,000 to more than €100,000. The lowest average annual revenue is found in the segments 'beam trawl 0-12 meter' and 'demersal trawls and seiners 0-12 me-ter'. The standard deviation for the average gross annual income is large, which means that there are large differences between the vessels within a segment. The difference between 2004 and 2005 are quite small. Table 4.1 Gross annual revenue (in 1,000 euro) Segment Length 2004 2005 ⎯⎯⎯⎯⎯⎯⎯⎯⎯⎯ ⎯⎯⎯⎯⎯⎯⎯⎯⎯⎯ N mean std. dev. N mean std. dev. Beam trawl 0-12 meter 4 10.0 15.0 3 2.5 0.0 12-24 meter 5 20.5 16.4 4 17.5 1.7 Demersal trawls and seiners 0-12 meter 6 7.5 7.7 6 5.8 6.1 Pelagic trawls and seiners 12-24 meter 7 28.9 33.1 7 36.1 47.1 Passive gear 0-12 meter 55 17.6 19.8 57 18.3 20.6 Drift and fixed nets 12-24 meter 3 41.7 29.8 4 35.6 27.2 Pots and traps 12-24 meter 2 53.8 30.0 2 53.8 30.1 Polyvalent gears 12-24 meter 1 75.0 . 2 100.0 35.4 A large part of the respondents (about 80%) does not have another income apart from fishing with the vessel as mentioned in the survey. Hardly any of the respondents used the vessel for tourist activities or sport-fishing (table 4.2). About 16% of the respondents did receive other income apart from fishing. Activities mentioned varied from hiring out the vessel and salvage activities to working on another vessel, or a totally different company like the KLM or a florist. Considering the response to this question it is clear that many re-spondents did not notice that they were only asked for the income coming from other
26
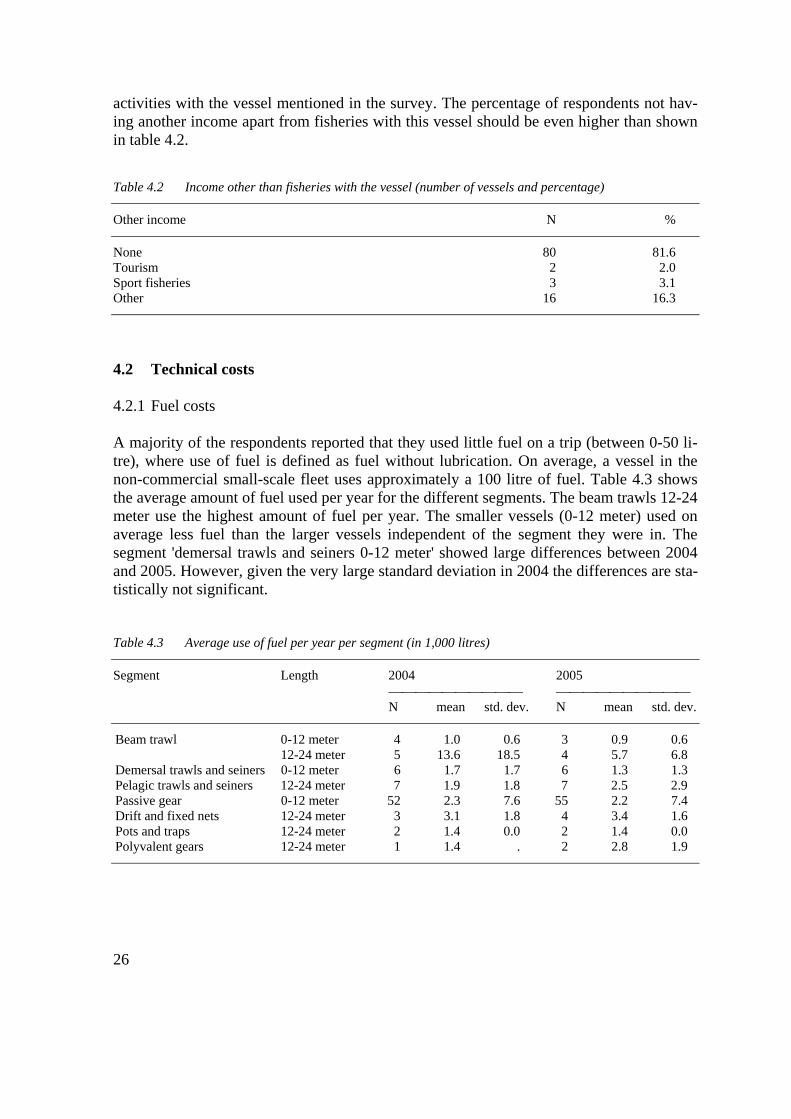
activities with the vessel mentioned in the survey. The percentage of respondents not hav-ing another income apart from fisheries with this vessel should be even higher than shown in table 4.2. Table 4.2 Income other than fisheries with the vessel (number of vessels and percentage) Other income N % None 80 81.6 Tourism 2 2.0 Sport fisheries 3 3.1 Other 16 16.3 4.2 Technical costs 4.2.1 Fuel costs A majority of the respondents reported that they used little fuel on a trip (between 0-50 li-tre), where use of fuel is defined as fuel without lubrication. On average, a vessel in the non-commercial small-scale fleet uses approximately a 100 litre of fuel. Table 4.3 shows the average amount of fuel used per year for the different segments. The beam trawls 12-24 meter use the highest amount of fuel per year. The smaller vessels (0-12 meter) used on average less fuel than the larger vessels independent of the segment they were in. The segment 'demersal trawls and seiners 0-12 meter' showed large differences between 2004 and 2005. However, given the very large standard deviation in 2004 the differences are sta-tistically not significant. Table 4.3 Average use of fuel per year per segment (in 1,000 litres) Segment Length 2004 2005 ⎯⎯⎯⎯⎯⎯⎯⎯⎯⎯ ⎯⎯⎯⎯⎯⎯⎯⎯⎯⎯ N mean std. dev. N mean std. dev. Beam trawl 0-12 meter 4 1.0 0.6 3 0.9 0.6 12-24 meter 5 13.6 18.5 4 5.7 6.8 Demersal trawls and seiners 0-12 meter 6 1.7 1.7 6 1.3 1.3 Pelagic trawls and seiners 12-24 meter 7 1.9 1.8 7 2.5 2.9 Passive gear 0-12 meter 52 2.3 7.6 55 2.2 7.4 Drift and fixed nets 12-24 meter 3 3.1 1.8 4 3.4 1.6 Pots and traps 12-24 meter 2 1.4 0.0 2 1.4 0.0 Polyvalent gears 12-24 meter 1 1.4 . 2 2.8 1.9

27
On average a vessels spends about € 1,500 on fuel in 2004 and € 1,400 in 2005. It should come as no surprise that the segments which have a relatively low fuel demand, have the lowest costs (as shown in table 4.4). The only exception is the segment 'demersal trawls and seiners 0-12 meter'. This segment has a low fuel demand per year, but relatively high costs. However, the deviation in this segment is quite large and the number of respon-dents in this segment is low, indicating that one respondent with unusual high fuel costs can have a large impact on the reported average fuel costs. Table 4.4 Average cost diesel per segment (in 1,000 euro) Segment Length 2004 2005 ⎯⎯⎯⎯⎯⎯⎯⎯⎯⎯ ⎯⎯⎯⎯⎯⎯⎯⎯⎯⎯ N mean std. dev. N mean std. dev. Beam trawl 0-12 meter 2 0.3 0.2 2 0.2 0.1 12-24 meter 5 5.7 8.1 4 2.1 1.7 Demersal trawls and seiners 0-12 meter 6 2.2 3.8 5 2.6 4.3 Pelagic trawls and seiners 12-24 meter 6 2.0 2.8 6 2.1 2.7 Passive gear 0-12 meter 43 1.2 1.7 44 1.2 1.3 Drift and fixed nets 12-24 meter 3 2.4 2.2 3 2.5 2.2 Pots and traps 12-24 meter 2 2.6 0.2 1 2.8 . Polyvalent gears 12-24 meter 1 4.0 . 2 6.3 2.5 4.2.2 Repair and maintenance costs and other costs Table 4.5 shows the repair and maintenance costs for the different segments. The average repair costs were about € 3,000. The repair costs for the segment 'beam trawl 12-24 meter' is quite high in 2004, much higher than in 2005. However, the standard deviation is ex-tremely high in this year, because one vessel had very high repair and maintenance costs in this year. The same hold for the segment 'polyvalent gears 12-24 meter' in 2005. Table 4.5 Average repair and maintenance costs per segment (in 1,000 euro) Segment Length 2004 2005 ⎯⎯⎯⎯⎯⎯⎯⎯⎯⎯ ⎯⎯⎯⎯⎯⎯⎯⎯⎯⎯ N mean std. dev. N mean std. dev. Beam trawl 0-12 meter 2 0.8 0.9 2 0.7 0.8 12-24 meter 4 14.1 24.0 3 2.2 2.5 Demersal trawls and seiners 0-12 meter 4 1.7 1.7 5 2.6 3.6 Pelagic trawls and seiners 12-24 meter 5 3.4 3.9 6 8.7 13.4 Passive gear 0-12 meter 35 1.6 2.0 39 1.4 1.4 Drift and fixed nets 12-24 meter 3 10.6 5.7 3 8.3 5.9 Pots and traps 12-24 meter 2 5.4 4.9 1 2.0 . Polyvalent gears 12-24 meter 1 7.0 . 2 16.5 12.0

28
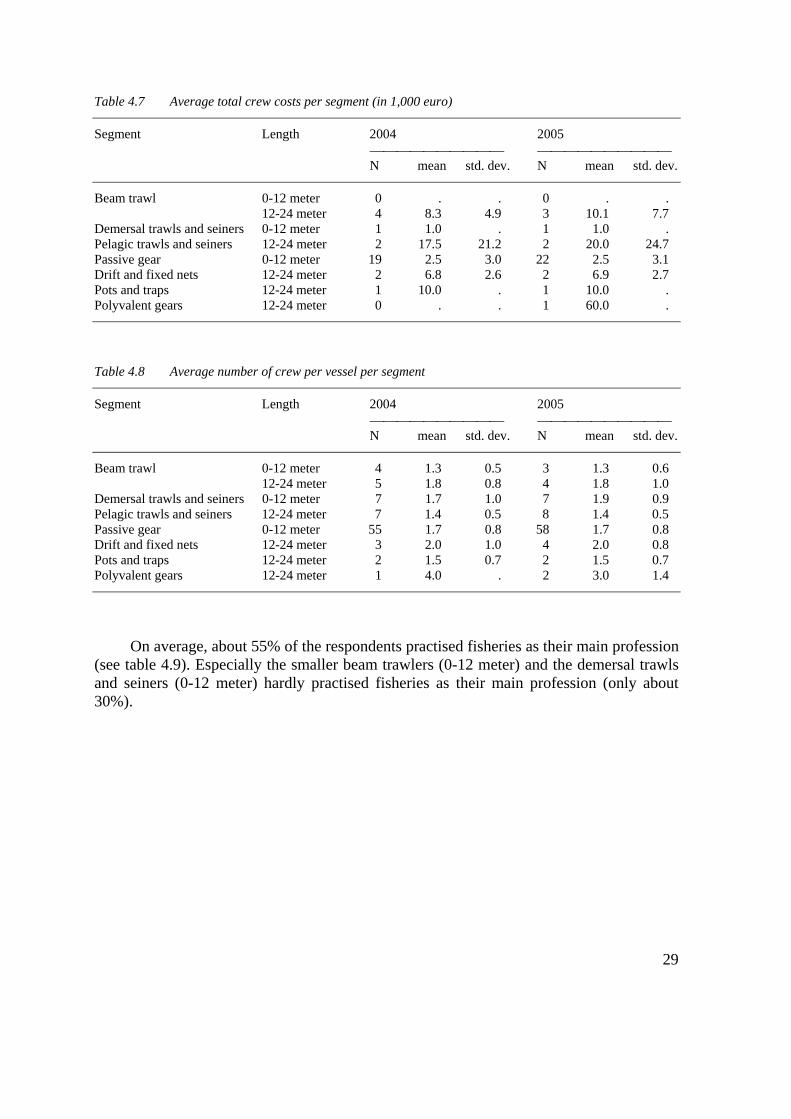
4.2.3 Other operational costs Finally, table 4.6 shows all other costs, like for example insurance, transport, provision, and administration costs. The average other costs were equal to about € 4,000. It is clear that on average, the smaller vessels (0-12 meter) have lower costs in all segments. The other costs are quite high in the segment 'polyvalent gears 12-24 meter' (2004) and 'Pelagic trawls and seiners 12-24 meter'. However, this average is based on only a small number of vessels with quite different amounts of other costs. Table 4.6 Average other costs per segment (in 1,000 euro) Segment Length 2004 2005 ⎯⎯⎯⎯⎯⎯⎯⎯⎯⎯ ⎯⎯⎯⎯⎯⎯⎯⎯⎯⎯ N mean std. dev. N mean std. dev. Beam trawl 0-12 meter 2 1.1 0.7 2 1.1 0.7 12-24 meter 5 7.1 10.2 4 2.9 2.8 Demersal trawls and seiners 0-12 meter 5 1.7 1.4 6 1.4 1.4 Pelagic trawls and seiners 12-24 meter 6 5.3 9.7 6 11.2 24.0 Passive gear 0-12 meter 37 2.6 4.1 38 3.3 9.1 Drift and fixed nets 12-24 meter 2 6.3 5.3 3 5.3 4.1 Pots and traps 12-24 meter 2 5.7 0.4 1 6.0 . Polyvalent gears 12-24 meter 1 30.0 . 2 24.0 12.8 4.3 Crew Costs and employment More than half of the respondents did not answer the question about the total crew costs or said that the total crew costs were 0. The crew costs ranges from € 20 to € 125,000. Table 4.7 shows the total crew costs per segment for the respondents that did answer this ques-tion. The deviation of the total crew costs is large, even within a segment. Because of the relatively small number of respondents that answered this question, it is difficult to say anything about the average crew costs. It is quite possible that many of the respondents did not know the crew costs since they are fishing by themselves and are not paying them-selves any wage. A vessel in the non-commercial small-scale fleet fishes on average with 1.7 persons on board, ranging from 1 to 5 persons on board. Table 4.8 shows the average amount of people working on board per segment. The average number of people differs only slightly between the different segments. The survey also showed that all of the respondents fished with their own vessel (not shown in table).
29
Table 4.7 Average total crew costs per segment (in 1,000 euro) Segment Length 2004 2005 ⎯⎯⎯⎯⎯⎯⎯⎯⎯⎯ ⎯⎯⎯⎯⎯⎯⎯⎯⎯⎯ N mean std. dev. N mean std. dev. Beam trawl 0-12 meter 0 . . 0 . . 12-24 meter 4 8.3 4.9 3 10.1 7.7 Demersal trawls and seiners 0-12 meter 1 1.0 . 1 1.0 . Pelagic trawls and seiners 12-24 meter 2 17.5 21.2 2 20.0 24.7 Passive gear 0-12 meter 19 2.5 3.0 22 2.5 3.1 Drift and fixed nets 12-24 meter 2 6.8 2.6 2 6.9 2.7 Pots and traps 12-24 meter 1 10.0 . 1 10.0 . Polyvalent gears 12-24 meter 0 . . 1 60.0 . Table 4.8 Average number of crew per vessel per segment Segment Length 2004 2005 ⎯⎯⎯⎯⎯⎯⎯⎯⎯⎯ ⎯⎯⎯⎯⎯⎯⎯⎯⎯⎯ N mean std. dev. N mean std. dev. Beam trawl 0-12 meter 4 1.3 0.5 3 1.3 0.6 12-24 meter 5 1.8 0.8 4 1.8 1.0 Demersal trawls and seiners 0-12 meter 7 1.7 1.0 7 1.9 0.9 Pelagic trawls and seiners 12-24 meter 7 1.4 0.5 8 1.4 0.5 Passive gear 0-12 meter 55 1.7 0.8 58 1.7 0.8 Drift and fixed nets 12-24 meter 3 2.0 1.0 4 2.0 0.8 Pots and traps 12-24 meter 2 1.5 0.7 2 1.5 0.7 Polyvalent gears 12-24 meter 1 4.0 . 2 3.0 1.4 On average, about 55% of the respondents practised fisheries as their main profession (see table 4.9). Especially the smaller beam trawlers (0-12 meter) and the demersal trawls and seiners (0-12 meter) hardly practised fisheries as their main profession (only about 30%).

30
Table 4.9 Percentage of vessels that practised fisheries as their main profession Segment Length 2004 2005 Beam trawl 0-12 meter 25.0 33.3 12-24 meter 60.0 50.0 Demersal trawls and seiners 0-12 meter 28.6 14.3 Pelagic trawls and seiners 12-24 meter 62.5 62.5 Passive gear 0-12 meter 52.7 52.6 Drift and fixed nets 12-24 meter 100.0 100.0 Pots and traps 12-24 meter 100.0 100.0 Polyvalent gears 12-24 meter 100.0 100.0 4.4 Investment value of the vessel and financing The average investment value of the vessel is about € 71,000 in both years. Table 4.10 shows the average investment value in the different segments. The segment 'beam trawl 12-24 meter' has the highest average investment value. The lowest average investment value is found in the segment 'passive gear 0-12 meter' (27 k euro). Table 4.10 Average investment value vessel (in 1,000 euro) Segment Length 2004 2005 ⎯⎯⎯⎯⎯⎯⎯⎯⎯⎯ ⎯⎯⎯⎯⎯⎯⎯⎯⎯⎯ N mean std. dev. N mean std. dev. Beam trawl 0-12 meter 2 57.0 75.0 2 57.0 75.0 12-24 meter 7 295.1 338.6 5 285.5 403.2 Demersal trawls and seiners 0-12 meter 7 74.0 82.4 7 69.2 75.7 Pelagic trawls and seiners 12-24 meter 4 125.0 165.8 6 106.3 146.2 Passive gear 0-12 meter 52 27.1 29.7 55 28.0 29.2 Drift and fixed nets 12-24 meter 3 59.7 37.4 4 63.5 31.5 Pots and traps 12-24 meter 2 75.0 35.4 2 75.0 35.4 Polyvalent gears 12-24 meter 2 115.0 21.2 1 130.0 . A large part of the investment value of the vessel is financed with own capital. For the total fleet on average, about 91% is financed with own capital. Table 4.11 shows the average part financed with own capital for each segment. The differences between the dif-ferent segments are not that large.

31
Table 4.11 Part of the investment value financed with own capital Segment Length 2004 2005 ⎯⎯⎯⎯⎯⎯⎯⎯⎯⎯ ⎯⎯⎯⎯⎯⎯⎯⎯⎯⎯ N mean std. dev. N mean std. dev. Beam trawl 0-12 meter 2 100.0 0.0 2 100.0 0.0 12-24 meter 7 77.9 26.1 5 89.0 21.9 Demersal trawls and seiners 0-12 meter 7 75.0 38.2 6 75.0 41.8 Pelagic trawls and seiners 12-24 meter 5 83.0 38.0 8 89.4 30.1 Passive gear 0-12 meter 50 95.4 19.5 50 95.0 20.4 Drift and fixed nets 12-24 meter 3 100.0 0.0 4 87.5 25.0 Pots and traps 12-24 meter 1 100.0 . 1 100.0 . Polyvalent gears 12-24 meter 2 75.0 35.4 1 50.0 .
32
5. Total economic importance non-commercial small-scale fleet
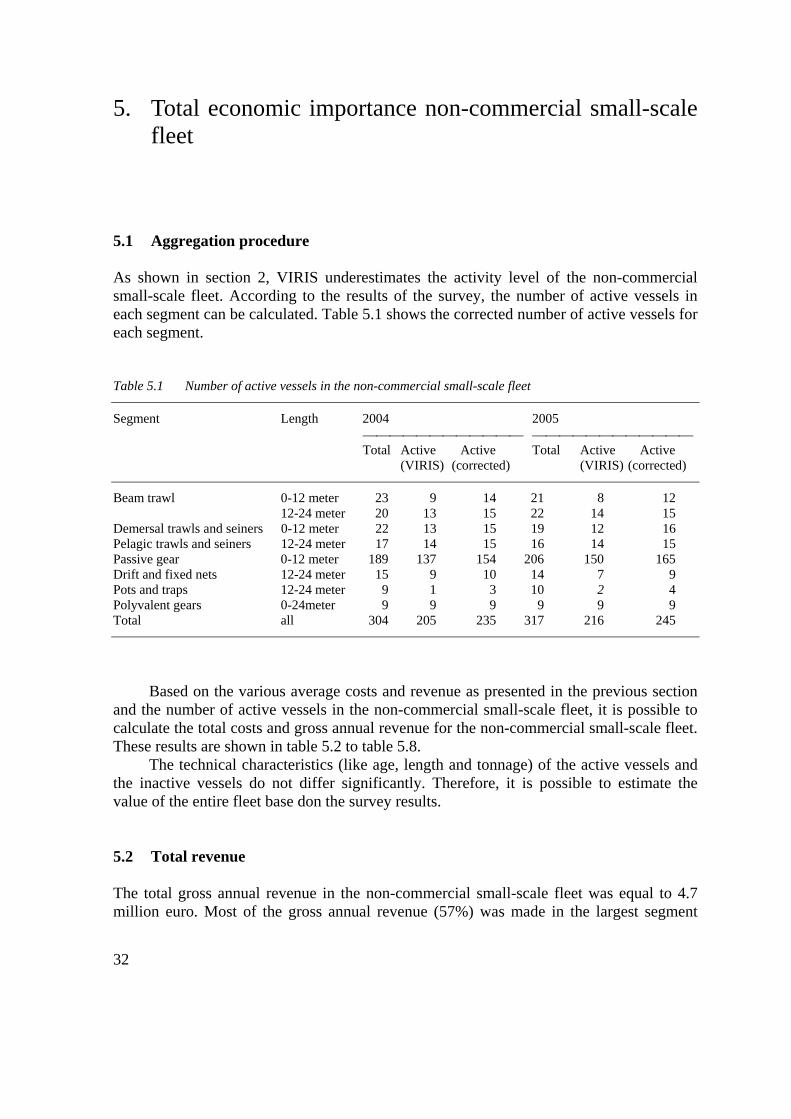
5.1 Aggregation procedure As shown in section 2, VIRIS underestimates the activity level of the non-commercial small-scale fleet. According to the results of the survey, the number of active vessels in each segment can be calculated. Table 5.1 shows the corrected number of active vessels for each segment. Table 5.1 Number of active vessels in the non-commercial small-scale fleet Segment Length 2004 2005 ⎯⎯⎯⎯⎯⎯⎯⎯⎯⎯⎯⎯ ⎯⎯⎯⎯⎯⎯⎯⎯⎯⎯⎯⎯ Total Active Active Total Active Active (VIRIS) (corrected) (VIRIS) (corrected) Beam trawl 0-12 meter 23 9 14 21 8 12 12-24 meter 20 13 15 22 14 15 Demersal trawls and seiners 0-12 meter 22 13 15 19 12 16 Pelagic trawls and seiners 12-24 meter 17 14 15 16 14 15 Passive gear 0-12 meter 189 137 154 206 150 165 Drift and fixed nets 12-24 meter 15 9 10 14 7 9 Pots and traps 12-24 meter 9 1 3 10 2 4 Polyvalent gears 0-24meter 9 9 9 9 9 9 Total all 304 205 235 317 216 245 Based on the various average costs and revenue as presented in the previous section and the number of active vessels in the non-commercial small-scale fleet, it is possible to calculate the total costs and gross annual revenue for the non-commercial small-scale fleet. These results are shown in table 5.2 to table 5.8. The technical characteristics (like age, length and tonnage) of the active vessels and the inactive vessels do not differ significantly. Therefore, it is possible to estimate the value of the entire fleet base don the survey results. 5.2 Total revenue The total gross annual revenue in the non-commercial small-scale fleet was equal to 4.7 million euro. Most of the gross annual revenue (57%) was made in the largest segment

33
'passive gear 0-12 meter'. The standard error of the mean is quite high (24.5%), in fact higher than what is normally considered acceptable according to EU-standards (12.5%). The total gross annual revenue has slightly increased in 2005. However, the differences be-tween 2004 and 2005 are small. Table 5.2 Total gross annual revenue (in 1,000 euro) Segment Length 2004 2005 ⎯⎯⎯⎯⎯⎯⎯⎯⎯⎯⎯ ⎯⎯⎯⎯⎯⎯⎯⎯⎯⎯ N Revenue S.E. N Revenue S.E. mean mean Beam trawl 0-12 meter 14 140.0 75.0 12 30.0 0.0 12-24 meter 15 307.5 35.8 15 262.5 49.5 Demersal trawls and seiners 0-12 meter 15 112.5 42.2 16 93.3 42.4 Pelagic trawls and seiners 12-24 meter 15 433.9 43.2 15 541.1 49.4 Passive gear 0-12 meter 154 2,709.0 15.2 165 3,025.0 14.9 Drift and fixed nets 12-24 meter 10 416.7 41.3 9 320.6 38.2 Pots and traps 12-24 meter 3 161.3 39.5 4 215.0 39.5 Polyvalent gears 12-24 meter 9 675.0 . 9 900.0 25.0 Total all 235 4,714.1 8.7 245 5,361.2 9.1 5.3 Technical costs 5.3.1 Fuel costs Table 5.3 show the total fuel costs for the non-commercial small scale fleet. This fleet uses for about €420,000 of fuel. The segment 'passive gear 0-12 meter' is good for 42% of the total fuel costs. 'Beam trawl 12-24 meter' uses about 20% of the total fuel costs in 2004. In 2005 the fuel costs in this section are much lower. The total standard error of the mean is large in both 2004 and 2005 but decreased considerably in 2005. Table 5.3 Total fuel costs (in 1,000 euro) Segment Length 2004 2005 ⎯⎯⎯⎯⎯⎯⎯⎯⎯⎯⎯ ⎯⎯⎯⎯⎯⎯⎯⎯⎯⎯ N Costs S.E. N Costs S.E. mean mean Beam trawl 0-12 meter 14 3.6 53.8 12 2.5 42.9 12-24 meter 15 84.9 64.3 15 32.6 39.1 Demersal trawls and seiners 0-12 meter 15 33.4 70.9 16 42.1 72.8 Pelagic trawls and seiners 12-24 meter 15 29.8 57.3 15 30.9 54.3 Passive gear 0-12 meter 154 181.5 21.9 165 203.4 15.7 Drift and fixed nets 12-24 meter 10 24.2 53.4 9 22.7 49.6 Pots and traps 12-24 meter 3 7.9 5.7 4 11.2 . Polyvalent gears 12-24 meter 9 36.0 . 9 56.3 28.0 Total all 235 419.3 14.6 245 408.5 10.8

34
5.3.2 Repair and maintenance costs The total repair and maintenance costs are in shown in table 5.4. The total repair and main-tenance costs were about €780,000. The total repair and maintenance costs were relativity low in the largest sector, 'passive gear 0-12 meter', only about 31%. The large difference between 2004 and 2005 in the segments 'beam trawl 12-24 meter' and 'pelagic trawls and seiners 12-24 meter' are caused by 1 or two vessels which gave largely deviating total re-pair and maintenance costs for that year. The total standard error of the mean is very large for almost all segments. Only the segment 'passive gear 0-12 meter' has a relatively low standard error of the mean. Table 5.4 Total costs repair and maintenance costs (in 1,000 euro) Segment Length 2004 2005 ⎯⎯⎯⎯⎯⎯⎯⎯⎯⎯⎯ ⎯⎯⎯⎯⎯⎯⎯⎯⎯⎯ N Costs S.E. N Costs S.E. mean mean Beam trawl 0-12 meter 14 11.8 78.6 12 8.6 74.8 12-24 meter 15 211.9 85.0 15 32.5 65.7 Demersal trawls and seiners 0-12 meter 15 24.8 52.9 16 40.8 62.6 Pelagic trawls and seiners 12-24 meter 15 51.6 51.1 15 130.5 62.7 Passive gear 0-12 meter 154 247.1 21.2 165 227.8 16.7 Drift and fixed nets 12-24 meter 10 105.5 31.4 9 74.4 41.2 Pots and traps 12-24 meter 3 16.3 63.2 4 8.0 . Polyvalent gears 12-24 meter 9 63.0 . 9 148.5 51.5 Total all 235 787.5 21.0 245 749.2 14.1 5.3.3 Other operational costs The total other operational costs of the non-commercial small-scale fleet were about €900,000 in 2004 and 1,100,000 in 2005. The largest segment 'passive gear 0-12 meter' spent about 45% of the total costs. In this cost-category, large difference between 2004 and 2005 are again apparent. In the seg-ments 'beam trawl 12-24 meter' and 'pelagic trawls and seiners 12-24 meter', the differences between 2004 and 2005 are noticeable. However the standard error of the mean is also quite large in these segments.

35
Table 5.5 Total other operational costs (in 1,000 euro) Segment Length 2004 2005 ⎯⎯⎯⎯⎯⎯⎯⎯⎯⎯⎯ ⎯⎯⎯⎯⎯⎯⎯⎯⎯⎯ N Costs S.E. N Costs S.E. mean mean Beam trawl 0-12 meter 14 15.4 45.5 12 13.5 42.2 12-24 meter 15 106.5 64.3 15 43.1 48.4 Demersal trawls and seiners 0-12 meter 15 25.4 37.0 16 22.8 41.2 Pelagic trawls and seiners 12-24 meter 15 80.1 74.5 15 167.6 87.6 Passive gear 0-12 meter 154 396.6 26.4 165 551.1 44.0 Drift and fixed nets 12-24 meter 10 62.5 60.0 9 48.0 44.1 Pots and traps 12-24 meter 3 17.2 4.8 4 24.0 . Polyvalent gears 12-24 meter 9 270.0 . 9 216.0 37.5 Total All 235 890.7 13.7 245 1,086.2 22.4 5.4 Crew costs and employment The total crew costs of the small-scale fleet are shown in table 5.6. The total crew costs were equal to 2.1 million Euro in 2004 and 3.0 million in 2005. It should be noted that the question about the total crew costs was only answered by about a third of the respondents. Therefore, the estimation of the total crew costs is not very reliable. The standard error of the mean is therefore also very large for the cost-category. Table 5.6 Total cost crew (in 1,000 euro) Segment Length 2004 2005 ⎯⎯⎯⎯⎯⎯⎯⎯⎯⎯⎯ ⎯⎯⎯⎯⎯⎯⎯⎯⎯⎯ N Costs S.E. N Costs S.E. mean mean Beam trawl 0-12 meter 14 . . 12 0.0 . 12-24 meter 15 198.8 33.9 15 226.0 55.3 Demersal trawls and seiners 0-12 meter 15 15.0 . 16 16.0 . Pelagic trawls and seiners 12-24 meter 15 525.0 85.7 15 600.0 87.5 Passive gear 0-12 meter 154 696.0 28.6 165 756.2 27.5 Drift and fixed nets 12-24 meter 10 155.0 67.7 9 140.6 68.0 Pots and traps 12-24 meter 3 60.0 . 4 80.0 . Polyvalent gears 12-24 meter 9 . . 9 1,080.0 . Total All 235 2,113.9 22.3 245 3,049.3 17.8 Table 5.7 shows the total employment in the non-commercial small-scale fleet of people who consider fisheries their main profession. The number of people working in the sector of the fleet is quite high; 218 persons in 2004 and 248 persons in 2005. However, if the number of FTE's are calculated based on the average number of sea-days and the aver-age number of crew on a vessel, the employment in this part of the fleet is much smaller,

36
only 42.6 FTE in 2004 and 45.2 FTE in 2005. The number of persons working in the seg-ment 'passive gear 0-12 meter' has increased with 20% because the both the number of vessels as the average number of crew aboard have increased in 2005. Table 5.7 Total employment non-commercial small-scale fleet (fisheries is main profession) Segment Length Number of persons FTE ⎯⎯⎯⎯⎯⎯⎯⎯⎯⎯⎯ ⎯⎯⎯⎯⎯⎯⎯⎯⎯⎯ 2004 2005 2004 2005 Beam trawl 0-12 meter 4 4 0.2 0.2 12-24 meter 15 11 2.8 2.2 Demersal trawls and seiners 0-12 meter 6 2 0.8 0.1 Pelagic trawls and seiners 12-24 meter 16 15 4.0 3.7 Passive gear 0-12 meter 133 162 24.3 25.9 Drift and fixed nets 12-24 meter 20 18 3.9 3.3 Pots and traps 12-24 meter 5 6 0.7 1.0 Polyvalent gears 0-24 meter 35 27 5.9 8.9 Total All 218 2,113.9 42.6 3,049.3 5.5 Total investment value Finally, table 5.8 shows the total investment value of the vessels present in the non-commercial small-scale fleet. Because the characteristics (such as age, length and tonnage) between active vessels and inactive vessels do not differ significantly, it is possible to es-timate the investment value of the total non-commercial small scale fleet (and not just the active part). The total investment value equals about € 19 million. The largest segment passive gear 0-12 meter accounts for about 28% of the total value. The much smaller segment beam trawl 12-24 also accounts for about 20% of the total value, indicating that this seg-ment consists of relatively valuable vessels. The difference between 2004 and 2005 are quite small in all segments. The overall standard error of the mean is again quite high.

37
Table 5.8 Total investment value (in 1,000 euro) Segment Length 2004 2005 ⎯⎯⎯⎯⎯⎯⎯⎯⎯⎯⎯ ⎯⎯⎯⎯⎯⎯⎯⎯⎯⎯ N Costs S.E. N Costs S.E. mean mean Beam trawl 0-12 meter 23 1,3311.0 93.0 21 1,197.0 93.0 12-24 meter 20 5,901.4 43.4 22 6,281.0 63.2 Demersal trawls and seiners 0-12 meter 22 1,628.6 42.1 19 1,314.3 41.4 Pelagic trawls and seiners 12-24 meter 17 1,722.7 55.1 16 1,701.3 56.1 Passive gear 0-12 meter 189 5,195.7 15.2 206 5,760.5 14.1 Drift and fixed nets 12-24 meter 15 894.8 36.2 14 888.8 24.8 Pots and traps 12-24 meter 9 675.0 33.3 10 750.0 33.3 Polyvalent gears 12-24 meter 9 1,170.0 . 9 1,170.0 . Total All 304 19,881.8 17.3 317 18,307.4 27.0

38
6. Discussion Survey and coverage To collect data about the vessels in the so-called non-commercial small-scale fleet, a sur-vey was send out to all vessels which fall, according to the LEI definition, into this part of the fleet. In this survey questions were asked about the activity of the vessels, fishing tech-nique and target species and costs and revenue of the vessel per year. With the survey it is possible to estimate the total costs and revenues in the non-commercial small scale fleet. No questions were asked about prices or the value of the catch. The whole survey can be found in appendix 1. The response to the survey was quite good. On average about 30% of the skippers in the non-commercial small-scale fleet returned the survey. However, the variance between the different vessels, even within a segment is quite large. Therefore the uncertainty about the calculated average costs and revenue is large. One explanation about this large variance could be found in the activity level. Another explanation could be found in the division be-tween skippers who consider fishing their main profession and skippers for whom fishing with this vessel is just a side job. Stratification based on activity level Not all vessels were active during 2004 and/or 2005, in the sense that they did not go out to fish. One assumption was that skippers who were active during either 2004 or 2005 would have a larger incentive to return the survey than skippers who were not active. Therefore, our survey would have an overrepresentation of the active vessels. This was tested by di-viding the non-commercial small-scale fleet in an active and a non-active part based on VIRIS data. This survey had indeed good coverage of the active sector but poor coverage of the non-active sector. By dividing the fleet in an active part and an in-active part the rep-resentativeness of the survey for the active vessels increased. Stratification: Main profession versus side job Since VIRIS has no data available about main profession or side job it is not possible to compare results of the survey with VIRIS data on this subject. Besides that, it is unclear from the survey why people consider fisheries their main job. For example, figure 6.1 shows the gross annual revenue for the group of respondents whom consider fishing their main job and the group of respondents who consider it a side job. 20% of the respondents said that they practiced fisheries as their main profession but still had a gross annual reve-nue of less than € 5,000 (figure 6.1), making it quite improbable that they would not have another higher paying job or pension beside fishing

39
Figure 6.1 Average Gross annual revenue versus main profession, 2004 In this report, it proved impossible to make a distinction between respondents that practised fisheries as a main profession or as a side job due to the availability of reliable data. However, since it very well may be possible to make more homogenous segments when taking this activity-level indicator into account, it would be interesting to further ex-amine this in future research. Results The total gross annual revenue of the non-commercial small-scale fleet is equal to 4.7 mil-lion euro in 2004 and 5.4 million euro in 2005. In these same years the total gross annual revenue of the commercial large-scale fleet was equal to 372 in 2004 and 382 in 2005 (Taal et al., 2006). Therefore the share of the gross annual revenue in the non-commercial small scale fleet is equal to 1.3% in 2004 and 1.4% in 2005. The total costs in the non-commercial small-scale fleet were equal to 4.2 million euro in 2004 and 5.3 million euro in 2005. The total costs in the commercial large-scale fleet were equal to 387.3 million euro in 2004 and 391.5 million euro in 2005 (Taal et al., 2006). The share of the total costs of the non-commercial small-scale fleet as compared to the to-tal fleet is equal to 1.1% in 2004 and 1.4% in 2005. The total employment costs were equal to 2.1 million euro in 2004 and 3.0 million euro in 2005. This is about 50% of the total costs. The total labour costs in the commercial large-scale fleet were equal to 103.3 million Euro in 2004 and 99.5 million euro in 2005 (Taal et al., 2006). The share of the labour costs in the total costs was about 30% for the commercial large-scale fleet.
0 20 40 60 80
Less than 5,000
5,000-10,000
10,000-25,000
25,000-50,000
50,000-100,000
Percentage
Main job
Job on the side

40
The share of the total labour costs of the non-commercial small-scale fleet as com-pared to the total fleet is equal to 2.0% in 2004 and 3.0% in 2005. One should note that the question about the labour costs was only answered by about one third of the respondents. The uncertainty surrounding the total labour costs are therefore very high. Based on the figures above it can be concluded that the economic impact of the non-commercial small-scale fleet is very limited. However, as section 6 shows the number of people involved in this sector of the fleet is high (although not if calculated in FTE's). Therefore some further research in why these people considering fisheries as their main profession and whether they have any other means of income (as their average gross an-nual income is very low) would be interesting. The uncertainty concerning the total costs and revenues of the non-commercial small-scale fleet is large. However, if we would combine these results with the results of the commercial large-scale fleet, the results would be much better. Especially for the segments Beam trawl and demersal trawls and seiners, the uncertainty surrounding the total costs and revenue of the commercial, large scale fleet is much lower and the number of vessels much higher. Oostenbrugge (2006) showed that although the non-commercial small-scale fleet rep-resented about 50% of the total Dutch fleet, they added 5% or less to the invested capital, employment and revenue. These preliminary figures are comparable to figures found in this report. The survey could be improved on various points the next year. More questions should be focussed on whether fisheries is the main profession of the respondent, besides that question should be asked concerning whether the respondent has another job besides fishing with this vessel. If for example most of the respondents also fish in the commercial large-scale fleet, their employment is already covered in the main statistics. Another problem with this year's survey concerns the range of the multiple choice questions. For example, 20% of the respondents answered that they went fishing 51 times or more, this makes it difficult to estimated the average number of trips as there is no indi-cation whether the fished for example 60 times or a 100 times. The ranges of the multiple choice question should be more carefully chosen or open questions should be considered.

41
References Oostenbrugge, H., 'Definition of EU fishing fleets for economic data collection: What are we aiming for?'. In: Working paper. LEI, The Hague, 2006. Taal, C., H. Bartelings, A. Klok, J.A.E. van Oostenbrugge and B. de Vos, 'Fisheries in fig-ures 2006'. In: Visserij in cijfers 2006. LEI, the Hague, 2006.

42

43
Appendix 1 Survey Survey with regard to vessels which are part of the non-commercial small-scale fleet / or fish for shellfish: Number of vessel: NB. The questions following below refer to fishing activities and not to any other activi-ties, like sport fisheries, involving the vessel 1. Did you use the vessel for fishing activities during 2004 and/or 2005?
A. I was only active in 2004 B. I was only active in 2005 C. I was active in both 2004 and 2005 D. No I was not active in either year E. No, it is a transport vessel
2. How many fishing trips a year did you undertake with this vessel?
2004 2005 A. 5-10 A. 5-10 B. 11-20 B. 11-20 C. 21-30 C. 21-30 D. 31-40 D. 31-40 E. 41-50 E. 41-50 F. 50 or more F. 50 or more
3. What was the average length of a trip?
2004 2005 A. 0-4 hours A. 0-4 hours B. 4-8 hours B. 4-8 hours C. 8-12 hours C. 8-12 hours D. 12 hours or longer D. 12 hours or longer
4. Which fishing gear did you use on this vessel (several answers possible)?
2004 2005 A. Border trawl A. Border trawl B. Gillnets B. Gillnets C. Fyke nets C. Fyke nets D. Pots and traps D. Pots and traps E. Hook and line E. Hook and line F. other namely…. F. other namely….

44
5. How much diesel/gasoline did you use on average during a trip? 2004 2005 A. 0-50 litre A. 0-50 litre B. 50-100 litre B. 50-100 litre C. 100-200 litre C. 100-200 litre D. 200-1000 litre D. 200-1000 litre E. other, namely…. E. other, namely….
6. What were the most important target species (several answers possible)?
2004 2005 A. Sole A. Sole B. Sea bass B. Sea bass C. Mullet C. Mullet D. Turbot D. Turbot E. Brill E. Brill F. Plaice F. Plaice G. Eel G. Eel H. Smelt H. Smelt I. Lobster I. Lobster J. Shrimps J. Shrimps K. Atlantic surf clam K. Atlantic surf clam L. other, namely…. L. other, namely….
7. How many crewmembers were on board on average when you went out for a trip (please pick one of the answers and fill in the number of crewmembers)?
2004 2005 A. I went alone A. I went alone B. I went together with …. crewmembers B. I went together with …. crewmembers C. crew went alone, …. crewmembers C. crew went alone, …. crewmembers D. other, namely…. D. other, namely….
8. Do you consider fishing with this vessel your main profession? 2004 2005 A. Yes A. Yes B. No B. No
9. What was the gross annual revenue with this vessel?
In 2004 (if applicable) in € In 2005 (if applicable) in € A. less than 5.000 A. less than 5.000 B. 5.000-10.000 B. 5.000-10.000 C. 10.000-25.000 C. 10.000-25.000 D. 25.000-50.000 D. 25.000-50.000 E. 50.000-100.000 E. 50.000-100.000 F. more than 100.000…. F. more than 100.000…. G. other, namely…. G. other, namely….

45
10. Can you roughly estimate the annual amount spend on:
Costs 2004 in € 2005 in € 1. Costs concerning crew, including yourself, including social costs
2. Fuel costs 3. Repair and maintenance costs (concerning the vessel, gear, motor, etc.)
4. Other costs (insurance, provisions, rent machinery, rent quota, port dues, transport, administration, inspection, taxes, etc.
11. What is the investment value of your vessel (preferably insurance value)
2004 in € 2005 in € ……… ………….
12. Which part of this investment did you finance with own capital?
2004 in € 2005 in € ………% own capital ………% own capital
13. Did you have receive any income from activities with this vessel apart from fishing? A. No B. Yes, tourism (round trip boat) C. Yes, sport fishing D. Other, namely …
46
Appendix 2 Number of vessels that used a certain fishing technigue per segment (in percentages)
Segment Length Demersal
TrawlsGillnets Fyke
netsPots and
traps Hook
and line Other
2004 Beam trawl 0-12 m 50.0 0.0 50.0 25.0 25.0 0.0Beam trawl 12-24 m 80.0 20.0 0.0 0.0 0.0 20.0Demersal trawls and seiners 0-12 m 85.7 14.3 14.3 0.0 14.3 14.3Pelagic trawls and seiners 12-24 m 25.0 25.0 37.5 25.0 0.0 62.5Passive gears 0-12 m 12.5 55.4 46.4 26.8 21.4 26.8Drift and fixed nets 12-24 m 0.0 66.7 33.3 0.0 0.0 33.3Pots and traps 12-24 m 0.0 0.0 100.0 50.0 0.0 0.0Polyvalent gears 12-24 m 0.0 0.0 100.0 100.0 0.0 100.0 2005 Beam trawl 0-12 m 66.7 0.0 33.3 0.0 0.0 0.0Beam trawl 12-24 m 75.0 25.0 0.0 0.0 0.0 25.0Demersal trawls and seiners 0-12 m 71.4 42.9 0.0 0.0 14.3 14.3Pelagic trawls and seiners 12-24 m 25.0 25.0 37.5 25.0 0.0 62.5Passive gears 0-12 m 10.3 53.4 44.8 25.9 27.6 27.6Drift and fixed nets 12-24 m 25.0 50.0 50.0 0.0 0.0 25.0Pots and traps 12-24 m 0.0 0.0 100.0 50.0 0.0 0.0Polyvalent gears 12-24 m 0.0 0.0 100.0 100.0 0.0 100.0
Note: respondents could indicate that they used more than 1 fishing techniques so percentages do not sum up to 100.

47
Appendix 3 Target species per segment (in percentages) 2004 Beamtrawl Beam trawl Demersal trawl Pelagic trawl Passive gear Drift and fixed nets Pots and traps Polyvalent gears Species 0-12 m 12-24 m 0-12 m 12-24 m 0-12 m 12-24 m 12-24 m 12-24 m European sea bass 25.0 20.0 28.6 62.5 57.1 100.0 0.0 100.0 European eel 50.0 0.0 14.3 37.5 48.2 33.3 100.0 100.0 Mullet 25.0 20.0 14.3 75.0 32.1 100.0 0.0 100.0 Sole 25.0 20.0 28.6 12.5 25.0 0.0 0.0 0.0 Lobster 25.0 0.0 0.0 0.0 30.4 0.0 50.0 0.0 Flounder 0.0 0.0 57.1 12.5 12.5 0.0 0.0 100.0 Smelt 0.0 20.0 28.6 37.5 7.1 0.0 0.0 100.0 Common dab 0.0 20.0 42.9 0.0 12.5 0.0 0.0 0.0 Brill 0.0 0.0 28.6 12.5 10.7 0.0 0.0 0.0 Chinese river crab 0.0 0.0 14.3 12.5 10.7 0.0 0.0 100.0 Turbot 0.0 0.0 14.3 12.5 10.7 0.0 0.0 0.0 Crab 0.0 0.0 0.0 12.5 10.7 0.0 0.0 0.0 Plaice 0.0 20.0 28.6 12.5 3.6 0.0 0.0 0.0 Pike-perch 0.0 0.0 14.3 0.0 5.4 0.0 50.0 100.0 Shrimp 50.0 60.0 0.0 0.0 0.0 0.0 0.0 0.0 Cod 0.0 20.0 0.0 0.0 3.6 0.0 0.0 0.0 Squid 0.0 20.0 0.0 0.0 3.6 0.0 0.0 0.0 Cockle 0.0 0.0 0.0 12.5 0.0 33.3 0.0 0.0 Atlantic surf clam 0.0 0.0 0.0 0.0 1.8 0.0 0.0 0.0 Gurnard 0.0 0.0 0.0 0.0 1.8 0.0 0.0 0.0 Salmon 0.0 0.0 0.0 0.0 0.0 0.0 0.0 100.0
Note: respondents could mentioned several target species so percentages do not sum up to 100
48
2005 Beamtrawl Beam trawl Demersal trawls Pelagic trawls Passive gear Drift and fixed nets Pots and traps Polyvalent gears 0-12 m 12-24 m 0-12 m 12-24 m 0-12 m 12-24 m 12-24 m 12-24 m European sea bass 0.0 25.0 57.1 75.0 58.6 100.0 0.0 50.0 European eel 33.3 0.0 0.0 37.5 48.3 50.0 100.0 100.0 Mullet 0.0 25.0 28.6 75.0 34.5 100.0 0.0 50.0 Lobster 0.0 0.0 0.0 0.0 31.0 0.0 100.0 50.0 Sole 33.3 25.0 28.6 12.5 22.4 0.0 0.0 0.0 Flounder 0.0 0.0 42.9 12.5 13.8 25.0 0.0 50.0 Smelt 0.0 25.0 14.3 37.5 8.6 25.0 0.0 50.0 Common dab 33.3 25.0 42.9 0.0 12.1 0.0 0.0 0.0 Brill 0.0 0.0 28.6 12.5 10.3 0.0 0.0 0.0 Plaice 33.3 25.0 28.6 12.5 6.9 0.0 0.0 0.0 Chinese River crab 0.0 0.0 14.3 12.5 10.3 0.0 0.0 50.0 Turbot 0.0 0.0 0.0 12.5 12.1 0.0 0.0 0.0 Crab 0.0 0.0 0.0 12.5 12.1 0.0 0.0 0.0 Pike-perch 0.0 0.0 14.3 0.0 5.2 0.0 0.0 50.0 Shrimp 66.7 50.0 0.0 0.0 0.0 0.0 0.0 0.0 Cod 0.0 25.0 0.0 0.0 3.4 0.0 0.0 0.0 Cockle 0.0 0.0 0.0 12.5 0.0 25.0 0.0 0.0 Gurnard 0.0 0.0 14.3 0.0 1.7 0.0 0.0 0.0 Squid 0.0 0.0 0.0 0.0 3.4 0.0 0.0 0.0 Atlantic surf clam 0.0 0.0 0.0 0.0 1.7 0.0 0.0 0.0 European sprat 0.0 0.0 0.0 0.0 0.0 0.0 0.0 50.0 Salmon 0.0 0.0 0.0 0.0 0.0 0.0 0.0 50.0 Twaite shad 0.0 0.0 14.3 0.0 0.0 0.0 0.0 0.0
Note: respondents could mentioned several target species so percentages do not sum up to 100