economic osts of the atlantic oast · pdf fileeconomic osts of the atlantic oast pipeline:...
TRANSCRIPT

Economic Costs of the
Atlantic Coast Pipeline:
Effects on Property Value, Ecosystem Services, and Economic Development
in Western and Central Virginia
F E B R U A R Y 2 0 1 6
Highlanders for Responsible Development
Augusta County Alliance
Friends of Nelson County
Friends of Buckingham, Virginia
Yogaville Environmental Solutions
Prepared by:
Spencer Phillips, PhD
Cara Bottorff
Sonia Wang
Research and strategy for the land community.
keylogeconomics.com

i
EXECUTIVE SUMMARY The Atlantic Coast Pipeline (ACP) is proposed to carry natural gas from the Marcellus Shale through a 564-mile-long swath of West Virginia, Virginia, and North Carolina to markets in Virginia and North Carolina and, potentially, overseas. It has been represented as both environmentally safe and economically beneficial, providing economic opportunity for local communities along the proposed route.
Promised economic benefits, however, are only part of the impact the Federal Energy Regulatory Commission (FERC) must review before deciding whether to approve the construction and operation of the pipeline. Under the National Environmental Policy Act, FERC’s review must consider the full range of environmental effects of the proposed pipeline. These include the various ways in which environmental effects would result in changes in human well-being—that is, in economic benefits and costs. While estimates of positive economic effects including construction jobs and local tax payments have been developed and promoted as reasons to move forward with the pipeline, no systematic consideration of the potential negative economic effects—economic costs—of the ACP has been completed.
To help fill the gap in current information, five community groups from a four-county region in central and western Virginia commissioned this independent research into key economic costs of the ACP. This region, comprised of Highland, Augusta, Nelson, and Buckingham Counties, would experience three types of economic costs due to the construction, operation, and presence of the ACP. First, the pipeline would impact property values along the 126 miles of pipeline proposed for the region. Affected properties are those touched by the 75-foot-wide right-of-way, within the 1.4-mile-wide evacuation zone, in proximity to the compressor station proposed for Buckingham County, and throughout the viewshed of the proposed pipeline. Second, construction and the ongoing operation of the pipeline would alter land use/land cover in ways that diminish ecosystem service values, such as aesthetics, water supply, and timber and food production. Third, and in part due to a loss of scenic and quality-of-life amenities, there would be decreases in visitation, in-migration, and small business development and a loss of jobs and personal income those activities would otherwise support.
Considering this four-county region alone, estimated one-time costs range from $72.7 to $141.2 million. These one-time costs comprise lost property value and the value of ecosystem services lost during construction. Annual costs following the construction period include lower ecosystem service productivity in the ACP’s right-of-way, lower property tax revenue due to the initial losses in property value, and dampened economic development. These total between $96.0 and $109.1 million per year, and would persist forever. (See “At a Glance,” below for details.) Putting the stream of costs into present value terms 1 and adding the one-time costs, the total estimated cost of the ACP in Highland, Augusta, Nelson, and Buckingham Counties is between $6.9 to $7.9 billion. For reasons explained in the body of this report, these are conservative estimates.
The costs represented by the estimates presented here are what economists call “externalities,” or “external costs,” because they would be imposed on parties other than (external to) the company proposing to build the pipeline. Unlike the private (or internal) costs of the pipeline, external costs borne by the public do not affect the company’s bottom-line. From an economic perspective, the presence of externalities is what demands public involvement in decsions about the ACP. Without consideration of all of the costs of the project, too much pipeline (which may mean any pipeline at all) is the inevitable result. FERC must therefore consider the true bottom line and ensure that the full costs of the pipeline, especially those external costs imposed on the public, are rigorously examined and brought to bear on its decision about whether or not to permit the ACP project to proceed.
1 The present value of a perpetual stream cost is the one-year cost divided by the 1.4% real discount rate recommended by the Office of Management and Budget for cost-benefit and cost-effectiveness analysis of public projects and decisions (http://federalaccounting.org/2015/01/omb-updates-cost-benefit-analysis-discount-rates/).

Economic Costs of the Atlantic Coast Pipeline
ii
At a Glance:
The Atlantic Coast Pipeline in Western and Central Virginia
~ Highland, Augusta, Nelson, & Buckingham Counties ~
Miles of Pipeline: 125.5
Acres in the construction corridor and permanent right-of-way (ROW): 1,901 and 1,140
Most impacted land cover types (ROW only): forest (795 acres) and pasture (247 acres)
Parcels touched by ROW: 521
Parcels in the 1.4-mile-wide evacuation zone: 6,148
Parcels within one half mile of the compressor station: 87
Residents and housing units in the evacuation zone: 15,128 people and 8,762 homes
Parcels from which the pipeline would be visible: 31,117, or 29% of all parcels in the four-county study region
Baseline property value at risk (and expected one-time cost due to the ACP):
o In the ROW: $277.1 million ($11.6 to $36.0 million)
o In the evacuation zone: $1.13 billion ($43.0 million)
o Near the compressor station: $4.9 million ($1.2 million)
o In the viewshed: $7.44 billion (to avoid double counting with lost aesthetic value under ecosystem services, this impact is not separately estimated)
Total property value lost: $55.8 to $80.2 million
Resulting loss in property tax revenue (annual): $281,300 to $408,400
Lost ecosystem service value, such as for water and air purification, recreational benefits, and others:
o Over the two-year construction period: between $16.9 and $61.0 million (a one-time cost)
o Annually for the life of the ACP: between $4.9 and $17.8 million
Lost economic development opportunities due to the erosion of these Counties’ comparative advantages as attractive places to visit, reside, and do business. Under the scenarios described below, these could include:
o Annual loss of recreation tourism expenditures of $41.3 million that supports 387 jobs and $7.4 million in payroll and generates $1.8 million in state and $1.3 million in local taxes
o Annual loss of personal income of $6.6 million due to slower growth in the number of retirees
o Annual loss of personal income of $1.6 million due to slower growth in sole proprietorships
One-time costs (property value and ecosystem services during construction) would total between $72.7 and $141.2 million
Annual costs (all other costs above) would range from $96.1 to $109.1 million

Property Value, Ecosystem Service, and Economic Development Effects in Central and Western Virginia
iii
CONTENTS
EXECUTIVE SUMMARY ........................................................................................ I
CONTENTS ............................................................................................................ III
ABBREVIATIONS AND TERMS ........................................................................... IV
AUTHORS’ NOTE: ................................................................................................. IV
BACKGROUND ....................................................................................................... 1
Policy Context .................................................................................................................. 2
Study Objectives ............................................................................................................... 6
Current Economic Conditions in the Study Region ......................................................... 6
ENVIRONMENTAL-ECONOMIC EFFECTS
AND WHERE THEY WOULD OCCUR ................................................................. 9
Impact Zones within the Study Region ........................................................................ 10
EFFECTS ON ECOSYSTEM SERVICE VALUE ................................................... 14
Ecosystem Service Estimation Methods ........................................................................ 16
Step 1: Assign Land to Ecosystem Types or Land Uses .............................................. 18
Step 2: Re-assign Acreage to New Land Cover Types
for the Construction and Operation Periods ................................................................ 19
Step 3: Multiply Acreage by Per-Acre Value to Obtain ESV ...................................... 22
Step 4: Subtract Baseline ESV from ESV in “with ACP” Scenario ............................ 24
Ecosystem Service Value Estimates ............................................................................... 25
EFFECTS ON PROPERTY VALUE ....................................................................... 30
Land Price Effects .......................................................................................................... 30
Claims that Pipelines have no effect on property value may be invalid. ..................... 32
Visual Effects and Viewshed Analysis ........................................................................... 35
Parcel Values................................................................................................................... 37
Estimated Land Value Effects ......................................................................................... 39
EFFECTS ON ECONOMIC DEVELOPMENT ...................................................... 41
CONCLUSIONS ...................................................................................................... 44
WORKS CITED ...................................................................................................... 45
APPENDIX A: CANDIDATE PER-ACRE VALUES
FOR LAND-USE AND ECOSYSTEM SERVICE COMBINATIONS .................... 54

Economic Costs of the Atlantic Coast Pipeline
iv
ABBREVIATIONS AND TERMS ACP: Atlantic Coast Pipeline. For this report, this generally refers to the pipeline corridor itself as well as
the compressor station proposed for Buckingham County.
ACP LLC: Atlantic Coast Pipeline, LLC, an entity formed by Dominion Resources, Inc., Duke Energy Corporation, Piedmont Natural Gas Co., Inc., and AGL Resources, Inc. to develop, own, and operate the proposed Atlantic Coast Pipeline (ACP)
BTM: Benefit Transfer Method, a method for estimating the value of ecosystem services in a study region based on values estimated for similar resources in other places
DTI: Dominion Transmission, Inc., the entity that would build and operate the proposed ACP under contract to ACP LLC
EIS: Environmental Impact Statement, a document prepared under the National Environmental Policy Act analyzing the full range of environmental effects, including on the economy, of proposed federal actions, which in this case would be the approval of the Atlantic Coast Pipeline
FERC: Federal Energy Regulatory Commission, the agency responsible for preparing the EIS and deciding whether to grant a certificate of public convenience and necessity (i.e., whether to permit the pipeline)
NEPA: National Environmental Policy Act of 1970, which requires the environmental review of proposed federal actions, preparation of an EIS, and, for actions taken, appropriate mitigation measures
AUTHORS’ NOTE: We are grateful for the assistance the sponsoring organizations (Highlanders for Responsible
Development, Augusta County Alliance, Friends of Nelson County, Yogaville Environmental Solutions,
and Friends of Buckingham Virginia) have provided in identifying local information sources and making
contacts in the study region. Key-Log Economics however, remains solely responsible for the content of
this report, the underlying research methods, and the conclusions we draw from them.

BACKGROUND The proposed Atlantic Coast Pipeline (ACP) is a high-volume transmission pipeline intended, as
described in filings with the Federal Energy Regulatory Commission (FERC), to transport 1.5 billion cubic
feet (bcf) per day of natural gas from the Marcellus Shale region in West Virginia to power generation
facilities, natural gas distributors, and commercial and industrial end users in Virginia and North
Carolina (Natural Resource Group, 2015c).2 Atlantic Coast Pipeline, LLC, would control the pipeline,
while permit applications, construction, and operations would be managed by Dominion Transmission,
Inc. (DTI).
The majority of the pipeline, and all of it in the four-county region considered in this study (Figure 1),
would consist of 42-inch diameter pipe and would be operated at a pressure of 1,440 pounds per
square inch gauge (PSIG). This pressure would be maintained by three compressor stations, including
one proposed for Buckingham County, Virginia, which is part of the study region (Natural Resource
Group, 2015c).
Along the way, the ACP would cross portions of the Monongahela and George Washington National
Forests, Blue Ridge Parkway, the Appalachian Trail, and other public conservation, scenic, and natural
areas. Its permanent right-of-way and temporary construction corridor—75 and 125 feet wide,
respectively—would also cross thousands of private properties. Pipeline leaks and explosions could
cause substantial physical damage and require evacuation of even wider swaths, affecting perhaps tens
of thousands of homes, farms, and businesses. Still wider, but more difficult to gauge and estimate, are
the zones within which the construction, operation, and presence of the pipeline would affect human
well-being by changing the availability of ecosystem services such as clean air, water supply, and
recreational opportunities. This would occur as the pipeline creates an unnatural linear feature on a
landscape that otherwise remains largely natural or pastoral and dampens the attractiveness of the
affected region as a place to live, visit, retire, or do business.
To date, such negative effects and estimates of their attendant economic costs have not received much
attention in the otherwise vigorous public debate surrounding the ACP proposal. This report,
commissioned jointly by five community groups3 located in central and western Virginia is both an
attempt to understand the nature and potential magnitude of the economic costs of the ACP in a
particular four-county area, as well as to provide an example for FERC as it proceeds with its process of
analyzing and weighing the full effects of the proposed ACP along its entire length and, by extension,
throughout the region in which its effects will occur.
2 While pipeline backers maintain that the gas transported via the ACP would not be for export, the pipeline would add to overall national gas transmission capacity and thus would serve to free up more gas for export at Dominion Cove Point LNG LP’s newly approved liquefied natural gas export facility in Calvert County, Maryland. 3 These are, from west to east, Highlanders for Responsible Development, Augusta County Alliance, Friends of Nelson County, Yogaville Environmental Solutions, and Friends of Buckingham Virginia.

Economics of the Atlantic Coast Pipeline
2
Policy Context
Before construction can begin, the ACP must be approved by FERC. That approval, while historically
granted to pipeline projects, depends on FERC’s judgment that the pipeline would meet a public
“purpose and need.” Because the approval would be a federal action, FERC must also comply with the
procedural and analytical requirements of the National Environmental Policy Act (NEPA). These include
requirements for public participation, conducting environmental impact analysis, and writing an
Environmental Impact Statement (EIS) that evaluates all of the relevant effects. Of particular interest
here, such relevant effects include direct, indirect, and cumulative effects on or mediated through the
economy. As the NEPA regulations state,
Effects include ecological (such as the effects on natural resources and on the components,
structures, and functioning of affected ecosystems), aesthetic, historic, cultural, economic, social, or
health, whether direct, indirect, or cumulative. Effects may also include those resulting from actions
Figure 1: Four-County Study Region. Note: Augusta County includes the independent cities of Staunton and Waynesboro
Sources: ACP route and compressor digitized from interactive map, Dominion Resources Inc. http://dom.maps.arcgis.com/, and Resource Report 1:
Appendix A, Topographic Route Maps (Natural Resource Group 2015); Study Region (counties); federal lands, and hill shade from USGS and
http://nationalmap.gov/small_scale/

Property Value, Ecosystem Service, and Economic Development Effects in Central and Western Virginia
3
which may have both beneficial and detrimental effects, even if on balance the agency believes that
the effect will be beneficial (emphasis added, 36 CFR 1508.b).
It is important to note NEPA does not require that federal actions – which in this case would be
approval or not of the ACP – necessarily balance or even compare benefits and costs. NEPA is not a
decision-making law, but rather a law that requires decisions be supported by as full as possible an
accounting of the reasonably foreseeable effects of federal actions on the natural and human
environment. It also requires that citizens have opportunities to engage in the process of analyzing and
weighing those effects.
In addition to the requirements of NEPA, FERC’s own policy regarding the certification of new interstate
pipeline facilities (Docket No. PL99-3-000) requires that adverse effects of new pipelines on “economic
interests of landowners and communities affected by the route of the new pipeline” be weighed
against “evidence of public benefits to be achieved [by the pipeline]” (Hoecker, Breathitt, & He’bert Jr.,
1999, pp. 18–19). Further, “…construction projects that would have residual adverse effects would be
approved only where the public benefits to be achieved from the project can be found to outweigh the
adverse effects” (p. 23).
In principal, this policy is in line with the argument, on economic efficiency grounds, that the benefits
of a project or decision should be at least equal to its total cost, including external costs. The policy’s
guidance regarding what adverse effects must be considered and how they are measured is deeply
flawed, however. The policy states, for example, that “if project sponsors…are able to acquire all or
substantially all, of the necessary right-of-way by negotiation prior to filing the application…it would
not adversely affect any of the three interests,” the third of which include communities through which
the proposed pipeline would pass (Hoecker et al., 1999, p. 26). In effect, the Commission’s policy
contends that the only adverse effects that matter are those that affect owners of properties in the
right-of-way. Even for a policy adopted in 1999, this contention is completely out of step with then
current understanding of the economic effects of development that alters the natural environment.
A further weakness of the FERC policy is that it relies on applicants to provide information about
benefits and costs. The policy’s stated objective “is for the applicant to develop whatever record is
necessary, and for the Commission to impose whatever conditions are necessary, for the Commission
to be able to find that the benefits to the public from the project outweigh the adverse impact on the
relevant interests” (Hoecker et al., 1999, p. 26). The applicant therefore has an incentive to be generous
in counting benefits4 and parsimonious in counting the costs of its proposal. Under these
circumstances, it seems unlikely that the Commission’s policy will prevent the construction of pipelines
4 Dominion Resources and Dominion Transmission Inc. have published estimates of economic benefits in the form of employment and income stemming from the construction and operation of the ACP. As has been well documented elsewhere, both studies suffer from errors in the choice and application of methods and in assumptions made regarding the long-run economic stimulus represented by the ACP. Most significantly, the studies make no mention of likely economic costs, and their projections of long-term benefits extend far beyond the time period (of a year or so) within which economic impact analysis is either useful or appropriate. See Phillips (2015b) and Stanton et al. (2015) for details on these shortcomings.

Economics of the Atlantic Coast Pipeline
4
for which the full costs are greater than the public benefits they would actually provide. Indeed, FERC
has never rejected a pipeline proposal (van Rossum, 2016).
With ACP LLC having failed to acquire a sufficient portion of the right-of-way and with the need for
other federal agencies, including the US Forest Service, to evaluate how the ACP would affect resources
under its stewardship, the Commission issued a Notice of Intent to prepare an EIS in February of 2015
(Federal Energy Regulatory Commission, 2015). The process began with a series of scoping meetings at
which members of the public could express their thoughts on the pipeline in general as well as what
effects should fall under the scope of the EIS. Interested parties also had the opportunity to submit
comments online and through the mail. FERC received more than 1,600 individual comment letters,
another 1,239 form letters, and several petitions bearing multiple signatures each.5
Much of what FERC heard from citizens echoed and expanded upon the list of potential environmental
effects listed in its Notice of Intent. Of those, several are particularly important as the sort of
environmental effects that resonate in the lives of people. These effects can take the form of external
economic costs that would be borne by individuals, businesses, and communities throughout the
landscape the ACP would traverse. Table 1 lists these key issues along with the number of scoping
letters from residents of Highland, Augusta, Nelson, and Buckingham County who mentioned the issue.
FERC also received input about both the legal and economic importance of considering the economic
consequences of these environmental effects along with recommendations of the type and scope of
economic analysis that should be undertaken to quantify, to the extent possible, the magnitude of the
economic costs (see Phillips, 2015, for example). DTI responded to this input in a letter to FERC arguing
against such analysis, stating “because there is no commonly accepted methodology to weigh the
economic benefits of the ACP against possible environmental, health, and safety risks using all possible
positive and negative externalities, the economic impact assessment can only address tangible
economic benefits of the ACP using known variables and economic modeling” (Woolard & Natural
Resource Group, 2015, p. 58).
Contrary to DTI’s claim, experts in the fields of natural resource, agricultural, environmental, and
ecological economics have been developing, testing, and improving such methods since the 1960s (and
the underlying economic models have been established for even longer). Textbooks such as The
Benefits of Environmental Improvement: Theory and Practice (Freeman III, 1979) or Valuing Natural
Assets: The Economics of Natural Resource Damage Assessment (Kopp & Smith, 1993) plus many
thousands of peer-reviewed papers and other resources provide ample documentation of the methods
5 While the NEPA’s scoping phase is intended to generate guidance for the lead agency (FERC) on how to conduct the EIS and is not intended as a referendum, FERC nevertheless has heard opinions in support of the pipeline, and, as it turns out, many more opinions in opposition to the pipeline. Pipeline opponents cite a variety of concerns, including those that are the subject of this report. Key-Log Economics is preparing a full analysis of content of the scoping comments. Using crowd-sourcing, Key-Log Economics has reviewed and coded the content of all 2,875 individual letters, form letters, and petitions submitted to FERC through, and somewhat beyond, its announced formal scoping period. A report summarizing that content as a measure of citizens’ level of interest in the issues they have raised and, therefore, those they should most expect FERC to cover in the EIS process, will be released in early 2016.

Property Value, Ecosystem Service, and Economic Development Effects in Central and Western Virginia
5
by which one may estimate the negative externalities and other economic consequences of changes in
environmental quality that projects like the proposed ACP would cause.
TABLE 1: Environmental Concerns Raised During FERC Scoping Process
Environmental Issue / Resource Valuea
Mentions
among 1,299 scoping
comment lettersb,c
Impacts on property values, tourism, and recreational resources 521 (property value)
630 (tourism)
381 (recreation)
Safety issues, such as construction and operation of the planned
facilities near existing residences, schools, businesses, and military
training facilities, and in karst and steep slope terrain
528 (risk of accidents)
467 (general safety)
420 (erosion)
Impacts on forested areas and other vegetation 739 (forested areas,
vegetation, habitat, etc.)
Impacts on surface water resources including rivers springs, seeps, and
wetlands
812 (waterways)
604 (water quality)
370 (water supply)
Impacts on groundwater resources and wells 370 (water supply)
Impacts on protected species and habitat 404 (wildlife)
Impacts on cultural resources including battlefields, cemeteries, and
historic properties
489 (rural character)
240 (culture)
Concerns regarding construction and operational noise, especially
related to compressor stations
334 (health)
517 (quality of life)
40 (compressor station)
Notes:
a. This is a partial list of “Currently Identified Environmental Issues” from FERC’s Notice of Intent to
prepare an Environmental Impact Statement regarding the ACP (Federal Energy Regulatory Commission,
2015, p. 12165).
b. The categories in parentheses are related to the “currently identified environmental issues” listed in the
FERC Notice of Intent (Federal Energy Regulatory Commission, 2015, p. 12165).
c. These “mentions” are the number of comment letters written by or on behalf of residents of the study
region (Highland, Augusta, Nelson, and Buckingham Counties) that noted or mentioned the listed issue.
While detailed analysis of the full set of comments is ongoing, the vast majority of commenters from the
the study region expressed a belief that the ACP would have a negative impact on the resource/value
listed in the first column.
Moreover, precedent from the Tellico Dam, to the Exxon Valdez settlement, to the national forest
planning rule and recent guidance from the Council on Environmental Quality (with their emphases on
ecosystem services) show that such methods do exist and are useful both for determining the costs of
environmental damage and for guiding cost-effective environmental decision-making (Carson et al.,
2003; Donovan, Goldfuss, & Holdren, 2015; Randall, 1987; USDA Forest Service, 2012).
The applicant’s professed ignorance of established methods for estimating the economic costs of
environmental damage perhaps serves “to develop whatever record is necessary” (Hoecker et al.,

Economics of the Atlantic Coast Pipeline
6
1999), for FERC to permit the pipeline, but it does nothing to develop a proper assessment of costs and
or to serve the public interest. To ensure an economically efficient use of public and private resources
and to meet its obligations under NEPA, FERC must obtain credible estimates of public benefit (which
has so far not been demonstrated), develop rigorous estimates of the full suite of costs, and bring both
sets of information to bear on its decisions regarding the Atlantic Coast Pipeline.
Study Objectives
Given the policy setting and what may be profound effects of the ACP as proposed on the people and
communities of central and western Virginia, we have undertaken this study to provide information of
two types:
1. An example of the scope and type of analyses that FERC could, and should, undertake as part of
its assessment of the environmental (including economic) effects of the ACP.
2. An estimate of the potential magnitude of economic effects in this four-county subset of the
landscape where the ACP’s environmental and economic effects will be felt.
We do not claim the estimates below represent the total of all of the potential costs that would attend
the construction, operation, and presence of the pipeline. Specifically, we have not estimated costs in
two categories: “passive-use value,”6 including the value of preserving the landscape, without a
pipeline, for future direct use; and increases in the cost of community services like road maintenance
and emergency response that may increase due to the construction and operation of the pipeline.7
Therefore, our figures should be understood to be conservative, lower-bound estimates of the true
total cost of the ACP in that sub-region and, of course, they do not include costs for the remainder of
the region proposed for the ACP. We do urge that the FERC augment the results of this study with its
own similar analysis for the entire region and with additional research to determine the costs of
community services and other relevant classes of costs not counted here.
Current Economic Conditions in the Study Region
6 Passive-use values include option value, or the value of preserving a resource unimpaired for one’s potential future use; bequest value, which is the value to oneself of preserving the resource for the use of others, particularly future generations; and existence value, which is the value to individuals of simply knowing that the resource exists, absent any expectation of future use by oneself or anyone else. In the case of the ACP, people who have not yet, but who may intend, to travel the Blue Ridge Parkway or attend the Highland Maple festival are better off knowing that the setting for activities is a beautiful aesthetically pleasing landscape. What such visitors would be willing to pay to maintain that possibility would be part of the “option value” of an ACP-free landscape. 7 As in communities impacted by the shale gas boom itself, communities along the pipeline can expect spikes in crime as transient workers come and go, more damage to roads under the strain of heavy equipment, increases in physical and mental illnesses including asthma, depression, anxiety, and others triggered by exposure to airborne pollutants, to noise, and to emotional, economic, and other stress. See, for example, Ferrar et al. (2013), Healy (2013), Fuller (2007), Campoy (2012), and Mufson (2012).

Property Value, Ecosystem Service, and Economic Development Effects in Central and Western Virginia
7
Our geographic focus is a four-county region comprising Highland, Augusta,8 Nelson, and Buckingham
Counties in Virginia. This 2,480 square-mile region supports diverse land uses, from some of Virginia’s
wildest forests, the iconic Shenandoah Valley, the heart of Virginia’s Blue Ridge traversed by both the
Appalachian Trail and Blue Ridge Parkway, thriving cities, international retreat centers, historically and
culturally significant human settlements, working farms, and extensive commercial timberland. These
natural, cultural, and economic assets are among the reasons more than 150,000 people call this region
home and an even larger number visit each year for skiing, sightseeing, music and maple festivals,
spiritual retreats, weddings, wine tastings, brewery tours, and other pursuits.
Statistics from the Center for the
Study of Rural America, part of
the Federal Reserve Bank of
Kansas City, further reveal the
extent to which the region has the
right conditions for resilience and
economic success in the long run
(Low 2004). These data show that
the study region has a higher
human amenity index (based on
scenic amenities, recreational
resources, and access to health
care), more financial wealth in the
form of investment income per
capita, and stronger
entrepreneurship than most
Virginia counties (Figure 2).9
More traditional measures of
economic performance suggest
the region is strong and resilient.
From 2000 through 2014, for
example:
Population in the study region grew by 8.5%, compared to a 0.2% loss of population for non-
metro Virginia10
8 Two independent cities, Staunton and Waynesboro, lie within the geographic borders of Augusta County. In this report, subject to some limitations where noted, statistics, estimates, and other information labeled as “Augusta County” reflect totals for the County plus the two independent cities. 9 Note that the Fed’s statistics have not been updated since 2004-2006, and conditions in and outside the study region have undoubtedly changed. Some of these relative rankings may no longer hold. 10 “Non-metro Virginia” comprises those counties that are not a part of a federally defined metropolitan statistical area (MSA). While Augusta is part of the Staunton-Waynesboro-Augusta MSA and Nelson and Buckingham are part of the Charlottesville MSA, each of the study region counties are predominantly rural in landscape and character and are much more like other non-metro counties than they are like Northern Virginia or Tidewater. Therefore, we believe that averages
FIGURE 2: Regional Asset Indicators for the Study Region, Relative to All
Virginia Counties (Source: Federal Reserve Bank of Kansas City)
0%
10%
20%
30%
40%
50%
60%
70%
80%
90%
Hu
man
Am
en
ity
Ho
me
Va
lue
Ag
La
nd
Va
lue
Inve
stm
ent
Inco
me p
er
Ca
pita
En
trp
re-
ne
uria
lB
rea
dth
En
trp
re-
ne
uria
lD
ep
th
Cre
ative
Wo
rke
rs
Pe
rce
ntile
Ra
nk A
mo
ng
All
Virg
inia
Co
un
tie
s
Bar height representspecentile rank of theStudy Region Median
for allVirginia
Counties

Economics of the Atlantic Coast Pipeline
8
Employment grew by 6.3%, compared to a drop of 6.7% for non-metro Virginia
Personal income grew by 23.8%, compared to 13.1% for non-metro Virginia
Earnings per job are higher, by about $2,400/year, than the average for non-metro Virginia
Per capita income is higher, by $4,000/year, than the average for non-metro Virginia
Unemployment grew by less and ended the period two points lower than the average for non-
metro Virginia.11
These and other trends indicate not only that the region has been doing quite well, but also that it is
doing well with, and perhaps because of, a relative absence of industrial development like the ACP. The
region has what regional economists McGranahan and Wojan have called the “Rural Growth Trifecta”
of outdoor amenities, a creative class of workers, and a strong “entrepreneurial context” (innovation-
friendliness) (2010). Individual workers, retirees, and visitors are attracted to the natural beauty of the
region while entrepreneurs are attracted by the quality of the environment, by the quality of the
workforce, and by existing support from local government. Workers, for their part, are retained and
nurtured by dynamic businesses that fit with the landscape and lifestyle that attracted them in the first
place.
As four further indicators of this dynamic, consider since 2000:
The region’s population growth has been primarily due to in-migration
The proportion of the population 65 years and older has increased from 15.0% to 17.6%
Proprietors’ employment is up by 28.1%
Non-labor income (primarily investment returns and age-related transfer payments like Social
Security) is up by 45.8%.11
These trends suggest that entrepreneurs and retirees are moving to (or staying in) this region. They
bring their income, their expertise, and their job-creating energy with them.
Temporary residents – tourists and recreationists – are also an important part of the region’s economy.
Tourists spent more than $413 million in the study region in 2014. The companies that directly served
those tourists employed 3,866 people, or 4.9% of all full- and part-time workers (Headwaters
Economics, 2015; Virginia Tourism Corporation, 2015).
It is in this context the potential economic impacts of the ACP must be weighed and the apprehension
of the region’s residents understood. The region has been doing quite well on the strength of its
amenities and quality of life. Many believe the construction and operation of the pipeline will kill or at
least dampen the productivity of the proverbial goose that lays its golden eggs in the region. This could
result in a slower rate of growth, which would mean worse economic outcomes than would be
expected with a continued absence of a pipeline. For example, if the pipeline is built, business groups
for non-metro Virginia provide a more appropriate point of comparison than statistics that include the Commonwealth’s more urban areas. 11 These data are from Headwaters Economics (2015), US Bureau of Economic Analysis (2015), and US Bureau of the Census (2014, 2015).

Property Value, Ecosystem Service, and Economic Development Effects in Central and Western Virginia
9
Friends of Wintergreen and Nelson 151 identified $75 million in foregone investments and between
200 and 300 new employees who will not be hired (Theiss, 2015). These businesses, which depend on
the scenic and other amenities noted above, would simply not have enough business in the form of
visitors, diners, skiers, golfers, and others to justify their now-on-hold expansions and new
developments.
More dire is the prospect that such businesses will not be able to maintain their current levels of
employment. Just as retirees and many business can choose where to locate, visitors and potential
visitors have practically
unlimited choices for
places to spend their
vacation time and
expendable income. If
the study region loses
its amenity edge, other
things being equal,
people will go
elsewhere, and this
region could contract.
Instead of a “virtuous
circle” with amenities and quality of life attracting/retaining residents and visitors, who improve the
quality of life, which then attracts more residents and visitors, the ACP could tip the region into a
downward spiral. In that scenario, loss of amenity and risk to physical safety would translate into a
diminution or outright loss of the use and enjoyment of homes, farms, and recreational and cultural
experiences. Potential in-migrants would choose other locations and some long-time residents would
move away, draining the region of some of its most productive members. Homeowners would lose
equity as housing prices follow a stagnating economy. With fewer people to create economic
opportunity, fewer jobs and less income will be generated. Communities could become hollowed out,
triggering a second wave of amenity loss, out-migration, and further economic stagnation.
ENVIRONMENTAL-ECONOMIC EFFECTS AND WHERE THEY WOULD OCCUR In the remainder of this report, we follow this potential cycle and estimate three distinct types of
economic consequences.
First, corresponding to the direct biophysical impacts of the proposed pipeline, are effects on
ecosystem services – the benefits nature provides to people for free, like purified water or recreational
opportunities, that will become less available and/or less valuable due to the ACP’s construction and
operation. Second are effects on property value as owners and would-be owners choose properties
farther from the pipeline’s right-of-way, evacuation zone, viewshed, or, in the case of the compressor
station, noise. Third and finally are more general economic effects caused by a dampening of future
growth prospects or even a reversal of fortune for some industries.
“Whether they are seeking a retirement home or a weekend retreat, people choose Highland county BECAUSE it doesn't have what people have in other places—over-development, noise, traffic or pollution. They want to get away from all that and be where they can enjoy the peace and beauty of the natural landscape. For my clients, the viewshed, along with the previously mentioned attributes, was a critical driving factor in where they would purchase.”
– Fran Davenport, retired Realtor Monterey, Virginia

Economics of the Atlantic Coast Pipeline
10
We begin with an exploration of the geographic area over which these various effects will most likely be
felt.
Impact Zones within the Study Region
Construction of the pipeline corridor itself would require clearing an area 125 feet (38.1 m) wide in
most areas and 75 feet (22.9 m) wide in wetlands. After construction, the permanent right-of-way
(ROW) would be 75 feet wide along the entire length of the pipeline. It is from within this construction
zone and right-of-way that the greatest disruption of ecosystem processes will occur, so it is from these
zones that reductions in ecosystem service value (ESV) will emanate. Since we are estimating
ecosystem service values at their point of origin, we will focus on this zone in that analysis below. The
value of land crossed by the ROW and the somewhat larger number of parcels crossed by the
construction zone will be acutely affected.
Operated at its intended pressure and due to the inherent risk of leaks and explosions, the pipeline
would present the possibility of having significant human and ecological consequences within a large
“High Consequence Area” and an even larger evacuation zone. A High Consequence Area (HCA) is “the
area within which both the extent of property damage and the chance of serious or fatal injury would
be expected to be significant in the event of a rupture failure (Stephens, 2000, p. 3).” Using Stephens’
formula, the HCA for this pipeline would have a radius of 1,092 feet (332.8 m). The evacuation zone is
defined by the distance beyond which an unprotected human could escape burn injury in the event of
the ignition or explosion of leaking gas (Pipeline Association for Public Awareness, 2007, p. 29). There
would be a potential evacuation zone with a radius of 3,583 feet (1092.1 m).12 An explosion would
definitely affect ecosystem processes within the HCA, but given the probability of an explosion at any
given point along the pipeline at a given time is small, we do not include effects on ecosystem service
value in this zone in our cost estimates.
Effects on land value are another matter, and it is reasonable to consider land value impacts through
both the high consequence area and the evacuation zone. As Kielisch (2015) stresses, the value of land
is determined by human perception, and property owners and would-be owners have ample reason to
perceive risk to property near high-pressure natural gas transmission pipelines. Traditional news
reports, YouTube, and other media reports attest to the occurrence and consequences of pipeline leaks
and explosions, which are even more prevalent for newer pipelines than for those installed decades
ago (S. Smith, 2015). Information about pipeline risks translates instantly into buyers’ perceptions and,
therefore, into the chances of selling a property exposed to those risks, into prices offered for those
properties, and, for people who already own such properties, into diminished enjoyment of them.
Along similar lines, compressor stations have been implicated in a variety of illnesses among nearby
residents. (Subra, 2009, 2015). The stations can also be noisy, with low-frequency noise cited as a
constant nuisance. (“Proximity of Compressor Station Devalues Homes by as much as 50%,” 2015).
These issues have led some homeowners to pull-up stakes and move away and to reduced property
value assessments for others (Cohen, 2015; “Proximity of Compressor Station Devalues Homes by as
12 See the map (Figure 3) which includes a close-up of these zones near the Augusta-Nelson County line.
Property Value, Ecosystem Service, and Economic Development Effects in Central and Western Virginia
11
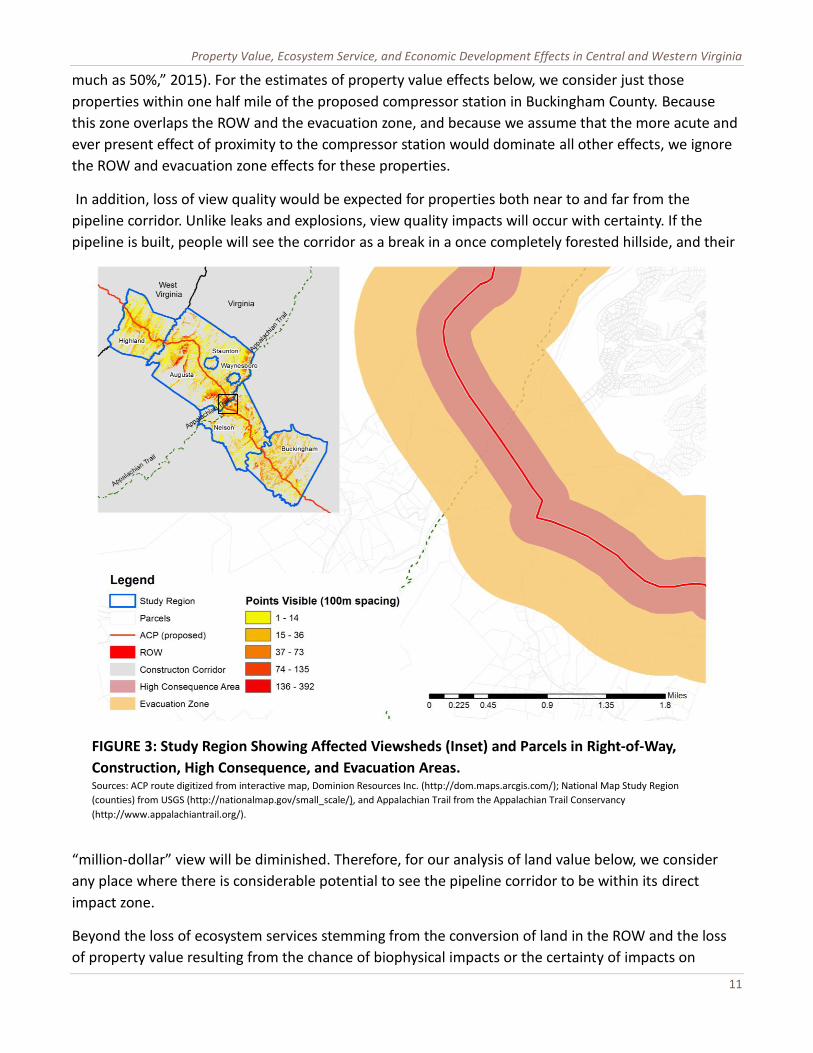
much as 50%,” 2015). For the estimates of property value effects below, we consider just those
properties within one half mile of the proposed compressor station in Buckingham County. Because
this zone overlaps the ROW and the evacuation zone, and because we assume that the more acute and
ever present effect of proximity to the compressor station would dominate all other effects, we ignore
the ROW and evacuation zone effects for these properties.
In addition, loss of view quality would be expected for properties both near to and far from the
pipeline corridor. Unlike leaks and explosions, view quality impacts will occur with certainty. If the
pipeline is built, people will see the corridor as a break in a once completely forested hillside, and their
“million-dollar” view will be diminished. Therefore, for our analysis of land value below, we consider
any place where there is considerable potential to see the pipeline corridor to be within its direct
impact zone.
Beyond the loss of ecosystem services stemming from the conversion of land in the ROW and the loss
of property value resulting from the chance of biophysical impacts or the certainty of impacts on
FIGURE 3: Study Region Showing Affected Viewsheds (Inset) and Parcels in Right-of-Way,
Construction, High Consequence, and Evacuation Areas. Sources: ACP route digitized from interactive map, Dominion Resources Inc. (http://dom.maps.arcgis.com/); National Map Study Region
(counties) from USGS (http://nationalmap.gov/small_scale/), and Appalachian Trail from the Appalachian Trail Conservancy
(http://www.appalachiantrail.org/).

Economics of the Atlantic Coast Pipeline
12
aesthetics, the proposed ACP would also diminish physical ecosystem services, scenic amenity, and
passive-use value that are realized or enjoyed beyond the evacuation zone and out of sight of the
pipeline corridor. The people affected include residents, businesses, and landowners throughout the
study region, as well as past, current, and future visitors to the region. The impacts on human well-
being would be reflected in economic decisions such as whether to stay in or migrate to the study
region, whether to choose the region as a place to do business, and whether to spend one’s scarce
vacation time and dollars near the ACP instead of in some other place.
To the extent the ACP causes such decisions to favor other regions, less spending and slower economic
growth in the study region would be the result. One would expect a secondary effect of that slower
growth on land values, but in this study we consider the primary effects in terms of slower population,
employment, and income growth in key sectors. Table 2 summarizes the types of economic values
considered in this study and the zones in which they are estimated.
One would also expect economic development effects to spill beyond the county boundaries that
define our study region. For example, the Satchidananda Ashram - Yogaville attracts thousands of
visitors to the region each year (5,642 in 2014; 3,687 through early August, 2015) from around the
world. Based on its own survey of past visitors, leaders there anticipate visits will decrease drastically,
perhaps catastrophically if the ACP is built near its campus in Buckingham County. Most of its students,
instructors, and other visitors come from out of state, so fewer visits to Yogaville will mean, for
example, fewer flights into Charlottesville-Albemarle airport, fewer car rentals, and perhaps fewer side
excursions to Monticello or extended stays in the wider region. Such negative economic effects of the
pipeline would be felt in Charlottesville and Albemarle County and would be in addition to the direct
effects felt by Yogaville and/or within the immediate study region.
The same dynamic would play out if, as business leaders fear, people from outside the study region
make fewer trips to Wintergreen for skiing, attend fewer wine tastings or concerts in the Rockfish
Valley, skip a stay in the Shenandoah Valley, or make fewer return visits to the Highland Maple festival.
We do not include those outside-the-region effects in the current study. This is a matter of study
scoping and budget only, and should not be construed as a suggestion that these and other impacts
cease at the Buckingham-Albemarle County line or any other study region boundary. The effects we do
include are enumerated and estimated in more detail in the following sections. To recap before
proceeding, Table 2 summarizes the geographic extent of the values and analyses included as well as
those that should be considered as part of FERC’s research agenda to gain an even more complete
picture of the proposed ACP’s economic effects.

Property Value, Ecosystem Service, and Economic Development Effects in Central and Western Virginia
13
TABLE 2: Geographic Scope of Effects.
A check mark Indicates those zones/effects for which estimates are Included in this study. The "X’s" indicate areas for
future study.
Values /
Effects
Right-of-Way
and
Construction
Zone
High
Consequence
Area
Evacuation
Zone
Com-
pressor
Station
Zone
Pipeline
Viewshed
Entire
Study
Region
The
World
Beyond
the Study
Region
Ecosystem
Services a a a
a,b
Land /
Property
Value
c
d d
e n/a
Economic
Develop-
ment
Effects
f f f f f n/a
Notes:
a. Changes in ecosystem services that are felt beyond the ROW and Construction zone may be key drivers of
“Economic Development Effects,” but they are not separately estimated to avoid double counting.
b. With the exception of the impact on visual quality, we do not estimate the spillover effects of alteration of
the ecosystem within the ROW on the productivity of adjacent areas. The ROW, for example provides a
travel corridor to invasive species that could reduce the integrity and ecosystem productivity of areas that,
without the ACP would remain core ecological areas, interior forest habitat, etc.
c. We estimate land value effects for the ROW but not for the construction zone.
d. Properties in the HCA are treated as though there is no additional impact on property value relative to the
impact of being in the evacuation zone. Also, we exclude properties in the compressor station zone from
estimates of impacts related to the ROW and the evacuation zone. The reason is that while the compressor
station’s effects on land value may be similar (that is, they are driven by health and safety concerns and
possible loss of use), they are both more acute and more certain. (Noise and air emissions from the
compressor stations will be routine, while leaks from the pipeline should be rare.) We assume that the
ongoing effects of the compressor station on use and enjoyment of properties nearby would overshadow or
dominate the possibility of a high-consequence event or the need to evacuate.
e. To avoid double-counting, changes in property value due to an altered view from the property are
considered to be part of lost aesthetic value under the heading of ecosystem services.
f. Economic development effects related to these subsets of the study region are included in estimates for the
study region.

Economics of the Atlantic Coast Pipeline
14
EFFECTS ON ECOSYSTEM SERVICE VALUE The idea that people receive benefits from nature is not at all
new, but “ecosystem services” as a term describing the
phenomenon is more recent, emerging in the 1960s
(Millennium Ecosystem Assessment, 2003). “Benefits people
obtain from ecosystems” is perhaps the simplest and most
commonly heard definition of ecosystem services (Reid et al.,
2005). Other definitions abound, including the following from
Gary Johnson of the University of Vermont. It is helpful both
because it emphasizes that services are not necessarily things–
tangible bits of nature–but rather, they are the effects on
people of the functions of bits of nature:
Ecosystem services are the effects on human well-being of
the flow of benefits from an ecosystem endpoint to a human
endpoint at a given extent of space and time (2010).
This definition also makes clear that ecosystem services happen
or are produced and enjoyed in particular places and at
particular times.
No matter the definition, different types of ecosystems (forest,
wetland, cropland, urban areas) produce different arrays of
ecosystem services, and/or they produce similar services to
greater or lesser degrees. Certain ecosystems or land uses
simply produce a higher flow of benefits than others.
“Ecosystem services” is sometimes lengthened to “ecosystem
goods and services” to make it explicit that some are tangible,
like physical quantities of food, water for drinking, and raw
materials, while others are truly services, like cleaning the air
and providing a place with a set of attributes that are conducive
to recreational experiences or aesthetic enjoyment. We use the
simpler “ecosystem services” here. Table 3, lists the
provisioning, regulating, and cultural ecosystem services
included in this study.
At a conceptual level, we estimate the potential effects of the
ACP on ecosystem service value by identifying the extent to
which the construction and longer-term existence of the
pipeline would change land cover or land use, which in turn results in a change in ecosystem
productivity. Construction would essentially strip bear the 125-foot-wide construction corridor. Once
construction is complete and after some period of recovery, the 75-foot-wide right-of-way will be
Ecosystem Service Impacts 1: Water Supply
Currently the Cowpasture River Valley in Highland County enjoys naturally clean water thanks to environmental filtration. However, if the ACP is built any contamination that it causes through erosion, sedimentation, or spills would carry high costs.
For a domestic well, a landowner would face an estimated out-of-pocket expense of $35,000 or more to drill into a potable aquifer. For a livestock operation, which needs more water, a contaminated aquifer would be even worse. Dairies and ranches in the Cowpasture River Valley that need to replace their water supply would face an estimated cost of $50,000, and they would need an emergency supply of 20,000 gallons daily. If a city or town must replace a municipal water supply that becomes contaminated, the costs are even higher; it would take an estimated out-of-pocket cost of $2.5 million to complete geophysical, hydrological, and engineering studies, purchase land, drill a well, and build the necessary surrounding infrastructure.
-Nelson Hoy, Cowpasture River Preservation Association

Property Value, Ecosystem Service, and Economic Development Effects in Central and Western Virginia
15
TABLE 3: Ecosystem Services Included in Valuation
Provisioning Servicesa
Food Production: The harvest of agricultural produce, including crops, livestock, and livestock by-products; the food value of hunting, fishing, etc.; and the value of wild-caught and aquaculture-produced fish.
Associated land usesb: Cropland, Pasture/Forage, Forest
Raw Materials: Fuel, fiber, fertilizer, minerals, and energy.
Associated land usesb: Forest
Water Supply: Filtering, retention, storage, and delivery of fresh water—both quality and quantity—for drinking, irrigation, industrial processes, hydroelectric generation, and other uses.
Associated land usesb: Forest, Water, Wetland
Regulating Servicesa
Air Quality: Removing impurities from the air to provide healthy, breathable air for people.
Associated land usesb: Shrub/Scrub, Forest, Urban Open Space
Biological Control: Inter- and intra-specific interactions resulting in reduced abundance of species that are pests, vectors of disease, or invasive in a particular ecosystem.
Associated land usesb: Cropland, Pasture, Grassland, Forest
Climate Regulation: Storing atmospheric carbon in biomass and soil as an aid to the mitigation of climate change, and/or keeping regional/local climate (temperature, humidity, rainfall, etc.) within comfortable ranges.
Associated land usesb: Pasture/Forage, Grassland, Shrub/Scrub, Forest, Wetland, Urban Open Space, Urban Other
Erosion Control: Retaining arable land, stabilizing slopes, shorelines, riverbanks, etc.
Associated land usesb: Cropland, Pasture/Forage, Grassland, Shrub/Scrub, Forest
Pollination: Contribution of insects, birds, bats, and other organisms to pollen transport resulting in the production of fruit and seeds. May also include seed and fruit dispersal.
Associated land usesb: Cropland, Pasture/Forage, Grassland, Forest
Protection from Extreme Events: Preventing and mitigating impacts on human life, health, and property by attenuating the force of winds, extreme weather events, floods, etc.
Associated land usesb: Forests, Urban Open Space, Wetland
Soil Fertility: Creation of soil, inducing changes in depth, structure, and fertility, including through nutrient cycling.
Associated land usesb: Cropland, Pasture/Forage, Grassland, Forest
Waste Treatment: Improving soil and water quality through the breakdown and/or immobilization of pollution.
Associated land usesb: Cropland, Pasture/Forage, Grassland, Shrub/Scrub, Forest, Water, Wetland
Water Flows: Regulation by land cover of the timing of runoff and river discharge, resulting in less severe drought, flooding, and other consequences of too much or too little water available at the wrong time or place.
Associated land usesb: Forests, Urban Open Space, Urban Other
Cultural Servicesa
Aesthetic Value: The role that beautiful, healthy natural areas play in attracting people to live, work, and recreate in a region.
Associated land usesb: Forest, Pasture/Forage, Urban Open Space, Wetland
Recreation: The availability of a variety of safe and pleasant landscapes—such as clean water and healthy shorelines—that encourage ecotourism, outdoor sports, fishing, wildlife watching, etc.
Associated land usesb: Cropland, Forest, Water, Wetland, Urban Open Space, Urban Other
Notes: a. Descriptions follow Balmford (2010, 2013), Costanza et al. (1997), Reid et al. (2005), and Van der Ploeg, et al. (2010). b. “Associated Land Uses” are limited to those for which per-unit-area values are available in this study.

Economics of the Atlantic Coast Pipeline
16
occupied by a different set of ecosystem (land cover) types than were present before construction. By
applying per-acre ecosystem service productivity estimates (denominated in dollars) to the various
arrays of ecosystem service types, we can estimate ecosystem service value before, during, and after
construction. The difference between ecosystem service value during construction and before
construction is the cost during construction. The difference between the ecosystem service value
during ongoing operations (i.e., the value produced in the ROW) and the before-construction baseline
is the annual ecosystem service cost that will be experienced indefinitely.
This overall process is illustrated in Figure 4 and the details of our methods, assumptions, and
calculations are described in the following two sub sections.
Ecosystem Service Estimation Methods
Economists have developed widely used methods to estimate the dollar value of ecosystem services
and/or natural capital. The most widely known example was a study by Costanza et al. (1997) that
valued the natural capital of the entire world. That paper and many others since employ the “benefit
transfer method” or “BTM” to establish a value for the ecosystem services produced or harbored from
a particular place.13 According to the Organization for Economic Cooperation and Development, BTM is
“the bedrock of practical policy analysis,” particularly in cases such as this when collecting new primary
data is not feasible (OECD, 2006).
As the name implies, BTM takes a rate of ecosystem benefit delivery calculated for one or more “source
areas” and applies that rate to conditions in the “study area.” As Batker et al. (2010) state, the method
is very much like a real estate appraiser using comparable properties to estimate the market value of
the subject property. It is also very much like using an existing or established market or regulated price,
such as the price of a gallon of water, to estimate the value of some number of gallons of water
supplied in some period of time. The key is to select “comps” (data from source areas) that match the
circumstances of the study area as closely as possible.
Typically, values are drawn from previous studies that estimate the value of various ecosystem services
from similar land cover or ecosystem types. Also, it is benefit (in dollars) per-unit-area-per-year in the
source area that is transferred and applied to the number of hectares or acres in the same land
cover/biome in the study area. So, for example, if data for the source area includes the value of forest
land for recreation, one would apply per-acre values from the source area’s forest to the number of
acres of forestland in the study area. Furthermore, it is important to use source studies that are from
regions with underlying economic, social, and other conditions similar to the study area.
Following these principles as well as techniques developed by Esposito et al. (2011), Esposito (2009),
and Phillips and McGee (2014, 2016), and as illustrated in Figure 4, we employ a four-step process to
evaluate the short-term and long-term effects of the ACP on ecosystem service value in our study
region. The steps are described in greater detail below, but in summary, they are:
13 See also Esposito et al. (2011), Flores et al. (2013), and Phillips and McGee (2014) for more recent examples.

Property Value, Ecosystem Service, and Economic Development Effects in Central and Western Virginia
17
1. Assign land and water in the study to one of 10 land uses based on remotely sensed (satellite)
data in the National Land Cover Dataset (NLCD) (Fry et al., 2011). This provides the array of land
uses for estimating baseline or “without ACP” ecosystem service value.
2. RE-assign or re-classify land and water to what the land cover would most likely be during
construction and during ongoing operation.
3. Multiply acreage by per-acre ecosystem service productivity (the “comps”) to obtain estimates
of aggregate ecosystem service value under the baseline/no ACP scenario, for the construction
corridor (and period), and for the ROW during ongoing operation.
For simplicity and given the two-year construction period, we assume that the construction
FIGURE 4: Ecosystem Service Valuation Concept Map
Follow the green lines to baseline (without ACP) ecosystem service value. Grey dashed lines show the path to
ecosystem service value during construction. Brown dashed lines lead to values during ongoing operation.
Differences between construction and operations value and the baseline yield estimates of the cost of the ACP in
terms of ecosystem services forgone.
Economics of the Atlantic Coast Pipeline
18
corridor will remain barren for a full two-year period. We recognize that revegetation will begin
to occur soon after the trench is closed and fill and soil are returned, but it will still be some
time until something like a functioning ecosystem has actually been restored.
4. Subtract baseline ESV from ESV for the construction period (and in the construction corridor)
and from ESV during ongoing operations (in the ROW) to obtain estimates of the ecosystem
service costs imposed annually during the construction and operations period, respectively.
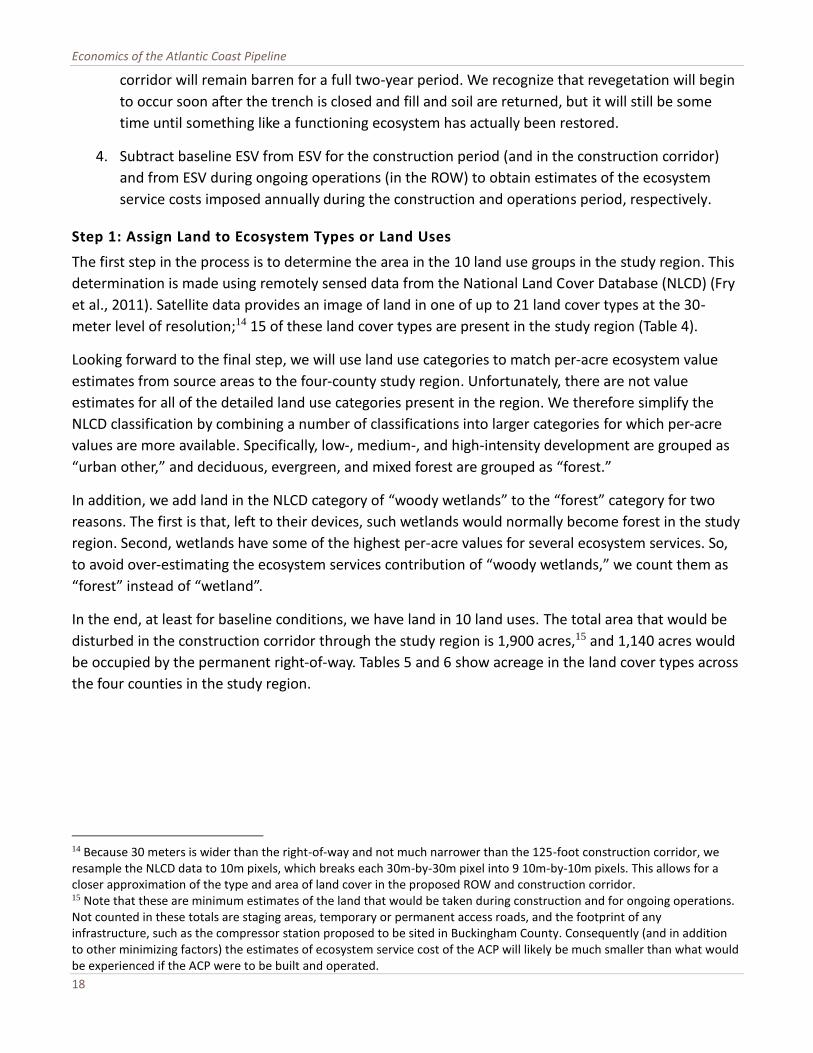
Step 1: Assign Land to Ecosystem Types or Land Uses
The first step in the process is to determine the area in the 10 land use groups in the study region. This
determination is made using remotely sensed data from the National Land Cover Database (NLCD) (Fry
et al., 2011). Satellite data provides an image of land in one of up to 21 land cover types at the 30-
meter level of resolution;14 15 of these land cover types are present in the study region (Table 4).
Looking forward to the final step, we will use land use categories to match per-acre ecosystem value
estimates from source areas to the four-county study region. Unfortunately, there are not value
estimates for all of the detailed land use categories present in the region. We therefore simplify the
NLCD classification by combining a number of classifications into larger categories for which per-acre
values are more available. Specifically, low-, medium-, and high-intensity development are grouped as
“urban other,” and deciduous, evergreen, and mixed forest are grouped as “forest.”
In addition, we add land in the NLCD category of “woody wetlands” to the “forest” category for two
reasons. The first is that, left to their devices, such wetlands would normally become forest in the study
region. Second, wetlands have some of the highest per-acre values for several ecosystem services. So,
to avoid over-estimating the ecosystem services contribution of “woody wetlands,” we count them as
“forest” instead of “wetland”.
In the end, at least for baseline conditions, we have land in 10 land uses. The total area that would be
disturbed in the construction corridor through the study region is 1,900 acres,15 and 1,140 acres would
be occupied by the permanent right-of-way. Tables 5 and 6 show acreage in the land cover types across
the four counties in the study region.
14 Because 30 meters is wider than the right-of-way and not much narrower than the 125-foot construction corridor, we resample the NLCD data to 10m pixels, which breaks each 30m-by-30m pixel into 9 10m-by-10m pixels. This allows for a closer approximation of the type and area of land cover in the proposed ROW and construction corridor. 15 Note that these are minimum estimates of the land that would be taken during construction and for ongoing operations. Not counted in these totals are staging areas, temporary or permanent access roads, and the footprint of any infrastructure, such as the compressor station proposed to be sited in Buckingham County. Consequently (and in addition to other minimizing factors) the estimates of ecosystem service cost of the ACP will likely be much smaller than what would be experienced if the ACP were to be built and operated.

Property Value, Ecosystem Service, and Economic Development Effects in Central and Western Virginia
19
Step 2: Re-assign Acreage to New Land Cover Types for the Construction and Operation
Periods
Table 4 lists the reassignment assumptions in detail, but in general, we assume that all land in the
construction corridor will be “barren” or at least possess the same ecosystem service productivity
profile as naturally-occurring barren land for the duration of the construction period. Water will remain
water during construction.
FIGURE 5: Land Use in the Study Region, Classified for Ecosystem Service Valuation
Land cover for the entire study region is shown to display the overall range and pattern of land use. The
ecosystem service valuation itself covers only those portions of the study region that would be occupied by the
ACP right-of-way and construction corridor.
Source: National Land Cover Database (Fry, et al. 2011).

Economics of the Atlantic Coast Pipeline
20
TABLE 4: Land Cover Reclassification
NLCD Category
Reclassification for
Baseline
Reclassification for
Construction
Reclassification for
Ongoing Operation
Barren Land Barren Barren Barren
Cultivated Crops Cropland Barren Pasture/Forage
Pasture/Hay Pasture/Forage Barren Pasture/Forage
Grassland/Herbaceous Grassland Barren Grassland
Shrub/Scrub Shrub/Scrub Barren Shrub/Scrub
Deciduous Forest Forest Barren Shrub/Scrub
Evergreen Forest Forest Barren Shrub/Scrub
Mixed Forest Forest Barren Shrub/Scrub
Woody Wetlands Forest Barren Shrub/Scrub
Open Water Water Water Water
Emergent Herbaceous Wetlands
Wetland Barren Wetland
Developed, Open Space Urban Open Space Barren Urban Open Space
Developed, Low Intensity Urban Other Barren Urban Other
Developed, Medium Intensity
Urban Other Barren Urban Other
Developed, High Intensity Urban Other Barren Urban Other
For the indefinite period following construction—during ongoing operations—we assume that pre-ACP
forestland will become shrub/scrub, and cropland will become pasture/forage. We recognize that some
pre-ACP cropland may be used for crops after construction has been completed, but as expressed in
comments to FERC and elsewhere and as we discovered through personal interviews with agricultural
producers in the region, it seems likely that the ability to manage acreage for row crops will be greatly
curtailed, if not eliminated entirely by the physical limits imposed by the ACP and by restrictions in
easements to be held by ACP LLC. These include limits on the weight of equipment that could cross the
corridor at any given point and difficulty using best soil conservation practices, such as tilling along a
contour, which may be perpendicular to the pipeline corridor. (This would require extra time and fuel
use that could render some fields too expensive to till, plant, or harvest.) Reclassifying cropland as
pasture/forage (which is generally less productive of ecosystem services) recognizes these effects while
also recognizing that some sort of future agricultural production in the ROW (grazing and possibly
haying) could be possible.
An additional effect not captured in our methods is long-standing harm to agricultural productivity due
to soil compaction, soil temperature changes, and alteration of drainage patterns due to pipeline
construction. As agronomist Richard Fitzgerald (2015) concludes, “It is my professional opinion that the
productivity for row crops and alfalfa will never be regenerated to its existing present ‘healthy’ and
productive condition [after installation of the pipeline]." Thus the true loss in food and other ecosystem
service value from pasture/forage acreage would be larger than our estimates reflect.

Property Value, Ecosystem Service, and Economic Development Effects in Central and Western Virginia
21
TABLE 5: Acreage in Proposed Construction Corridor, by Land Cover and County, Baseline and in “With ACP” Scenario
Land Cover Classification
Highland Augusta Nelson Buckingham
Baseline w/ ACP Baseline w/ ACP Baseline w/ ACP Baseline w/ ACP
Barren 0.0 386.0 0.3 708.1 - 395.9 12.6 409.0
Cropland 3.5 - 37.9 - 2.1 - 0.3 -
Pasture/Forage 76.4 - 249.0 - 35.2 - 52.4 -
Grassland - - - - - - 26.5 -
Shrub/Scrub - - - - - - 13.2 -
Forest 293.5 - 386.6 - 345.7 - 297.1 -
Water 0.2 0.2 - - 0.8 0.8 0.4 0.4
Wetland - - - - 0.3 - - -
Urban Open Space 12.6 - 31.7 - 11.6 - 6.6 -
Urban Other - - 2.6 - 1.1 - 0.2 -
Total 386.2 386.2 708.1 708.1 396.7 396.7 409.4 409.4
TABLE 5: Continued
Land Cover Classification
Study Region
Baseline w/ ACP
Barren 12.9 1,899.0
Cropland 43.8 -
Pasture/Forage 413.0 -
Grassland 26.5 -
Shrub/Scrub 13.2 -
Forest 1,322.9 -
Water 1.3 1.3
Wetland 0.3 -
Urban Open Space 62.5 -
Urban Other 3.8 -
Total 1,900.3 1,900.3

Economics of the Atlantic Coast Pipeline
22
TABLE 6: Acreage in Proposed Right-of-Way, by Land Cover and County, Baseline and in “with ACP” Scenario
Land Cover Classification
Highland Augusta Nelson Buckingham
Baseline w/ ACP Baseline w/ ACP Baseline w/ ACP Baseline w/ ACP
Barren - - 0.0 0.0 - - 7.5 7.5
Cropland 2.0 - 23.2 - 1.2 - 0.2 - Pasture/Forage 46.1 48.1 148.8 172.1 20.8 22.0 31.2 31.4
Grassland - - - - - - 16.3 16.3
Shrub/Scrub - 176.4 - 233.0 - 207.6 7.7 185.9
Forest 176.4 - 233.0 - 207.6 - 178.2 - Water 0.1 0.1 - - 0.5 0.5 0.2 0.2
Wetland - - - - 0.2 0.2 - - Urban Open
Space 7.7 7.7 18.4 18.4 6.8 6.8 4.1 4.1
Urban Other - - 1.5 1.5 0.6 0.6 0.1 0.1
Total 232.3 232.3 425.0 425.0 237.8 237.8 245.5 245.5
TABLE 6: Continued
Land Cover Classification
Study Region
Baseline w/ ACP
Barren 7.6 7.6
Cropland 26.7 - Pasture/Forage 246.9 273.6
Grassland 16.3 16.3
Shrub/Scrub 7.7 802.9
Forest 795.2 - Water 0.8 0.8
Wetland 0.2 0.2
Urban Open Space
37.0 37.0
Urban Other 2.2 2.2
Total 1,140.5 1,140.5
Step 3: Multiply Acreage by Per-Acre Value to Obtain ESV
After obtaining acreage by land use in the construction corridor and the ROW, we are ready to multiply
those acres times per-acre-per-year ecosystem service productivity to obtain total ecosystem service
value in each area and for with- and without-pipeline scenarios. Per-acre ecosystem service values are
obtained primarily from a database of more than 1,300 estimates compiled as part of a global study
known as “The Economics of Ecosystems and Biodiversity” or “the TEEB” (Van der Ploeg et al., 2010).16
16 Led by former Deutsche Bank economist, Pavan Sukhdev, the TEEB is designed to “[make] nature’s values visible” in order to “mainstream the values of biodiversity and ecosystem services into decision-making at all levels” (“TEEB - The Initiative,” n.d.). It is also an excellent example of the application of the benefit transfer method.

Property Value, Ecosystem Service, and Economic Development Effects in Central and Western Virginia
23
The TEEB database allows the user to
select the most relevant per-unit-area
values, based on the land use/land cover
profile of the study region, comparison of
general economic conditions in the
source and study areas, and the general
“fit” or appropriateness of the source
study for use in the study area at hand.
After eliminating estimates from lower-
income countries and estimates from the
U.S. that came from circumstances vastly
different from central and western
Virginia, we identified 91 per-acre
estimates in the TEEB that adequately
provide approximations of ecosystem
service value in our study region.17
After selecting the best candidate studies
and estimates in the TEEB database, we
still had some key land use/ecosystem
services values (such as food from
cropland) without value estimates. To fill
some of the most critical gaps, we turned
to other studies that had examined
ecosystem service value in this general
region (Phillips, 2015a; Phillips & McGee,
2016) and to specific data on cropland
and pasture/hayland value from Virginia
Cooperative Extension and the National
Agricultural Statistics Service (Lex &
Groover, 2015).
For several land cover-ecosystem service
combinations, either multiple source
studies were available or the authors of
those studies reported a range of dollar-
per-acre ecosystem service values. We
17 Among those U.S. studies included in the TEEB database that we deemed inappropriate for use here were a study from Cambridge Massachusetts that reported extraordinarily high values for aesthetic and recreational value and the lead author’s own research on the Tongass and Chugach National Forests in Alaska. (The latter was excluded due to the vast differences in land use, land tenure, climate, and other factors between the source area and the current study region.)
Ecosystem Service Effects 2: Food and
Farmland
Cros-B-Crest Farm in Staunton was established in
1894 and is now recognized by the Commonwealth of
Virginia as a “Century Farm.” Harry Crosby is the fourth
generation to farm this land and has seen the damage
that a utility corridor (last time it was a power line) can
do to property values and quality of life. This time,
Crosby says, the impacts would be even more profound.
The proposed ACP would affect the farm operations
and the farm in several ways. First, the pipeline would
run more or less directly down the natural slope of one
of Cros-B-Crest’s best fields, while Mr. Crosby, to
conserve soil and otherwise exercise good stewardship,
farms the field along the natural contour. Interrupting
the contour with the pipeline would lead to increased
erosion. Due to restrictions on crossing the pipeline
with larger farm equipment, the ACP would effectively
take the entire field (30-40 acres in total) out of
production.
Even if the field could still be used, Crosby expects that
it would not return to its current high level of
productivity any time soon. Digging up, trenching,
filling, and attempting to put back the soil will, however
carefully done, disrupt the soil profile, increase
compaction and otherwise depress fertility that has
taken nature and the Crosby family generations to build.
(Crosby, 2015a, 2015b).
Beyond the impact on farm operations themselves,
Crosby says, the ACP will reduce the enjoyment the
family receives from owning and living on the property
(Crosby, 2015b). The family might not realize the
financial loss unless or until it sells the farm, but it will
experience the loss of well-being every day.

Economics of the Atlantic Coast Pipeline
24
are therefore able to report both a low and a high estimate based on the bottom and top end of the
range of available estimates.
In the end, we have 162 separate estimates from 60 unique source studies covering 57 combinations of
land uses and ecosystem services. (See Appendix A to this report for a full list of the values and sources
that yielded these estimates.) This is still fairly sparse coverage, given that there are 140 possible
combinations of the 10 land uses and 14 services. We therefore know that our aggregate estimates will
be lower than they would be if dollar-per-acre values for all 14 services were available to transfer to
each of the 10 land use categories in the study region. One can either live with that known
underestimation, or one can assign per-acre values from a study of one land-use-and-service
combination to other combinations. Doing so would introduce unknown over- or perhaps under-
estimation of aggregate values. We prefer to take the first course, knowing that our estimates are
low/conservative and urge readers to bear this in mind when interpreting this information for use in
weighing the costs of the proposed ACP.
With acreage and per-acre ecosystem service values in hand, we can now calculate ecosystem service
value for each of the four area/scenario combinations. To repeat, these are:
Baseline ecosystem service value in the proposed construction corridor
Ecosystem service value in the construction corridor during construction
Baseline ecosystem service value in the proposed right-of-way
Ecosystem service value in the right-of-way during the (indefinite) period of ongoing
operations.18
Value calculations are accomplished according to this formula
ESV = ∑ [(𝐴𝑐𝑟𝑒𝑠𝑗) × ($/𝑎𝑐𝑟𝑒/𝑦𝑒𝑎𝑟)𝑖,𝑗𝑖,𝑗 ] Where:
Acresj is the number of acres in land use (j)
($/acre/year)i,j is the dollar value of each ecosystem service (i) provided from each land
use (j) each year. These values are drawn from the TEEB database and
other sources listed in Appendix A.
Step 4: Subtract Baseline ESV from ESV in “with ACP” Scenario
With the steps above complete, we can now estimate the cost in ecosystem service value of moving
from the baseline or status quo to a scenario in which the ACP is built and operating.
The cost of construction is the ESV from the construction corridor during construction, minus baseline
ESV for the construction corridor, times two. The multiplication by two is due to the conservative
18 Note that while the ROW and construction corridors overlap in space, they do not overlap in time, at least not from an ecosystem services production standpoint. During construction, the land cover that would eventually characterize the ROW will not exist in the construction corridor. Thus, there is no double counting of ecosystem service values or of costs from their diminution as a result of either construction or ongoing operations.

Property Value, Ecosystem Service, and Economic Development Effects in Central and Western Virginia
25
assumption that revegetation and restoration to a land use that is functionally different from barren
land will take at least two years.
The ecosystem service cost of ongoing operations is ESV from the ROW in the “with ACP” scenario
minus the baseline ESV for the ROW. This will be an annual cost borne every year in perpetuity.
Ecosystem Service Value Estimates
In the baseline or “no pipeline” scenario, the construction corridor produces between $8.5 million and
$30.5 million per year in ecosystem service value (ESV). The largest contributors to this total (at the
high end) are aesthetic value, water supply, and protection from extreme events. Under a “with ACP”
scenario, and not surprisingly given the temporary conversion to bare/barren land, these figures drop
to near zero, or between $239 and $1,882 per year for each of the two years. Taking the difference as
described above, estimated per-year ecosystem service cost of the ACP’s construction would be
between $8.5 and $30.5 million, or between $17 and $61 million over two years in the four-county
study region.
Loss of aesthetic value and impacts on water (both supply and regulation of flow) represent the largest
losses during the construction phase (Table 7).
TABLE 7: Ecosystem Service Value Lost in Construction Corridor in Each of Two Years, Relative to Baseline, by Ecosystem
Service (2014$)
Ecosystem Service
Study Region
Baseline (low) Loss (low) Baseline (high) Loss (high)
Aesthetic Value 5,982,745 -5,982,745 24,137,935 -24,137,935
Air quality 495,418 -495,418 505,421 -505,421
Biological Control 10,671 -10,671 27,452 -27,452
Climate Regulation 149,445 -149,445 163,468 -163,468
Erosion Control 13,270 -13,270 115,341 -115,341
Protection from Extreme Events 1,074,981 -1,074,981 1,094,775 -1,094,775
Food Production 10,598 -10,598 10,598 -10,598
Pollination 275,968 -275,968 362,646 -362,646
Raw materials 32,462 -32,462 220,696 -220,696
Recreation 12,302 -12,107 680,247 -679,050
Soil formation 9,930 -9,930 33,025 -33,025
Waste Treatment 19,858 -19,844 394,699 -394,685
Water Supply 62,726 -62,695 1,710,877 -1,710,205
Water flows 307,049 -307,049 1,069,378 -1,069,378
Total $8,457,424 -$8,457,185 $30,526,558 -$30,524,675
The ecosystem service costs for the ROW are predictably smaller on a per-year basis, but because they
will persist indefinitely the cumulative effect will be much higher. Under the “with ACP” scenario, and
using minimum values, annual ecosystem service value from the ROW falls from $5.1 million to about
$212,000 for an annual loss of over $4.8 million. At the high end, the ecosystem service value of the
ROW would fall from $18.3 million to about $554,000 for an annual loss of $17.8 million.

Economics of the Atlantic Coast Pipeline
26
Most of this loss is due to the conversion of forestland to shrub/scrub. Shrub/scrub naturally increases
its share of overall ecosystem service value in the “with pipeline” scenario. Those gains are dwarfed,
however, by the loss of much more productive forests. Similarly, the value of cropland falls due to its
assumed transition to pasture/forage. While there is some gain in the pasture/forage category, there is
a net loss of ecosystem service value from the two agricultural land uses of between $2,500 and
$63,000 per year (Table 8).19
TABLE 8: Ecosystem Service Value Lost Each Year Post Construction in Right-Of-Way, Relative to Baseline, by Ecosystem
Service (2014$)
Ecosystem Service
Study Region
Baseline (low) Loss (low) Baseline (high) Loss (high)
Aesthetic Value 3,595,366 -3,528,488 14,507,758 -14,425,064
Air quality 297,755 -266,627 303,670 -266,627
Biological Control 6,405 -1,994 16,557 -12,146
Climate Regulation 89,097 -39,359 97,529 -47,760
Erosion Control 7,964 15,371 69,285 -31,221
Protection from Extreme Events 645,951 -634,265 657,820 -634,265
Food Production 6,376 -982 6,376 -982
Pollination 165,865 -160,026 218,643 -208,234
Raw materials 19,513 -19,503 132,655 -132,645
Recreation 7,191 2,055 408,782 -398,095
Soil formation 5,968 -4,939 19,887 -18,858
Waste Treatment 11,977 -10,179 237,364 43,876
Water Supply 37,704 -37,681 1,028,422 -1,027,528
Water flows 184,624 -182,824 642,740 -634,198
Total $5,081,755 -$4,869,443 $18,347,488 -$17,793,748
It bears repeating that the benefit transfer method applied here is useful for producing first-
approximation estimates of ecosystem service impacts. For several reasons, we believe that this
approximation of the effect of the ACP’s construction and operation on ecosystem service values is too
low rather than too high. These reasons include:
The estimates include only the loss of value that would otherwise emanate from the ROW and
construction corridors themselves. Additional losses would occur due to the conversion of forest
and other areas to barren or urban land (both of which have relatively low ecosystem service
productivity) that would serve as access roads and other pipeline-related infrastructure.
19 Note that due to differences in the range of dollars-per-acre estimates available for the various combinations of land use and ecosystem service, there are some instances where an apparent gain at the low end turns into a loss at the high end. For example, and based on the estimates available from the literature, the minimum value for erosion control from shrub/scrub acres is higher than the minimum for forests. Because we assume that forests return to shrub/scrub after the pipeline is in operation, this translates into a net increase in erosion regulation. At the high end, however, available estimates show a higher erosion control value for forests than for shrub/scrub. Thus the high estimate shows a net loss of erosion control benefits. It is important, therefore, to keep in mind that these estimates are sensitive to the availability of underlying per-acre estimates.

Property Value, Ecosystem Service, and Economic Development Effects in Central and Western Virginia
27
The compressor station proposed for a site in Buckingham County is among that pipeline-related
infrastructure. Its construction would convert land from more- to less-productive uses. In addition,
its operation would mean ongoing noise and air emissions that could adversely affect nearby
residents and tax the capacity of surrounding natural areas to absorb and process waste in the form
of those emissions. (See box beginning on the next page.)
The estimates do not account for the extent to which the construction and long-term presence of
the ACP could damage the ecosystem service productivity of adjacent land. During construction, the
construction corridor itself could be a source of air and water pollution that may compromise the
ability of surrounding or downstream areas to deliver ecosystem service value of their own. For
example, if sediment from the construction zone in Nelson County were to reach the Rockfish River
or its tributaries, those surface waters will lose some of their ability to provide clean water, food
(fish), recreation, and other services. This reduced productivity may persist well after construction
is complete. 20
Over the long term, the right-of-way would serve as a pathway by which invasive species or wildfire
could more quickly penetrate areas of interior forest habitat, thereby reducing the natural
productivity of those areas.
Finally, these estimates reflect only those changes in natural benefits that occur due to changes in conditions on the surface of the land. Particularly because the proposed pipeline would traverse areas of karst topography there is well-founded concern that subsurface hydrology could be affected during construction and throughout the lifetime of the pipeline (Jones, 2015; Pyles, 2015). Blasting and other activities during construction could alter existing underground waterways and disrupt water supply. There is also a risk that sediment and other contaminants could reach groundwater supplies if sinkholes form near the pipeline during construction or afterwards. For example, in Nelson County, where steep slopes with shallow soils over bedrock is common (Nelson County Planning Commission, 2002), there is concern that erosion and landslides during and after pipeline construction will harm water quality. These scenarios would entail further loss of ecosystem service value and, for the homeowners or municipalities affected, major expenditures. Officials in Augusta County estimate it would cost at least $2.1 million to establish a new municipal well, for example (Hoover, 2015).
20 This is not a small risk. As noted by the Dominion Pipeline Monitoring Coalition “pipeline construction over steep Appalachian mountains creates significant runoff and slope-failure problems” (Webb, 2015b). In one example, multiple problems during and after construction of a relatively small pipeline on Peters Mountain in Giles County caused extensive erosion and damage to waterways (Webb, 2015a). The coalition points out that “the potential for water resource problems will be greatly multiplied for the proposed larger projects [like the ACP], both in terms of severity and geographic extent.”

Economics of the Atlantic Coast Pipeline
28
Buckingham County Compressor Station
One way the ACP impacts air quality is by converting forests, which remove normal levels of impurities from the air, to other land uses. There is also concern for impacts that would occur due to the dumping of excess impurities into the air in the first place. While there is some chance of leaks occurring at any place along the proposed route, leaks and major releases of gas and other substances (lubricants, etc.) at the 40,645 horsepower (hp) compressor station proposed for the Union Hill section of Buckingham County would certainly occur.
The negative effects of the compressor station would include noise and air pollution from everyday operations plus periodic “blowdowns,” or venting of gas in the system to reduce pressure. As a recent study by the New York Department of Environmental Conservation indicates, pollution around compressor stations is common and severe. The five-state study found that “more than 40% of the air samples from compressor stations exceeded federal regulations for certain chemicals like methane, benzene, and hydrogen sulfide” (Lucas, “Officials To NYS: Take A Second Look At Pipelines.”). The study also found high rates of illnesses such as nosebleeds and respiratory difficulties among people living near the stations.
While more definitive epidemiological studies are needed to determine the extent to which natural gas compressor stations add to background rates of various illnesses, these stations are implicated as contributing to a long list of maladies. According to Subra (2015), individuals living within 2 miles of compressor stations and metering stations experience respiratory impacts (71% of residents), sinus problems (58%), throat irritation (55%), eye irritation (52%), nasal irritation (48%), breathing difficulties (42%), vision impairment (42%), sleep disturbances (39%), and severe headaches (39%). In addition, some 90% of individuals living within 2 miles of these facilities also reported experiencing odor events (Southwest Pennsylvania Environmental Health Project 2015). Odors associated with compressor stations include sulfur smell, odorized natural gas, ozone, and burnt butter. (Subra, 2009). Finally, compressors emit constant low-frequency noise, which can cause negative physical and mental health effects (Luckett, Buppert, & Margolis, 2015).
In Buckingham, 471 people live within 2 miles of the proposed compressor station (US Census Bureau, 2015). This would mean 424 people experiencing odor events, 334 people experiencing respiratory impacts, 273 people experiencing sinus problems, and 184 people experiencing sleep disturbances and/or severe headaches.
In addition to the health impacts discussed above, this pollution can cause damage to agriculture and infrastructure. One study found that shale gas air pollution damages in Pennsylvania already amount to between $7.2 and $30 million, with compressor stations responsible for 60-75% of this total (Walker & Koplinka-Loehr, 2014). Using the low estimate of 60% that is between $4.32 and $18 million in damages associated with compressor stations.
Yogaville, an ashram, teaching, and retreat center located approximately 5 miles from the proposed compressor station, is especially concerned about these impacts on its 10,000 annual visitors and on the peace, tranquility, and air quality available at its iconic Mount Kailash and Lotus Shrine. Officials there worry that the air and noise pollution may entirely destroy the Shrine’s ability to serve as a place of silent prayer, meditation, and healing (Yogaville, 2015).
The selection of Union Hill for the compressor station also raises environmental justice questions that FERC and others must consider as part of their review (Luckett, Buppert, & Margolis, 2015; Executive Order 12898).

Property Value, Ecosystem Service, and Economic Development Effects in Central and Western Virginia
29
Buckingham County Compressor Station, Continued.
In addition to the direct effects on nearby residents’ health and quality-of-life, compressor stations have caused some homes to lose value and some homeowners to move away rather than endure the noise, smells, and illnesses they have experienced. In one case from Minisink, New York, a family of six moved to escape the effects of a 12,600 hp compressor station operated by Millennium Pipeline LLC. After two years of headaches, eye irritation, and lethargy among the children and even lost vigor in their fruit trees, the couple, unable to find a buyer for their home, moved away, leaving their $250,000 investment in the property on the table with their bank holding the balance of the mortgage (Cohen 2015).
In Hancock, another New York town with a slightly larger (15,000 hp) compressor station, three homeowners have had their property assessments reduced, two by 25% and one by 50%, due to the impact of truck traffic, noise, odors, and poor air quality associated with the compressor station (“Proximity of Compressor Station Devalues Homes by as Much as 50%” 2015). The larger of these reductions was for a home very close to the station and reflected physical damage that led to an increase in radon concentrations above safe levels. The two properties devalued by 25% were approximately one half mile away (Ferguson, Bruce, Personal Communication, 12/31/2015).
As of this writing, there have not been statistical studies of the relationship between a property’s value and its proximity to a compressor station. The mounting anecdotal information does suggest that there is a negative relationship, however, and that depending on the particular circumstances, the effect can be large–up to the 100% loss sustained by the family in Minisink (less whatever the bank can recover at auction). With the caveat that the effect on property value of the compressor station in Buckingham County may be different in scope and intensity, we do include such effects among the total estimated cost of the pipeline in the study region.
For our estimates, we follow the example of the Hancock New York case and assume that properties within one half mile of the Buckingham compressor station would lose 25% of their value if the station is built. We believe this assumption provides a conservative estimate in part because the Buckingham compressor station would be nearly three times the size. It is therefore likely that its noise, odor events, and other physical effects would be experienced at a greater distance and/or with greater intensity than in the New York case. The resulting loss of value would affect Buckingham landowners over a wider area and, possibly, the percentage reduction would be greater at any given distance.
Beyond health and safety concerns, compressor stations might also affect property values due to a “stigma of industrialization” similar to that found for high-voltage lines, according to real estate expert Kurt Kielisch of the Forensic Appraisal Group (Personal Communication 1/6/2016). It is reasonable to assume that such an effect would occur if a portion of Buckingham County’s landscape of working forests, farms, and small villages were turned into a compressor station.

Economics of the Atlantic Coast Pipeline
30
EFFECTS ON PROPERTY VALUE
Land Price Effects
To say that the impacts and potential impacts of the ACP on private property value is important to
people along its proposed route would be an extreme understatement. Some 521 comment letters
submitted by study region residents to FERC during the scoping period mentioned property value
(Docket (PF15-6)). Of these, 517, or 99.2%, expressed a belief that the pipeline would have a negative
effect on that value. Those reductions are not merely hypothetical. Landowners and Realtors along the
proposed route of the Atlantic Coast Pipeline report that buyers have backed out of contracts and that
other buyers are simply less interested in potentially
affected properties (Davenport, 2015; Hotz, 2015; R.
Smith, 2015a).21 In the words of one Realtor, “every single
one of my buyer clients who are looking to buy property
in Augusta County have told me that they do not want to
even look at properties that are located ON or NEAR the
proposed locations of the ACP” (Adler, 2015). While it is
impossible to know how large an effect the specter of the
ACP, including the compressor station in Buckingham
County, has already had on land prices, there is strong
evidence from other regions that the effect would be
negative.
In a systematic review, Kielisch (2015) presents evidence from surveys of Realtors, home buyers, and
appraisers demonstrating that natural gas pipelines negatively affect property values for a number of
reasons. Among his key findings relevant to the ACP:
68% of Realtors believe the presence of a pipeline would decrease residential property value.
Of these Realtors, 56% believe the decrease in value would be between 5% and 10%. (Kielisch does
not report the magnitude of the price decrease expected by the other 44%.)
70% of Realtors believe a pipeline would cause an increase in the time it takes to sell a home. This
is not merely an inconvenience, but a true economic and financial cost to the seller.
More than three quarters of the Realtors view pipelines as a safety risk.
In a survey of buyers presented with the prospect of buying an otherwise desirable home with a 36-
inch diameter gas transmission line on the property, 62.2% stated that they would no longer buy
the property at any price. Of the remainder, half (18.9%) stated that they would still buy the
property, but only at a price 21%, on average, below what would otherwise be the market price.
The other 18.9% said the pipeline would have no effect on the price they would offer.
21 FERC’s docket for the pre-filing phase of the Atlantic Coast Pipeline (PF15-6) is rife with testimony from landowners concerned that their property will be or already has been negatively affected by the mere possibility of the pipeline’s construction.
“Buyers are concerned about safety, views, and resale values. The permanent easement that it will create will devalue every property in its path.”
– Daniel Hotz, Realtor McDowell, Virginia

Property Value, Ecosystem Service, and Economic Development Effects in Central and Western Virginia
31
Not incidentally, the survey participants were informed that
the risks of “accidental explosions, terrorist threats,
tampering, and the inability to detect leaks” were
“extremely rare” (2015, p. 7).
If one considers just those buyers who are still willing to
purchase the property, the expected loss in market value
would be 10.5%.22 This loss in value provides the mid-level
impact in our estimates. A much greater loss (and higher
estimates) would occur if one takes into account the fact
that 62% of buyers are effectively reducing their offer prices
by 100%, making the average reduction in offer price for all
potential buyers 66.2%.23 In our estimates, however, we
have used the smaller effect (-10.5%) based on the
assumption that sellers will eventually find one of the buyers
still willing to buy the pipeline-easement-encumbered
property.
Based on five “impact studies” in which appraisals of smaller
properties with and without pipelines were compared, “the
average impact [on value] due to the presence of a gas
transmission pipeline is -11.6%” (Kielisch, 2015, p. 11). The
average rises to a range of -12% to -14% if larger parcels are
considered, possibly due to the loss of subdivision capability.
These findings are consistent with economic theory about the
behavior of generally risk-averse people. While would-be
landowners who are informed about pipeline risks and
nevertheless decide to buy property near the proposed ACP
corridor could be said to be “coming to the nuisance,” one
would expect them to offer less for such a property than they
would offer for a property with no known risks.
Kielisch’s findings demonstrate that properties on natural gas
pipeline rights of way suffer a loss in property value. Boxall,
Chan, and McMillan (2005), meanwhile, show that pipelines
also decrease the value of properties lying at greater distances.
In their study of property values near oil and gas wells,
pipelines, and other infrastructure, the authors found that
22 Half of the buyers would offer 21% less, and the other half would offer 0% less; therefore the expected loss is 0.5(-21%) + 0.5(0%) = -10.5%. 23 This is the expected value calculated as 0.622*(-100%)+0.189*(-21%)+0.189*(0%).
Diminished Property Value, Lost Revenue, Higher Costs: Mt. Rush Farm
Mt. Rush Farm located in Buckingham County is a 1,000-acre family farm that has been operated by the Leech family for over 100 years. About half the farm is in managed forests, with the remainder in Angus cattle and crop production. It is one of the largest remaining active farms in the county. The farm typically employs 3 full-time workers, and 4 families live on the property.
The pipeline will bisect the property mainly through the un-wooded portion, which is in daily use. The pipeline will be directly in the way of bringing the cattle in from pasture, a monthly activity. To simply feed their cattle the Leech family would need to cross the pipeline twice daily with heavy equipment. With restrictions on where they could cross the pipeline, these trips would be more time consuming and costly, creating a serious burden on the farm.
“We do not make a lot of money; margins are tight. The pipeline could make it so that we cannot continue farming.” If farming is no longer viable, the family worries that the pipeline will also hurt its value for other uses such as housing.
-Irene Ellis Leech, Owner of Mt Rush Farm

Economics of the Atlantic Coast Pipeline
32
properties within the “emergency plan response zone” of sour gas24 wells and natural gas pipelines
faced an average loss in value of 3.8%, other things being equal.
The risks posed by the ACP would be different – it would not be carrying sour gas, for example—but
there are similarities between the ACP scenario and the situation in the study that makes their finding
particularly relevant. Namely, the emergency plan response zones (EPZs) are defined by the health and
safety risks posed by the gas operations and infrastructure. Also, in contrast to ACP-cited studies
showing no price effects (see below), the Boxall study examines prices of properties for which
landowners must inform prospective buyers when one or more EPZs intersect the property.
The ACP has both a high consequence area (HCA) and an evacuation zone radiating from both sides of
the pipeline that are defined by health and safety risks. Whether disclosed or not by sellers,
prospective buyers are likely to become informed regarding location of the property relative to the
ACP’s HCA and evacuation zones or, at a minimum, regarding the presence of the ACP in the study
region.
As described in the box above, the compressor station proposed for the Union Hill section of
Buckingham County would likely cause its own more severe reduction in the value of nearby properties.
We apply the percentage reduction awarded in the Hancock, New York case (25%) to properties that
are (as the properties were in that case) within one half mile of the proposed compressor station.
While there remains a paucity of statistical analysis on the effects of high-pressure natural gas
transmission lines on property value, there have been many analyses demonstrating the opposite
analog–namely, that amenities such as scenic vistas, access to recreational resources, proximity to
protected areas, cleaner water, and others convey positive value to real property.25 There are also
studies demonstrating a negative impact on land value of various other types of nuisance that impose
noise, light, air, and water pollution, life safety risks, and lesser human health risks on nearby residents
(Bixuan Sun, 2013; Bolton & Sick, 1999; Boxall et al., 2005). The bottom line is that people derive
greater value from, and are willing to pay more for, properties that are closer to positive amenities and
farther from negative influences, including health and safety risks.
Claims that Pipelines have no effect on property value may be invalid.
Both FERC and ACP LLC have cited several studies purporting to show that natural gas pipelines (and in
one case a liquid petroleum pipeline) have at most an ambiguous and non-permanent effect on
property values. In its Final EIS regarding the Constitution Pipeline, for example, FERC cited two articles
concluding, in brief, that effects on property value from the presence of a pipeline can be either
positive or negative 3values due to a pipeline explosion diminishes over time (Hansen, Benson, &
Hagen, 2006). In its filing, ACP LLC cites additional studies drawing similar conclusions based on
comparison of market and/or assessed prices paid for properties “on” or “near” a pipeline versus those
farther away (Allen, Williford & Seale Inc., 2001; Fruits, 2008; Natural Resource Group, 2015b; Palmer,
2008).
24 “Sour” gas contains high concentrations of hydrogen sulfide and poses an acute risk to human health. 25 Phillips (2004) is one such study that includes an extensive review of the literature on the topic.

Property Value, Ecosystem Service, and Economic Development Effects in Central and Western Virginia
33
While the studies differ in methods, they are similar in that each fails to take into account two factors
that may void their conclusions entirely. The first is that the studies do not consider that the property
value data used do not represent prices arising from transactions in which all buyers have full
information about the subject properties. The second is that, for the most part, the definition of
nearness to the pipelines may be inappropriate or inadequate for discerning actual effects on property
value of that nearness.
Economic theory holds that for an observed market price to be considered an accurate gauge of the
value of a good, all parties to the transaction must have full information about the good. If, on the
other hand, buyers lack important information about a good, in this case whether a property is near a
potential hazard, they cannot bring their health and safety concerns—their risk aversion—to bear on
their decision about how much to offer for the property. As a result, buyers’ offer prices will be higher
than they would be if they had full information.
As Albright (2011) notes in response to the article by Disken, Friedman, Peppas, & Peppas (2011):
The use of the paired-sales analysis makes the assumption of a knowing purchaser, but I believe this
analysis is not meaningful unless it can be determined that the purchaser had true, accurate and
appropriate information concerning the nature and impact of the gas pipeline on, near or across
their property. … I believe that the authors’ failure to confirm that the purchasers in any of the
paired sales transactions had full and complete knowledge of the details concerning the gas
transmission line totally undercut the authors’ work product and the conclusions set forth in the
article. (p.5)
Of the remaining studies, only Palmer (2008) gives any indication that any buyers were aware of the
presence of a pipeline on or near the subject properties. For Palmer’s conclusion that the pipeline has
no effect on property value to be valid, however, it must be true that all buyers have full information,
and this was not the case.
The study by Hansen, Benson, and Hagen (2006) actually reinforces the conclusion that when buyers
know about a nearby pipeline, market prices drop. The authors found that property values fell after a
deadly 1999 liquid petroleum pipeline explosion in Bellingham, Washington. They also found that the
negative effect on prices diminished over time. This makes perfect sense if, as is likely, information
about the explosion dissipated once the explosion and its aftermath left the evening news and the
physical damage from the explosion had been repaired.
We do not think it is appropriate to conclude from this study (as FERC did in the case of the
Constitution Pipeline) that natural gas transmission pipelines would have no effect on land prices in
today’s market. In contrast to Bellingham homebuyers in the months and years after the 1999
explosion, today’s homebuyers can query Zillow to see the history of land prices near the pipeline and
explore online maps to see what locally undesirable land uses exist near homes they might consider
buying. They also have YouTube and repeated opportunities to find and view news stories, citizens’
videos, news reports, and other media describing and depicting such explosions and their aftermath.
Whether the pre-explosion prices reflected the presence of the pipeline or not, it is hard to imagine

Economics of the Atlantic Coast Pipeline
34
that a more recent event and the evident dangers of living near a fossil fuel pipeline would be forgotten
so quickly by today’s would-be home buyers.
Online based tools have changed the ways people shop for homes, and we are now in a real world
much closer to the competitive economic model that assumes all buyers have full information about
the homes they might purchase. Anyone with an eye toward buying property near the proposed ACP
corridor would quickly learn that the property is in fact near the corridor, that there is a danger that the
property could be adversely affected by still-pending project approval, and that fossil fuel pipelines and
related infrastructure have an alarming history of negative health and environmental effects.
Accordingly, the price that buyers would offer for a home near the ACP will be lower than the price
offered for one farther away or in another community or region entirely.
The second problem with the studies is that while they purport to compare the price of properties near
a pipeline to properties not near a pipeline, many or in some cases all of the properties counted as “not
near” the pipelines are, in fact, near enough to the subject pipelines that health and safety concerns
could influence prices. In the study for the Interstate Natural Gas Association of America (INGAA), for
example, the authors compare prices for properties directly on pipeline rights-of-way to prices of
properties off the right-of-way. But in almost all cases the geographic scope of the analysis was small
enough that most or all of the properties not on the right-of-way are still within the pipelines’
respective evacuation zones (Allen, Williford & Seale Inc., 2001).26
If one wants to compare the price of properties with and without a particular feature, one must be sure
that some properties have the feature and others do not. It is a case where one actually does need to
compare apples to oranges. But if there is no variation in the feature of interest, which in this case
would be the presence of a nearby risk to health and safety, then one would expect to find no
systematic variation in the price of the properties. By comparing apples to apples when it should be
comparing apples to oranges, the INGAA study reaches the forgone and not very interesting conclusion
that properties that are similar in size, condition, and other features including their location within the
evacuation zone of a natural gas pipeline have similar prices.
To varying degrees, the other studies cited by FERC and in ACP LLC’s filing suffer from the same
problem. Fruits (2008), who analyzes properties within one mile of a pipeline that has a 0.8-mile-wide-
evacuation zone (0.4 miles on either side), offers the best chance that a sizable portion of subject
properties are in fact “not near” the pipeline from a health and safety standpoint. He finds that
distance from the pipeline does not exert a statistically significant influence on the property values, but
he does not examine the question of whether properties within the evacuation zone differ in price from
comparable properties outside that zone. A slightly different version of Fruits’ model, in other words,
could possibly detect such a threshold effect. Such an effect would show up, of course, only if the
buyers of the properties included in the study had been aware of their new property’s proximity to the
pipeline.
26 This is based on a best estimate of the location of the pipelines derived from descriptions of the pipeline’s location provided in the study (only sometimes shown on the neighborhood maps) and an approximation of the evacuation zone based on pipeline diameter and operating pressure (Pipeline Association for Public Awareness, 2007).

Property Value, Ecosystem Service, and Economic Development Effects in Central and Western Virginia
35
In short, one cannot conclude from these flawed studies’ failure to identify a negative effect of
pipelines on property value that no such effect exists. To evaluate the effects of the proposed ACP on
property value, FERC and others must therefore look to studies (including those summarized in the
previous section) in which buyers’ willingness to pay is fully informed about the presence of nearby
pipelines and in which the properties bought are truly different in terms of their exposure to pipeline-
related risks.
Visual Effects and Viewshed Analysis
Information about how the visual effects of natural gas transmission pipelines are reflected in property
value is scarcer than information related to health and safety effects. On one hand, we know better
views increase property value. Conversely, utility corridors from which power lines can be seen
decrease property values (by 6.3% in one study) (Bolton & Sick, 1999). This suggests a pipeline corridor
reduces property value either by impairing a good view or, if like power lines, by simply being
unattractive. It is reasonable to conclude that the proposed ACP would have effects on property value
that are mediated through visual effects, but the literature to date does not offer clear guidance on
how large or strong the effect may be. We therefore have not included separate estimates of the
impact of the ACP on property value in the viewshed. Moreover, we do not wish to double-count a
portion of the impact of the ACP on “Aesthetics,” which is already included among the ecosystem
service value effects.
We do want to know, however, how many properties might suffer a portion of that lost aesthetic value.
To keep the estimate conservative, we count only those properties with a higher-than-average
likelihood the ACP corridor could be seen from them. To determine this for each parcel, a GIS-based
visibility analysis provides an estimate of how many points along the pipeline could potentially be seen
from each 30m-by-30m spot in the study region. To keep the computing needs manageable, we
analyzed a sample of points placed at 100m intervals along the proposed ACP route.
Because weather, smog, and other conditions limit the distance at which one can see anything in the
mountains and valleys of Virginia, we restricted the scope of analysis for any given point on the pipeline
to spots in the study region that lie within a 25-mile radius. As a practical matter, this meant that we
analyzed a section of the ACP beginning 25 miles west of the western boundary of Highland County,
Virginia and extending to a point 25 miles east of the eastern boundary of Buckingham County.
By tallying the number of points on the pipeline corridor that could be seen from each spot in the study
region and then connecting those spots to parcel boundaries, we obtain an estimate of how much of
the pipeline could be seen from some spot within a given parcel. In Figure 6, yellow spots on the maps
are those where one could see between 1 and 14 points on the pipeline, whereas red spots have a view
of up to as many as 392 points along the pipeline. Since each point represents 100 meters of pipeline,
there are places in the study region where 39.2 km, or 24.4 miles, of pipeline corridor could be visible.
Taking into account those spots on nearly every parcel from which one could not see the ACP corridor,
the average of the maximum number of points visible from a parcel is 12. This serves as our threshold
for identifying parcels from which the pipeline would be “visible.” Parcels containing no spot (again

Economics of the Atlantic Coast Pipeline
36
each spot is a 30m-by-30m square) from which one could see more than 12 pipeline points is
considered to have no view of the pipeline. By this rule, and out of 106,717 parcels in the study region,
some 31,117 parcels, or just under one-third, would have a potential view of the pipeline. The total
value of these properties is currently $7.44 billion.
We call this a potential view of the pipeline because we have not taken other visual obstructions, such
as trees or buildings into account. In particular, smaller parcels in the more densely developed areas
could be at elevations relative to the pipeline that could afford a view of it, but the house next door
could block that view. The restriction of our analysis to those parcels that have comparatively many
spots from which to potentially see the pipeline mitigates this limitation of our GIS analysis. The reason
is simply that smaller urban lots have very few 30-meter-square spots to begin with. A parcel has to be
at least 13 spots in size (2.9 acres), with the pipeline visible from every spot, to cross the 12-spot
threshold.
FIGURE 6: Visibility Analysis Results
*The color indicates the number of waypoints, spaced 100m apart along the proposed route that would be visible
from the colored grid cell. Only waypoints within 25 miles are considered. Does not account for obstructions like
buildings or trees.

Property Value, Ecosystem Service, and Economic Development Effects in Central and Western Virginia
37
Parcel Values
With the exceptions of the City of Staunton and Highland County, parcel value is obtained from the
jurisdictions’ public records. We obtained Staunton’s parcel boundaries (the GIS file) from the city, but
it is not possible to download or create a file with the assessed value that corresponds to each parcel.
For Highland County, we obtained the parcel boundaries from the Commonwealth of Virginia’s web-
based map service, but those parcels lack any identifying information, such as an address or key code
by which parcels could be connected to property value obtained separately from the County.
For both Staunton and Highland County, we adopted a second-best approach to enable some spatial
analysis of property value impacts. We extracted the median house value for block groups in those two
jurisdictions from the American Community Survey (ACS) (2014). After adjusting the ACS’s figures for
inflation, we attached those values to each parcel, according to which block group the parcel
occupies.27
Each of the remaining jurisdictions have some parcels with missing value data or parcels where a match
in the jurisdictions’ separate assessment records could not be found. This will lead to some
underestimation of any land value effects, since the value of these parcels is set to zero.
Two other features of the parcel data required adjustments prior to performing any land value impact
calculations. First, the Buckingham County data had instances in which two or more individual tracts in
different parts of the County are listed on a single tax record with a single property value. The
consequence is that the value of all of the land connected to such multi-tract tax records would be
swept up with the value of just those tracts actually crossed by the proposed ROW, in the evacuation
zone, or near the compressor station. To avoid overstating impacts, we split the multi-tract parcels into
separate tax records and assigned each tract its own value based on its size and the per-acre value of
the original multi-tract parcel.
The second remaining issue deals with public land that is unlikely to be sold and therefore does not
possess any market value. To ensure these properties would not inflate overall property value effects,
we used the “Protected Areas Database” from the National Gap Analysis Program to identify fee-owned
conservation properties, such as portions of the George Washington National Forest and state, county,
and municipal parks (Conservation Biology Institute, 2012). Once identified, we set the value of all such
properties equal to zero.
With all of these adjustments made, there remains the comparatively straightforward matter of
identifying parcels of six types for which one could expect some effect of the ACP on the value. In order
of increasing distance from the pipeline itself, these are:
1. Parcels crossed by the right-of-way
(521 parcels, with total value (before ACP) of $277.5 million)
2. Parcels crossed by the construction corridor
(553 parcels, with total value (before ACP) of $281.8 million)
27 Because many parcels overlap block group boundaries, each parcel is assigned to a block according to whether its centroid, or geometric center, lies within the block group.

Economics of the Atlantic Coast Pipeline
38
3. Parcels at least partially within the High Consequence Area (HCA)
(1,799 parcels, with total value (before ACP) of $539.7 million)
4. Parcels at least partially within the Evacuation Zone
(6,148 parcels, with total value (before ACP) of $1.41 billion)
5. Parcels with their geographic center (centroid) within one half mile of the compressor station
(87 parcels, with total value (before ACP) of $4.9 million)
6. Parcels from which the pipeline would be visible (as defined above)
(31,117 parcels, with total value (before ACP) of $7.44 billion)
Note that there is overlap among these zones. All ROW parcels are within the construction, HCA, and
evacuation zones, and 13 are near the compressor station, for example. To avoid double counting we
apply only one land value effect to any given parcel. We assume that the health and safety concerns
associated with the compressor station dominate the effects of the ROW and of the evacuation zone,
and so we exclude the compressor zone parcels from estimates of the impact of those zones and
estimate a separate effect of the compressor station. Similarly, ROW parcels are assumed to suffer no
further reduction in value due to their location within the evacuation zone.
We ignore the construction corridor for this analysis. Even though the additional 32 parcels and $4.3
million in value (relative to parcels in the ROW) are not trivial, we do not have a basis for estimating a
change in value that is separate from or in addition to the change due to the parcels’ proximity to the
ROW or their location within the evacuation zone.
Furthermore, we treat parcels in the HCA and in the evacuation zone the same way and apply a single
land value change to all parcels in the evacuation zone. Arguably, there should be a larger effect on
parcels in the HCA than those only in the evacuation zone. Living with the possibility that one would
need to evacuate one’s home at any time day or night would, one would expect, have a smaller effect
on property value than living with the possibility that one would not survive a “high consequence”
event and, therefore, not have the chance to evacuate at all. We do not have data or previous study
results that allow us to draw such a distinction, so instead we apply the lower evacuation zone effect to
all HCA and evacuation zone parcels.
To summarize, Table 9 repeats a portion of Table 2, but with the property value effects discussed above
in place of check marks.

Property Value, Ecosystem Service, and Economic Development Effects in Central and Western Virginia
39
TABLE 9: Summary of Marginal Property Value Effects
Values /
Effects
Right-of-Way
(Low, Medium,
& High effects)
High
Consequence
Area
Evacuation
Zone
Compressor
Station Zone
Pipeline
Viewshed
Land /
Property
Value
-4.2%a
-10.5%b
-13.0%c
-3.8%d -25%e
Impact included
with Ecosystem
Services
Notes:
a. Kielisch, Realtor survey in which 56% of respondents expected an effect of between -5% and -10% (0.56*-7.5% = -
4.2%).
b. Kielisch, buyer survey in which half of buyers still in the market would reduce their offer on a property with a pipeline
by 21% (0.50*-0.21 = -10.5%).
c. Kielisch, appraisal/impact studies showing an average loss of between -12% and -14% (-13% is the midpoint)
d. Boxall, study in which overlap with an emergency planning zone drives, on average, a 3.8% reduction in price. We apply
this reduction ONLY to those parcels in the evacuation zone that are not also in the ROW or within one half mile of the
compressor station.
e. Based on examples from the town of Hancock, New York.
Estimated Land Value Effects
Following the procedures outlined in the previous section, our conservative estimate for costs of the
proposed ACP would include between $55.8 million and $80.2 million in diminished property value.
Some of the most intense effects will be felt by the owners of 508 parcels in the path of the right-of-
way, who collectively would lose between $11.7 million and $36.1 million in property value. There are
87 parcels in the compressor station zone, and their owners would together experience a drop of $1.2
million in property value. Some 5,553 additional parcels lie outside the ROW and compressor station
zones but are within or touching the evacuation zone. These parcels’ owners would lose an estimated
$43.0 million. (See Table 10). A far greater number of parcels, 31,117, would experience a loss in value
due to diminished quality of the view from their properties.
TABLE 10: Summary of Land Value Effects, by Zone and County
Effects in Right-of-Way Effects in
Evacuation Zone
County Realtor Survey
(4.2%) Buyer Survey
(10.5%)a Impact Studies
(13.0%) Boxall Study
(3.8%)
Augusta -5,201,628 -13,004,069 -16,100,276 -28,380,818
Buckingham -993,700 -2,484,249 -3,075,737 -2,884,845
Highland -360,981 -902,453 -1,117,323 -2,094,518
Nelson -5,082,259 -12,705,646 -15,730,800 -9,596,010
Study Region Total -$11,654,492 -$29,136,230 -$36,073,427 -$42,956,191

Economics of the Atlantic Coast Pipeline
40
TABLE 10: Continued
Effects Near Compressor Total of ROW and Evacuation Zone Effects
Hancock, NY Finding (25%) Low Medium High
Augusta n/a -33,582,445 -41,384,887 -44,481,094
Buckingham -1,214,140 -5,092,685 -6,583,234 -7,174,722
Highland n/a -2,455,500 -2,996,972 -3,211,841
Nelson n/a -14,678,268 -22,301,656 -25,326,810
Study Region Total -$1,214,140 -$55,808,898 -$73,266,748 -$80,194,467
Based on median property tax rates in each county, these one-time reductions in property value would
result in reductions in property tax revenue of between $281,000 and $408,000 per year (see Table 11).
To keep their budgets balanced in the face of this decline in revenue, the counties would need to
increase tax rates, cut back on services, or both. The loss in revenue would be compounded by the
likelihood that the need for local public services, such as road maintenance, water quality monitoring,
law enforcement, and emergency preparedness/emergency response could increase. The ACP, in other
words, could drive up expenses while driving down the counties’ most reliable revenue stream.28
TABLE 11: Effects on Local Property Tax Revenue
Median Tax Rate
(% of Value)a
Lost Property Tax Revnue
Low Medium High
Augusta County 0.47% -157,837 -194,509 -209,061
Buckingham 0.56% -28,519 -36,866 -40,178
Highland 0.46% -11,295 -13,786 -14,774
Nelson 0.57% -83,666 -127,119 -144,363
Study Region Total -$281,318 -$372,281 -$408,377 a. Source: Property Taxes By State (Virginia Counties and Independent Cities) (propertytax101.org, 2015)
In addition to factors that make our estimates of the effects on property value itself conservative,29
there is one other factor that makes the estimates of effects on property taxes lower than what one
would expect if the ACP is permitted. Namely, nearly a quarter of the properties in the ROW are
currently undeveloped but still assessed at a value that assumes a single house site. Buckingham
County has 70 such properties, Nelson has 7, and Augusta has 46.30 The total assessed value of these
28 We recognize that ACP anticipates making tax payments, but because those payments are tied to net income from the operation of the pipeline, they may fluctuate from year to year or disappear entirely if pipeline operations become unprofitable. 29 These factors include using the lower expected price reduction from the buyer survey and applying the same price reduction to the entire evacuation zone (including the HCA). 30 There are no such properties in Highland County, where the County does not assume any development value until development is imminent. In Buckingham County all unimproved properties are assessed as if they include at least one

Property Value, Ecosystem Service, and Economic Development Effects in Central and Western Virginia
41
properties is $15.1 million. Depending on where and how the
ROW crosses these properties, it is likely that some will lose
their potential usefulness for future residential or other
development. In those cases, the assessed value (which by law
reflects market value) will fall, and tax revenue generated by
future development will never materialize.
EFFECTS ON ECONOMIC DEVELOPMENT Across the study region, county-level economic development
plans recognize the importance of a high quality of life, a clean
environment, and scenic and recreational amenities to the
economic future of people and communities. Augusta County’s
Economic Development Strategic Plan, for example, stresses
“Respect for Heritage and Environment: Promote a quality of
life that embraces our heritage, preserves the environment and
effectively manages the resources we have been given” (Glover
& Castle, 2015). In Highland County, the Economic
Development Authority states its mission is to “promote
sustainable economic development in order to achieve a
desirable quality of life for the citizens of Highland County,”
and it aims to complete that by “preserving our rural heritage
and natural beauty, supporting existing businesses, promoting
new investment and igniting entrepreneurship” (Billingsley et
al., 2015).
The ACP would undermine the progress toward these visions if
the loss of scenic and recreational amenities, the perception
and the reality of physical danger, and environmental and
property damage were to discourage people from visiting,
relocating to, or staying in the study region. Workers,
businesses, and retirees who might otherwise choose to locate
along the ACP’s proposed route will instead pick locations
retaining their rural character, productive and healthy
landscapes, and promise for a higher quality of life.
This is already occurring in the region. With the possibility of
the ACP looming, business plans have stalled and the real
estate market has slowed (Adler, 2015; R. Smith, 2015a,
2015b). Study region residents are also concerned the ACP
could have broad, negative impacts on the economy. Of those
house site. Nelson County assumes that all unimproved properties of 10 acres or smaller include a single house site. Augusta County applies the single house site assumption to unimproved properties of between 0.5 and 20 acres in size.
Forgone Economic Development: Eco-Village
In April of 2014 a father and son purchased two parcels near Bold Rock Cidery in Nelson County in order to begin developing a “stunning boutique eco-resort focused on the natural beauty of the Rockfish Valley and the delightful Virginia-Made craft beers, wines, ciders, foods, and handmade goods.”
Designed to be a top destination on the East Coast, the developers predict $35 million in investment costs to create this vision. They began developing a plan in April of last year and have already hired a world-class landscape design firm. The eco-resort would provide 50 full-time and 50 or more part-time jobs as well as $15-30 million in annual taxable revenue for Nelson County.
This project, which will be “a pure celebration of Virginia”, will be entirely derailed by the ACP, which would cut “right through the heart of this project and destroy any opportunity to develop this land in a meaningful way.” This project represents just one of many “small business owners investing in their own ideas and opportunities to serve the exploding tourism market and our local economy.”
- Richard Averitt Developer of Spruce Creek Resort
and Market

Economics of the Atlantic Coast Pipeline
42
who mentioned the economy in written comments to the Federal Energy Regulatory Commission
during the scoping phase of its environmental review, 91.4% expressed a belief that the ACP would
have a negative effect. Of those who mentioned agriculture, 98.6% thought the effect would be
negative, and 99.5% of those who addressed tourism said the effect would be negative.
These fears are consistent with research results from this region and around the country demonstrating
that quality of life is often of primary importance when people choose places to visit, live, or do
business. As Niemi and Whitelaw state, “as in the rest of the Nation, natural-resource amenities exert
an influence on the location, structure, and rate of economic growth in the southern Appalachians. This
influence occurs through the so-called people-first-then-jobs mechanism, in which households move to
(or stay in) an area because they want to live there, thereby triggering the development of businesses
seeking to take advantage of the households’ labor supply and consumptive demand” (1999, p. 54).
They note that decisions affecting the supply of amenities “have ripple effects throughout local and
regional economies” (p. 54).
Along similar lines, Johnson and Rasker (1995) found that quality of life is important to business owners
deciding where to locate a new facility or enterprise and whether to stay in a location already chosen.
This is not surprising. Business owners value safety, scenery, recreational opportunities, and quality of
life factors as much as residents, vacationers, and retirees.
It is difficult to predict just how large an effect the ACP would have on decisions about visiting the study
region, or locating, or staying there. Even so, based on information provided by business owners to
FERC and as part of this research, we can consider reasonable scenarios for how the ACP might affect
key portions of the region’s overall economy.
As noted above, the study region’s
residents believe the ACP will
harm the travel and tourism
industry. Wintergreen Resort,
located in Nelson and Augusta
Counties, expects a 40% drop in
business relative to a planned
expansion (Theiss, 2015). The
nearby Fenton Inn projects it “will
be losing at least 10% of projected
income for [the life of the pipeline]” and that insurance and other costs will further impact its bottom
line (Fenton & Fenton, 2015). In one widely reported case, a planned resort in Nelson County will never
be built if the ACP is constructed—effectively a 100% loss for a business that would supply 50 full-time
and 50 part-time jobs (Averitt, 2015). Finally, Yogaville in Buckingham County surveyed current and
former guests regarding how a pipeline near its campus could affect future demand for its programs
and found some 95% of those surveyed responded they would visit less often if the pipeline were
constructed.
Natural and Scenic Resources [Goals] – Recognize that the natural environment is an important facet of our quality of life and efforts should be made to support and enhance that environment. – Protect the county’s scenic resources as essential to the county’s rural character, economic strength and quality of life.
- Nelson County Comprehensive Plan
Property Value, Ecosystem Service, and Economic Development Effects in Central and Western Virginia
43
While more systematic research could provide refined estimates of the impact of natural gas
transmission pipelines on recreation and tourism spending, one plausible scenario is that the impact is
at least as high as the minimum of these business owners’ reported expectations. That is, if the ACP
were to cause a 10% drop in recreation and tourism spending from the 2014 baseline, the ACP could
mean $41.3 million less in travel expenditures each year. Those missing revenues would otherwise
support roughly $7.5 million in payroll, $1.3 million in local tax revenue, $1.8 million in state tax
revenue, and 387 jobs in the four-county region’s recreation and tourism industry each year.31 In the
short run, these changes multiply through the broader economy as recreation and tourism businesses
buy less from local suppliers and fewer employees spend their paychecks in the local economy. As with
the reduction in local property taxes, lost tax revenue from a reduction in visitation and visitor spending
would squeeze local governments trying to meet existing public service needs as well as those
additional demands presented by the ACP.
Along similar lines, retirement income is an important economic engine that could be adversely
affected by the ACP. In county-level statistics from the US Department of Commerce, retirement
income shows up in investment income and as age-related transfer payments, including Social Security
and Medicare payments. In the study region, investment income grew by 1.5% per year from 2000
through 2014, and age-related transfer payments grew by 5.4% per year. During roughly the same time
period (through 2013), the number of residents age 65 and older grew by 27.3% (2.1% per year), and
this age cohort now represents 17.6% of the total population.2
It is difficult to precisely quantify the effect of the ACP on retirement income, but given the strong
expression of concern from residents about changes in quality of life, safety, and other factors
influencing retirees’ location decisions, it is important to consider that some change is likely. Here, we
consider what just a 10% slowing of the rate of increase might entail. Such a scenario entails an annual
decrease in investment income and age-related transfer payments of approximately $6.6 million. That
loss would ripple through the economy as the missing income is not spent on groceries, health care,
and other services such as restaurant meals, home and auto repairs, etc.
The same phenomenon also applies to people starting new businesses or moving existing businesses to
communities in the study region. This may be particularly true of sole proprietorships and other small
businesses who are most able to choose where to locate. As noted, sole proprietors account for a large
and growing share of jobs in the region. If proprietors’ enthusiasm for starting businesses in the study
region were dampened to the same degree as retirees’ enthusiasm for moving there, the 10%
reduction in the rate of growth would mean 41 fewer jobs and $1.6 million less in personal income.
For “bottom line” reasons (e.g., cost of insurance) or due to owners’ own personal concerns,
businesses in addition to sole proprietorships might choose locations where the pipeline is not an issue.
If so, further opportunities for local job and income growth will be missed.
31 Raw data on travel expenditures is from the Virginia Tourism Corporation (2015). This reduction in economic activity would be in addition to the lost recreation benefits (that is, the value to the visitors themselves over and above their expenditures on recreational activity) that are included with ecosystem service costs above.

Economics of the Atlantic Coast Pipeline
44
These are simple scenarios and the actual magnitude of these impacts of the ACP will not be known
unless and until the pipeline is built. Even so, and especially because the pipeline is promoted by
supporters as bringing some jobs and other economic benefits to the region, it is important to consider
the potential for loss.
CONCLUSIONS The full costs of the proposed Atlantic Coast Pipeline in our four-county study area and beyond are
wide-ranging. They include one-time costs like reductions in property value and lost ecosystem
services during pipeline construction, which we estimate to be between $72.7 and $141.2 million. Plus
there are ongoing costs like lost property tax revenue, diminished ecosystem service value, and
dampened economic growth that would recur year after year for the life of the pipeline. These annual
costs range from an estimated $96.0 to $109.1 million per year. Most of these costs would be borne by
residents, businesses, and institutions in Highland, Augusta, Nelson, and Buckingham Counties.
By contrast, the ACP’s one local benefit is much smaller. It is an estimated average tax payment of $3.2
million per year (for the four-counties) through 2025 (Natural Resource Group, 2015b, pp. 5–31). Other
ACP-promoted benefits, such as jobs from the ACP’s construction and operation and those stemming
from lower energy costs, would accrue primarily in other places (Atlantic Coast Pipeline, LLC, n.d.).32
The decision to approve or not approve the ACP does not hinge on a simple comparison of estimated
benefits and estimated costs. The scope and magnitude of the costs outlined here, however, reflect
and are an important component of the full environmental effects that must be considered in making
that decision. Impacts on human well-being, including but not limited to those that can be expressed in
dollars-and-cents must be taken into account by the Federal Energy Regulatory Commission and others
weighing the societal value of the Atlantic Coast Pipeline.
If these considerations and FERC’s overall review, under the National Environmental Policy Act, result
in selection of the “no-action” alternative and the Atlantic Coast Pipeline is never built, most of the
costs outlined in this report will be avoided. It is most, but not all costs because there has already been
the cost of delaying implementation of business plans, the cost of houses languishing on the market,
and the cost to individuals of the stress, time, and energy diverted to concern about the pipeline rather
than what would normally (and more productively) fill their lives.
Another possible scenario is that the FERC, considering the impacts of the ACP as currently proposed
on ecosystem services, property values, and economic development, would conduct a thorough
analysis of all possible alternatives. Those alternatives may include using existing gas transmission
infrastructure (with or without capacity upgrades), routing new gas transmission lines along existing
utility and transportation rights-of-way, and/or scaling down permitted new pipeline capacity to match
regional gas transmission needs (as opposed to permitting pipelines on a company-by-company basis).
In this case, estimates of these impacts should inform the choice of a preferred alternative that
minimizes environmental damage and, thereby, minimizes the economic costs to individuals,
businesses, and the public at large.
32 Due to issues with the methods and assumptions used in the ACP-sponsored studies, the benefit estimates they present
may be inflated. See Stanton, et al. (2015), and Phillips (2015b) for a review.
Property Value, Ecosystem Service, and Economic Development Effects in Central and Western Virginia
45
Boxes: (Hoy, 2015); (Crosby, 2015a, 2015b); (Executive Order 12898, 1999, “Proximity of Compressor Station Devalues Homes by as much as 50%,” 2015; Ferguson, 2015; Luckett, Buppert, & Margolis, 2015; Natural Resource Group, 2015a; Southwest Pennsylvania Environmental Health Project, 2015; Subra,
2015; Walker & Koplinka-Loehr, 2014; Yogaville, 2015)
WORKS CITED Adler, K. (2015, October 21). Adler, Kristina, Comment, Comment, FERC DOCKET NO.: PF15-6-
000,20151021-5116(30971095).pdf.
Albright, H. K. (2011). A Question of Disclosure. Right of Way, (March/April), 5.
Allen, Williford & Seale Inc. (2001). Natural Gas Pipeline Impact Study. Interstate Natural Gas Association of America (INGAA) Foundation, Inc.
Amacher, G. S., & Brazee, R. J. (1989). Application of wetland valuation techniques: Examples from Great Lakes Coastal wetlands. University of Michigan, School of Natural Resources.
Atlantic Coast Pipeline, LLC. (n.d.). Powering the future: Driving change through clean energy. Atlantic Coast Pipeline.
Averitt, R. G. (2015, April 9). Richard G. Averitt IV Comment, FERC DOCKET NO.: PF15-6-000,20150420-0096(30511262).
Balmford, A., Fisher, B., Green, R. E., Naidoo, R., Strassburg, B., Kerry Turner, R., & Rodrigues, A. S. L. (2010). Bringing Ecosystem Services into the Real World: An Operational Framework for Assessing the Economic Consequences of Losing Wild Nature. Environmental and Resource Economics, 48(2), 161–175. http://doi.org/10.1007/s10640-010-9413-2
Balmford, A., Rodrigues, A., Walpole, M., Brink, P., Kettunen, M., de Groot, R., & Cambridge, U. (2013). The Economics of Biodiversity and Ecosystems: Scoping the Science. (Vol. 8 SRC - GoogleScholar). Retrieved from http://ec.europa.eu/environment/nature/biodiversity/economics/teeb_en.htm
Barrow, C. J. (1991). Land degradation: development and breakdown of terrestrial environments., 305 pp.
Batker, D., Kocian, M., McFadden, J., & Schmidt, R. (2010). Valuing The Puget Sound Basin: Revealing Our Best Investments 2010 (p. 102). Tacoma, WA: Earth Economics.
Bergstrom, J. C., Dillman, B. L., & Stoll, J. R. (1985). Public Environmental Amenity Benefits Of Private Land: The Case Of Prime Agricultural Land. Southern Journal of Agricultural Economics, 17(01). Retrieved from http://ideas.repec.org/a/ags/sojoae/29361.html
Bergstrom, J. C., Stoll, J. R., Titre, J. P., & Wright, V. L. (1990). Economic value of wetlands-based recreation. Ecological Economics, 2(2), 129–147. http://doi.org/10.1016/0921-8009(90)90004-E
Billingsley, K., Brown, C., Collins, S., Harman, S., Mitchell, B., Sullenberger, R., & Witschey, N. (2015, April 7). Economic Development Authority of Highland County: Stategic Plan 2015. The Highland Economic Development Authority.
Bixuan Sun. (2013). Land use conflict in an iron range community: an econometric analysis of the effect of mining on local real estate values and real estate tax collections. Oral, University of Minnesota-Morris.
Bolton, D. R., & Sick, K. A. (1999). Power Lines and Property Values: The Good, the Bad and the Ugly. The Urban Lawyer, 31(2). Retrieved from https://altered-states.net/barry/newsletter143/lawyer.htm
Boxall, P., Chan, W., & McMillan, M. (2005). The impact of oil and natural gas facilities on rural residential property values: a spatial hedonic analysis. Resource and Energy Economics, 27(2005), 248–269.

Economics of the Atlantic Coast Pipeline
46
Breaux, A., Farber, S., & Day, J. (1995). Using Natural Coastal Wetlands Systems for Wastewater Treatment: An Economic Benefit Analysis. Journal of Environmental Management, 44(3), 285–291. http://doi.org/10.1006/jema.1995.0046
Brenner Guillermo, J. (2007, May 4). Valuation of ecosystem services in the catalan coastal zone [info:eu-repo/semantics/doctoralThesis]. Retrieved May 18, 2014, from http://www.tdx.cat/handle/10803/6398
Carson, R. T., Mitchell, R. C., Hanemann, M., Kopp, R. J., Presser, S., & Ruud, P. A. (2003). Contingent valuation and lost passive use: damages from the Exxon Valdez oil spill. Environmental and Resource Economics, 25(3), 257–286.
Cleveland, C. J., Betke, M., Federico, P., Frank, J. D., Hallam, T. G., Horn, J., … Kunz, T. H. (2006). Economic value of the pest control service provided by Brazilian free-tailed bats in south-central Texas. Frontiers in Ecology and the Environment, 4(5), 238–243. http://doi.org/10.1890/1540-9295(2006)004[0238:EVOTPC]2.0.CO;2
Cohen, J. (2015, Winter). Home Sick from Toxic Emissions. Retrieved December 31, 2015, from http://www.utne.com/environment/home-sick-from-toxic-emissions-zm0z15wzdeh.aspx
Conservation Biology Institute. (2012). Protected Areas Database of the US, PAD-US (CBI Edition). Conservation Biology Institute. Retrieved from http://consbio.org/products/projects/pad-us-cbi-edition
Cordell, H. K., & Bergstrom, J. C. (1993). Comparison of recreation use values among alternative reservoir water level management scenarios. Water Resources Research, 29(2), 247–258. http://doi.org/10.1029/92WR02023
Costanza, R., d’Arge, R., de Groot, R., Farber, S., Grasso, M., Hannon, B., … Van den Belt, M. (2006). The value of the world’s ecosystem services and natural capital. Environment: Key Issues for the Twenty-First Century. Valuing the Environment, 3, 22.
Costanza, R., d’Arge, R., Farber, S., Grasso, M., deGroot, R., Hannon, B., & van den Belt, M. (1997). The Value of the World’s Ecosystem Services and Natural Capital. Nature, 387, 253–260.
Costanza, R., Farber, S. C., & Maxwell, J. (1989). Valuation and management of wetland ecosystems. Ecological Economics, 1(4), 335–361. http://doi.org/10.1016/0921-8009(89)90014-1
Costanza, R., & Farley, J. (2007). Ecological economics of coastal disasters: Introduction to the special issue. Ecological Economics, 63(2–3), 249–253. http://doi.org/10.1016/j.ecolecon.2007.03.002
Costanza, R., Wilson, M., Troy, A., Voinov, A., Liu, S., & D’Agostino, J. (2006). The value of New Jersey’s ecosystem services and natural capital. Gund Institute for Ecological Economics, University of Vermont and New Jersey Department of Environmental Protection, Trenton, New Jersey, 13. Retrieved from http://www.academia.edu/download/30561335/njvaluationpart2.pdf
Creel, M., & Loomis, J. (1992). Recreation value of water to wetlands in the San Joaquin Valley: Linked multinomial logit and count data trip frequency models. Water Resources Research, 28(10), 2597–2606. http://doi.org/10.1029/92WR01514
Croitoru, L. (2007). How much are Mediterranean forests worth? Forest Policy and Economics, 9(5), 536–545.
Crosby, H. (2015a, May 26). How the pipeline would affect my farm. The News Leader. Retrieved from http://www.newsleader.com/story/opinion/columnists/2015/05/23/pipeline-affect-farm/27838987/
Crosby, H. (2015b, July 24). Personal Communication.

Property Value, Ecosystem Service, and Economic Development Effects in Central and Western Virginia
47
Cruz, A. de la, & Benedicto, J. (2009). Assessing Socio-economic Benefits of Natura 2000 – a Case Study on the ecosystem service provided by SPA PICO DA VARA / RIBEIRA DO GUILHERME. (Output of the project Financing Natura 2000: Cost estimate and benefits of Natura 2000 (Contract No.: 070307/2007/484403/MAR/B2).). 43. Retrieved from http://ec.europa.eu/environment/nature/natura2000/financing/docs/azores_case_study.pdf
Davenport, F. (2015, December 14). Personal Communication.
Diskin, B. A., Friedman, J. P., Peppas, S. C., & Peppas, S. R. (2011). The Effect of Natural Gas Pipelines on Residential Value. Right of Way, (January/February), 24–27.
Donovan, S., Goldfuss, C., & Holdren, J. (2015). Incorporating Natural Infrastructure and Ecosystem Services in Federal Decision-Making (p. 5). Executive Office of the President, OMB & CEQ. Retrieved from https://www.whitehouse.gov/blog/2015/10/07/incorporating-natural-infrastructure-and-ecosystem-services-federal-decision-making
Esposito, V. (2009). Promoting ecoliteracy and ecosystem management for sustainablity through ecological economic tools. (Doctoral). University of Vermont. Retrieved from https://library.uvm.edu/jspui/handle/123456789/193
Esposito, V., Phillips, S., Boumans, R., Moulaert, A., & Boggs, J. (2011). Climate change and ecosystem services: The contribution of and impacts on federal public lands in the United States. In Watson, Alan; Murrieta-Saldivar, Joaquin; McBide, Brooke, comps. Science and stewardship to protect and sustain wilderness values. Merida, Yucatan, Mexico.: USDA Forest Service, Rocky Mountain Research Station. Retrieved from http://www.fs.fed.us/rm/pubs/rmrs_p064/rmrs_p064_155_164.pdf
Everard, M., Great Britain, & Environment Agency. (2009). Ecosystem services case studies. Bristol: Environment Agency.
Executive Order on Federal Actions to Address Environmental Justice in Minority Populations and Low- Income Populations (1999). Retrieved from http://www.ncbi.nlm.nih.gov/books/NBK100855
Federal Energy Regulatory Commission. (2015). Notice of Intent to Prepare an Environmental Impact Statement for the Planned Supply Header Project and Atlantic Coast Pipeline Project, Request for Comments on Environmental Issues, and Notice of Public Scoping Meetings. Federal Register, 80(44), 12163–12166.
Fenton, W., & Fenton, L. (2015, March 29). Fenton Inn: Comment, FERC DOCKET NO.: PF15-6-000,20150331-5090(30447730).
Ferguson, B. (2015, December 31). Personal Communication, Bruce Ferguson, Catskill Citizens for Safe Energy.
Fitzgerald, R. L. (2015, February 28). Letter regarding effect of pipelines on crop productivity.
Flores, L., Harrison-Cox, J., Wilson, S., & Batker, D. (2013). Nearshore Valuation-Primary Values. Nature’s Value in Clallam County: The Economic Benefits of Feeder Bluffs and 12 Other Ecosystems. Tacoma, WA: Earth Economics.
Folke, C., & Kaberger. (1991). The societal value of wetland life-support. In C. Folke & T. Kåberger (Eds.), Linking the natural environment and the economy. Dordrecht: Springer Netherlands. Retrieved from http://link.springer.com/10.1007/978-94-017-6406-3
Freeman III, A. M. (1979). The Benefits of Environmental Improvement: Theory and Practice. Baltimore: Johns Hopkins University Press.

Economics of the Atlantic Coast Pipeline
48
Fruits, E. (2008). Natural Gas Pipelines and Residential Property Values: Evidence from Clackamas and Washington Counties. Retrieved from http://pstrust.org/docs/NGPipesPropertyValues.pdf
Fry, J., Xian, G., Jin, S., Dewitz, J., Homer, C., Yang, L., … Wickham, J. (2011). NLCD_September2011PERS.pdf. Photogrammetric Engineering & Remote Sensing, 77(9), 858–864.
Gibbons, D. C. (1986). The Economic Value of Water. Resources for the Future. Retrieved from https://books.google.com/books/about/The_economic_value_of_water.html?id=5VkXgPwwofAC
Glover, A. N., & Castle, R. S. (2015). Economic Development Strategic Plan, Augusta County, VA: Update to Recommendations/Actions (after 5 years). Retrieved from http://augustavabusiness.com/news_media/publications
Gren, I.-M., Groth, K.-H., & Sylven, M. (1995). Economic Values of Danube Floodplains. Journal of Environmental Management, 45(4), 333–345.
Gren, I.-M., & Söderqvist, T. (1994). Economic valuation of wetlands: a survey. Beijer International Institute of Ecological Economics, The Royal Swedish Academy of Sciences.
Haener, M. K., & Adamowicz, W. L. (2000). Regional forest resource accounting: a northern Alberta case study. Canadian Journal of Forest Research, 30(2), 264–273. http://doi.org/10.1139/x99-213
Hansen, J. L., Benson, E. D., & Hagen, D. A. (2006). Environmental hazards and residential property values: Evidence from a major pipeline event. Land Economics, 82(4), 529–541.
Headwaters Economics. (2015). Economic Profile System. Retrieved from http://headwaterseconomics.org/tools/eps-hdt
Hoecker, J. J., Breathitt, L. K., & He’bert Jr., C. L. FERC Statement of Policy on Certification of New Interstate Natural Gase Pipeline Facilities, Docket No. PL99-3-000, 88 FERC para. 61,227 (1999).
Hoover, J. (2015, April 16). Total Cost for a New Municipal Water Supply Well.
Hotz, D. (2015, December 10). Personal Communication.
Hoy, N. (2015, March 21). Cowpasture River Preservation Association Comment, FERC DOCKET NO.: PF15-6-000,20150324-0035(30414048).
Jenkins, W. A., Murray, B. C., Kramer, R. A., & Faulkner, S. P. (2010). Valuing ecosystem services from wetlands restoration in the Mississippi Alluvial Valley. Ecological Economics, 69(5), 1051–1061. http://doi.org/10.1016/j.ecolecon.2009.11.022
Johnson, G. (2010, March). ARIES Workshop. Presented at the ARIES (Artificial Intelligence for Ecosystem Services) Workshop, Gund Insitute, University of Vermont.
Johnson, J. D., & Rasker, R. (1995). The role of economic and quality of life values in rural business location. Journal of Rural Studies, 11(4), 405–416. http://doi.org/10.1016/0743-0167(95)00029-1
Jones, W. K. (2015). Possible impacts to the water resources of Monterey, Virginia from construction of the proposed Dominion high pressure gas pipeline (p. 11). Warm Springs, Virginia: Envrionmental Data.
Kielisch, K. (2015). Study on the Impact of Natural Gas Transmission Pipelines (p. 28). Forensic Appriaisal Group, Ltd.
Kniivila, M., Ovaskainen, V., & Saastamoinen, O. (2002). Costs and benefits of forest conservation: regional and local comparisons in Eastern Finland. Journal of Forest Economics, 8(2), 131–150.
Knoche, S., & Lupi, F. (2007). Valuing deer hunting ecosystem services from farm landscapes. Ecological Economics, 64(2), 313–320. http://doi.org/10.1016/j.ecolecon.2007.07.023

Property Value, Ecosystem Service, and Economic Development Effects in Central and Western Virginia
49
Kopp, R. J., & Smith, V. K. (Eds.). (1993). Valuing Natural Assets: The Economics of Natural Resource Damage Assessment. Washington, D.C: RFF Press.
Kreutzwiser, R. (1981). The Economic Significance of the Long Point Marsh, Lake Erie, as a Recreational Resource. Journal of Great Lakes Research, 7(2), 105–110. http://doi.org/10.1016/S0380-1330(81)72034-3
Lant, C., & Roberts, R. (1990). Greenbelts in the Cornbelt: Riparian Wetlands, Intrinsic Values and Market Failure. Environment and Planning A, 1375–1388.
Leschine, T. M., Wellman, K. F., & Green, T. H. (1997). The Economic Value of Wetlands: Wetlands’ Role in Flood Protection in Western Washington (Ecology Publication No. 97-100). Washington State Department of Ecology. Retrieved from https://fortress.wa.gov/ecy/publications/publications/97100.pdf
Lex, B., & Groover, G. E. (2015). 2014 NASS Cropland and Pastureland Rental Rates. Virginia Cooperative Extension. Retrieved from www.ext.vt.edu
Luckett, B., Buppert, G., & Margolis, J. M. (2015, April 28). SELC ACP Comment, FERC DOCKET NO.: PF15-6-000,20150428-5504(30537222). Southern Environmental Law Center; Appalachian Mountain Advocates; Center for Biological Diversity.
Lui, Z. (2006). Water Quality Simulation and Economic Valuation of Riparian Land-use Changes. University of Cincinnati.
Mates, W. (2007). Valuing New Jersey’s Natural Capital: An Assessment of the Economic Value of the State’s Natural Resources. Report Prepared for the New Jersey Department of Environmental Protection, Division of Science, Research, and Technology. Retrieved from http://www.state.nj.us/dep/dsr/naturalcap/nat-cap-1.pdf
McGranahan, D. A., Wojan, T. R., & Lambert, D. M. (2010). The rural growth trifecta: outdoor amenities, creative class and entrepreneurial context. Journal of Economic Geography, lbq007. http://doi.org/10.1093/jeg/lbq007
McPherson, G. E. (1992). Accounting for benefits and costs of urban greenspace. Landscape and Urban Planning, 22(1), 41–51. http://doi.org/10.1016/0169-2046(92)90006-L
McPherson, G., Scott, K., & Simpson, J. (1998). Estimating cost effectiveness of residential yard trees for improving air quality in Sacramento, California, using existing models. Atmospheric Environment, 32(1), 75–84. http://doi.org/10.1016/S1352-2310(97)00180-5
Meyerhoff, J., & Dehnhardt, A. (2004). The European Water Framework Directive and economic valuation of wetlands. In Proc. of 6th BIOECON Conference Cambridge. Retrieved from http://www.bauphysik.tu-berlin.de/fileadmin/a0731/uploads/publikationen/workingpapers/wp01104.pdf
Millennium Ecosystem Assessment. (2003). Ecosystems and Human Well-being: A Framework for Assessment. Washington, D.C.: Island Press. Retrieved from http://millenniumassessment.org/en/Framework.html
Ministerie van Landbouw, & Natuur en Voedselkwaliteit. (2006). Kentallen Waardering Natuur, Water, Bodem en Landschap Hulpmiddel bij MKBA´s Eerste editie. Retrieved from http://www.lne.be/themas/beleid/milieueconomie/downloadbare-bestanden/ME10_Kentallenboek_waardering_natuur_water_bodem_en_landschap.pdf

Economics of the Atlantic Coast Pipeline
50
Mullen, J. K., & Menz, F. C. (1985). The Effect of Acidification Damages on the Economic Value of the Adirondack Fishery to New York Anglers. American Journal of Agricultural Economics, 67(1), 112. http://doi.org/10.2307/1240830
Natural Resource Group. (2015a). Atlantic Coast Pipeline, LLC, Atlantic Coast Pipeline and Dominion Transmission, Inc., Supply Header Project, Resource Report 1, General Project Description, Appendix 1A, Topographic Route Maps (Resource Report No. 5) (p. 68). Atlantic Coast Pipeline, LLC & Dominion Transmission, Inc.
Natural Resource Group. (2015b). Atlantic Coast Pipeline, LLC, Atlantic Coast Pipeline (Docket No. CP15-554-000) and Dominion Transmission, Inc., Supply Header Project (Docket No. CP15-555-000), Resource Report 5: Socioeconomics (Final) (Resource Report No. 5) (p. 267). Atlantic Coast Pipeline, LLC & Dominion Transmission, Inc.
Natural Resource Group. (2015c). Atlantic Coast Pipeline, LLC, Atlantic Coast Pipeline (Docket No. PF15-6-000) and Dominion Transmission, Inc., Supply Header Project (Docket No. PF15-5-000), Resource Report 1: General Project Description (Draft) (Resource Report to FERC No. RR 1) (p. 94). Atlantic Coast Pipeline, LLC & Dominion Transmission, Inc.
Nelson County Planning Commission. (2002, October 8). Nelson County Comprehensive Plan. Nelson County, Virginia. Retrieved from http://www.nelsoncounty-va.gov/government/nelson-county-comprehensive-plan/
Niemi, E. G., & Whitelaw, W. E. (1999). Assessing economic tradeoffs in forest management (General Technical Report No. PNW-GTR-403). USDA Forest Service, Pacific Northwest Research Station. Retrieved from http://conservationfinance.org/guide/guide/images/18_niemi.pdf
Nowak, D. J., Crane, D. E., Dwyer, J. F., & others. (2002). Compensatory value of urban trees in the United States. Journal of Arboriculture, 28(4), 194–199.
OECD. (2006). Benefits Transfer. In Cost-Benefit Analysis and the Environment (pp. 253–267). OECD Publishing. Retrieved from http://www.oecd-ilibrary.org/environment/cost-benefit-analysis-and-the-environment/benefits-transfer_9789264010055-18-en
Palmer, D. R. (2008, February 21). The impact of natural gas pipelines on property values: Market analysis prepared for Palomar Gas Transmission LLC. PGP Valuation, Inc.
Perrot-Maiître, D., & Davis, P. (2001). Case studies of markets and innovative financial mechanisms for water services from forests. Retrieved from http://bibliotecavirtual.minam.gob.pe/biam/bitstream/handle/123456789/1540/BIV01321.pdf?sequence=1&isAllowed=y
Phillips, S. (2004). Windfalls for wilderness: land protection and land value in the Green Mountains. Virginia Polytechnic Institute and State University, Agricultural and Applied Economics, Blacksburg, VA.
Phillips, S. (2015a). Ecosystem Services in the Pisgah-Nantahala National Forest Region: Concepts, Estimation, and Application to National Forest Planning (p. 28). Charlottesville, VA: Key-Log Economics, LLC for the Wilderness Society.
Phillips, S. (2015b, April 28). Scope of Analysis, Establishment of Alternatives, and Total Economic Cost of Pipeline Development: Scoping Comment, FERC DOCKET NO.: PF15-6-000,. Key-Log Economics.
Phillips, S., & McGee, B. (2014). The Economic Benefits of Cleaning Up the Chesapeake Bay: A Valuation of the Natural Benefits Gained by Implementing the Chesapeake Clean Water Blueprint (p. 56). Annapolis, MD: Chesapeake Bay Foundation. Retrieved from http:\\www.cbf.org\economicbenefits

Property Value, Ecosystem Service, and Economic Development Effects in Central and Western Virginia
51
Phillips, S., & McGee, B. (2016). Ecosystem Service Benefits of a Cleaner Chesapeake Bay. Coastal Management, Forthcoming.
Pimentel, D. (1998). Benefits of biological diversity in the state of Maryland. Ithaca, NY: Cornell University, College of Agricultural and Life Sciences.
Pimentel, D., Harvey, C., Resosudarmo, P., Sinclair, K., Kurz, K., McNair, M., … Blair, R. (2003). Environmental and Economic Costs of Soil Erosion and Conservation Benefits. Science, Vol. 267(No 5201).
Pipeline Association for Public Awareness. (2007). Pipeline Emergency Response Guidelines (p. 20). Pipeline Association for Public Awareness. Retrieved from www.pipelineawareness.org
Postel, S., & Carpenter, S. (1977). Freswater Ecosystem Services. In G. Daily (Ed.), Nature’s Services: Societal Dependence On Natural Ecosystems (pp. 195–214). Washington, DC: Island Press.
Prince, R., & Ahmed, E. (1989). Estimating individual recreation benefits under congestion and uncertainty. Journal of Leisure Research, 21, 61–76.
propertytax101.org. (2015). Property Taxes By State (Virginia Counties and Independent Cities) [Data]. Retrieved October 14, 2015, from http://www.propertytax101.org/virginia
Proximity of Compressor Station Devalues Homes by as much as 50%. (2015, July 7). Catskill Citizens for Safe Energy. Retrieved from http://catskillcitizens.org/learnmore/DEVALUE.pdf
Pyles, T. (2015, April 27). Augusta County Service Authority: Comment, FERC DOCKET NO.: PF15-6-000,20150428-5288(30535726). Augusta County Service Authority.
Qiu, Z., Prato, T., & Boehrn, G. (2006). Economic Valuation of Riparian Buffer and Open Space in a Suburban Watershed1. JAWRA Journal of the American Water Resources Association, 42(6), 1583–1596. http://doi.org/10.1111/j.1752-1688.2006.tb06022.x
Randall, A. (1987). Resource Economics, Second Edition: An Economic Approach to Natural Resource and Environmental Policy. New York: John Wiley & Son.
Ready, R. C., Berger, M. C., & Blomquist, G. C. (1997). Measuring Amenity Benefits from Farmland: Hedonic Pricing vs. Contingent Valuation. Growth and Change, 28(4), 438–458.
Reid, W. V., Mooney, H. A., Cooper, A., Capistrano, D., Carpenter, S. R., Chopra, K., … Zurek, M. B. (2005). Millennium Ecosystem Assessment, Ecosystems and Human Well-being: Synthesis. Washington, DC: Island Press.
Robinson, W. S., Nowogrodzki, R., & Morse, R. A. (1989). The value of honey bees as pollinators of US crops. American Bee Journal, 129, 411–423, 477–487.
Sala, O. E., & Paruelo, J. M. (1997). Ecosystem services in grasslands. Nature’s Services: Societal Dependence on Natural Ecosystems, 237–251.
Shafer, E. L., Carline, R., Guldin, R. W., & Cordell, H. K. (1993). Economic amenity values of wildlife: Six case studies in Pennsylvania. Environmental Management, 17(5), 669–682. http://doi.org/10.1007/BF02393728
Smith, R. (2015a, May 18). Real-estate agents: Proposed pipeline already affecting sales. NewsAdvance.com. Retrieved from http://www.newsadvance.com/work_it_lynchburg/news/real-estate-agents-proposed-pipeline-already-affecting-sales/article_486d8e38-fcf5-11e4-b10b-5bfa67606fa1.html

Economics of the Atlantic Coast Pipeline
52
Smith, R. (2015b, July 8). Pipeline threatens plan for $35 million Nellysford resort. Nelson County Times. Retrieved from http://www.newsadvance.com/nelson_county_times/news/pipeline-threatens-plans-for-million-nellysford-resort/article_3527f4aa-259d-11e5-a135-775e0a418125.html
Smith, S. (2015, September 9). As US rushes to build gas lines, failure rate of new pipes has spiked. Retrieved October 7, 2015, from https://www.snl.com/InteractiveX/Article.aspx?cdid=A-33791090-11060
Southwest Pennsylvania Environmental Health Project. (2015, February 24). Summary on Compressor Stations and Health Impacts. Southwest Pennsylvania Environmental Health Project. Retrieved from http://www.environmentalhealthproject.org/
Stanton, E. A., Comings, T., Jackson, S., & Karaka, E. (2015). Atlantic Coast Pipeline Benefits Review: Chmura and ICF Economic Benefits Reports (p. 13). Cambridge, MA: Synapse Energy Economics, Inc. Retrieved from http://ftpcontent.worldnow.com/wvir/documents/Synapse_ACPPipelineReport_final_June2015.pdf
Stephens, M. J. (2000). A model for sizing High Consequence Areas Associated with Natural Gas Pipelines (Topical Report No. C-FER Report 99068). Edmonton, Alberta: C-FER Technologies. Retrieved from http://nogaspipeline.org/sites/nogaspipeline.org/files/wysiwyg/docs/c-ferstudy.pdf
Streiner, C. F., & Loomis, J. B. (1995). Estimating the Benefits of Urban Stream Restoration Using the Hedonic Price Method.
Subra, W. (2009, December). Health Survey Results of Current and Former DISH/Clark Texas Residents. Earthworks. Retrieved from http://www.earthworksaction.org/files/publications/DishTXHealthSurvey_FINAL_hi.pdf
Subra, W. (2015, October 3). Toxic Exposure Associated with Shale Development. Subra Company and Earthworks Board.
TEEB - The Initiative. (n.d.). Retrieved January 24, 2016, from http://www.teebweb.org/about/the-initiative/
Theiss, H. (2015, June 3). Personal Communication re: expected impact of ACP on Wintergreen expansion plans.
The Trust for Public Land. (2010). The economic benefits and fiscal impact of parks and open space in Nassau and Suffolk Counties, New York (p. 48). The Trust for Public Land. Retrieved from http://cloud.tpl.org/pubs/ccpe--nassau-county-park-benefits.pdf
UK Environment Agency. (1999). River Ancholme flood storage area progression. (No. E3475/01/001). Prepared by Posford Duvivier Environment.
US Bureau of Economic Analysis. (2015). Regional Economic Accounts: Local Area Personal Income & Employment [Data]. Retrieved August 5, 2015, from http://www.bea.gov/regional/index.htm
US Bureau of the Census. (2014). American Community Survey [Data & Tools]. Retrieved May 16, 2014, from http://www.census.gov/acs/www/
US Bureau of the Census. (2015). American FactFinder [Data]. Retrieved September 20, 2015, from http://factfinder.census.gov/faces/nav/jsf/pages/index.xhtml
USDA Forest Service. (2012). National Forest System Land Management Planning: Final Rule and Record of Decision. Federal Register, 77(68), 21162–21276.
Van der Ploeg, S., Wang, Y., Gebre Weldmichael, T., & De Groot, R. S. (2010). The TEEB Valuation Database – a searchable database of 1310 estimates of monetary values of ecosystem services.

Property Value, Ecosystem Service, and Economic Development Effects in Central and Western Virginia
53
(Excel database and accompanying documentation). Wageningen, The Netherlands: Foundation for Sustainable Development. Retrieved from http://www.es-partnership.org/esp/80763/5/0/50
van Rossum, M. K. (2016, January 26). Time for FERC to pipe down [Newspaper]. Retrieved from http://thehill.com/blogs/congress-blog/energy-environment/266915-time-for-ferc-to-pipe-down
Virginia Tourism Corporation. (2015). Virginia Locality Economic Impact Data [Data]. Retrieved December 1, 2015, from http://virginiascan.yesvirginia.org/localspending/localspending.aspx
Walker, M., & Koplinka-Loehr, S. (2014, July 9). Air Quality and Health Impacts of Milford Compressor Station Expansion. Clean Air Council. Retrieved from http://www.cleanair.org/program/outdoor_air_pollution/shale_gas_infrastructure/milford_compressor_station_air_impacts_commun
Webb, R. (2015a). Case Study - Columbia Gas, Giles County, VA. Retrieved from http://pipelineupdate.org/national-forest-pipeline-overview/
Webb, R. (2015b, October 11). Peters Mountain Revisited. Retrieved from http://pipelineupdate.org/2015/10/11/peters-mountain-revisited/
Weber, T. (2007). Ecosystem services in Cecil County’s green infrastructure: Technical Report for the Cecil County Green Infrastructure Plan (White Paper) (p. 32). Annapolis, MD: The Conservation Fund. Retrieved from http://www.ccgov.org/uploads/PlanningAndZoning/General/CecilCoMD_TechReport%20-%20Ecosystem%20services.pdf
Whitehead, J. C. (1990). Measuring willingness-to-pay for wetlands preservation with the contingent valuation method. Wetlands, 10(2), 187–201. http://doi.org/10.1007/BF03160832
Wilson, S. (2005). Counting Canada’s Natural Capital Assessing the Real Value of Canada’s Boreal Ecosystems. Drayton Valley: Pembina Institute for Appropriate Development. Retrieved from http://public.eblib.com/choice/PublicFullRecord.aspx?p=3242296
Winfree, R., Gross, B. J., & Kremen, C. (2011). Valuing pollination services to agriculture. Ecological Economics, 71, 80–88. http://doi.org/10.1016/j.ecolecon.2011.08.001
Woolard, A. M., & Natural Resource Group. (2015, May). Atlantic Coast Pipeline (Docket No. PF15-6-000) and Supply Header Project (Docket No. PF15-5-000): Responses to Issues Raised During Scoping. Dominion Transmission, Inc.
Yogaville. (2015, April 27). Yogaville: Comment, FERC DOCKET NO.: PF15-6-000,20150428-5191(30533838).
Zhou, X., Al-Kaisi, M., & Helmers, M. J. (2009). Cost effectiveness of conservation practices in controlling water erosion in Iowa. Soil and Tillage Research, 106(1), 71–78. http://doi.org/10.1016/j.still.2009.09.015
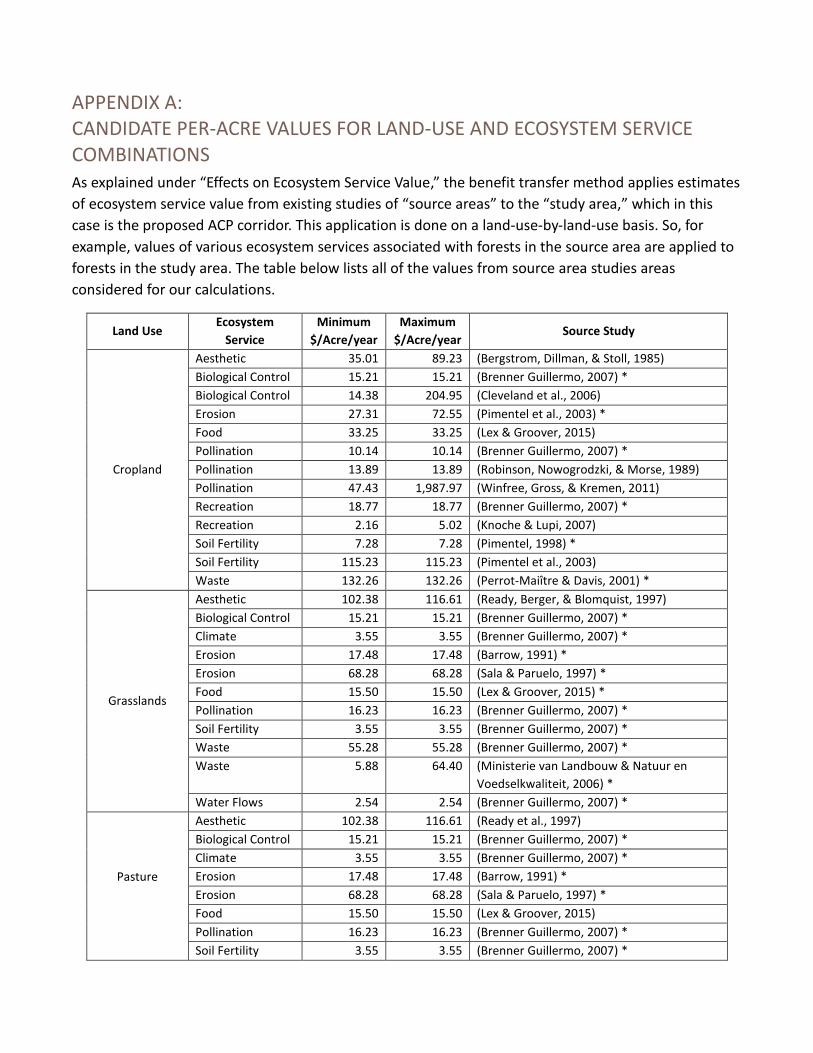
APPENDIX A: CANDIDATE PER-ACRE VALUES FOR LAND-USE AND ECOSYSTEM SERVICE COMBINATIONS As explained under “Effects on Ecosystem Service Value,” the benefit transfer method applies estimates
of ecosystem service value from existing studies of “source areas” to the “study area,” which in this
case is the proposed ACP corridor. This application is done on a land-use-by-land-use basis. So, for
example, values of various ecosystem services associated with forests in the source area are applied to
forests in the study area. The table below lists all of the values from source area studies areas
considered for our calculations.
Land Use Ecosystem
Service
Minimum
$/Acre/year
Maximum
$/Acre/year Source Study
Cropland
Aesthetic 35.01 89.23 (Bergstrom, Dillman, & Stoll, 1985)
Biological Control 15.21 15.21 (Brenner Guillermo, 2007) *
Biological Control 14.38 204.95 (Cleveland et al., 2006)
Erosion 27.31 72.55 (Pimentel et al., 2003) *
Food 33.25 33.25 (Lex & Groover, 2015)
Pollination 10.14 10.14 (Brenner Guillermo, 2007) *
Pollination 13.89 13.89 (Robinson, Nowogrodzki, & Morse, 1989)
Pollination 47.43 1,987.97 (Winfree, Gross, & Kremen, 2011)
Recreation 18.77 18.77 (Brenner Guillermo, 2007) *
Recreation 2.16 5.02 (Knoche & Lupi, 2007)
Soil Fertility 7.28 7.28 (Pimentel, 1998) *
Soil Fertility 115.23 115.23 (Pimentel et al., 2003)
Waste 132.26 132.26 (Perrot-Maiître & Davis, 2001) *
Grasslands
Aesthetic 102.38 116.61 (Ready, Berger, & Blomquist, 1997)
Biological Control 15.21 15.21 (Brenner Guillermo, 2007) *
Climate 3.55 3.55 (Brenner Guillermo, 2007) *
Erosion 17.48 17.48 (Barrow, 1991) *
Erosion 68.28 68.28 (Sala & Paruelo, 1997) *
Food 15.50 15.50 (Lex & Groover, 2015) *
Pollination 16.23 16.23 (Brenner Guillermo, 2007) *
Soil Fertility 3.55 3.55 (Brenner Guillermo, 2007) *
Waste 55.28 55.28 (Brenner Guillermo, 2007) *
Waste 5.88 64.40 (Ministerie van Landbouw & Natuur en
Voedselkwaliteit, 2006) *
Water Flows 2.54 2.54 (Brenner Guillermo, 2007) *
Pasture
Aesthetic 102.38 116.61 (Ready et al., 1997)
Biological Control 15.21 15.21 (Brenner Guillermo, 2007) *
Climate 3.55 3.55 (Brenner Guillermo, 2007) *
Erosion 17.48 17.48 (Barrow, 1991) *
Erosion 68.28 68.28 (Sala & Paruelo, 1997) *
Food 15.50 15.50 (Lex & Groover, 2015)
Pollination 16.23 16.23 (Brenner Guillermo, 2007) *
Soil Fertility 3.55 3.55 (Brenner Guillermo, 2007) *

Candidate Ecosystem Service Values
55
Land Use Ecosystem
Service
Minimum
$/Acre/year
Maximum
$/Acre/year Source Study
Pasture, cont’d
Waste 55.28 55.28 (Brenner Guillermo, 2007) *
Waste 5.88 64.40 (Ministerie van Landbouw & Natuur en
Voedselkwaliteit, 2006) *
Water Flows 2.54 2.54 (Brenner Guillermo, 2007) *
Shrub/Scrub
Air Quality 37.26 37.26 (Ministerie van Landbouw & Natuur en
Voedselkwaliteit, 2006) *
Climate 7.27 7.27 (Croitoru, 2007) *
Erosion 22.75 22.75 (Ministerie van Landbouw & Natuur en
Voedselkwaliteit, 2006) *
Pollination 1.41 7.10 (Robert Costanza, Wilson, et al., 2006)
Recreation 3.95 3.95 (Haener & Adamowicz, 2000)
Waste 46.35 46.35 (Croitoru, 2007) *
Waste 0.10 324.35 (Ministerie van Landbouw & Natuur en
Voedselkwaliteit, 2006) *
Forest
Aesthetic 4,439.71 18,141.99 (Nowak, Crane, Dwyer, & others, 2002)
Air Quality 372.57 372.57 (Ministerie van Landbouw & Natuur en
Voedselkwaliteit, 2006) *
Biological Control 8.91 8.91 (Wilson, 2005) *
Biological Control 2.54 2.54 (Brenner Guillermo, 2007) *
Climate 67.45 67.45 (Brenner Guillermo, 2007) *
Climate 56.89 56.89 (Robert Costanza, d’Arge, et al., 2006)
Erosion 61.87 61.87 (Brenner Guillermo, 2007) *
Erosion 3.09 36.09 (Zhou, Al-Kaisi, & Helmers, 2009)
Extreme Events 797.66 797.66 (Weber, 2007)
Food 0.13 0.13 (Wilson, 2005) *
Pollination 202.87 202.87 (Brenner Guillermo, 2007) *
Raw Materials 24.53 24.53 (Wilson, 2005) *
Raw Materials 166.82 166.82 (Weber, 2007)
Recreation 152.66 152.66 (Brenner Guillermo, 2007) *
Recreation 1.29 4.55 (Cruz & Benedicto, 2009) *
Recreation 1.56 1.56 (Kniivila, Ovaskainen, & Saastamoinen, 2002)
*
Recreation 37.13 45.50 (Prince & Ahmed, 1989)
Recreation 2.79 503.97 (Shafer, Carline, Guldin, & Cordell, 1993)
Soil Fertility 6.09 6.09 (Brenner Guillermo, 2007) *
Soil Fertility 19.97 19.97 (Weber, 2007)
Waste 55.28 55.28 (Brenner Guillermo, 2007) *
Waste 8.66 8.66 (Cruz & Benedicto, 2009) *
Waste 265.79 266.89 (Lui, 2006)
Water 204.39 204.39 (Brenner Guillermo, 2007) *
Water 47.39 47.39 (Cruz & Benedicto, 2009) *
Water 1,292.23 1,292.23 (Weber, 2007)
Water Flows 230.01 230.01 (Mates, 2007)
Water Flows 797.66 797.66 (Weber, 2007)

Appendix A
56
Land Use Ecosystem
Service
Minimum
$/Acre/year
Maximum
$/Acre/year Source Study
Water
Recreation 446.31 446.31 (Brenner Guillermo, 2007) *
Recreation 155.36 914.10 (Cordell & Bergstrom, 1993)
Recreation 304.18 437.19 (Mullen & Menz, 1985)
Recreation 148.68 148.68 (Postel & Carpenter, 1977)
Waste 10.72 10.72 (Gibbons, 1986) *
Water 512.74 512.74 (Brenner Guillermo, 2007) *
Water 22.98 22.98 (Gibbons, 1986) *
Wetland
Aesthetic 38.46 38.46 (Amacher & Brazee, 1989) *
Air Quality 75.50 98.02 (Jenkins, Murray, Kramer, & Faulkner, 2010)
Climate 1.84 1.84 (Wilson, 2005) *
Climate 157.73 157.73 (Brenner Guillermo, 2007) *
Extreme Events 228.06 369.85 (Wilson, 2005) *
Extreme Events 110.06 4,583.26 (Brenner Guillermo, 2007) *
Extreme Events 304.18 304.18 (Robert Costanza, Farber, & Maxwell, 1989)
Extreme Events 278.77 278.77 (Robert Costanza & Farley, 2007)
Extreme Events 1,645.59 7,513.98 (Leschine, Wellman, & Green, 1997)
Raw Materials 50.16 50.16 (Everard, Great Britain, & Environment
Agency, 2009)
Recreation 80.71 80.71 (Bergstrom, Stoll, Titre, & Wright, 1990)
Recreation 1,716.76 1,761.89 (Brenner Guillermo, 2007) *
Recreation 109.30 429.97 (Robert Costanza et al., 1989)
Recreation 1,041.04 1,041.04 (Creel & Loomis, 1992)
Recreation 88.06 994.50 (Gren & Söderqvist, 1994) *
Recreation 71.11 71.11 (Gren, Groth, & Sylven, 1995) *
Recreation 208.01 208.01 (Kreutzwiser, 1981)
Recreation 209.51 209.51 (Lant & Roberts, 1990) *
Recreation 648.57 4,203.82 (Whitehead, 1990)
Waste 141.56 141.56 (Wilson, 2005) *
Waste 67.02 67.02 (Breaux, Farber, & Day, 1995)
Waste 1,050.34 1,050.34 (Brenner Guillermo, 2007) *
Waste 170.05 170.05 (Gren & Söderqvist, 1994) *
Waste 35.20 35.20 (Gren et al., 1995) *
Waste 551.02 551.02 (Jenkins et al., 2010)
Waste 209.51 209.51 (Lant & Roberts, 1990) *
Waste 5,027.28 5,027.28 (Meyerhoff & Dehnhardt, 2004) *
Waste 10,881.15 10,881.15 (Lui, 2006)
Water 1,934.84 2,407.52 (Brenner Guillermo, 2007) *
Water 622.77 622.77 (Creel & Loomis, 1992)
Water 18.19 18.19 (Folke & Kaberger, 1991) *
Water Flows 3,741.87 3,741.87 (Brenner Guillermo, 2007) *
Water Flows 3,920.69 3,920.69 (Leschine et al., 1997)
Water Flows 4,329.70 4,329.70 (UK Environment Agency, 1999)
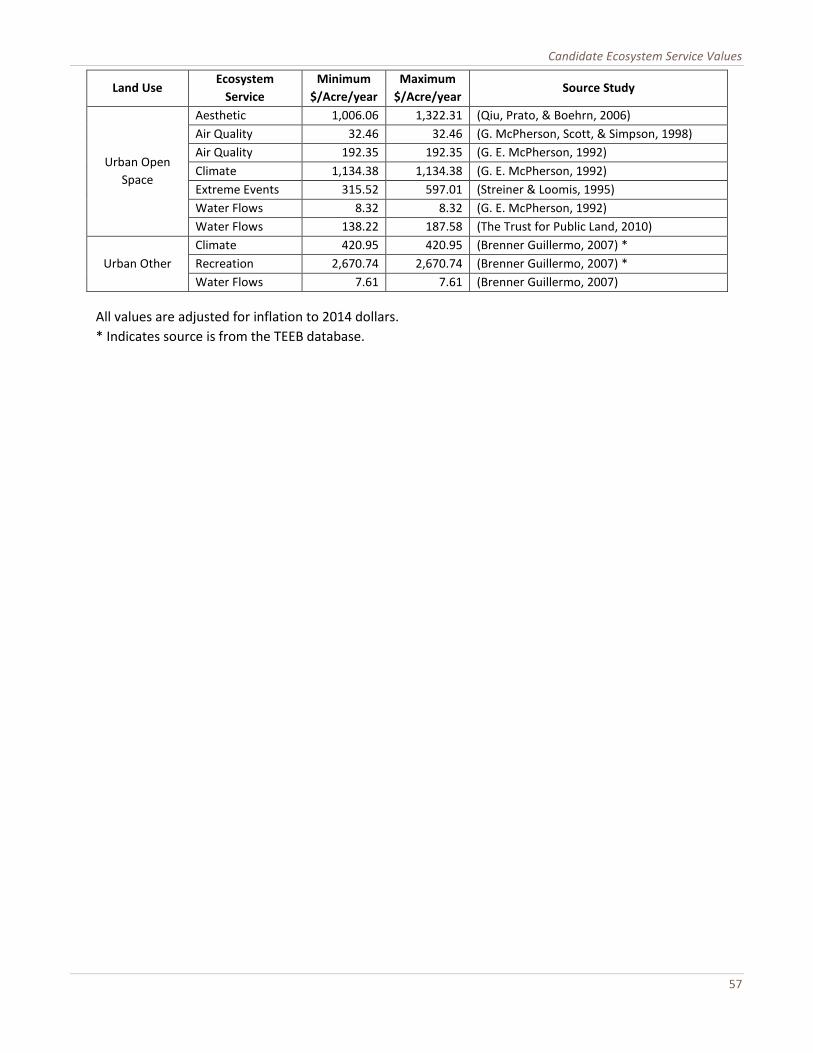
Candidate Ecosystem Service Values
57
Land Use Ecosystem
Service
Minimum
$/Acre/year
Maximum
$/Acre/year Source Study
Urban Open
Space
Aesthetic 1,006.06 1,322.31 (Qiu, Prato, & Boehrn, 2006)
Air Quality 32.46 32.46 (G. McPherson, Scott, & Simpson, 1998)
Air Quality 192.35 192.35 (G. E. McPherson, 1992)
Climate 1,134.38 1,134.38 (G. E. McPherson, 1992)
Extreme Events 315.52 597.01 (Streiner & Loomis, 1995)
Water Flows 8.32 8.32 (G. E. McPherson, 1992)
Water Flows 138.22 187.58 (The Trust for Public Land, 2010)
Urban Other
Climate 420.95 420.95 (Brenner Guillermo, 2007) *
Recreation 2,670.74 2,670.74 (Brenner Guillermo, 2007) *
Water Flows 7.61 7.61 (Brenner Guillermo, 2007)
All values are adjusted for inflation to 2014 dollars.
* Indicates source is from the TEEB database.