economic performance and opinions regarding appropriate
TRANSCRIPT

«This paper is financed by National Funds of the FCT – Portuguese
Foundation for Science and Technology within the project «UID/ECO/03182/2019»
“Undergraduate students’ economic
literacy, knowledge of the country’s
economic performance and opinions
regarding appropriate economic policies”
https://www.eeg.uminho.pt/pt/investigar/nipe
2019 #15
WORKING PAPER
João Martins Linda G. Veiga

1
Undergraduate students’ economic literacy, knowledge of the country’s economic
performance and opinions regarding appropriate economic policies
João Martins
Universidade do Minho, Escola de Economia e Gestão, Núcleo de Investigação em
Políticas Económicas e Empresariais (NIPE), and UNU-EGOV; [email protected];
Campus de Couros, Rua Vila Flor 166, 4810-445, Guimarães, Portugal
Linda G. Veiga
Universidade do Minho, Escola de Economia e Gestão, Núcleo de Investigação em
Políticas Económicas e Empresariais (NIPE); and UNU-EGOV; [email protected];
Campus de Gualtar, 4710-057, Braga, Portugal
Abstract: Based on a survey of more than 400 students at the University of Minho in
Portugal, we analyse the relationship of (1) basic economic literacy, (2) knowledge of
the country’s economic performance, and (3) opinions regarding appropriate economic
policies, with previous economic training, and other socioeconomic variables. The
results clearly show that economic training has a positive influence on students’
economic literacy and knowledge of the country’s current economic data and
conditions. It also influences their assessment of how economic policy should be
conducted. We argue that more training in Economics, both at the high school and
university levels, is necessary to improve citizens’ knowledge for making personal and
social decisions on economic issues. This recommendation is particularly relevant for
countries that recently underwent deep economic crises.
Keywords: economic literacy, knowledge of the country’s economic performance,
opinion on economic policies, training in Economics.

2
1. Introduction
Citizens’ economic literacy and knowledge of the country’s economic situation are
fundamental for making competent decisions on economic issues, both at the personal
and social levels. The ability of voters to hold governments accountable for the
economic performance of the country depends crucially on their understanding of how
the economy works. The recent financial and economic crises, that led to severe fiscal
policy sustainability problems in several countries, including Portugal, gave additional
relevance to the study of economic literacy.
Over the last decades until 2011, Portugal mainly adopted expansionary fiscal
policies that were accompanied by a rapid growth of credit to the economy. However,
economic growth was quite low, and domestic demand was largely satisfied by imports.
At the same time, the debt service absorbed a growing share of resources, increasing
the needs for external funding. The country’s financial vulnerability significantly
contributed to the deepening of the national crisis when the international financial crisis
abruptly reversed the attitude of the markets regarding risk assessment. In 2011,
Portugal lost access to market funding and, in May, the government was forced to sign
a rescue program with the European Commission, the European Central Bank and the
International Monetary Fund. The Economic and Financial Assistance Program
implemented from 2011 to 2014 imposed severe austerity measures and structural
changes to the economy. The deep economic crisis that Portugal underwent increased
people’s interest in economic affairs. Topics such as the debt sustainability, the size of
the government, or the adequacy of the implemented economic policies to achieve the
rescue program’s goals captured the attention of the media and became frequent topics
of discussion.
3
Inspired by the crisis that Portugal faced, the main purpose of this article is to
analyse whether economic training influences economic literacy, knowledge of the
country’s economic situation, and opinions on how economic policy should be
conducted. This is important for the design of educational policies intended to improve
citizens’ ability to make personal decisions on economic issues, and to monitor the
government’s economic policy decisions. To analyse the topic, a survey was carried out
on 494 students of the University of Minho. To measure economic training1 we use
dummies for the type of program in which the student is enrolled, and for the number
of ECTS2 in economics accumulated. Our findings corroborate the hypothesis that the
enrolment in economics courses increases economic literacy and makes students more
knowledgeable about the economic situation of the country. It also influences their
opinion regarding the role of government in the economy.
The paper proceeds as follows. Section II briefly presents previous research on
the topic. Sections III describes the data collection process, the survey and the key
variables used in the empirical work. Empirical results are discussed in section IV. The
last section concludes the paper.
1 In this paper, economic training refers to the economic learning opportunities provided by the university,
that is, economic courses.
2 European Credit Transfer System (ECTS) is a generalized credit system at the European level, according
to which a given amount of credits is assigned to each course, reflecting the quantity of work that such
course requires relative to the total amount of work that is necessary to complete a year of study
(equivalent to 60 ECTS).

4
2. Literature Review
Since the works of Stiegler (1963) and Bach and Saunders (1965, 1966) initiated
the debate on the effects of studying economics in individual’s long-term Economics’
knowledge, several papers have been investigating the determinants of economic
literacy,3 on the whole population and in specific groups,4 particularly among students.
A common finding of the studies analysing the general population (Gleason and Scyoc,
1995; Walstad, 1997; Walstad and Rebeck, 2002) is that taking college courses in
economics and a higher general education level have a positive influence on Economics’
knowledge. Being male, Caucasian,5 older, and having a higher income, are also factors
frequently associated with a higher level of economic literacy.
The positive role of studying economics on economic literacy that is found in
analyses of the adult population is also corroborated in studies that focus on high school
students (Walstad and Soper, 1988; Walstad and Rebeck, 2002; Walstad, 2013).
Focusing on first-year undergraduate students’ knowledge in microeconomics, Brückner
et al. (2015 a) also found a positive influence of prior economic education., while Roos
(2007) found that having good grades in the Introduction to Macroeconomics course
3 For reports on revisions of the Test of Economic Literacy see Walstad and Rebeck (2008) and Walstad,
Rebeck and Butters (2013). This test is a nationally-normed and standardized measure of the economic
understanding of US students. The Gallup Organization also implements several surveys on economic
literacy.
4 For example, Wood and Doyle (2002) focused on the economic literacy of the employees of seven
corporations.
5 Focusing on students from the University of Florida, Borg and Stranahan (2002) also found that gender
and race matter in student’s performance in Principles of Macroeconomics.
5
improved undergraduate students’ knowledge. On a sample of undergraduate seniors,
Walstad and Allgood (1999) corroborated the results of Walstad (1997), finding that
students with higher academic aspirations performed better, as well as those with
higher grades.
Studies of the determinants of economic literacy among students on panels of
countries are quite scarce. Using data for 55 countries, Jappelli (2010) found that the
results in the PISA test and the percentage of the population that goes to college are
positively, and significantly correlated with the country’s level of economic literacy.
However, generous social security systems reduce the incentives to be aware of the
economy and the financial market’s evolution, having a negative impact on economic
literacy. Studying economic knowledge of first-year students in higher education in USA
and Germany, Brückner et al. (2015 b) show that prior education has a positive
significant effect merely on microeconomics test scores, while gender and native
language are purely significant on macroeconomics test scores in both countries.
The gap between the general public and professional economists’ views on
economic issues has also been explored in the literature and is substantial (Blendon et
al., 1997). The differences are nevertheless smaller when controlling for education, self-
interest and ideological bias (Caplan, 2002). The roles of knowledge, ideology, and self-
interest on public opinion formation were further investigated by Blinder and Krueger
(2004), who concluded that among the three, ideology is the most important, followed
by economic knowledge. Additionally, income is also relevant as low-income individual’s
perceptions about the economy tend to be upward biased when their income is
increasing (Hopkins, 2012). At last, Manz (2014) concluded that individuals with higher

6
economic literacy are also able to make better use of information when it comes to
formulating inflation expectations.
As far as we know, no study has ever focused on the economic literacy of the
Portuguese students, and only one focused on the economic literacy of the general adult
population (Varum et al., 2014). This paper gives a small contribution to this gap in the
literature.
3. The survey
To collect the data, the survey presented in the online appendix6 was administered in-
person to students of the University of Minho. At the end of a class, after obtaining prior
consent from the teacher, the questionnaire was administered to all the students willing
to take it. In the selection of the classes, a non-probability sample design was adopted,
following a purposive strategy. As the main purpose of the study is to assess the effect
of studying Economics on undergraduate students’ economic literacy, knowledge of the
country’s economic performance and opinions on economic policies, it was decided that
the sample should consist of three groups of similar size: students enrolled in the
Economics undergraduate degree, students enrolled in degrees with at least one course
unit in Economics, and students with no training in Economics. In the second group, we
targeted students enrolled in degrees offered by the School of Economics and
Management (Accounting, Management and Political Science), and students in Law,
which have two courses in Economics. In the choice of the degrees from which students
6 Available at https://www.dropbox.com/s/fm349iwwj1jh5ny/Online%20appendix.pdf?dl=0.

7
were selected, we also made sure that degrees with different access grades7 were
considered. The sampling was also intended to have students from different years of
study, particularly from the degrees of Economics and Management, to widen the range
of the number of courses in Economics taken by students.
Before the administration of the survey, a pilot test was conducted on October
2014. After small adjustments, the first round of data collection began also in October
2014. In this first round, 404 undergraduate students were surveyed from the following
degrees: Economics, Management, Accounting, Political Science, Law, Education,
Biomedical Engineering, and Biology and Geology. The second round of data collection
occurred in February 2015, where 90 students were surveyed from the degrees of
Economics and Communication Sciences. Therefore, the database has 494 observations
corresponding to around 5% of the undergraduate student population of the University
of Minho. Although the sample cannot be considered as representative of
undergraduate students in Portugal, mainly because it is restricted to a specific
geographic context, it captures the diversity of fields of study (students from nine
undergraduate programs participated in the survey), grade of access to the university
and sociodemographic characteristics of University of Minho’s undergraduate students.
Table 1 shows the sample composition on what concerns the sampled individuals’ field
of study.
7 In Portugal, the number of vacancies assigned each academic year to each pair university/degree is
established by the government. Vacancies are assigned to students through a national tender, based on
grades.

8
Table 1 - Distribution of the sampled individuals by degree
Frequency Percentage
Undergraduate degree in Economics 158 31.98
Undergraduate degrees with some courses in Economics 187 37.85
Accounting 34 6.88
Law 45 9.11
Management 92 18.62
Political Science 16 3.24
Undergraduate degrees with no courses in Economics 149 30.16
Biology and Geology 40 8.10
Biomedical Engineering 41 8.30
Communication Sciences 42 8.50
Education 26 5.26
The survey has three parts. Part A is an assessment on the knowledge of basic
economic theory, Part B concentrates on opinions about economic policy issues and
perceptions of the country’s economic performance, and Part C focuses on the
individuals’ socio-demographic and political characteristics. The survey design was
mainly inspired on the National Survey on American Economic Literacy, as well as on the
previous works of Blendon et al. (1997), Blinder and Kruguer (2004), Walstad (1997) and
Walstad and Rebeck (2002), whose survey questions were selected and adapted
according to the Portuguese context.
Ten questions were included in the survey (Part A) to measure the economic
literacy of students. These questions are listed in Table 2, together with the percentage

9
of correct answers given by respondents, and the standard deviation. For each variable
494 observations are available. An economic literacy sum score (Econ_Literature) was
calculated based on the number of correct answers that each student gave to these
questions.8 The mean and standard deviation of the economic literacy measure are
reported at the bottom of Table 2. As can be seen from the table, the sample mean of
economic literacy is 7.34. Question 4, about the responsibility to define monetary policy,
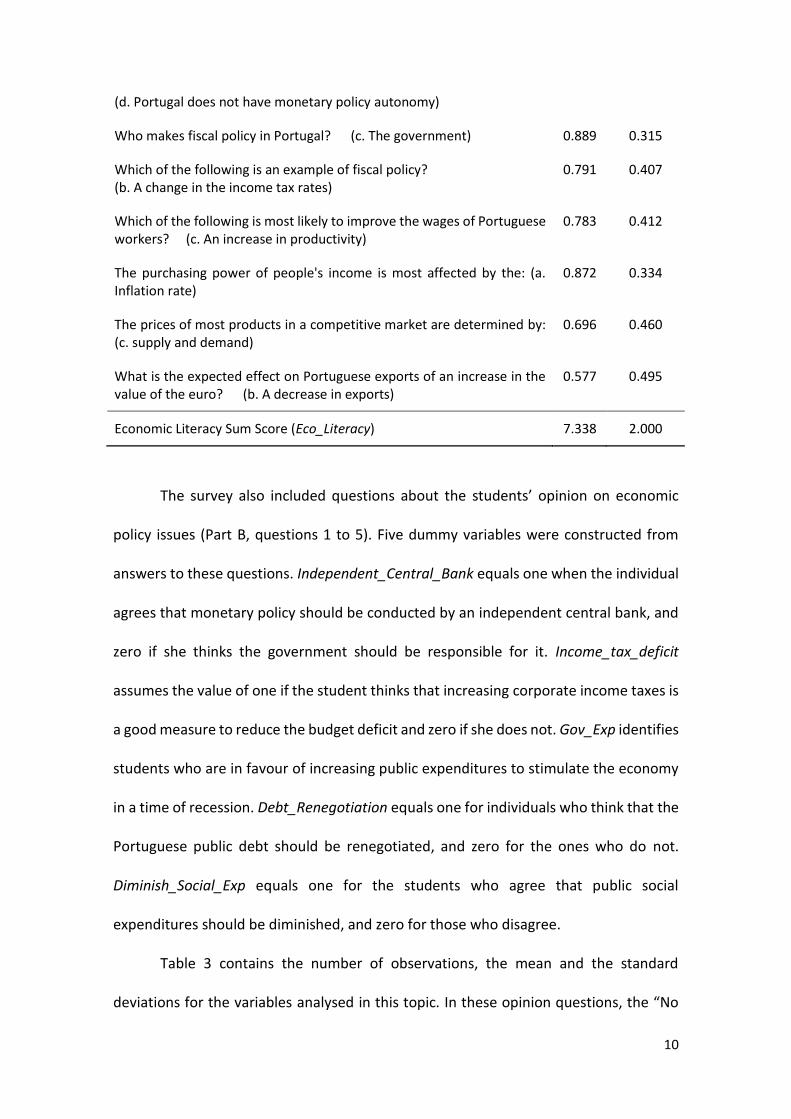
has, by far, the lowest percentage of correct answers (33%).9 The questions about the
variable that measures economic growth (Q2), the conditions for the existence of a
public deficit (Q3), and who sets fiscal policy (Q5) have the highest percentage of correct
answers (90%, 88%, and 89% respectively).
Table 2 - Economic literacy: Descriptive statistics
Question (correct answer) Mean Standard-Deviation
Which one of the following is the most widely used measure of inflation? (a. The Consumer Price Index)
0.621 0.486
Economic growth is measured by a change in which of the following? (c. The Gross Domestic Product)
0.901 0.299
There is a deficit in the national budget when: (a. government spending is greater than revenues)
0.879 0.327
Who sets monetary policy in Portugal? 0.326 0.469
8 The Cronbach alpha of this score is of approximately 0.7.
9 The original question from the National Survey on American Economic Literacy had just three possible
answers, none of which correct for the Portuguese case. In order to have four options for each question
included in the literacy test we added option d) Portugal does not have monetary policy independence,
which is the correct answer. The right answer for the US (the Fed), was adjusted to the Portuguese context
by replacing the Fed by the Bank of Portugal.
10
(d. Portugal does not have monetary policy autonomy)
Who makes fiscal policy in Portugal? (c. The government) 0.889 0.315
Which of the following is an example of fiscal policy? (b. A change in the income tax rates)
0.791 0.407
Which of the following is most likely to improve the wages of Portuguese workers? (c. An increase in productivity)
0.783 0.412
The purchasing power of people's income is most affected by the: (a. Inflation rate)
0.872 0.334
The prices of most products in a competitive market are determined by: (c. supply and demand)
0.696 0.460
What is the expected effect on Portuguese exports of an increase in the value of the euro? (b. A decrease in exports)
0.577 0.495
Economic Literacy Sum Score (Eco_Literacy) 7.338 2.000
The survey also included questions about the students’ opinion on economic
policy issues (Part B, questions 1 to 5). Five dummy variables were constructed from
answers to these questions. Independent_Central_Bank equals one when the individual
agrees that monetary policy should be conducted by an independent central bank, and
zero if she thinks the government should be responsible for it. Income_tax_deficit
assumes the value of one if the student thinks that increasing corporate income taxes is
a good measure to reduce the budget deficit and zero if she does not. Gov_Exp identifies
students who are in favour of increasing public expenditures to stimulate the economy
in a time of recession. Debt_Renegotiation equals one for individuals who think that the
Portuguese public debt should be renegotiated, and zero for the ones who do not.
Diminish_Social_Exp equals one for the students who agree that public social
expenditures should be diminished, and zero for those who disagree.
Table 3 contains the number of observations, the mean and the standard
deviations for the variables analysed in this topic. In these opinion questions, the “No
11
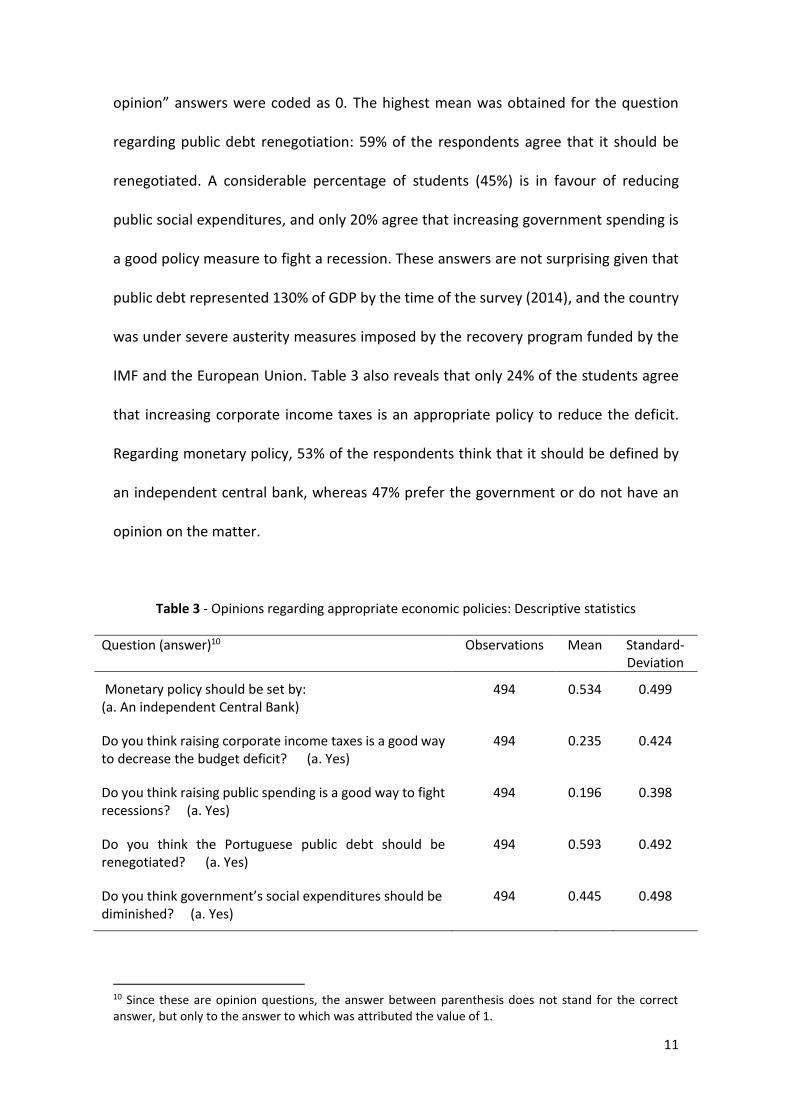
opinion” answers were coded as 0. The highest mean was obtained for the question
regarding public debt renegotiation: 59% of the respondents agree that it should be
renegotiated. A considerable percentage of students (45%) is in favour of reducing
public social expenditures, and only 20% agree that increasing government spending is
a good policy measure to fight a recession. These answers are not surprising given that
public debt represented 130% of GDP by the time of the survey (2014), and the country
was under severe austerity measures imposed by the recovery program funded by the
IMF and the European Union. Table 3 also reveals that only 24% of the students agree
that increasing corporate income taxes is an appropriate policy to reduce the deficit.
Regarding monetary policy, 53% of the respondents think that it should be defined by
an independent central bank, whereas 47% prefer the government or do not have an
opinion on the matter.
Table 3 - Opinions regarding appropriate economic policies: Descriptive statistics
Question (answer)10 Observations Mean Standard-Deviation
Monetary policy should be set by: (a. An independent Central Bank)
494 0.534 0.499
Do you think raising corporate income taxes is a good way to decrease the budget deficit? (a. Yes)
494 0.235 0.424
Do you think raising public spending is a good way to fight recessions? (a. Yes)
494 0.196 0.398
Do you think the Portuguese public debt should be renegotiated? (a. Yes)
494 0.593 0.492
Do you think government’s social expenditures should be diminished? (a. Yes)
494 0.445 0.498
10 Since these are opinion questions, the answer between parenthesis does not stand for the correct answer, but only to the answer to which was attributed the value of 1.

12
The survey also intended to capture students’ knowledge about the country’s
economic performance. Based on answers to questions 6 to 17 of section B of the
survey, 12 dummy variables were created that take the value of one when the student
answered the question correctly, and zero otherwise. To measure what students know
about the Portuguese economy (Knowledge_Country_Econ) a sum score was computed
that equals the sum of correct answers that each student gave. The descriptive statistics
of these variables are reported in Table 4. For each variable 494 observations are
available. The two questions with the highest percentage of correct answers refer to the
evolution of the number of full-time jobs (89%) and the unemployment rate (77%), in
the last six years. Most of the respondents (51%) also answered correctly the question
about the value of the unemployment rate. Therefore, students show better knowledge
about the Portuguese economy on issues related to employment, which probably has
to do with the fact that unemployment was abnormally high, and one of the most
covered topics by the media. On the other extreme, questions related to the inflation
rate and the GDP growth rate were the ones with the highest percentage of incorrect
answers. The mean value of Knowledge_Country_Econ is 4.77, which means that, on
average, each student gave less than five correct answers to the 12 questions included
in the measure.

13
Table 4 – Knowledge about the country’s economic performance: Descriptive statistics
Question (correct answer) Mean Stand. Dev.
In which interval are the forecasts for the Portuguese deficit in 2014? (c.4% to 4.9% of the GDP)
0.362 0.481
What is the approximate value of the Portuguese unemployment rate (value for the 4th quarter of 2014)? (c.13.5%)
0.506 0.500
In comparison to 2008, the Portuguese unemployment rate is (c. Higher) 0.771 0.420
In the last six years, the number of full-time jobs in Portugal has (a. Decreased)
0.889 0.315
What is the estimated value for the Portuguese inflation rate in 2014? (c. -0.3%)
0.184 0.388
In comparison with 2008, the Portuguese inflation rate is now: (a. Lower) 0.215 0.411
What is the approximate value of public revenue as a percentage of GDP in Portugal (value for the end of 2013)? (b.43.7%)
0.360 0.481
What is the approximate value of public spending as a percentage of GDP in Portugal (value for the end of 2013)? (c.48.7%)
0.302 0.459
What is the approximate value for the Portuguese GDP growth rate in 2013? (a.-1.4%)
0.097 0.296
What is the approximate value of the Portuguese public debt as a percentage of GDP (value for the end of 2013)? (c.129%)
0.407 0.492
What is the approximate value of interest payments on government debt as a percentage of GDP in Portugal (estimated value for 2014)? (c.5%)
0.332 0.471
What is the approximate value of social expenditure as a percentage of GDP in Portugal (estimated value for 2014)? (b.19.5%)
0.339 0.474
Knowledge of the Country’s Economic Performance Sum Score (Knowledge_Country_Econ)
4.765 1.751
Finally, the survey also included questions to capture the students’ socio-
economic and demographic features, their political values and the amount of economic
training (economic courses) taken. Based on the answers to the first group of questions,
eight variables were constructed. Age represents the age of the student. Male and
Worker are dummy variables that, respectively, identify males and students who work
while in college. Year indicates the year of the undergraduate program in which the
student is. Admission_grade is the admission grade to university, while

14
Average_grade_university is the average grade in university courses. Family_Income,
measure the family’s income.11
To characterize students politically three variables were constructed. Voter is a
dummy variable that equals one if the student participated in all legislative and
presidential elections since the age of 18 years old, and zero otherwise. Ideology is a
categorical variable that represents the students’ position in the political spectrum,
where one corresponds to the extreme left and six to the extreme right. Finally, Political
is a dummy that identifies students who were able to position themselves politically. To
measure training in Economics acquired by students, five variables were created (these
are our treatment variables): a discrete variable (ECTS) that quantifies the number of
ECTS accumulated in Economics courses, and four dummies that capture the kind of
training in Economics students have. Economics identifies students from the Economics
undergraduate degree. SEM is equal to one when the student is from an undergraduate
degree that is not in Economics but is administered by the School of Economics and
Management (SEM).12 Freq_Eco assumes the value of one when the student is from an
undergraduate degree that is not administered by the SEM but has at least one course
that is taught by the Department of Economics. Finally, High_School equals one if the
student was enrolled in the social science track in economics in high school.
Table 5 contains the descriptive statistics for the three groups of variables
previously described. 32% of the students who participated in the survey are enrolled in
11 Information related with mother and father’s education were also collected, but such variables were not considered, because they were never statistically significant in the regressions. 12 Accounting, Management and Political Science are the other courses held by the School of Economics
and Management that are considered in this study.

15
the undergraduate degree in Economics, 29% in programs administered by the SEM, 9%
in programs that have at least one course in Economics but are not run by the SEM, and
the remaining 30% have no university courses in Economics. 26% of students attended
the social science track in Economics in high school. The average age of the students
analysed is 20.6, 34% are male and 11% work. Their average admission grade to the
university was higher (15.8 over 20) than their average grade in university courses (13.6
over 20). The average family gross monthly income is between 1001 and 1500 euros.
The majority of students (67%) voted in all presidential and legislative elections since
they were allowed to do so, and was able to position itself politically (55%). On a scale
of 1 to 6, the average ideological position of students is 3.7 which is very close to the
median value.
Table 5 - Socio-economic, political and treatment variables: Descriptive Statistics
Variable Observations Mean Stand. Dev. Min. Max.
Year 493 2.207 0.750 1 5
Age 494 20.571 4.413 17 56
Male 494 0.340 0.474 0 1
Worker 494 0.111 0.315 0 1
Admission_grade 463 15.868 1.489 10 20
Average_grade_University 378 13.598 1.544 10 18
Family_income 445 3.072 1.370 1 6
Voter 483 0.671 0.470 0 1
Political 492 0.545 0.499 0 1
Ideology 271 3.668 1.280 1 6
Left 494 0.235 0.424 0 1

16
ECTS 493 24.775 30.953 0 96
Economics 494 0.320 0.467 0 1
SEM 494 0.287 0.453 0 1
Freq_Eco 494 0.091 0.288 0 1
High_school 493 0.260 0.439 0 1
4. Results
The empirical analysis has three parts. The first examines the determinants of economic
literacy. The second focuses on students’ knowledge about the country’s economic
performance, and the third on their opinions on economic policy issues.
4.1. Economic literacy
To investigate the factors influencing students’ economic literacy, the following
model was estimated:
Eco_Literacyi = β0 + β1Socio-Demogi + β2Politicali + β3Treatmenti + ei, (1)
where Eco_Literacy represents the sum score of economic literacy of student i; Socio-
demog and Political are, respectively, vectors of socio-demographic and of political
variables characterizing the student; Treatment is a vector of variables representing the
type of training in Economics each individual has. The variables included in each of these
vectors were described in the previous section. β0 is a parameter to be estimated; β1,
β2, and β3, are vectors of parameters to be estimated; and finally, ei is the error term.
We started by estimating the model by Ordinary Least Squares, and then by the
Tobit model because the dependent variable is bounded between 0 and 10. The
17
estimation results are presented in Table 6.13 Robust standard-errors that correct for
heteroscedasticity are reported, and there is no suspicion of multicollinearity problems
since the correlations between the independent variables are very low. As can be seen
from the table, the results for the OLS and Tobit models are quite similar, with the main
difference being that the variable Age turns out to be statistically significant in the Tobit
models, but not in the OLS. Given that the Tobit model is more appropriate, we focus on
the Tobit estimations reported in columns 3 and 4 when interpreting the results.
As can be seen from column 3, two of the dummies that specify students’ training
in Economics at the university are highly statistically significant. Relative to the students
who did not study Economics at all, those enrolled in the Economics degree have, on
average, and keeping everything else constant, a score that is approximately 1.6 units
higher in the Economic Literacy sum score. Compared to the same group, the score of
students from the School of Economics and Management (but not from Economics) is
approximately 1.2 units higher. A Wald test for the equality of the estimated coefficients
for the variables Economics and SEM does not allow us to reject the hypothesis that they
are equal. This result is not surprising since we are defining economic literacy as
knowledge in basic economic theory. Students enrolled in programs that are not
administered by the School of Economics and Management, but who have had at least
one economics course performed similarly to those who had no economics courses at
all. However, having been enrolled in the social science track in economic in high school
13 The variable related to the year in the academic program in which the student is enrolled was excluded
from the regression since it did not reveal to be statistically significant.

18
(High_School) seems to have a significant impact on the economic literacy of
undergraduate students.
Table 6 - Determinants of economic literacy
Variables
OLS (1)
OLS (2)
Tobit (3)
Tobit (4)
Tobit (5)
Tobit (6)
Male 0.670*** 0.739*** 0.884*** 0.960*** 0.801*** 0.876*** (4.025) (4.508) (4.436) (4.929) (4.114) (4.563) Age 0.0395 0.0241 0.0618** 0.0393 0.167*** 0.119*** (1.368) (0.843) (2.466) (1.635) (4.388) (3.193) Worker -0.401 -0.229 -0.518* -0.321 -0.853*** -0.607* (-1.416) (-0.757) (-1.667) (-1.055) (-2.678) (-1.916) Admission_Grade 0.116** 0.0856* 0.134** 0.107* 0.147** 0.124** (2.370) (1.883) (2.115) (1.817) (2.370) (2.143) Family_Income 0.127** 0.120** 0.142** 0.140** 0.115* 0.118* (2.061) (2.045) (2.098) (2.122) (1.722) (1.807) Voter 0.467** 0.415** 0.507*** 0.441** 0.497*** 0.446** (2.584) (2.347) (2.617) (2.319) (2.608) (2.375) Left 0.481*** 0.565*** 0.593*** 0.688*** 0.620*** 0.691*** (3.096) (3.597) (2.715) (3.213) (2.881) (3.266) Economics 1.589*** 1.856*** 1.900*** (6.941) (7.464) (7.779) SEM 1.160*** 1.208*** 1.249*** (5.392) (4.924) (5.206) Freq_Eco 0.379 0.408 0.631* (1.103) (1.175) (1.841) High_School 1.130*** 1.078*** 1.478*** 1.411*** 1.523*** 1.450*** (6.029) (5.809) (6.392) (6.326) (6.721) (6.563) 6_10_or_12ECTS 0.688*** 0.723*** 0.856*** (3.223) (3.236) (3.845) At_least_24ECTS 1.791*** 2.026*** 1.993*** (8.513) (8.597) (8.597)
N. Observations 413 413 413 413 409 409 Adj. R-squared 0.368 0.395 LR (chi2) 216.9 232.4 224.7 234.7
Notes: All regressions include a constant. Robust t-statistics in parentheses. Statistical
significance: *** p<0.01, ** p<0.05, * p<0.1.
To have treatment variables that more accurately measure the training in
economics of each individual, dummy variables based on the number of accumulated
ECTS in economics courses by the students were constructed. Using information on ECTS

19
in economics courses is innovative since all previous studies (Walstad and Soper, 1988;
Walstad, 1997; Walstad and Allgood, 1999; Walstad and Rebeck, 2002) used dummies
for the program in which students were enrolled. Because in our sample the number of
ECTS in economics that students have only assumed seven values (0, 6, 10, 12, 24, 60,
or 96) the variable cannot be treated as continuous. We started by creating dummies
for each value of the ECTS. Wald tests did not allow us to reject the hypotheses that the
estimated coefficients for the dummies corresponding to 6, 10 and 12 ECTS were equal,
nor that the estimated coefficients for 24, 60 and 96 ECTS were equal. Taking these
results into account, and the fact that a typical one-semester course in economics has 6
ECTS, two dummy variables were created for students who have had two or fewer
courses in economics (6_10_or_12ECTS) and students who have had at least four
courses in economics, which corresponds to at least 24 ECTS (at_least_24ECTS). The
results shown in column four reveal that there is quite a large and statistically significant
difference between the economic literacy of students who accumulated 6, 10 or 12
(equivalent to two one-semester courses) ECTS in economics courses and those who did
not study economics in college at all. An even larger difference was found between the
latter and the individuals who have at least 24 ECTS in economics courses (equivalent to
four one-semester courses). Having 6, 10 or 12 ECTS of economics is associated with
approximately 1.1 points more in the economic literacy sum score, while having at least
24 ECTS increases the score by approximately 1.8 units. As in column 3, the estimated
sign for the dummy identifying individuals who were enrolled in the social sciences track
in economics in high school is positive and highly statistically significant.
Among the socio-demographic and political variables, the results reveal that
male students perform significantly better than female students, with an estimated

20
impact of nearly one point. Age seems to exert a positive influence, although its
magnitude is quite small, and the variable only turned out to be statistically significant
in column 3. There is marginal evidence (column 3) that working negatively affects the
economic literacy of undergraduate students. Additionally, students who have a higher
admission grade to the university, a higher family income, who always voted since they
were legally allowed to do so, and who identified themselves as being left-wing
oriented14 also performed better in the economic literacy test.
As a robustness test, since the range of students’ ages spans from 17 to 56, we
decided to remove from the sample students over 44 years of age.15 There are only four
students in this situation (aged 50, 53 or 56), representing around 1% of the total
sample. Results, reported in columns 5 and 6, reveal that the variable age is now highly
statistically significant and with a larger estimated coefficient. One additional year of
age is estimated to increase the economic literacy of students by 0.1. There is also
stronger evidence that working students perform worse in the test. The coefficients
associated with the remaining variables kept their sign and statistically significance.
14 Left equals one for respondents who chose values of 1, 2 or 3 in the ideological scale.
15 As an additional robustness test, the model was also estimated with age squared as an explanatory
variable. However, this variable did not turn out to be statistically significant.

21
4.2. Students’ knowledge of the country’s economic performance
To analyse students’ knowledge about the country’s economic performance a
model similar to equation (1) was estimated, but now the dependent variable is the sum
of correct answers that each student gave to questions 6 to 17 included in section B of
the survey (Knowledge_Country_Econi).
Knowledge_Country_Econi= β0 + β1Socio-Demogi + β2Politicali + β3Treatmenti + ei, (2)
As before, the model was estimated by the OLS and Tobit models, where the
lower and the upper limits correspond to the minimum and the maximum value of the
sum score (zero and twelve). Table 7 contains the results for the Tobit models that
include dummies for the type of program that students are enrolled in as explanatory
variables (columns 1 and 3) and for models including a dummy for students who
completed at least 96 ECTS in economics courses (columns 2 and 4). This dummy was
created because Wald tests revealed a significant difference between students who
accumulated 96 ECTS in economics courses and those who did not, and there were no
statistically significant differences among all other ECTS categories. This result implies
that, while a relatively small number of economics courses has an impact on individuals’
basic economic literacy, a larger number of courses is necessary to improve students’
knowledge about the country’s economic performance. Except for the 96ECTS variable,
all remaining variables included in columns 1 and 2 are the same as in Table 6. However,
since the Left variable turned out never to be statistically significant, a dummy variable
for students who were able to position themselves in the political scale (Political) was
included in columns 4 and 5.

22
Table 7 - Determinants of knowledge of the country’s economic performance
Tobit Tobit Tobit Tobit Variables (1) (2) (3) (4)
Male 0.358* 0.408** 0.327* 0.370** (1.939) (2.211) (1.780) (2.010) Age 0.102*** 0.0963*** 0.103*** 0.0950*** (4.689) (4.429) (3.033) (2.805) Worker -0.237 -0.195 -0.166 -0.117 (-0.820) (-0.674) (-0.543) (-0.382) Admission_Grade 0.107* 0.0867 0.102* 0.0819 (1.788) (1.530) (1.710) (1.444) Family_Income -0.0461 -0.0458 -0.0359 -0.0366 (-0.737) (-0.735) (-0.569) (-0.585) Voter -0.182 -0.185 -0.214 -0.215 (-0.998) (-1.016) (-1.172) (-1.178) Left 0.295 0.271 (1.465) (1.354) Political 0.317* 0.294* (1.822) (1.691) Economics 0.363 0.343 (1.563) (1.483) SEM 0.226 0.199 (0.976) (0.865) Freq_Eco -0.245 -0.359 (-0.742) (-1.078) High_School 0.246 0.373* 0.262 0.387** (1.163) (1.929) (1.243) (2.010) 96ECTS 0.559** 0.555** (1.999) (1.988)
N. Observations 411 411 411 411 LR (chi2) 42.87 42.70 44.90 44.05
Notes: All regressions include a constant. Robust t-statistics in parentheses. Statistical
significance: *** p<0.01, ** p<0.05, * p<0.1.
As can be seen from Table 7, individuals who completed at least 96 ECTS in
Economics know more about the Portuguese economy than those who did not. In the
models where we use dummies for the type of undergraduate program of the student
(columns 1 and 3), the null hypothesis of no effect can never be rejected. The
High_School dummy is positively signed and statistically significant in estimations (2)
and (4). Among the socio-demographic variables, gender and age exert the strongest
impact with an estimated coefficient of around 0.3 and 0.1, respectively. There is

23
marginal evidence (columns 1 and 3) that higher admission grades to the university are
positively associated with knowledge about the country’s economic performance.16
Finally, results suggest that although being left or right-wing oriented does not influence
students’ knowledge of the Portuguese economy, being able to position themselves in
the ideological scale exerts a marginally positive effect.
To deepen the analysis, probit models were estimated for each of the twelve
dummies used to measure students’ knowledge about the country’s economic
performance.17 The results revealed that studying economics exerts a bigger positive
effect on the probability of correctly answering the two questions related to the inflation
rate and the value of the deficit. More precisely, having completed 96 ECTS in economics
courses makes it more likely to know the value of the deficit, and the inflation rate, as
well as whether the latter was higher or lower than in 2008. The dummy for Economics
also turned out to be statistically significant for the questions about the inflation rate. It
is interesting to recall (Table 4) that only a small percentage of students gave correct
answers to these two questions.
4.3. Students’ opinion on economic policy issues
In this section, we estimate probit models to assess which variables explain
students’ answers to five questions related to economic policy decisions. Data on
questions 1 to 5 of section B in the survey were used to construct the dependent
16 As before, we also included age squared as an explanatory variable, but it turned out not to be
statistically significant. The results reported in Table 6 are also robust to the exclusion of the oldest
students.
17 The results are not reported but are available from the authors upon request.
24
variables. As explained in section III, a value of one was attributed to the answers of
students who agreed that: (1) monetary policy should be set by an independent central
bank, (2) raising corporate income taxes is a good policy to reduce the deficit, (3)
increases in public spending should be used to fight recessions, (4) the Portuguese public
debt should be renegotiated, and (5) government’s social expenditures ought to be
decreased. The estimated models can be described as follows:
Opinioni = β0 + β1Socio-Demogi + β2Politicali + β3Treatmenti + ei, (3)
where Opinion is the dummy variable representing each of the five questions.
Table 8 shows the results for the estimated models.18 Column 1 reveals that
students enrolled in the economics degree or other undergraduate program
administered by the School of Economics and Management have a higher probability of
agreeing that monetary policy should be set an independent central bank. The
estimated impacts are of 24 and 20 percentage points, respectively.19 This is not
surprising since monetary policy is a topic that is covered in most economics courses but
is somewhat unknown to other people. There is also evidence that male and older
students20 are more in favour of having monetary policy defined by an independent
18 No opinion answers were coded as 0. As a robustness test, we also estimated regressions with the no
opinion answers coded as missing values. The results were identical.
19 Alternatively, when using dummies for the number of ECTS in Economics, the results revealed that
having completed until 12 ECTS increases the probability of agreeing that monetary policy should be
conducted by an independent central bank by 13 percentage points, while having completed 24 ECTS or
more is associated to an increase of 28 percentage points of the same probability.
20 Excluding the oldest students, as in Table 6, does not change the results reported in Table 8 for variables
other than Age.

25
central bank. Regarding increases in corporate income taxes as a solution to reduce the
deficit (column 2), only age turned out to be statistically significant. Older students are
less inclined to agree with this measure. We did not anticipate that training in Economics
would influence students’ opinions on the possibility of raising corporate income taxes
to improve the fiscal performance of the country since this is not a consensual policy
measure among economists.
Table 8 – Determinants of students’ opinions on economic policy issues
Independent Central Bank
More corp. taxes / deficit
Pub. expend. / recession
Debt renegot.
Less social expend.
Variables (1) (2) (3) (4) (5)
Male 0.139*** 0.020 0.105*** 0.003 -0.052 (2.740) (0.431) (2.708) (0.048) (-0.997) Age 0.022** -0.009* 0.003 -0.002 -0.005 (2.205) (-1.820) (0.746) (-0.403) (-0.758) Worker 0.099 -0.036 -0.035 0.031 0.110 (1.179) (-0.532) (-0.501) (0.391) (1.343) Admission_grade 0.003 -0.012 -0.011 -0.021 -0.050*** (0.157) (-0.835) (-0.805) (-1.188) (-2.947) Family_income -0.014 -0.019 0.008 0.000 0.017 (-0.767) (-1.220) (0.623) (0.005) (0.972) Voter 0.025 0.055 -0.005 0.003 0.051 (0.487) (1.255) (-0.131) (0.049) (0.984) Left 0.037 -0.072 0.082* 0.150** -0.096* (0.662) (-1.402) (1.954) (2.565) (-1.711) Economics 0.240*** 0.016 0.184*** -0.047 -0.050 (3.832) (0.279) (3.531) (-0.719) (-0.756) SEM 0.196*** 0.052 0.042 -0.083 0.039 (3.136) (0.930) (0.749) (-1.262) (0.597) Freq_Eco 0.088 -0.090 0.190*** 0.088 -0.183* (0.956) (-0.979) (2.683) (0.896) (-1.887) High_School 0.026 0.067 0.004 0.039 -0.072 (0.438) (1.360) (0.090) (0.644) (-1.216)
N. Observations 413 413 413 413 413 Pseudo R2 0.075 0.033 0.087 0.021 0.049 LR (chi2) 42.74 14.53 34.93 11.68 28.04 Akaike’s criteria 550.11 452.50 392.23 570.42 564.02 Bayesian criteria 598.39 500.78 440.51 618.70 612.30
Notes: Probit regressions including a constant. Robust z-statistics in parentheses. Statistical
significance: *** p<0.01, ** p<0.05, * p<0.1.
26
As can be seen from column 3, being enrolled in the economics undergraduate
program significantly augments (by around 18 percentage points) the probability of
thinking that increasing government spending is a good way to fight recessions.21 As for
monetary policy, this result comes as no surprise since the Keynesian theory is taught in
most economics courses at the university level. There is also evidence that being male,
left-wing politically oriented,22 or a student enrolled in a degree not administered by the
School of Economics and Management, but with some economics courses positively
influences the probability of agreeing with the appropriateness of this policy. Regarding
public debt renegotiation (column 4), the results revealed that being left-wing politically
oriented was associated with an increased probability of approximately 15 percentage
points of being favourable to the renegotiation. Training in Economics does not seem to
influence students’ opinions on this matter.
Finally, when analysing support for government social expenditure cuts (column
5), the results indicate that students who have a higher admission grade to the
university, are left-wing oriented or are enrolled in degrees not administered by the
School of Economics and Management but with some economics courses have a lower
probability of agreeing with such a measure.23
21 Alternatively, when using dummies for the number of ECTS in economics, the results indicated that
having completed 24 or more ECTS in economics increases the probability of agreeing with this economic
policy.
22 The dummy for students who positioned themselves in the ideological scale (Political) was also included
in the models reported in Table 7, but never turned out to be statistically significant.
23 When coding the no opinion answers as missing values, there is there is marginal evidence that those
who voted in all previous elections and work are more likely to support reductions in social spending.

27
5. Conclusion
A survey was administered to students of the University of Minho in Portugal to
investigate the factors that influence economic literacy, knowledge about the country’s
economic performance, and opinions regarding economic policies. The results revealed
that economic literacy is positively influenced by studying economics at the university
level, no matter if we use dummies for the type of degree in which the student is
enrolled or for the number of ECTS in economics courses that she has completed. When
the study of economics is more intense at the college level (reaching 96 ECTS), it is also
associated with more knowledge about the country’s economic performance.
Combining the previous results with the low average score achieved by the
students on the questions intended to measure knowledge of the country’s economic
performance (4.8 over 12), we argue that additional courses in economics, both in high
school and in college, are necessary. They would contribute to a more knowledgeable
and better-informed society on economic issues and, therefore, improve people’s
capacity to make personal and social decisions. This is particularly important in periods
of crises (such as the one Portugal recently underwent) when governments are forced
to adopt unpopular austerity measures.
Regarding the factors that influence opinions on how to conduct economic
policy, our results reveal that students enrolled in the economics degree have a higher
probability of agreeing that monetary policy should be set by an independent central
bank, and that increasing government spending is an appropriate response to a
recession. Both results are in line with what is taught in Economics’ courses. However,
no effect was found on the opinions about issues that are more specific of the
Portuguese context, such as the debt renegotiation or the reduction of governmental
28
social expenditures, and that are also more controversial among economists. These
results reinforce previous studies (e.g. Allgood and Walstad, 1999) that found that
individuals are more likely to share the views of economists when they have economics
education.
Although we are aware of the limitations of the present study (namely in terms
of representativeness of the sample to the whole Portuguese population), we hope our
analysis will stress the need to include additional courses in economics, both at the high
school and college levels. Given the scarcity of research on these topics in Portugal, and
the importance they may have for the future of a country that recently underwent a
major economic crisis, we think that these topics deserve a more detailed analysis.
Acknowledgements
The authors thank the very useful comments of João C. Silva. This paper is a result of the
project “SmartEGOV: Harnessing EGOV for Smart Governance (Foundations, methods,
Tools) / NORTE-01-0145-FEDER-000037”, supported by Norte Portugal Regional
Operational Programme (NORTE 2020), under the PORTUGAL 2020 Partnership
Agreement, through the European Regional Development Fund (EFDR). This paper was
also financed by National Funds of the FCT — Portuguese Foundation for Science and
Technology within the project "UID/ECO/03182/2019".

29
Bibliography
Allgood, S. and Walstad, W. B. (1999). “The longitudinal effects of economic education
on teachers and their students”, The journal of economic education, 30(2), 99-111.
Bach, G. L. and Saunders, P. (1965), “Economic Education: Aspirations and
Achievements”, American Economic Review, 55: 329-356.
Bach, G. L. and Saunders, P. (1966), “Lasting Effects of Economics Courses at Different
Types of Institutions”, American Economic Review, 56: 505-511.
Blendon, R.; Benson, J.; Brodie, M.; Morin, R.; Altman, D.; Gitterman, D.; Brossard, M.
and James, M. (1997), “Bridging the Gap Between the Public’s and Economists
views of the Economy”, Journal of Economic Perspectives, 11: 105-118.
Blinder, A. and Krueger, A. (2004), “What Does the Public Know about Economic Policy,
and How Does It Know It?”, Brookings Papers on Economic Activity, 1: 327-387.
Borg, M. O.; Stranahan, H. (2002), “The effects of gender and race on student
performance in principles of economics: the importance of personality type”,
Applied Economics, 34:589-598.
Brückner, S.; Förster, M.; Zlatkin-Troitschanskaia, O. and Walstad, W. (2015 a), “Effects
of prior economic education, native language, and gender on economic knowledge
of first-year students in higher education. A comparative study between Germany
and the USA”, Studies in Higher Education, 40(3), 437-453.
Brückner, S.; Förster, M.; Zlatkin-Troitschanskaia, O.; Happ, R.; Walstad, W.; Yamaoka,
M. and Asano, T. (2015 b), “Gender Effects in Assessment of Economic Knowledge
and Understanding: Differences Among Undergraduate Business and Economics
Students in Germany, Japan, and the United States”, Peabody Journal of
Education, 90(4): 503-518.

30
Burke, M. and Manz, M. (2014), “Economic Literacy and Inflation Expectations: Evidence
from a Laboratory Experiment”, Journal of Money, Credit and Banking, 46(7):
1421-1456.
Caplan, B. (2002), “Systematically Biased Beliefs about Economics: Robust Evidence of
Judgmental Anomalies from the Survey of Americans and Economists on the
Economy”, Economic Journal, 112: 433-458.
Gleason, J. and Scyoc, J. (1995), “A Report on the Economic Literacy of Adults”, Journal
of Economic Education, 26(3): 203-210
Hopkins, D. (2012), “Whose Economy? Perceptions of National Economic Performance
During Unequal Growth”, Public Opinion Quarterly, 76: 50-71.
Jappelli, T. (2010), “Economic Literacy: An International Comparison”, Economic Journal,
120: 429-451.
Roos, M. (2007) “Nonexpert Beliefs About the Macroeconomic Consequences of
Economic and Noneconomic Events”, Public Choice, 132: 291-304.
Stigler, G. J. (1963), “Elementary Economic Education”, American Economic Review, 53:
653-659.
Varum, C.; Santos, E. and Afreixo, V. (2014). “Recent trends and new evidence in
economics literacy among adults”, Journal of Economics and Economic Education
Research, 15(2), 187-205.
Walstad, W. (1997), “The Effect of Economic Knowledge on Public Opinion of Economic
Issues”, Journal of Economic Education, 28: 195-205.
Walstad, W. (2013), “Economic Understanding in US High School Courses”, American
Economic Review, 103(3): 659-663

31
Walstad, W. and Allgood, S. (1999), “What do College Seniors Know About Economics?”,
American Economic Review, 89: 350-354.
Walstad, W. and Rebeck, K. (2001), “Assessing the Economic Understanding of US High
School Students”, American Economic Review, 91(2): 452-457.
Walstad, W. and Rebeck, K. (2002), “Assessing the Economic Knowledge and Economic
Opinions of Adults”, Quarterly Review of Economics and Finance, 42: 921-935.
Walstad, W. and Rebeck, K. (2008), “The Test of Understanding of College Economics”,
American Economic Review 98(2): 547-551
Walstad, W., Rebeck, K. and Butters, R. (2013), “The Test of Economic Literacy:
Development and Results”, Journal of Economic Education, 44(3): 298-309
Walstad, W. and Soper, J. (1988), “A Report Card on the Economic Literacy of US High
School Students”, American Economic Review, 78: 251-256.
Wood, W. and Doyle, J. (2002), “Economic Literacy Among Corporate Employees”,
Journal of Economic Education, 33(3): 195-205.
Most Recent Working Paper
NIPE WP
15/2019
João Martins and Linda G. Veiga, “Undergraduate students’ economic literacy, knowledge of
the country’s economic performance and opinions regarding appropriate economic policies”, 2019
NIPE WP
14/2019
Natália P. Monteiro, Odd Rune Straume and Marieta Valente, “Does remote work improve or
impair firm labour productivity? Longitudinal evidence from Portugal”, 2019
NIPE WP
13/2019
Luís Aguiar-Conraria, Manuel M. F. Martins and Maria Joana Soares, “ Okun’s Law Across
Time and Frequencies”, 2019
NIPE WP
12/2019
Bohn, F., and Veiga, F. J., “Political Budget Forecast Cycles”, 2019
NIPE WP
11/2019
Ojo, M. O., Aguiar-Conraria, L. and Soares, M. J., “A Time-Frequency Analysis of Sovereign
Debt Contagion in Europe”, 2019
NIPE WP
10/2019
Lommerud, K. E., Meland, F. and Straume, O. R., “International outsourcing and trade union
(de-) centralization”, 2019
NIPE WP
09/2019
Carvalho, Margarita and João Cerejeira, “Level Leverage decisions and manager
characteristics”,2019
NIPE WP
08/2019
Carvalho, Margarita and João Cerejeira, “Financialization, Corporate Governance and
Employee Pay: A Firm Level Analysis”, 2019
NIPE WP
07/2019
Carvalho, Margarita and João Cerejeira, “Mergers and Acquisitions and wage effects in the
Portuguese banking sector”, 2019
NIPE WP
06/2019
Bisceglia, Michele, Roberto Cellini, Luigi Siciliani and Odd Rune Straume, “Optimal
dynamic volume-based price regulation”, 2019
NIPE WP
05/2019
Hélia Costa and Linda Veiga, “Local labor impact of wind energy investment: an analysis of
Portuguese municipalities”, 2019
NIPE WP
04/2019
Luís Aguiar-Conraria, Manuel M. F. Martins and Maria Joana Soares, “ The Phillips Curve at
60: time for time and frequency”, 2019
NIPE WP
03/2019
Luís Aguiar-Conraria, Pedro C. Magalhães and Christoph A. Vanberg, "What are the best
quorum rules? A Laboratory Investigation", 2019
NIPE WP
02/2019
Ghandour, Ziad R., "Public-Private Competition in Regulated Markets", 2019
NIPE WP
01/2019
Alexandre, Fernando, Pedro Bação and Miguel Portela, "A flatter life-cycle consumption
profile", 2019
NIPE WP
21/2018
Veiga, Linda, Georgios Efthyvoulou and Atsuyoshi Morozumi, "Political Budget Cycles:
Conditioning Factors and New Evidence", 2018
NIPE WP
20/2018
Sá, Luís, Luigi Siciliani e Odd Rune Straume, "Dynamic Hospital Competition Under Rationing
by Waiting Times", 2018
NIPE WP
19/2018
Brekke, Kurt R., Chiara Canta, Luigi Siciliani and Odd Rune Straume, "Hospital Competition in
the National Health Service: Evidence from a Patient Choice Reform", 2018
NIPE WP
18/2018
Paulo Soares Esteves, Miguel Portela and António Rua, "Does domestic demand matter for
firms' exports?", 2018
NIPE WP
17/2018
Alexandre, Fernando, Hélder Costa, Miguel Portela and Miguel Rodrigues, "Asymmetric
regional dynamics: from bust to recovery", 2018
NIPE WP
16/2018
Sochirca, Elena and Pedro Cunha Neves, "Optimal policies, middle class development and
human capital accumulation under elite rivalry", 2018
NIPE WP
15/2018
Vítor Castro and Rodrigo Martins, “Economic and political drivers of the duration of credit
booms”, 2018
NIPE WP
14/2018
Arash Rezazadeh and Ana Carvalho, “Towards a survival capabilities framework: Lessons
from the Portuguese Textile and Clothing industry”, 2018
NIPE WP
13/2018
Areal, Nelson and Ana Carvalho, “Shoot-at-will: the effect of mass-shootings on US small gun
manufacturers”, 2018
NIPE WP
12/2018
Rezazadeh, Arash and Ana Carvalho, “A value-based approach to business model innovation:
Defining the elements of the concept”, 2018
NIPE WP
11/2018
Carvalho, Ana and Joaquim Silva, “The Work Preferences of Portuguese Millennials - a
Survey of University Students”, 2018