economic re-integration of returning migrants in …
TRANSCRIPT
ECONOMIC RE-INTEGRATION OF RETURNING MIGRANTS IN THE CONSTRUCTION SECTOR IN INDIAAVINASH KUMAR
Japan Fund for Building Social Safety Nets
in Asia and the Pacifi c (SSN Fund)


Economic Re-integration of Returning Migrants in the Construction Sector in IndiaAvinash Kumar

Copyright © International Labour Organization 2018First published 2018
Publications of the International Labour Of ce enjoy copyright under Protocol 2 of the Universal Copyright Convention. Nevertheless, short excerpts from them may be reproduced without authorization, on condition that the source is indicated. For rights of reproduction or translation, application should be made to ILO Publications (Rights and Licensing), International Labour Of ce, CH-1211 Geneva 22, Switzerland, or by email: [email protected]. The International Labour Of ce welcomes such applications.
Libraries, institutions and other users registered with a reproduction rights organization may make copies in accordance with the licences issued to them for this purpose. Visit www.ifrro.org to nd the reproduction rights organization in your country.
ISBN 978-92-2-131544-5 (print) 978-92-2-131545-2 (web pdf)
The designations employed in ILO publications, which are in conformity with United Nations practice, and the presentation of material therein do not imply the expression of any opinion whatsoever on the part of the International Labour Of ce concerning the legal status of any country, area or territory or of its authorities, or concerning the delimitation of its frontiers.
The responsibility for opinions expressed in signed articles, studies and other contributions rests solely with their authors, and publication does not constitute an endorsement by the International Labour Of ce of the opinions expressed in them.
Reference to names of rms and commercial products and processes does not imply their endorsement by the International Labour Of ce, and any failure to mention a particular rm, commercial product or process is not a sign of disapproval.
Information on ILO publications and digital products can be found at: www.ilo.org/publns.
All photos: © ILOPrinted in India
iv ECONOMIC RE-INTEGRATION OF RETURNING MIGRANTS IN THE CONSTRUCTION SECTOR IN INDIA
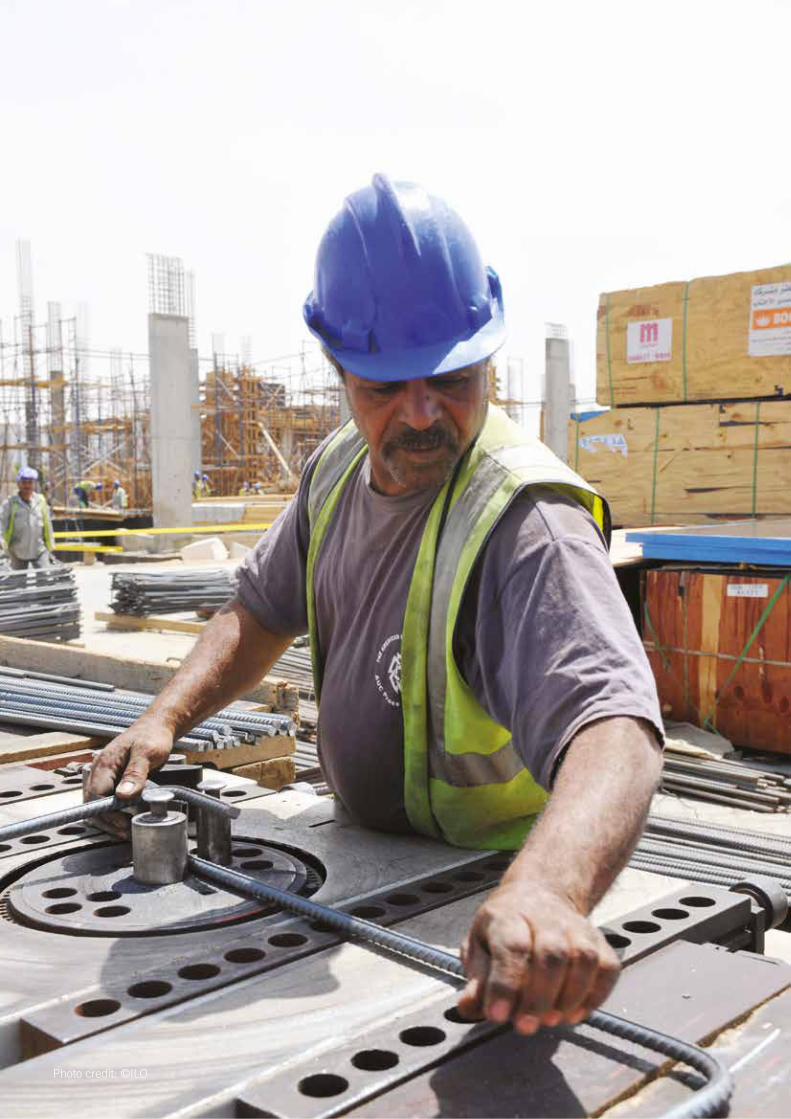
Photo credit: ©ILO

v
Acknowledgments vii
Executive summary ix
List of Abbreviations xiii
Introduction 01
The Construction Industry in India: an overview 03
Reintegration of Returning Migrants from the Gulf: Insights from Field 12
Conclusion and Recommendations 29
References 31
Appendix 33
Contents

vi ECONOMIC RE-INTEGRATION OF RETURNING MIGRANTS IN THE CONSTRUCTION SECTOR IN INDIA
Photo credit: ©ILO

vii
Acknowledgments
The author wishes to sincerely thank all the returning migrants and other respondents who were interviewed during this study, for their contribution to the insights in this report. The Research Coordinator, Dr. Gurepreet Singh, deserves special thanks for his extraordinary commitment to complete the work in time. The author is also indebted to all the Research Assistants - Anjana Rajagopalan, Rakesh Ranjan, Rubina Khaliq, Rajeev Kumar, Amit Kumar, Mohit Awasthi, Jyothi Madana, Mandru Sambasiva Rao, and Sarfaraz Hamid.
The author is thankful to the ILO and the Japan Fund for funding this research. The opinions expressed are the sole responsibility of the author and do not in any way constitute an endorsement by the International Labour Of ce.

viii ECONOMIC RE-INTEGRATION OF RETURNING MIGRANTS IN THE CONSTRUCTION SECTOR IN INDIA
Photo credit: ©ILO
ix
Executive summary
The discourse on labour migration in South Asia two signi cant bene ts of migration for migrants and the countries of origin. First and foremost are the wages earned and the remittances sent home. These are quanti able and unquestionably signi cant. The second bene t relates to the transfer of skills and knowledge, and in this area there is a dearth of information. A better understanding of skills transfer is essential in informing migrants’ individual decision making, as well as government policy at the central and state levels.
This report examines the issue of re-integration of Indian migrants who had been working in the construction industry in the Gulf. The report assesses whether the skills gained through work experience abroad increases the employability of migrants once they return to their home country. It addresses the barriers and challenges that they face when they seek employment in the construction sector in India.
The report looks at the three stages of the migration experience: prior to departure, in destination and return. First, when the workers are looking for an opportunity in the Gulf. This is the stage at which the worker tries to obtain some skills, either through a private vocational training centre or by rst working on a construction site in India. Second, while working abroad, migrants will upgrade their skills. The average period of stay in the Gulf of the respondents interviewed for this study is ve years. Third, when workers return to India and seek employment in India. This report focuses primarily on this stage. The report looks into the employability for returning migrants vis-à-vis internal migrants, their wages and working conditions.
The report also examines how the construction industry in India views returning migrants and whether there is any preference for their skills, knowledge and experience. It also inquires into the associational factors that facilitate the re-integration of returning migrants. It is important to note that the Gulf countries only recruit male workers in the construction sector, and therefore, this study focuses only on men.
Some of the broad conclusions that can be drawn from this study are:• There is no signi cant difference in the availability of work for workers returning from the Gulf and
for internal migrant workers. Both groups face equal levels of under-employment. The level of wages, conditions of work and terms of employment is also the same.
• Most of the returning migrants have to choose between casual labour and self-employment, or remain unemployed.
• There is hardly any change in the amount of regular salary/wage employment before workers migrate to the Gulf and after their return.
• The majority of the returning migrants found employment through informal networks of contractors, family and co-workers. The government plays a minimal role in supporting migrants’ economic reintegration.
• Most of those who are currently self-employed used to be self-employed even before they migrated. They are running micro enterprises (89 per cent are own-account enterprises) that give very low returns.
• Due to uncertainty in the domestic job market, nearly half of the respondents have expressed their desire to re-migrate to the Gulf.

x ECONOMIC RE-INTEGRATION OF RETURNING MIGRANTS IN THE CONSTRUCTION SECTOR IN INDIA
• The study nds that there is hardly any evidence to prove that the construction industry in India values the skills gained by the workers in the Gulf. One of the main reasons for this lack of appreciation is the practice of sub-contracting. There is a complete disconnect between the workers at the bottom of sub-contracting chain and the construction conglomerates at the top. The sub-contractors demonstrate little concern about the skill levels of the workers they recruit.
The study recommends more research and analysis to inform policy on skills and migration, including for women migrants and migrants in other sectors. The current policy discourse in support of circular migration highlights the value of skills learnt in destination as part of the gains that accrue to migrant workers and origin countries. However, this discourse often does not take into account the realities of the domestic labour market. As shown in this study, the full and long-term bene ts of skills development for migrants cannot accrue in the current environment until some of the following measures are taken:
RECOMMENDATIONS FOR THE INDIAN GOVERNMENT AT CENTRAL AND STATE LEVELS: • Collect better data on the skills of migrant workers prior to departure and on return. This will strengthen
understanding of the skills attained by the workers during their time in the Gulf, and facilitate placement into new employment opportunities within India or abroad.
• Invest in public employment services and access to Recognition of Prior Learning (RPL) (skills testing and training) for migrant workers to enable them to nd jobs that take into account their skills - either within the domestic labour market or overseas.
• Engage in a series of dialogues with construction industry associations, throughout the sub-contracting chain, to better understand the decision making around recruitment and employment of skilled workers – and increase opportunities for returning migrants with skills.
• Ensure that investments made into training migrant workers re ect the needs of the country to ensure those workers have longer-term career opportunities (at home or by re-migrating), rather than just being trained for a short-term contract overseas.
• Train returning migrants to be future trainers – within government and private institutions and on site. Returning migrants are more likely to have experience working on more advanced technologies that are increasingly being introduced onto construction sites in India.
• Further study the impact of migration on development, on the individual migrant, their families and communities of origin.
• Through bilateral agreements with countries of destination, call on the employers in destination to issue certi cates of employment highlight the skills level and work tasks.
RECOMMENDATIONS FOR THE CONSTRUCTION INDUSTRY IN INDIA:• Clearly articulate to local and central authorities the skills gaps that exist, so that efforts can be con ned
to have returning migrants ll them. • Register all employees and provide experience certi cate to all employees, specifying the terms of
employment and work accomplished. • Build a culture in which workers’ skills and quality on site is respected• From the highest levels, take on a more active, oversight role in the recruitment of workers. The
sub-contracting chain de-values skills and experience, which has a direct impact on quality, safety and timeliness.

xi
RECOMMENDATIONS FOR TRADE UNIONS AND CIVIL SOCIETY IN INDIA:• Build partnerships amongst themselves to enhance services for migrants at all stages of the migration
cycle. Trade unions should consider expanding membership to construction workers overseas.• Encourage the formation of self-help groups that can also assist with information and support services
in reintegration. • Strengthen dialogue with government of ces at all levels to introduce policy and programmatic
responses around reintegration.

xii ECONOMIC RE-INTEGRATION OF RETURNING MIGRANTS IN THE CONSTRUCTION SECTOR IN INDIA

xiii
List of abbreviationsDLF Delhi Land & Finance
ICDS Integrated Child Development Services
IIT Indian Institute of Technology
ITI Industrial Training Institute
L&T Larsen & Toubro
MGNREGA Mahatma Gandhi National Rural Employment Guarantee Act
NBCC National Buildings Construction Corporation LTD
NCR National Capital Region
NSDC National Skill Development Corporation
NSSO National Sample Survey Of ce
OBC Other Backward Caste
PDS Public distribution system
PMKVY Pradhan Mantri Kaushal Vikas Yojana
SC Scheduled caste
ST Scheduled tribe
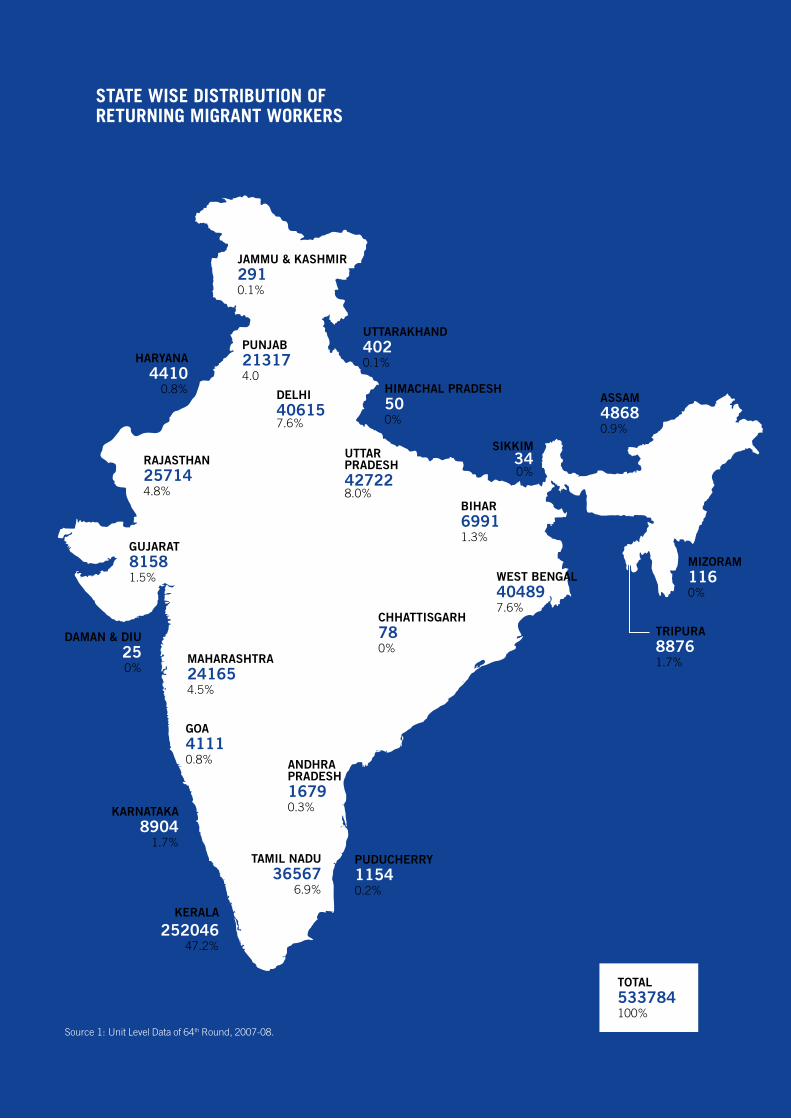
STATE WISE DISTRIBUTION OF RETURNING MIGRANT WORKERS
KERALA
25204647.2%
UTTAR PRADESH427228.0%
DELHI406157.6%
WEST BENGAL404897.6%
TAMIL NADU36567
6.9%
RAJASTHAN257144.8%
MAHARASHTRA241654.5%
PUNJAB213174.0
TRIPURA88761.7%
KARNATAKA8904
1.7%
GUJARAT81581.5%
BIHAR69911.3%
ASSAM48680.9%
HARYANA4410
0.8%
GOA41110.8% ANDHRA
PRADESH16790.3%
PUDUCHERRY 11540.2%
JAMMU & KASHMIR2910.1%
UTTARAKHAND4020.1%
HIMACHAL PRADESH500%
SIKKIM340%
MIZORAM1160%
CHHATTISGARH780%
DAMAN & DIU250%
TOTAL533784100%
Source 1: Unit Level Data of 64th Round, 2007-08.

01
1. Introduction
This report examines whether the migrant workers who have been employed in the construction sector in the Gulf are absorbed into the construction industry in India after their return. In other words, it studies whether the skills acquired by them through work experience in the Gulf increases their employability in their home country. There is lack of knowledge about returning migrants in general and those working in the construction sector in particular. In addition, there is a lot of discussion about the increasing demand for skilled workers in the construction sector in India remaining unful lled. The global discourse on migration in the construction sector views migrant labour, particularly the short term migrants, as an important source of knowledge and skills, as well as an immediate solution to skills shortages in the labour-receiving countries.1 Thus, if the returning migrants from labour-receiving countries face dif culty in getting re-integrated in the construction industry in their home country, then the argument about a de ciency of skilled workforce in the construction sector seems awed.
The construction industry is one of the main employers of internal migrant workers in India and international migrants in the Gulf countries. According to the latest available data from the 68th Round of the National Sample Survey (NSS), Employment and Unemployment in India, 2011-12, 2 the share of construction sector workers in the total workforce – as measured by principal and subsidiary status (UPSS) – grew from 3.1 per cent in 1993-94 to 10.6 per cent in 2011-12. Despite the growing mechanization and automation in the construction industry, it still remains a labour-intensive sector. While Indian migrants have been nding work in the Gulf in large numbers since the 1970s, there have been dips at several points in the past decade. This has been due to the global nancial crisis, the drop in oil prices, nationalization policies, political con icts and increased competition from other countries of origin.
Thus, at a time when there is a greater demand for skilled workers in the construction sector in India, do migrants returning from the Gulf have better chance of employability? Do they get easily integrated in the construction sector or do they face constraints and challenges? Does the construction industry value the skills, knowledge and experience of returning migrant workers?
Keeping these questions in mind, this report addresses the existing research gap in scholarly literature on the construction sector. With an aim to provide the story of the economic re-integration of return migrants in construction sector, it includes data from interviews conducted with such migrants in the National Capital Region (Delhi, Gurugram and Noida), Gorakhpur (Uttar Pradesh), Jagtiyal (Telangana) and East Godavari (Andhra Pradesh) between April and July 2017.
1 Buckley, M. et al. (2016).2 The National Sample Survey (NSS), which is conducted by the National Sample Survey Offi ce (NSSO) under the Ministry of Statistics and
Programme Implementation, Government of India, collects socio-economic and demographic information of households and individual members across all states except some remote and inaccessible pockets. The Employment and Unemployment surveys (EUS) of NSS are primary sources of data on various indicators of the labour force at the national and state levels. NSS surveys on employment and unemployment with large sample size of households have been conducted on a quinquennial basis from the 27th round (October 1972 - September 1973) onwards. However, the time period between the 66th round (2009-10) and 68th round (2011-2012) was only two years. Data in the EUS report is presented according to various measures – usual principal status (UPS: those engaged in work for the largest part of the 365 days before the date of the survey), usual status (UPSS: those employed under UPS as well as those that are employed for at least 30 days during the 365 days prior to the date of survey), current weekly status (CWS: employment status in the week preceding the date of survey), and current daily status (CDS: status of employment in each day of the week preceding the date of survey).
02 ECONOMIC RE-INTEGRATION OF RETURNING MIGRANTS IN THE CONSTRUCTION SECTOR IN INDIA
WHO IS A RETURNING MIGRANT?
This report works with the de nition offered by the United Nations Statistics Division for collecting data on international migration (UNSD, 1998), embracing four dimensions for determining returning migrants: country of origin; place of residence abroad; length of stay in the host country; and length of stay in the home country after return. According to this de nition, returning migrants are “persons returning to their country of citizenship after having been international migrants (whether short term or long-term) in another country and who are intending to stay in their own country for at least a year.”3
OBJECTIVE OF THE REPORT
The aim of the report is to present the story of the economic re-integration of returning migrant workers in the construction sector in India, in order to make recommendations on how it can be improved. Some of the key questions it looked at are: • Do returning migrants nd jobs in the construction sector? Do they nd it easier to get absorbed or do
they face dif culties in nding work? • Is there a difference in the length of the period of unemployment for returning migrants vis-á-vis that
of internal migrants?• How does the construction industry view the returning migrants and utilize their skills, knowledge,
experience and expertise? • Do employers prefer returning migrants over internal migrants? Do they pay the former better wages
and provide better working conditions and other bene ts because of the skills and experience they have? Do employers value certi cation of skills or are the skills assessed on the job?
• Do the skills and knowledge possessed by returning migrants bene t the other workers of construction sites and how do they pass it on to other workers? Are there any other spill over bene ts? 4
It is important to note, however, that there are tens of millions of internal migrants in the construction sector – those who migrate within a state or the country – and this has been the focus of study of several scholars in India. This report, however, does not dwell too much on internal migrants. It is also important to clarify at the outset that attempts to engage with rms working in the construction sector (whom we generally consider as employers) in India met with little success. This is a major limitation as it is important to understand their views on the demand and the value of skilled manpower, how they utilize the knowledge and skills gained overseas by the returning migrants and how these can be further harnessed to address local labour market needs,. The rms claimed that since they do not recruit workers directly and are dependent upon sub-contractors, they will not be able to contribute much to the discussions. While conducting the study it became clear that there is complete disconnect between the manual construction workers at the bottom of sub-contracting chain and the construction conglomerates at the top. Thus, tracking the employers – who in several cases, was another co-worker – was not an easy task. The industry/employers’ views as reported in this study are based only on interactions with some of the contractors who could be contacted in the limited time available for the study.
In the following sections, this report brie y discusses the key characteristics of the construction industry and provides a broad overview of the migrant workers, employment and output relevance, informality and the debate on skills in the construction sector in India.
3 UNSD (1998). https://unstats.un.org/unsd/demographic/sconcerns/migration/migrmethods.htm4 Some of the related issues that the study attempts to address are: What are the other associational factors which play a major role in a
returning migrant worker getting a job? What is the role of trade unions and other local organizations in promoting their rights and interests, including social security? What are the other employment options available for these returning migrant workers? Does their experience, knowledge and skills obtained in the Gulf countries help them explore entrepreneurship opportunities?
03
2. The construction industry in India: An overview
The construction industry in India is an extremely diverse sector. It includes a range of workers from highly educated professionals such as engineers and architects to skilled workers such as masons, carpenters, electricians, bar-benders etc. to semi- and low-skilled workers. The sector absorbs the bulk of the low-skilled and semi-skilled workforce in both urban and rural areas due to its labour-intensive nature. In terms of rm size, structure and market reach, the industry is fragmented. While a small number of very large Indian rms and some multinational rms dominate construction activities across all segments – industrial, residential and commercial5 - there are some medium-sized rms that specialize in niche activities. The actual work in the eld is done by a large number of small sub-contractors who are rarely identi ed by the majority of the workforce as “employers”.6 The system works through further sub-contracting of work to various intermediaries such as recruitment agents or middlemen. These assignments, according to one manpower supplier at a construction site in East Kidwai Nagar, Delhi, could be as small as requiring 20-25 men to plaster six rooms. The subsection below highlights some of the important characteristics of the Indian construction industry.
2.1 GROWTH OF CONSTRUCTION SECTOR: EMPLOYMENT AND OUTPUT RELEVANCE
Among all the major sectors in the Indian economy, the construction sector has remained a major source of employment since the 1980s. With the agricultural sector experiencing a 0.36 per cent decline in employment during the period 1993-94 to 2011–12, it was the construction sector that absorbed a large portion of the workforce in non-farm employment. While overall employment growth fell from 2.16 per cent in the 1983 to 1993-94 period to 1.32 per cent in the 1993-94 to 2011–12 period, it was the construction sector which provided a boost to the employment. The rate of growth of employment in the sector increased from 5.58 per cent in the 1983 to 1993-94 period to 7.93 per cent in the 1993-94 to 2011–12 period. The average employment growth in the construction industry between 1983 and 2011-12, at 7.09 per cent, has been the highest among all sectors. The story of output growth in the construction sector during this period is similar (Table 2.1).
5 This oligopolistic nature and structure of the sector is in conformity with the trend witnessed in the construction sector worldwide. Large contractors have enormous infl uence over the production methods but the small and medium sized contractors do not have any say and thus they are unable to cut into the market (Gann 1996; Ofori et al. 2002). The Government of India allowed 100 per cent foreign direct investment (FDI) in townships, housing and built-up infrastructure and construction developments in 2005 and further relaxed the conditions in 2015. See https://goo.gl/vHkCyZ.
6 Srivastava and Sasikumar (2003); Srivastava and Sutradhar (2016). According to some estimates there are more than 100,000 Class A contractors registered with various government construction bodies and many more are operating informally (see http://www.indianmirror.com/indian-industries/2016/construction-2016.html).

04 ECONOMIC RE-INTEGRATION OF RETURNING MIGRANTS IN THE CONSTRUCTION SECTOR IN INDIA
Table 2.1: Growth rate of employment and growth rate of GDP (at constant 1999-2000 prices) across major sectors (in percentage)
Major sectors
1983 to 1993-94 1993-94 to 2011-12 1983 to 2011-12
Employment GDP Employment GDP Employment GDP
Agriculture 1.72 2.73 -0.36 3.01 0.38 2.91
Industry 2.66 5.19 4.12 7.03 3.60 6.37
Mining & Quarrying 3.67 5.96 -0.24 4.33 1.16 4.91
Manufacturing 1.80 4.82 2.45 7.28 2.22 6.40
Electricity etc. 4.51 8.34 3.58 5.92 3.91 6.79
Construction 5.58 4.76 7.93 7.81 7.09 6.72
Services 3.51 6.43 2.93 8.35 3.13 7.66
All 2.16 4.86 1.32 6.87 1.62 6.15
Source 1: Computed from Employment and Unemployment Survey, NSS (various rounds) and National Accounts Statistics, CSO (various years).
Thus, while, overall, there has been a structural mismatch in terms of growth in GDP being accompanied by decline in employment, in the construction sector there has been growth in both GDP and employment (Figure 2.1). Figure 2.2 projects the current sectoral share of GDP and employment in the Indian economy.
Figure 2.1: Overall growth rate of GDP and workforce vis-à-vis growth rate of GDP and workforce in the construction sector
Source 2: Computed from Employment and Unemployment Survey, NSS (various rounds) and National Accounts Statistics, CSO (various years).
0
1
2
3
4
5
6
7
8
9
1983 to 1993-94 1993-94 to 2011-12
Construc�on sector employment growth Construc�on sector GDP growth
All sectors employment growth All sectors GDP growth

05
Figure 2.2: Sectoral share in GDP and employment, 2011-12
Source 3: Same as fi gure 2.1
This can also be explained by comparing the employment intensity of key sectors over the same time period.7 Figure 2.3 shows that while the overall employment intensity has declined from 0.44 (1983 to 1993-94) to 0.19 (1993 – 94 and 2011 – 12), the employment intensity in the construction sector during both these intervals (despite registering a decline during the post-reform period) has remained the highest. It clearly indicates that the growth of employment in this sector is more than the per capita increase in the growth of output.
Figure 2.3: Employment intensity of key sectors (1983 and 1993 – 94 to 1993 – 94 and 2011 – 12)
Source 4: same as Figure 2.1
7 Employment intensity, as used in this paper, is the relationship between total output and total direct employment in a sector. Employment intensity is also used interchangeably as employment elasticity (see Kapsos, 2005)

06 ECONOMIC RE-INTEGRATION OF RETURNING MIGRANTS IN THE CONSTRUCTION SECTOR IN INDIA
Thus, despite technological developments, pre-fabrication technology and automation, the construction industry remains highly labour intensive and its growth is directly proportional to employment-generation.8
2.2 INFORMALITY AND MIGRATION IN THE CONSTRUCTION SECTOR
While the discussions in the previous section indicate that the construction sector is a signi cant contributor to both the economy and to employment, it is important to mention that a major part of this sector lies in the informal economy.9 A number of researchers suggest that most of the expansion in the construction sector is that of informal work.10 Of the total workforce employed in the construction sector, the share of the informal workforce is 97 per cent – the second highest among all sectors after agriculture (Figure 2.4).
Figure 2.4: Share of informal workers across major sectors since 1999 – 2000
Source 5: Computed from NSS Unit-level Data on Employment and Unemployment Surveys, various rounds.
This demand for a highly informal workforce in the construction sector, as explained in the section above, is usually met by migrant workers – both seasonal and long-term. Workers from rural India who withdraw from the agricultural sector and migrate to cities have been often been reported to be working in the construction industry either as wage workers or informal builders constructing housing.11 As per the 64th NSS Round on Household Consumer Expenditure Survey 2007-2008, much of the employment in the construction industry is for short-term migrants; the sector absorbs 36.2 per cent of total short-term migrants, followed by agriculture (20.4 per cent) and manufacturing (15.9 per cent).12
Though there are many factors behind this heavy reliance on migrant workers in the construction sector, the most important is the exibilization of employment structures because of the project-speci c and non-standardized nature of production.13 Local populations hardly engage in construction work because the working and living conditions for workers are very poor. Some of the operations in this sector are manual
8 A characteristic common in several other countries (for details see Wells 1996, 2012; Erlich and Grabelsky 2005).9 International Labour Organisation and World Bank were, during 1980s and 1990s, among the early ones to have studied and grasped
the signifi cance and repercussions of the informal sector in the world of work. A consensus on understanding informality has not yet been reached though all agree that some of the main characteristics of informality are: decline in permanent engagements, increase in casual and temporary workforce and decline in social security. The size of the informal workforce in India is very signifi cant (92 per cent of the total workforce in 2011-12).
10 For conceptual details on informality in construction sector, see Wells (2007). 11 Deshingkar and Start (2003); Srivastava (2003), Bhattacharyya and Korinek (2007).12 Srivastava (2011).13 Bosch and Philips (2003) have argued that long before the broad-based ‘fl exibilization’ of industrial production systems (such as auto
manufacturing), the construction industry was characterized by fl exible and contingent forms of employment.
99
84
96
86
7676
9199
8897
89
80
9292100
8997
91
79
9292
0
20
40
60
80
100
120
Agriculture Manufacturing Construction Industry Services All
1999-00
2004-05
2011-12

07
in nature and hazardous. There is a plethora of laws enacted by central and state governments to protect the rights of construction workers, but most of these are not adequately applied or enforced.14 Migrant workers undertake these tasks without adequate safety measures because their economic and social condition makes them vulnerable. Most of them are from the lower ranks of the caste hierarchy and they are generally stigmatized in their native place.15 Since most of them migrate from their native place in distress, they have very low bargaining power and hence are easily exploited by contractors and sub-contractors.16
Migration – both short-term and long-term – from the poorer states is very high. These states are mainly situated in the rain-fed regions of eastern and central India and suffer from low productivity in agriculture.17
However, work-related migration into the construction sector has not been limited to within the country. The surge in oil prices in the Gulf countries in the 1970s resulted in rapid urbanization and generated huge demand for migrant workers in the construction sector. A major portion of this demand was ful lled by migrant workers from India as well as other South Asian countries. In fact, the old mercantile networks between the Gulf and southern India were revived through new networks of construction labourers from the southern states migrating to the Gulf. It is estimated that almost half the manual labour in construction in the United Arab Emirates (UAE) is from Kerala, Tamil Nadu and Andhra Pradesh.18 In the past two decades, evidence shows that workers from northern and eastern Indian states such as Punjab, Delhi, Uttar Pradesh, Bihar and West Bengal have also started migrating to the Gulf (Appendix 1), while the ow from Kerala appears to be declining. This is primarily due to the shrinking wage differential between the increasing wages in the southern states of India, and the stagnated wages available to them in the Gulf.
2.3 SUB-CONTRACTING IN THE CONSTRUCTION SECTOR
Another key characteristic of the construction industry in India is that the last two decades have seen increasing levels of sub-contracting. It is estimated that around 80 – 90 per cent of activities in the construction sector are carried out through sub-contracting.19 Firms outsource labour for functions across the construction site to informal networks of intermediaries, which includes contractors, sub-contractors,
14 Wages paid to unskilled workers are lower than the legislated minimum wage in the NCR. The working hours are usually longer than eight hours but the remuneration is paid only on the basis of a normal full day. Most of the employers deny overtime wage payments (Srivastava and Sasikumar, 2003; Srivastava and Sutradhar, 2016; Bhattacharya and Korinek 2007). The labourers do not get bonuses, provident fund, gratuity, medical benefi ts and maternity leave. Since the nature of job is contractual, the workers do not protest out of fear of losing their job (Jatrana and Sangwan, 2004). The living conditions of the migrants are also very poor. They are forced to live in temporary structures, commonly known as jhuggis (small huts made of plastic sheets with no electricity, toilets, or place for cooking) around construction sites. Sanitation and drinking water facilities are rarely provided and as such they are more prone to health hazards and hygiene problems. Those who live outside the construction sites are not provided any transportation and have to bear extra expenses for commuting. Their vulnerability is further compounded when they do not get any social security and other benefi ts such as the public distribution system (PDS), Integrated Child Development Scheme (ICDS), Mahatma Gandhi National Rural Employment Guarantee Act (MGNREGA) etc. as the different locations of their stay and work create administrative and legal hitches (Rogaly et al., 2001, 2002; Smita and Panjiar, 2007; Srivastava & Dasgupta, 2010).
15 The majority of these workers, who are non-literate, are engaged in casual work even in their native place and the chances of upward mobility in terms of employment and economic status are very low (Srivastava and Sutradhar, 2016).
16 Srivastava and Sasikumar (2003). Srivastava and Jha (2016) in their study of ten construction sites in Delhi, Noida and Gurugram (with 250 workers), found that a majority of the lower skilled construction workers belong to the Scheduled Castes and Scheduled Tribes or are Muslims. Women workers also work at the bottom of the recognized skill hierarchy and are paid lower wages than the male workers. Khurana (2016) in his study reports that most of the unskilled work at the construction site in Delhi is carried out by women who are known as beldars. These beldars assist the mistri (mason) and no training is required for this. This gendered division of labour leads to differential payments, designations and social status. Women workers receive wages varying from Rs. 80 to Rs. 180 per day while their male counterparts receive Rs. 250 to Rs. 300. Working hours for women is 14-18 hours which includes only 8-14 hours of remunerated work and no weekly day off or any paid leave. The only way that women workers can resist such exploitative, insecure and discriminatory work practices is by withdrawing from the construction sector and becoming domestic workers.
17 As per the Census 2011 data on migration, the 10 largest fl ows of inter-state migration (including rural and urban migration) are in the north (Uttar Pradesh, Madhya Pradesh, Haryana and Delhi) and east (Bihar and West Bengal) with signifi cant fl ows between Tamil Nadu and Kerala. In rural to urban, it is basically between the states in northern and eastern India, except for movement between Tamil Nadu and Kerala, and Andhra Pradesh and Karnataka.
18 Buckley, Michelle, Adam Zendel, Jeff Biggar, Lia Frederiksen and Jill Wells, (2016). 19 Saxena and Yadav (2013).

08 ECONOMIC RE-INTEGRATION OF RETURNING MIGRANTS IN THE CONSTRUCTION SECTOR IN INDIA
labour agencies and other middlemen. In some cases the workers are also directly picked up from places known as labour chowk, naka or mandi.20
It has been argued that the practice of sub-contracting is the result of cut-throat market competition in the sector as rms compete to reduce their cost of production. Since, in the hierarchy of workers in the construction industry, the migrant labourers are the most vulnerable, resorting to the recruitment of un-skilled and semi-skilled workers becomes an easy way to minimize costs by bringing exibility in labour usage.21 Outsourcing enables contractors and sub-contractors to get only as much labour as they need and when they need it and hence labour becomes a variable, rather than a xed, cost.22
Studies on sub-contracting in the construction sector have pointed out that there is a decline in permanent workers or directly employed workforce and a corresponding increase in the number of workers employed through sub-contractors and middlemen.23 Large contractors engage multiple small sub-contractors to meet the demand for labour as and when required. Workers with some experience and skills act as small sub-contractors or suppliers of labour to bigger contractors. Thus, approaching labourers is a task left to the lowest rung of sub-contractors, and no one higher up in the chain takes responsibility for their working and living conditions. As a result, there is complete disconnect between the manual construction workers at the bottom of sub-contracting chain and the construction conglomerates at the top.
As a part of this study, the human resource managers and recruiters of the Indian construction industry were approached in order to understand their views on the demand and the value of skilled manpower in the sector, to explore whether and how the knowledge and skills gained overseas by returning migrants is used by the rms and how it may be further harnessed to address local labour market needs. But this effort was in vain. The rms claimed that since they do not recruit workers directly and are dependent upon sub-contractors, they were not be able to contribute to the discussions.
Experience over the last two decades also shows that sub-contracting prevents any kind of unionization and hence labour in the construction sector remains highly unorganized.24 There are national federations of unions representing ordinary construction workers, but they are not known to have engaged in any collective bargaining at the industry or enterprise level.25 This makes the migrant workers more vulnerable in the labour market. They move from one worksite to another, linked with the same middlemen until they are able to build their own networks or acquire new skills. The middlemen or the sub-contractors usually prefer a new group of people because the older groups learn the dynamics of the labour market over a period. Thus, to keep the chain of exploitation strong, there is a constant need for new migrants who cannot easily access the labour market without coming through some middlemen.26 The sub-contracting of labour has a profound, negative effect on job security, safety and health and social security coverage of the migrant workers. It has also been argued that the level of skill in the construction industry in some countries has fallen signi cantly as a result.27
20 These are points in towns/cities where labourers gather in the morning to wait for work from individual house owners or petty sub-contractors/middlemen.
21 Vaid (1999); van der Loop (1992); Abdul-Aziz (2001); Yoon and Kang (2000); Saboia (1997); Zylberstajn (1992); Connolly (2001). 22 Vaid (1999); van der Loop (1992); Abdul-Aziz (2001); Yoon and Kang (2000); Saboia (1997); Zylberstajn (1992); Connolly (2001). 23 Wells (2007); Mitullah and Wachira (2003); Jason (2005).24 WIEGO (2017); Vaid (1999).25 Vaid (1999); van der Loop (1992); Abdul-Aziz (2001); Yoon and Kang (2000); Saboia (1997); Zylberstajn (1992); Connolly (2001). 26 Verma (2013).27 ILO. The construction industry in the 21st century: Its image, employment prospects and skill requirements. Geneva 2001.

09
2.4 VALUE OF SKILLS IN THE CONSTRUCTION SECTOR
Since most of the labour withdrawing from farming, particularly the landless labour, does not possess any particular skill, it is the construction sector which is often the only signi cant alternative source of employment. Like in most developing countries, construction skills in India are mainly acquired through an informal system.28 There are vocational training schools, but most of the workers, as was also expressed during the eldwork for this study, usually nd this expense unnecessary and unaffordable. They are worried for the wage loss or opportunity costs that they may incur while undergoing training.
The 66th Round (Employment and Unemployment) of NSS (2009 – 10) shows that the education level of over 50 per cent of the labour force in the 15 – 59 age group is extremely low. Of the total labour force on usual status basis, 29 per cent is not even literate. The proportion of non-literate workers is the highest in agriculture and allied activities (about 40 per cent), followed by the construction sector (33 per cent). The vocationally trained labour force in the age group of 15 – 59 is around 10 per cent. The vocationally trained labour force is highest in the services sector (33 per cent), followed by manufacturing (31 per cent), agriculture (27 per cent), and non-manufacturing and allied activities (9 per cent). However, among the vocationally trained labour force, only 2 per cent have had formal training and the rest received informal training.
Studies have divided the skill level of workers in the construction sector into four categories: no certi ed skill (no certi ed technical and no certi ed vocational training), low skill (no technical training, but some certi ed vocational training), medium skill (secondary school diploma or certi cate) and high skill (tertiary education degree).29 According to the 68th round of NSS (2011 – 12), 68.8 per cent construction workers in the 15-29 age-group have no skills and 25.2 per cent have low skills. The percentage share of medium skill and high skill construction workers are only 5.4 per cent and 0.6 per cent respectively. In the 15 – 59 age group, the percentage share of construction workers with no skill is quite high (71.9 per cent), followed by low skilled construction workers (22.3 per cent). Only 5.1 per cent and 0.7 per cent of construction workers have medium and high skill respectively in this age group. Around 85.1 per cent of construction workers in 15 – 29 age group and 85.8 per cent construction workers in the 15-59 age group do not possess any formal training.30
It is a well-accepted fact that there is an acute shortage of skilled workers in the construction sector. A number of large rms have been very vocal about the fact that while India has a surfeit of unskilled workers, it does not have enough skilled workers such as masons, carpenters, and machine operators to construct roads, railways, and ports.31 One large construction rm reportedly brought in skilled carpenters, steel xers and electricians from China, Indonesia and Philippines as they were cheaper and more productive than their Indian counterparts,32 and another reportedly brought in 4,000 Chinese workers for the construction of India’s largest oil re nery at Jamnagar district in the state of Gujarat.33
In response, the Government of India has drafted a National Skill Development Policy in 2009 and launched the National Skill Development Corporation (NSDC) with a target to skill 150 million people by 2022 in 20 high growth sectors, including the construction sector.34 According to the report, Human Resource and Skill
28 In the Philippines, 95 per cent of construction workers acquire skills through learning by doing (Yuson, 2001). In Sri Lanka, 86 per cent of the skilled workforce, mostly men, has acquired skills only from informal training (Gunawardena and Jayawardane, 1998). A similar situation prevails in Brazil, Kenya and Mexico (ILO, 2001).
29 Sasikumar and Thimothy (2015) 30 Sasikumar and Thimothy (2015). 31 Pearson and Sharma (2011).32 Dhall (2008), Hajela (2012). 33 Choudhary (2007). 34 Structured as a public-private-partnership, with government ownership restricted to 49 per cent of the equity capital, the National
Skill Development Fund (NSDF) was set up to manage the funds required. For details see http://planningcommission.gov.in/plans/planrel/12thplan/pdf/12fyp_vol2.pdf.

10 ECONOMIC RE-INTEGRATION OF RETURNING MIGRANTS IN THE CONSTRUCTION SECTOR IN INDIA
Requirements in the Building, Construction Industry and Real Estate Services, published by NSDC in 2013-14, the workforce (in the 15-65 age group) in the construction sector was projected to be 76.55 million by 2022, and 97 per cent of this was likely to have no training before starting work. In November 2014, the Government set up a new Ministry of Skill Development and Entrepreneurship to coordinate all skill development efforts across the country and launched the Pradhan Mantri Kaushal Vikas Yojana (PMKVY) as its agship scheme on July 15, 2015.
It has been widely claimed that NSDC adopted several initiatives on a public-private-partnership basis to impart skill development and training at the sub-sector level and has thereafter also provided them better employment. The Confederation of Real Estate Developers Association of India (CREDAI), an apex body for private real estate developers, initiated an onsite training model to upgrade skills of construction workers and train them in plastering, masonry, plumbing, electrical works, tile laying, and other related activities. As per the latest information available on CREDAI’s of cial website, during 2015-16 and 2016-17, it trained 5,437 and 8,506 construction workers respectively. However, there is limited evidence to date to show the results of the Skill India programme. The NSDC has been able to identify only 5 per cent of candidates who got placed after being trained under the PMKVY.35 The report of the Committee for Rationalisation and Optimisation of the Functioning of Sector Skill Councils, set up by the Union Government, has observed that the schemes to impart vocational training have failed in their twin objectives of providing employment and creating a pool of skilled workers for industry.36 In addition to that, some studies also seem to suggest that the skilling policy may even have had the opposite effect, as it may have led to an increase in the precarious situation of workers by keeping the wages down.37
Vocational training is only one way of acquiring skills. Most of the workers in the construction sector interviewed for this study indicated that they nd this method very expensive and unnecessary. Given that the jobs offered in the sector are overwhelmingly casual, short-term, insecure and poorly paid, almost all the workers expressed concern about the likely wage loss that they may incur while undergoing such vocational training. However, most of the workers claimed to have gone through some kind of informal training of “learning by doing”. They further added that though many workers start as unskilled workers, after a few months they are generally asked to take up semi-skilled work. Thus, they start assisting in certain tasks and receive practical training for work on the site.38
As such, workers who have migrated to the Gulf and worked there for two or more years qualify to be categorized either as semi-skilled or skilled. If, upon their return, these migrants nd it dif cult to get employment or are not integrated in the construction industry, then the question of unavailability and de ciency of skilled workforce in the Indian construction sector is open to question. However, the mapping of returning migrants and their story of re-integration in the Indian construction industry, and the transfer of workers’ skills and knowledge in the domestic labour market has been under-researched. The second half of this report will explore in more detail whether skills possessed by returning migrants increases their employability, whether they easily get integrated in the construction sector or face constraints and risks, whether the construction industry in India values the skills, knowledge and experience of returning migrant workers and what role do returning migrants play in the construction sector. It is important to note that the ndings reported are by no means exhaustive of
35 https://goo.gl/XQRnLH36 The Union Ministry of Skill Development and Entrepreneurship had set up the committee, headed by Sharda Prasad, to suggest
reforms in the Vocational Education and Training System. It observed at the outset that efforts at training were “half-hearted”. Rajalakshmi (2017).
37 Ruthven (2017). 38 This type of informal training is not extended to women construction workers. Even the NSDC in its report, Human Resource and Skill
Requirements in the Building, Construction Industry and Real Estate Services, did not mention the female skilled workforce. In such an environment, where skill development agencies are not even recognizing the requirement for skilled women in the workforce, it becomes very diffi cult to make progress on gender equality in employment and working conditions in the construction sector.

11
either the national situation, nor do they provide a comprehensive picture of the returning migrants in the construction sector in India. They merely highlight some of the complexities that skilled and semi-skilled returning migrant workers face, and the potential loss to India’s construction industry.
12 ECONOMIC RE-INTEGRATION OF RETURNING MIGRANTS IN THE CONSTRUCTION SECTOR IN INDIA
3. Re-integration of migrants from the Gulf: Insights from the fi eld
The search for work in the construction sector – both short-term and long-term – as explained in the earlier section, has not been con ned to migration within the country. With the surge in oil prices in the Gulf since the 1970s, large number of workers from some states, mainly Kerala, Tamil Nadu and Andhra Pradesh, migrated to work in the construction sector in the Gulf. Over the last two decades, workers from northern and eastern states such as Punjab, Delhi, Uttar Pradesh, Bihar and West Bengal have also been migrating to the Gulf. This section of the report is focused on the issue of re-integration of returning migrants in the construction industry in India. It also assess whether the skills gained through work experience in the Gulf increases their employability. It addresses the barriers and challenges the returning migrants face when they seek employment in India.
The eld work was carried out at four sites: Jagtiyal (Telangana) and East Godavari (Andhra Pradesh) in south India and the NCR (Delhi/Gurugram/Noida) and Gorakhpur (Uttar Pradesh) in north India. NCR (Delhi/Gurugram/Noida) was selected as it is a major hub of construction activity as well as a destination for internal migrants working in the construction sector. However, during the eldwork we found that Delhi is also a nodal point for recruiters coming from the Gulf and workers from several north Indian states wanting to migrate to the Gulf. The other three locations were selected as they are major originating points for workers going to the Gulf.39 Data was collected from a total of 252 returning migrants from all locations as well as from 60 internal migrant workers. Interviews were also conducted with contractors, recruitment agencies and trade unions working in the construction sector.
METHODOLOGY
One of the major problems we encountered during the study was nding the returning migrants in the selected sites. There is no information or record of returning migrants available with any individual, organization, or even agencies – both public and private. The available data with the Ministry of External Affairs only provide names of top 50 districts sending emigrants to ECR (Emigration Clearance Required) countries in the past several years. But tracking the returning migrant workers from a district of origin, especially those who have worked in the construction sector in the Gulf, was an extremely dif cult task. Thus, the approach was to visit the construction sites, talking to the employers and also those trade unions who claimed to be working with the workers in this sector to get some leads about the pro le of the workers. However, the same method could not be used for all construction sites and so different methods were adopted for different sites.
In Gorakhpur, the cluster sampling method was used. During the pilot eldwork it became clear that there are certain pockets in Gorakhpur from where workers migrate to the Gulf in large numbers. Rasoolpur and Hathat hamlets were selected. Apart from speaking to returning migrants and internal migrant workers, visits were made to two private skill training and testing centres, one government-approved PMKVY centre, one recruitment agent and two petty labour contractors.
39 The study originally had planned to conduct fi eldwork in Hyderabad (Telangana), another hub of construction activities, but after conducting two weeks of pilot fi eldwork, we could not fi nd any returning migrant on the construction sites we visited. We, therefore, changed our research site to Jagtiyal.

13
Considering the size and the growth of the construction sector in the NCR, the rst step was to map construction sites in Delhi, Noida and Gurgaon where large construction companies like Larsen & Toubro (L&T), NBCC, ETA Engineering Pvt. Ltd (ETA) and DLF Ltd. were working. However, not much difference was found in these sites vis-à-vis others with regard to employing Gulf-returning migrants. The human resource managers/recruiters of construction companies were approached, but they said they would be unable to contribute to the discussion in any meaningful way, as explained earlier in the report. Various skills training and testing centres were then approached to nd the migrants returning from the Gulf. Seven skill training and testing centres, petty labour contractors and trade unions were also visited.
In East Godavari, the cluster sampling method was used in 12 villages. The selection of respondents within these cluster villages were done through snowball sampling.40 In Jagtiyal, it was found that there were several associations active in mobilizing the construction workers, particularly among the returning migrants. Six workers’ associations were approached to help locate returning migrant workers.
3.1 PROFILE OF THE RETURNING MIGRANTS
Before going on to discuss the re-integration of returning migrants, it is important to provide a pro le of the sample of the returning migrants selected for this study. The distribution of the total sample of 252 returning migrants was: 52 from the NCR, 54 from Gorakhpur, 72 from East Godavari and 74 from Jagtiyal. The following sub-sections provide some of the main characteristics of the selected respondents.
3.1.1 Mean age and mean year of returning migrants
The mean age of respondents at the time of their return was 37.5 years. The mean age at the time of the rst episode of out-migration was 27.3 years. There is no signi cant difference between the mean ages at the time of migration across the regions – almost all migrants appear to go out in their mid-twenties. But, as shown in Figure 3.1, those from the southern states – Andhra Pradesh and Telangana – appear to have stayed on for a longer period as compared to those from the northern region – the NCR and Uttar Pradesh. The mean age of respondents at the time of their return from the former is 39.6 years and that of the latter is 35.1 years. Further, the reference period of migration of respondents is between 2007 and 2012.41 Thus, the average period of stay in the Gulf is around ve years. So the sample provides information of those respondents who have returned before 2012.
40 This is a sampling technique where respondents recruit other participants for a test or study. It is used when there is lack of information on the participants and they are hard to fi nd. It is called snowball sampling because (in theory) once you have the ball rolling, it picks up more “snow” along the way and becomes larger and larger.
41 This period has been calculated as the mean year of their migration to the Gulf and mean year of their return to India. The returning migrants had migrated to the Gulf around 2007. The mean year of return is 2012. This means most of the returning migrants in our sample have come back to India in this year.

14 ECONOMIC RE-INTEGRATION OF RETURNING MIGRANTS IN THE CONSTRUCTION SECTOR IN INDIA
Figure 3.1: Mean age of the respondents across surveyed locations (in years)
Source 6: Field Survey, 2017
3.1.2 Number of episodes of migration and years of experience in the Gulf
More than half of the respondents reported to have migrated more than once to the Gulf ( rst panel 1 of Figure 3.2). They also reported to have migrated to multiple countries. Among the six Gulf countries – Saudi Arabia, UAE, Kuwait, Bahrain, Oman and Qatar – Saudi Arabia was the most common destination. Nearly 75 per cent of the returning migrants have more than two years of work experience in the Gulf. Another 20 per cent have work experience between one and two years. Only 6 per cent reported to have worked for less than a year (second panel of Figure 3.2).
Figure: 3.2 Episodes of migration and years of experience
Source 7: Field Survey, 2017.
3.1.3 Social Background
More than 56 per cent of the respondents belonged to the other backward classes (OBC) category. Nearly one-fourth (24.6 per cent) belonged to scheduled castes (SCs) and scheduled tribes (STs) and 16.3 per cent were from the general castes. A small number (3.2 per cent) did not reveal their social group. While OBCs dominated the sample in Gorakhpur and East Godavari, SCs/STs in Jagtiyal, the sample in the NCR was dominated by the general caste (Figure 3.3). In other words, returning migrants who were from groups higher in the social hierarchy were more likely to relocate themselves in the NCR. In the case of domestic
27.427.4 26.626 6 27.727.7 27.427.4
38.835.7 34.5
39.8
0
5
10
15
20
25
30
35
40
45
East Godavari NCR Gorakhpur Jagtiyal

15
migrants, 75 per cent were from the OBC community, 11 per cent from SC, 5 per cent from ST and 9 per cent from the general castes.
Figure 3.3: Percentage distribution of returning migrants by social group
Source 8: Field Survey, 2017
3.1.4 Education Level of the Returning Migrants
A signi cant proportion (30 per cent) of the respondents were either non-literate or had an education below primary level. The majority studied up to primary or middle school (36.5 per cent), while 26 per cent had studied up to secondary and higher secondary levels. Only 8 per cent have either gone to college or higher. Further, 7 per cent of the respondents had received technical training and 43 per cent had a vocational education. Out of total 252 workers, only three have an Industrial Training Institute (ITI) certi cate, four are trained engineers and 11 have been trained through other industrial training centres.42
42 Technical education is formally imparted through educational institutes such as ITIs and other formal training centres. These institutions certify workers after providing theoretical and technical knowledge of various trades such as carpentry, electronics, computer hardware, plumbing etc. Vocational education is provided through both formal and informal channels. Respondents who reported to have received vocational education had done so either through apprenticeship or compulsory training in the company they worked for.
23.63.83 83 83.8
14.8
76.4
34.6
70.4
0 00 00.0
61.5
14.8
0.0
20.0
40.0
60.0
80.0
100.0
East Godavari NCR Gorakhpur
ST/SC OBC General Caste
57.9
42.142 1
0
10
20
30
40
50
60
70
Voca onal Educa onNo Yes
1.2 1.6 4.4
92.9
0.0 20.0 40.0 60.0 80.0 100.0
Technical
ITI Engineering Training cer cate raining

16 ECONOMIC RE-INTEGRATION OF RETURNING MIGRANTS IN THE CONSTRUCTION SECTOR IN INDIA
Figure 3.4: Percentage distribution of respondents by education levels
Source 9: Field Survey, 2017
3.2 TRENDS AND PATTERNS IN EMPLOYMENT AMONG RETURNING MIGRANTS IN INDIA
To understand the pattern of employment among the returning migrants, it requires to rst look at the usual activity pro le of the workers. At the same time, in order to understand the impact of migration and the skills gained during the period of stay in the Gulf on their employment status, their current activity status is compared with that of their stay in the Gulf and before they emigrated.
As Figure 3.5 shows, a little over 80 per cent of the returning migrants were engaged either in casual work (50 per cent) or self-employment activities (32 per cent). Only 11 per cent of the respondents were found to be engaged in regular salary/wage employment and 7.5 per cent are unemployed. This change in work status on their return to the home country is quite stark, as all respondents were working in regular/wage employment in the Gulf. Given the fact that their average work experience in the Gulf was more than two years, most of them would be classi ed either as semi-skilled or skilled in the Indian context. Therefore, it is reasonable to expect that they should get absorbed in regular/wage employment and be offered better wages after their return from the Gulf. But that does not seem to be the case.
A comparison of their present employment status vis-a-vis that prior to migration clearly shows that their present employment status is actually worse than that in the destination countries (Figure 3.5). One important conclusion that can be drawn from this is that the skills acquired by workers in the Gulf make little difference to their employment status on their return. While the percentage of people engaged in casual labour has declined by 10 per cent (from 59 per cent before emigration to 49 per cent after return), they still constitute half the workforce who qualify to be counted as at least semi-skilled workers (on account of working for over two years in the construction sector in the Gulf). The share of workers engaged in regular salary/wage employment has increased only marginally by 1.6 per cent, which is almost equivalent to the 1.2 per cent rise in unemployment. The only signi cant shift is visible in the category of self-employed from 25 per cent before emigration to 32 per cent after emigration.
29.8 36.5 25.8 7.9
0 20 40 60 80 100 120
Per cent
Below Primary Primary and Middle Secondary and Higher Secondary College and above

17
Figure 3.5: Employment status before emigration and after return
Source 10: Field Survey, 2017
Figure 3.6 explains the impact of skills gained by migrants while working in the Gulf on their usual activity after migration. Among those who were working as casual labourers before migration, more than 70 per cent continue to remain casual labourers even after their return. Only 21 per cent of the casual labourers have moved into self-employment and a marginal 2 per cent to have gotten regular employment after their return from the Gulf. However, what is even more worrying is that a greater number of those engaged in self-employment before migration (34 per cent) reported that they are either employed as casual labour or are unemployed after their return. Sixty- ve per cent of those engaged in self-employment before migration continue to be self-employed after their return. Thus, the returning migrants are moving back and forth between casual employment and self-employment. While no respondent employed as a regular/wage worker before emigration reported to be unemployed after returning from the Gulf, nearly one-tenth reported to be engaged in casual labour after return. There is hardly any change in the share of those in regular salary/wage employment. Half of those who were unemployed before migration seem to have opted for self-employment after return. However, the sustainability, quality and the size of self-employed enterprises is an issue and this will be discussed later in this section.
Figure 3.6: Employment status of returning migrants before going to the Gulf and after return
Source 11: Field Survey, 2017
59.1
25
9.5
6.3
49.2
32.1
11.1 1
7.5
-80 -60 -40 -20 0 20 40 60
Casual Labour
Self-Employed-
Regular salary/wage employmentalary/wage emplo
Unemployede
Before Emigra�on Current
70.5
23.823 8
8.312.512 5
49.2
20.8
65.165.1
4.24 2
50
32.132 1
22 1.61 6
87.5
18.811.1
6.7 9.5
0
18.8
7.5
0
10
20
30
40
50
60
70
80
90
100
Casual LabourBefore mi
Self-Employed Regular salary/wageemployed
Total
Curre sual ac vity Casual Labour Curre sual ac vity Self-Employed
Curre sual ac vity Regular salary/wage employed Curre sual ac vi mployed

18 ECONOMIC RE-INTEGRATION OF RETURNING MIGRANTS IN THE CONSTRUCTION SECTOR IN INDIA
One important conclusion that can be drawn from this is that due to very limited employment opportunities for returning migrants, most of them remain unemployed, or choose between self-employment and casual labour. Regular salary/wage employment opportunities are few and scarcely available. The employment status of migrants after their return, which is marked by increasing casualisation, self-employment and unemployment, is actually worse than what it was in the Gulf. Thus, it seems very unlikely that the skills learnt by them during their work experience in the Gulf is giving them higher returns or enhancing their employability.
Another revealing fact is that a majority of those engaged in regular employment belong to the upper castes. Out of a total sample of 43 upper caste returning migrants, 46.5 per cent are currently engaged in regular activity against only 3.2 per cent from SC/ST and 4.1 per cent from OBCs (Figure 3.7).
Figure 3.7: Change in employment status of returning migrants by caste
Source 12: Field Survey, 2017
3.3 GESTATION PERIOD BEFORE RE-INTEGRATION
One of the core objectives of this report is to look into the gestation period of employability of returning migrants. The respondent workers reported that, on average, it took them one to three months to nd some kind of employment. The distribution of the gestation period across different activities was 53 per cent among self-employed, 38 per cent among regular salaried/wage employment and 38 per cent among casual workers. The self-employed and regular salaried/wage employed had to wait less time as compared to casual labour (Figure 3.8).
The reason for the low gestation period for regular employment is that 65 per cent of these workers had returned because the company employing them had transferred them back to India. These employers are major construction companies such as ETA, L&T etc. who send their workers from one country to another. In the case of self-employment, a majority of the workers had their own small enterprises even before their migration, while some are engaged in business inherited from their family. Therefore, they too experienced a relatively shorter gestation period.
The practical way of looking into the re-integration of respondents in the construction sector in the home country after return is to observe the period of unemployment of casual workers. Among those who remained unemployed for three to six months, a signi cant proportion are casual labourers (21 per cent). It clearly indicates that employment opportunities available for returning migrants are very low.
69.4 66.159.2
46.3 44.244 2
34.934.9
21.02 24.224 2231.33
40.84
9.314.014 01 0
1.6 3.23 2 4.14 1 4.14 1
39.546.5
8.1 6.5 5.45.4 8.8 7.0 4.74 7
0.0
10.0
20.0
30.0
40.0
50.0
60.0
70.0
80.0
Before EmigrationST/SC
Current Before EmigrationOBC
Current Before EmigrationGeneral Caste
Current
Casual Labour Self-Employed Regular salary/wage employed Unemployed

19
Figure 3.8: Percentage distribution of current usual activity by period of unemployment after return
Source 13: Field Survey, 2017
Those facing prolonged unemployment after their return constitute 12 per cent of the total returning migrants. Of these, 68 per cent belong to the OBC category and are from Gorakhpur in Uttar Pradesh. These unemployed respondents had worked in the Gulf for more than two years on average.
Do the returning migrants nd employment throughout the year? The average time of unemployment for a returning migrant worker is 3.86 months which is almost equal to the internal migrant workers (3.85 months). This indicates that their experience makes no difference to the availability of work for returning migrants.
3.4 ROLE OF ASSOCIATIONAL FACTORS IN GETTING EMPLOYMENT
Informal agencies play a signi cant role in nding employment for returning migrants. Figure 3.9 shows that among informal agencies, petty contractors (23.8 per cent), family/relatives/friends (19.4 per cent) and co-workers (17.1 per cent) play the most important role in nding employment. Among formal agencies, only 4.8 per cent of respondents are directly recruited by the employer and only 2.4 per cent of the respondents have bene ted from employment agencies.
In the case of economic re-integration of retuning migrants, it is the informal associations such as fellow workers, caste associations, petty contractors and villagers which have played a major role (Figure 3.10). Only 7.5 per cent of the respondents reported that they were helped by formal institutions, namely recruitment agencies (5.6 per cent) or the government (1.9 per cent). It should be noted that those who indicated that they have received government support in their re-integration have taken a loan from commercial banks for establishing their enterprises.

20 ECONOMIC RE-INTEGRATION OF RETURNING MIGRANTS IN THE CONSTRUCTION SECTOR IN INDIA
Figure 3.9: Role of various agencies in providing employment after return (in %)
Source 14: Field Survey, 2017
The situation is no different for the local migrants for whom informal contacts and social contacts also play a signi cant role in nding employment. Contractors play a major role in providing employment to local migrants and they often work as agents, who may also be workers themselves. Direct recruitment by employers is negligible.
Figure 3.10: Role of various agencies helping returning migrants in re-integration (in %)
Source 15: Field Survey, 2017
The government clearly has played a limited role in the re-integration of migrants in the domestic labour market.
It is also important to note that the consequences of sub-contracting in the construction sector are clearly identi able. There is a decline in the directly employed workforce and a corresponding increase in the number of workers employed through petty sub-contractors and middlemen. Since the large contractors have stopped employing workers directly and are engaging in multiple levels of sub-contracting to meet the demand for labour as and when required, the experience and skills gained by the returning migrants in the Gulf is hardly valued.

21
Sub-contracting also does not allow any kind of unionization and hence the workers are not able to put forth their demands in an organized manner. Though some of the central trade unions are working among the ordinary construction workers, very few are engaged in addressing the precarious conditions of work that the returning migrants are engaged in. There are hardly any demands being made by unions regarding better wages and working conditions, with special reference to the returning migrants and the skills they bring. With no organizational backing, the returning migrants have hardly been able to engage in collective bargaining either with the industry or the state. Of all the four research sites, the study only observed some attempts at collective bargaining by the returning migrants in Jagtiyal, which was dominated by masons. They have submitted memoranda to the district administration with demands related to work and welfare, but nothing concrete has been achieved as a result. They have also raised the issue of compensation for those workers who die in the Gulf due to accidents on the work sites or other reasons.
This makes the returning migrant workers more vulnerable in the labour market. They move from one worksite to another, either linked with the some middlemen or on their own. The middlemen, in order to keep their chain of exploitation strong, do not value their skills gained in the Gulf and keep their wages low.
3.5 FUTURE PLANS
Faced with such limited work opportunities, increasing casualisation and lack of formal support in re-integration, 46 per cent of the respondents reported to have plans to return to the Gulf in search for employment. While respondents from East Godavari (67 per cent), Gorakhpur (61 per cent) and Jagtiyal (58 per cent) have higher proportion of respondents who planned to re-emigrate, only 25 per cent of those working in the NCR had similar plans to re-emigrate. This also corroborates the earlier nding that a majority of the regular salaried/wage employment is found only in the NCR.
Figure 3.11: Willingness of returning migrants to re-emigrate to the Gulf (in %)
Source 16: Field Survey, 2017
Internal migrants also want to move to the Gulf for higher wages but are unable to do so due to lack of nances.
67
25
61 58 54
East GodavariEast Godavarit Godavari, , 3333
NCR, 75
GoGoorakhpur, 3939 JJagtiyal, 2242 All, 46
0
20
40
60
80
100
120
East Godavari NCR Gorakhpur Jagtiyal All
Don't want to go back Want to go back

22 ECONOMIC RE-INTEGRATION OF RETURNING MIGRANTS IN THE CONSTRUCTION SECTOR IN INDIA
3.6 SKILLS ACQUIRED IN THE GULF AND ITS SPILL-OVER IN INDIA
One of the other important objectives of the study was to examine whether the skills and knowledge possessed by returning migrants bene t other workers in the construction sites and how these returning migrants pass it on to other workers. The study also inquired into whether there were any other spillover bene ts.
The study found that 57 per cent of the respondents claimed to have acquired new skills while working in the Gulf (Figure 3.12), beyond those skills they already possessed before migration. The highest proportion of such respondents was from the NCR (76 per cent) followed by Jagtiyal (73 per cent) and Gorakhpur (41 per cent). The proportion of respondents from East Godavari reporting to have acquired new skills in the Gulf was low (13 per cent). Of those who have acquired new skills, 95 per cent gained them ‘on the job’ and only 4 per cent have undergone formal training (Figure 3.13). Regarding the perception of returning migrants about their skills as compared to those of internal migrants, more than 39 per cent said that they are better skilled than internal migrant workers (Figure 3.14). In fact, nearly two-third of the respondents are reported to have helped other co-workers to learn new skills (Figure 3.14).
Figure 3.12: New skills acquired while working in the Gulf
Source 17: Field Survey, 2017
Figure 3.13: Means of acquiring new skills (%)
Source 18: Field Survey, 2017
13
76
41
7357
8787
24
59
272743
0
20
40
60
80
100
East Godavari NCR Gorakhpur Jagtiyal Total
Acquired Didn’t acquire

23
Figure 3.14: Perceptions about skill acquired and spillover (per cent)
Source 19: Field Survey, 2017
Most of the returning migrant workers reported that they had helped more than one worker in acquiring new skills (Table 3.1). Most of these returning migrant workers are engaged in structure building activities such as shuttering, bar-bending, and carpentery as casual workers. Because of the difference between high-end technological activities in India and the Gulf, the skills relating to nishing and interior preparation is of limited use in India and, hence, the spillover of these activities seems to be limited.
Table 3.1: Number of workers helped by returning migrants in India
Number of workers helped Number of returning migrants
1 to 3 40
4 to 10 40
11 to 20 17
more than 20 6
Source 20: Field Survey, 2017
3.7 SKILL PREMIUM: DOES BETTER SKILL LEAD TO BETTER EMPLOYMENT AND WAGES?
It has been found that in most of the cases, skill training before migration is the pre-condition of migration. The surveys of skill training centres that are operated by private agents provide the aspirants with the basic information needed for work in the desired trade. Each candidate has to undergo a selection process that involves practical as well as theoretical knowledge. The recruitment agents from construction companies recruit workers for desired trades at these centres after testing their skills. Therefore, it can be assumed that the returning migrants had some skills in a particular trade before their migration. Further, a majority of the sampled returning migrants have worked in the Gulf for more than ve years, where 57 per cent of them reported to have acquired new skills. Therefore, it is fair to assume that returning migrants are comparatively better skilled and able to command better wages and working conditions. The skill premium of returning migrants is measured in terms of their perception about working conditions, wages and level of satisfaction. Surprisingly, the study nds that 96 per cent of the respondents reported no difference in their wages as compared to the internal migrants (Figure 3.15). Further, 99 per cent of respondents have said that there is no special advantage at the work site. As a result, 81 per cent of the workers have said that they are not satis ed with their current employment.

24 ECONOMIC RE-INTEGRATION OF RETURNING MIGRANTS IN THE CONSTRUCTION SECTOR IN INDIA
Figure 3.15: Perceptions of returning migrants about skill premium in India
Source 21: Field Survey, 2017
Figure 3.16: Perception of returning migrants about skill training and work experience
Source 22: Field Survey, 2017
When asked what, according to them, is more important in nding a better job, 89 per cent of the respondents cited work experience as a signi cant factor in determining the type of employment. Only 11 per cent responded that skill training is more important. This clearly shows that a majority of the jobs available in the construction sector value work experience over skill training. Only highly technical jobs such as engineering, architect, foreman etc. need skill training prior to work engagement. However, the proportion of such jobs is very low.
These ndings also corroborate the earlier nding that a majority of the respondents have attained work training through informal channels such as on the job training or with the help of co-workers rather than formal training
3.8 ASPECTS OF SELF-EMPLOYMENT
As a signi cant proportion of returning migrants are currently engaged in self employment, it is essential to examine the quality of self-employment opportunities. Self-employment can be viewed as an independent source of livelihood, but most literature on this issue shows that these activities are done on a very small scale, with very low remuneration.43 Subsistence entrepreneurship forms a major part of such activities in India where a large segment of population (52 per cent) is self-employed.44 43 Cho et al. (2016)44 This data has been taken from the report on Key Indicators of Employment and Unemployment in India, 68th round of Employment and
Unemployment Survey of NSSO, 2011-12.
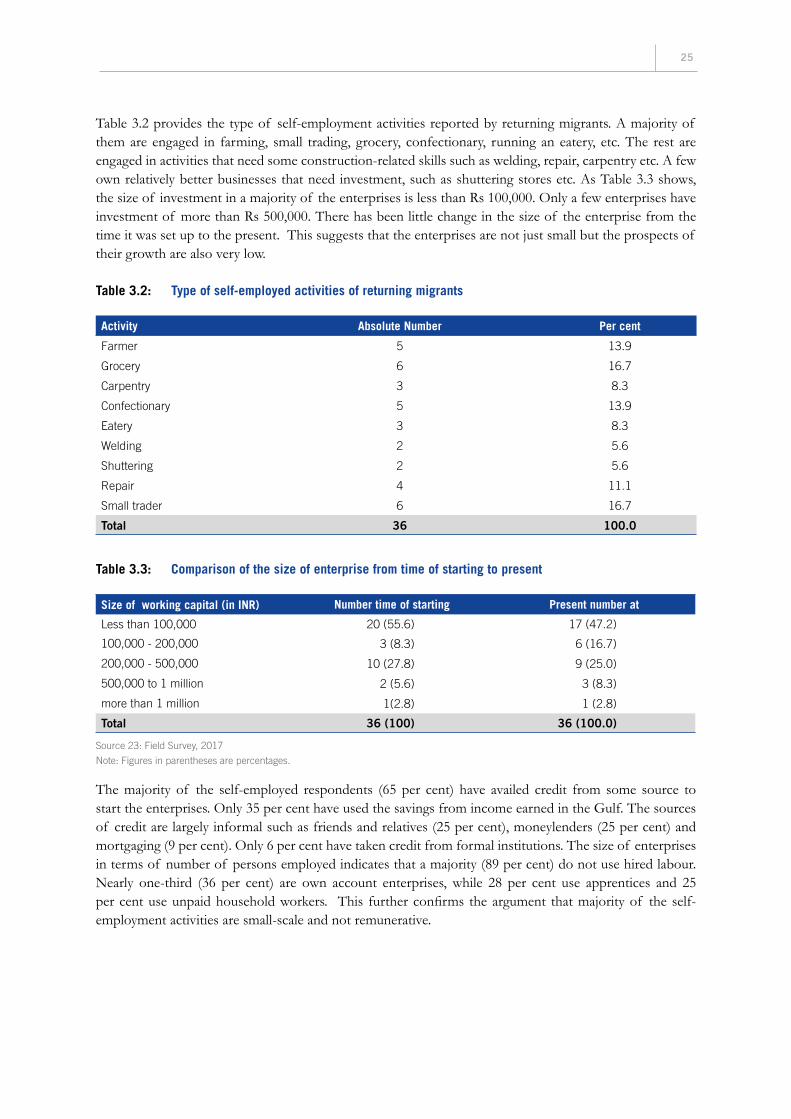
25
Table 3.2 provides the type of self-employment activities reported by returning migrants. A majority of them are engaged in farming, small trading, grocery, confectionary, running an eatery, etc. The rest are engaged in activities that need some construction-related skills such as welding, repair, carpentry etc. A few own relatively better businesses that need investment, such as shuttering stores etc. As Table 3.3 shows, the size of investment in a majority of the enterprises is less than Rs 100,000. Only a few enterprises have investment of more than Rs 500,000. There has been little change in the size of the enterprise from the time it was set up to the present. This suggests that the enterprises are not just small but the prospects of their growth are also very low.
Table 3.2: Type of self-employed activities of returning migrants
Activity Absolute Number Per cent
Farmer 5 13.9
Grocery 6 16.7
Carpentry 3 8.3
Confectionary 5 13.9
Eatery 3 8.3
Welding 2 5.6
Shuttering 2 5.6
Repair 4 11.1
Small trader 6 16.7
Total 36 100.0
Table 3.3: Comparison of the size of enterprise from time of starting to present
Size of working capital (in INR) Number time of starting Present number at
Less than 100,000 20 (55.6) 17 (47.2)
100,000 - 200,000 3 (8.3) 6 (16.7)
200,000 - 500,000 10 (27.8) 9 (25.0)
500,000 to 1 million 2 (5.6) 3 (8.3)
more than 1 million 1(2.8) 1 (2.8)
Total 36 (100) 36 (100.0)
Source 23: Field Survey, 2017
Note: Figures in parentheses are percentages.
The majority of the self-employed respondents (65 per cent) have availed credit from some source to start the enterprises. Only 35 per cent have used the savings from income earned in the Gulf. The sources of credit are largely informal such as friends and relatives (25 per cent), moneylenders (25 per cent) and mortgaging (9 per cent). Only 6 per cent have taken credit from formal institutions. The size of enterprises in terms of number of persons employed indicates that a majority (89 per cent) do not use hired labour. Nearly one-third (36 per cent) are own account enterprises, while 28 per cent use apprentices and 25 per cent use unpaid household workers. This further con rms the argument that majority of the self-employment activities are small-scale and not remunerative.

26 ECONOMIC RE-INTEGRATION OF RETURNING MIGRANTS IN THE CONSTRUCTION SECTOR IN INDIA
Figure 3.17: Sources of funds for self-employment
Source 24: Field Survey, 2017
Figure 3.18: Percentage distribution of enterprises by number of workers employed
Source 25: Field Survey, 2017
3.9 DETERMINANTS OF CURRENT USUAL ACTIVITY OF THE RETURNING MIGRANTS
To understand what determines the status of returning migrants as being integrated or not integrated in the domestic economy, we estimate a Logistic model with the choices of available usual activity that the returning migrants are engaged in currently, namely: regular salary/wage employment (Model I), casual labour (Model II), self-employment (Model III), unemployment (Model IV). We also need to keep in mind that the labour markets in India are characterized by the presence of a large informal sector, which work within the framework of social structures such as caste and gender and other labour market institutions, information asymmetries and segmentations.
Bank Loan , 6
Savings from Gulf,31
Mortgaging, 8
Moneylender, 22
Loan (Friends & Relatives), 22

27
Table: 3.3 Estimates of Logistic Regression Model
Variables Model-IRegular Emp=1
Model-IICasual Emp=1
Model-IIISelf-Emp=1
Model-IVUnemployed=1
Age 2.125 ** 1.002 * 1.099 0.956
Age-square 0.991 ** 0.850 * 0.999 1.000
Social group (ref-SC/ST)OBCGeneral
0.2342.578
0.6530.255 ***
1.9602.178
** 0.5550.440
Basic Edu.(Less than Primary)Primary to HS Degree/Diploma
7.659123.749
****
0.3080.062
******
1.719 1.381
* 2.2311.140
Technical Edu. (Yes=1) 0.074 299.51 0.056 *** 5.070
Vocational Edu.(Yes=1)
9.265 0.033 16.219 *** 0.404
Times of migration(more than 1=1)
2.550 0.898 1.755 0.361
Work Exp in Gulf (more than 2 years=1)
0.813 1.006 0.909 2.826 **
Location (Ref-East Godawari)NCRGorakhpurJagtiyal
8.482 0.025 0.016
** 4.8910.708
59.227
*** 0.0170.5090.021
*******
0.5864.9480.004
***
Model Information
N 252 252 252 252
Log -Likelihood 57.409 257.946 258.489 97.883
Pseudo R2 0.746 0.402 0.287 0.329
Prob>Chi2 118.403 *** 90.113 *** 57.994 *** 36.877 ***
Source 26: Computed from Field Survey Data, (2017).
***, ** and * indicate signifi cance at 5%, 10%, and 15% level.
Age: The positive sign of age of the returning migrants supports the hypothesis that older workers have more experience and hence demand for them would be higher than for younger workers. However, statistically the variable is signi cant only for Model I and Model II. It indicates that the older returning migrants are more likely to adopt regular salary/wage employment as well casual labour. However, this relationship is not signi cant for self-employment (Model III) and unemployment (Model IV).
Age squared: is the square of the age of the workers. It indicates that beyond a threshold age, returning migrants have lesser probability of adopting wage work, both regular and casual. Their reduced physical abilities reduces the demand for older workers, even if they are experienced.
Caste: does not emerge as highly signi cant. The most signi cant relationship of caste that comes up shows that returning migrants from the OBC category are more likely to adopt self-employment activities as compared to those from the SC/ST category (Model III) and that those belonging to the general castes are less likely to work as casual labour (Model II).
Education and Skill: Returning migrants who have been educated up to primary and higher secondary level are more likely to adopt regular employment and self-employment. As the education level increases

28 ECONOMIC RE-INTEGRATION OF RETURNING MIGRANTS IN THE CONSTRUCTION SECTOR IN INDIA
to degree-level, the probability of having regular employment becomes very high. Returning migrants with technical education are more likely to either engage in casual employment or remain unemployed but the results are not found to be statistically signi cant. Also, they are less likely to adopt self-employment activities. Likewise, vocational education does not in uence the wage work (both regular and casual) activity of the returning migrant, but those who have vocational training are more likely to adopt self-employment activity.
Work Experience and Skill: Work experience of more than two years in the Gulf does not ensure any kind of employment activity after return. However, the probability of unemployment is found to be higher and statistically signi cant. This indicates that the construction sector is not providing suf cient employment based on the speci c skills of the returning migrants. Further, even the number of times a worker has migrated also does not ensure any type of employment activity.
Regional Dynamics: Returning migrants who are working in the NCR have more chances of taking up both casual as well as regular work as compared to that of returning migrants from East Godavari. While their chances of regular employment are higher than casual work, the chances of engaging in self-employment are very low. Returning migrants in Gorakhpur and Jagtiyal show lesser chances of taking to self-employment activities as compared to those from East Godavari. Further, the probability of being unemployed becomes higher if a returning migrant is based in Gorakhpur.

29
4. Conclusion and recommendations
The study challenges the perceived notion that the skills and experience gained abroad have an impact on return, and contribute to the development of a country of origin. It may be true in certain labour markets, perhaps where labour shortages are apparent and higher skills genuinely in demand, or where there is a shift from labour-intensive to higher productivity and technological approaches.
Most of the returning migrants interviewed are shifting between casual labour and self-employment because of a lack of regular employment options. As a result of this uncertainty in the job market, nearly half of the respondents (46 per cent) are willing to re-migrate to the Gulf. While the shift from casual labour to self-employment seems encouraging, it is important to note that 89 per cent are own-account enterprises and 60 per cent of them have taken credit from informal sources.
Some of the broad conclusions that can be drawn from this study are:• There is no signi cant difference in the availability of work for workers returning from the Gulf and
for internal migrant workers. Both groups face equal levels of under-employment. The level of wages, conditions of work and terms of employment is also the same.
• Most of the returning migrants have to choose between casual labour and self-employment, or remain unemployed.
• There is hardly any change in the amount of regular salary/wage employment before workers migrate to the Gulf and after their return.
• The majority of the returning migrants found employment through informal networks of contractors, family and co-workers. The government plays a minimal role in supporting migrants’ economic reintegration.
• Most of those who are currently self-employed used to be self-employed even before they migrated. They are running micro enterprises (89 per cent are own-account enterprises) that give very low returns.
• Due to uncertainty in the domestic job market, nearly half of the respondents have expressed their desire to re-migrate to the Gulf.
• The study nds that there is hardly any evidence to prove that the construction industry in India values the skills gained by the workers in the Gulf. One of the main reasons for this lack of appreciation is the practice of sub-contracting. There is a complete disconnect between the workers at the bottom of sub-contracting chain and the construction conglomerates at the top. The sub-contractors demonstrate little concern about the skill levels of the workers they recruit.
The study recommends more research and analysis to inform policy on skills and migration, including for women migrants and migrants in other sectors. The current policy discourse in support of circular migration highlights the value of skills learnt in destination as part of the gains that accrue to migrant workers and origin countries. However, this discourse often does not take into account the realities of the domestic labour market. As shown in this study, the full and long-term bene ts of skills development for migrants cannot accrue in the current environment until some of the following measures are taken:

30 ECONOMIC RE-INTEGRATION OF RETURNING MIGRANTS IN THE CONSTRUCTION SECTOR IN INDIA
RECOMMENDATIONS FOR THE INDIAN GOVERNMENT AT CENTRAL AND STATE LEVELS: • Collect better data on the skills of migrant workers prior to departure and on return. This will strengthen
understanding of the skills attained by the workers during their time in the Gulf, and facilitate placement into new employment opportunities within India or abroad.
• Invest in public employment services and access to Recognition of Prior Learning (RPL) (skills testing and training) for migrant workers to enable them to nd jobs that take into account their skills - either within the domestic labour market or overseas.
• Engage in a series of dialogues with construction industry associations, throughout the sub-contracting chain, to better understand the decision making around recruitment and employment of skilled workers – and increase opportunities for returning migrants with skills.
• Ensure that investments made into training migrant workers re ect the needs of the country to ensure those workers have longer-term career opportunities (at home or by re-migrating), rather than just being trained for a short-term contract overseas.
• Train returning migrants to be future trainers – within government and private institutions and on site. Returning migrants are more likely to have experience working on more advanced technologies that are increasingly being introduced onto construction sites in India.
• Further study the impact of migration on development, on the individual migrant, their families and communities of origin.
• Through bilateral agreements with countries of destination, call on the employers in destination to issue certi cates of employment highlight the skills level and work tasks.
RECOMMENDATIONS FOR THE CONSTRUCTION INDUSTRY IN INDIA:• Clearly articulate to local and central authorities the skills gaps that exist, so that efforts can be con ned
to have returning migrants ll them. • Register all employees and provide experience certi cate to all employees, specifying the terms of
employment and work accomplished. • Build a culture in which workers’ skills and quality on site is respected• From the highest levels, take on a more active, oversight role in the recruitment of workers. The
sub-contracting chain de-values skills and experience, which has a direct impact on quality, safety and timeliness.
RECOMMENDATIONS FOR TRADE UNIONS AND CIVIL SOCIETY IN INDIA:• Build partnerships amongst themselves to enhance services for migrants at all stages of the migration
cycle. Trade unions should consider expanding membership to construction workers overseas.• Encourage the formation of self-help groups that can also assist with information and support services
in reintegration. • Strengthen dialogue with government of ces at all levels to introduce policy and programmatic
responses around reintegration.

31
References
• Abdul-Aziz, A.R. Site operatives in Malaysia: Examining the foreign-local asymmetry. Unpublished report for the Sectoral Activities Programme, ILO, Geneva.
• Bhattacharyya, S. K., & Korinek, K. 2007. “Opportunities and vulnerabilities of female migrants in construction work in India” in Asian and Pacifi c Migration Journal, Vol. 16, pp. 511-531, No. 4.
• Bosch, G., & Philips, P. 2003. Building chaos: an international comparison of deregulation in the construction industry. (New York and London, Routledge).
• Buckley, M., Zendel, A., Biggar, J., Frederiksen, L. & Wells, J. 2016. Migrant work and employment in the construction sector. International Labour Offi ce, Sectoral Policies Department, Conditions of Work and Equality Department, Geneva.
• Cho, S. H., Fang, X., Tayur, S. R., & Xu, Y. 2016. Combating child labor: Incentives and information transparency in global supply chains. Available at: www.ssrn.com/abstract=2552268 [25 October 2017].
• S Choudhary: “DLF looks to bring home 20,000 migrant workers” in The Economic Times, 5 Nov. 2007.
• Connolly, P. 2001. Recent trends in the Mexican construction industry and outlook for the 21st century: Its Image, employment prospects and skill requirements. Unpublished report for ILO.
• Dhall, S.C. 2008. “Manpower crunch upsets construction companies.” in The Tribune, 5 January, Chandigarh, India.
• Erlich, M., & Grabelsky, J. 2005. “Standing at a crossroads: The building trades in the twenty-fi rst century” in Labor History, Vol. 46, No. 4, pp. 421-445.
• Gann, D. 1996. “Construction as a manufacturing process? Similarities and differences between industrialized housing and car production in Japan” in Construction Management and Economics, Vol.14, No.5, pp. 437-450.
• Gunawardane, N. D. & Jayawardena, A. K. W. 1998. “Construction workers in developing countries” in Construction Management and Economics, Vol. 16 No. 5, pp. 521-530.
• Hajela, R. 2012. Shortage of skilled workers: A paradox of the Indian economy. SKOPE Research Paper No. 111 November 2012, COMPAS, University of Oxford.
• ILO. The construction industry in the 21st century: Its image, employment prospects and skill requirements. Geneva 2001.
• Jason, A. 2005. Informal construction workers in Dar es Salaam, Tanzania, ILO Sectoral Activities Programme Working Paper Series (Geneva, ILO).
• Jatrana, S., & Sangwan, S. K. 2004. “Living on site: health experiences of migrant female construction workers in North India” in Asian and Pacifi c Migration Journal, Vol. 13 No. 1., pp. 61-87.
• Kapsos, Steven. 2005. The employment intensity of growth: Trends and macroeconomic determinants. Employment Strategy Papers. (Geneva, ILO).
• Khurana, S. 2016. “Resisting labour control and optimizing social ties: Experiences of women construction workers in Delhi” in Work, Employment & Society. pp. 1-16
• Mitullah, W. & Wachira, I.N. 2003. Informal labour in the construction industry in Kenya: A case study of Nairobi. ILO Working Paper, No. 204 (Geneva, ILO).
• Ofori, G., Leong, C., & Pin, T. 2002. “Impact of foreign contractors on Singapore construction industry: a qualitative study” in Engineering Construction and Architectural Management, Vol. 9 No. 1, 1pp. 6–28.
• Pearson, M. & Sharma, M. 2011. “Where are India’s skilled workers?” in Bloomberg Businessweek, 6 January, accessed at https://www.bloomberg.com/news/articles/2011-01-06/where-are-indias-skilled-workers.
• Rajalakshmi, T K. 2017. “Chasing a Mirage”, in Frontline, October 11. Accessed at http://www.frontline.in/cover-story/chasing-a-mirage/article9896544.ece

32 ECONOMIC RE-INTEGRATION OF RETURNING MIGRANTS IN THE CONSTRUCTION SECTOR IN INDIA
• Rogaly, B., Biswas, J., Coppard, D., Rafi que, A., Rana, K., & Sengupta, A. 2001. “Seasonal migration, social change and migrants’ rights: lessons from West Bengal” in Economic and Political Weekly, Vol. 36, No. 49, pp. 4547-4559.
• Rogaly, B., Coppard, D., Safi que, A., Rana, K., Sengupta, A., & Biswas, J. 2002. “Seasonal migration and welfare/illfare in eastern India: a social analysis” in Journal of Development Studies, Vol. 38 No. 5, pp. 89-114.
• Ruthven, Orlanda. 2017. “How to ‘Skill India’ when the jobs are bad” in The Wire, September 11 (https://thewire.in/175882/skill-india-narendra-modi-jobs-in-india-unemployment/)
• Saboia, J. 1997. “Contract labour in the Brazilian construction industry” in Contract Labour: Looking at Issues, Nine Country Studies. Labour Education 106/7. (Geneva. ILO).
• Sasikumar, S. K., & Thimothy, R. 2015. From India to the Gulf region: Exploring links between labour markets, skills and the migration cycle. (Geneva, ILO). Accessed from: http://www.ilo.org/wcmsp5/groups/public/---asia/---ro-bangkok/---sro-new_delhi/documents/publication/wcms_397363.pdf.
• Saxena, P. K. & S K Yadav. 2013. Employment intensity of output: An analysis of non-agriculture sectors. Report No. 13 (New Delhi, Institute of Applied Manpower Research).
• Smita & Panjiar, P. 2007. Locked homes, empty schools: The impact of distress seasonal migration on the rural poor. (New Delhi, Zubaan).
• Srivastava, R. & Dasgupta, R. 2010. Small steps, large beginnings. (New Delhi. The America India Foundation).
• Srivastava, R. 2011. Internal migration in India: An overview of its features, trends, and policy challenges. National Workshop on Internal Migration and Human Development in India, 6–7 December 2011, Workshop Papers, Vol. 2, pp. 1-47). (New Delhi, UNICEF).
• Srivastava, R. & Sasikumar, S. K. 2003. “An overview of migration in India, its impacts and key issues”. Paper presented at the Regional Conference on Migration, Development and Pro-Poor Policy Choices in Asia, 22–24 June (Dhaka, Bangladesh).
• Srivastava, R & Sutradhar, R. 2016. “Labour migration to the construction sector in India and its impact on rural poverty” in Indian Journal of Human Development, Vol. 10 No. 1, pp. 27-48.
• Srivastava, R. S. & Jha, A. 2016. Capital and labour standards in the organized construction industry in India: A study based on fi eldwork in the Nation Capital Region of Delhi. New Delhi. Jawaharlal Nehru University, Centre for the Study of Regional Development.
• Vaid, K.N. 1999. “Contract labour in the construction industry in India” in D.P. A. Naidu (ed.) Contract labour in South Asia (Geneva, Bureau for Workers’ Activities, ILO).
• Van der Loop, T. 1992. Industrial dynamics and fragmented labour markets: Construction fi rms and labourers in India. Netherlands Geographical Studies 139. Royal Dutch Geographical Society Utrecht/Department of Human Geography, University of Amsterdam.
• V. Verma: Sampling elusive population: Applications to studies of child labour (Geneva, ILO, International Programme on the Elimination of Child Labour, Department of Statistics, 2013).
• Wells, J. 1996. “Labour migration and international construction” in Habitat International, Vol. 20 No. 2, pp. 295-306
• Wells, J. 2007. “Informality in the construction sector in developing countries” in Construction Management and Economics Vol. 38, No. 5, pp. 87-93.
• Women in Informal Employment: Globalizing and Organizing (WIEGO). 2017. Construction Workers. Accessed at http://www.wiego.org/informal-economy/occupational-groups/ construction-workers.
• Yoon, Jin Ho and Kang, Byung Gu. 2000. The structure of employment in the Korean construction industry. Paper presented at an International conference on Structural Change in the Building Industry’s Labour Market, Working Relationships and Challenges in the Coming Years, Gelsenkirchen, Germany, Institut Arbeit und Technik.
• Yuson, A. S. The Philippine construction industry in the 21st century: is there a globalisation of the local construction industry. Unpublished report for ILO, Sectoral Activities Programme, Geneva 2001.
• Zylberstajn, Helio. 1992. The construction industry in Brazil: Surviving the transition to a competitive market. Working paper No. 52 for ILO, Sectoral Activities Programme. Geneva.
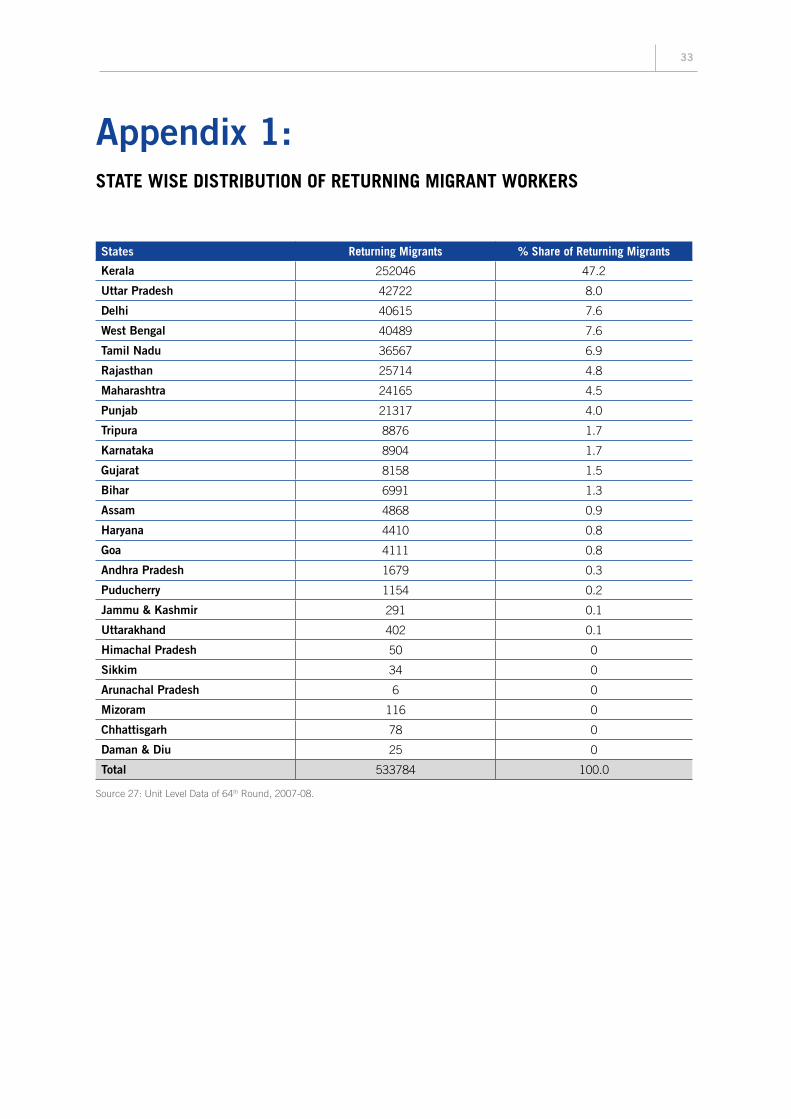
33
Appendix 1: STATE WISE DISTRIBUTION OF RETURNING MIGRANT WORKERS
States Returning Migrants % Share of Returning Migrants
Kerala 252046 47.2
Uttar Pradesh 42722 8.0
Delhi 40615 7.6
West Bengal 40489 7.6
Tamil Nadu 36567 6.9
Rajasthan 25714 4.8
Maharashtra 24165 4.5
Punjab 21317 4.0
Tripura 8876 1.7
Karnataka 8904 1.7
Gujarat 8158 1.5
Bihar 6991 1.3
Assam 4868 0.9
Haryana 4410 0.8
Goa 4111 0.8
Andhra Pradesh 1679 0.3
Puducherry 1154 0.2
Jammu & Kashmir 291 0.1
Uttarakhand 402 0.1
Himachal Pradesh 50 0
Sikkim 34 0
Arunachal Pradesh 6 0
Mizoram 116 0
Chhattisgarh 78 0
Daman & Diu 25 0
Total 533784 100.0
Source 27: Unit Level Data of 64th Round, 2007-08.

34 ECONOMIC RE-INTEGRATION OF RETURNING MIGRANTS IN THE CONSTRUCTION SECTOR IN INDIA
Notes


Economic re-integration of returning migrants in the construction sector in India
This report examines the issue of re-integration of Indian migrants who had been working in the construction industry in the Gulf. Based on primary interviews with over 250 returnee migrants, the report assesses whether the skills gained through work experience abroad increases the employability of migrants in their home country. The report also examines how the construction industry in India views returning migrants and whether there is any preference for their skills, knowledge and experience.
ILO DWT for South Asia and Country Office for India (DWT/CO-New Delhi) India Habitat Centre Core 4B, 3rd Floor Lodhi Road New Delhi – 110003 India Tel.: +91-11 4750-9200 Fax: +91-11 2460-2111 ISBN 978-92-2-131544-5 (print) Website: www.ilo.org/India 978-92-2-131545-2 (web pdf)