economic reliability group acceptance sampling plan for ... 6.pdf · reliability group acceptance...
TRANSCRIPT

ISSN 1684-8403
Journal of Statistics
Volume 17, 2010, pp. 66-76
__________________________________________________________________
Economic Reliability Group Acceptance Sampling Plan for
Truncated Life Test Having Weibull Distribution
Abdur Razzaque Mughal1, Amina Shahzadi
2, Muhammad Hanif
3
and Usman Ali4
Abstract
In this paper, economic reliability test plan (ERTP) is developed for a Truncated
Life test when the lifetime of a product follows Weibull Distribution. Two point
approach was adopted to find the design parameters such as the minimum
termination time and the probability of lot acceptance by satisfying the producer’s
and the consumer’s risks, while the sample size and acceptance number are
specified. Comparison of proposed plan has been made with the existing plan
developed by Aslam and Jun (2009). The results are illustrated by tables and
examples.
Keywords
Weibull distribution, Producer’s risk, Truncated life test, Operating
characteristics, Reliability sampling plan
1. Introduction
Economic reliability test plan (ERTP) based on Truncated Life test when the
lifetime of a product follows Weibull Distribution are considered essential and
pre-requisite to assess the trustworthiness of a product with regard to its lifetime.
The main object of such a test is to determine an estimated life of a product.
When we are able to establish the estimated (mean) life of an article, it would help
1 Department of Statistics, Pak Shama College, Doha, Qatar.
Email: [email protected] 2 Department of Statistics, Government College University, Lahore, Pakistan
3 Department of Mathematics, Lahore University of Management Sciences, Lahore, Pakistan
4 Department of Statistics, Government Degree College, Narang, Pakistan

Economic Reliability Group Acceptance Sampling Plan for Truncated Life Test Having
Weibull Distribution
_______________________________________________________________________________
67
us to reach at a definite conclusion as to whether the submitted lot may be
accepted or rejected. In case, it is observed that the mean life of a product is above
the required standard, the submitted lot is accepted otherwise the same is rejected.
Hence, there is a need of the time to introduce (ERTP) for a life test using
inspection of a multiple number of products at a time on the basis of the facility
available to the experimenter for conducting such tests. For instance, if the
experimenter has the facility of testers which can inspect a group 10 product at
one time, then he would need 10 similar testers to carry out inspection of 100
products at a time. The main advantage of the group acceptance sampling plan is
that it provides the strict inspection before it is sent to the consumer for use. The
other benefit is that it is more economical than an ordinary sampling plan because
sufficient time, cost, energy and labor are saved in group sampling plan. Being
economical, it is proposed to introduce (ERTP) for life tests using group
acceptance sampling plan. The object of this paper is to reduce and save the
experimental time in view of the given design parameters and satisfying both the
consumer’s as well as the producer’s risks. The design of the (ERTP) is given in
section 2 with illustration given in section 3. In section 4, we have made an effort
to compare the proposed plan with existing one.
2. Design of ERTP
We are concerned to develop an Economic Reliability Test Plan (ERTP) to assure
that the mean life of product in a lot is higher than the specified life 0 .We will
reject the lot if at certain quality levels, otherwise accept the lot. The
group acceptance sampling plan based on Truncated Life tests proposed by Aslam
et al. (2010 a & b) is:
Determine the group size g . Sample gr products from a lot randomly and
allocate r items to each group for the life test.
The required sample size in the life test is rgn . Determine the
acceptance number c for every group and specify the termination time of
the life test 0t
Implement the life test based on the g groups of products, simultaneously.
Accept the lot if at most c failed products are found in every group by the
termination time. Truncate the life test and reject the lot if more than c
failures are found in any group.

68 Mughal, Shahzadi, Hanif and Ali
_______________________________________________________________________________
If 1r , the proposed Economic Reliability Test Plan (ERTP) reduces to the
Ordinary Acceptance Sampling Plan. We are interested in determining the
minimum termination time which satisfies both the risks, whereas the sample size
and acceptance number are pre-assumed. Consider that the life time of a product
follows Weibull Distribution, then its Distribution function is
0exp1),:(
t
tmtF
m
(2.1)
where and m are the scale and shape parameters respectively. The mean of
this distribution is:
mm
1 (2.2)
Suppose, that the lot size is large, so Binomial Distribution could be applied (see,
Stephens (2001) for more justification). The submitted lot is accepted, if c or less
failure occurs in every group. The probability of accepting the submitted lot will
be:
g
c
i
iri ppi
rpL
0
1 (2.3)
where p denotes the probability that a product fails before the termination time.
For simplification, we will assume that the test termination time as a multiple of
the pre-specified value of 0 which is written as 00 at . So,
mm
m
m
m
ma
tp
1exp1exp1
0
0
(2.4)
The quality standard of a product can be representing the ratio of its expected
lifetime to the specified life 0 . The probability of rejecting a good lot is the
producer’s risk and the probability of accepting a bad lot is the consumer’s risk
denoted by and respectively. The objective of this research article is to
increase the lot acceptance probability and reduce the experimental time in view
of the given designed parameters. No attention from the researchers has been paid
to propose an Economic Reliability Group Acceptance Sampling Plan for
Economic Reliability Group Acceptance Sampling Plan for Truncated Life Test Having
Weibull Distribution
_______________________________________________________________________________
69
Truncated Life test having Weibull Distribution assuming that the lifetime of a
product basis this distribution with known shape parameters.
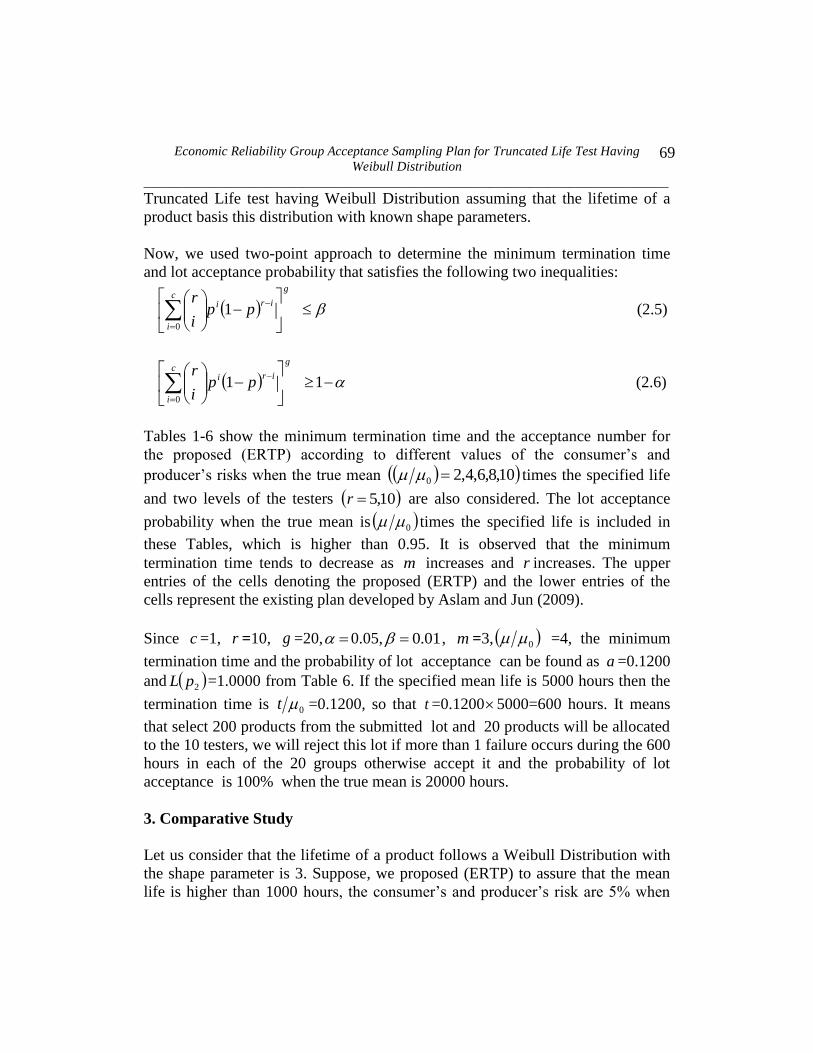
Now, we used two-point approach to determine the minimum termination time
and lot acceptance probability that satisfies the following two inequalities:
g
iric
i
ppi
r1
0
(2.5)
11
0
gc
i
iri ppi
r (2.6)
Tables 1-6 show the minimum termination time and the acceptance number for
the proposed (ERTP) according to different values of the consumer’s and
producer’s risks when the true mean 10,8,6,4,20 times the specified life
and two levels of the testers 10,5r are also considered. The lot acceptance
probability when the true mean is 0 times the specified life is included in
these Tables, which is higher than 0.95. It is observed that the minimum
termination time tends to decrease as m increases and r increases. The upper
entries of the cells denoting the proposed (ERTP) and the lower entries of the
cells represent the existing plan developed by Aslam and Jun (2009).
Since c =1, r =10, g =20, 0.05, 01.0 , m =3, 0 =4, the minimum
termination time and the probability of lot acceptance can be found as a =0.1200
and 2pL =1.0000 from Table 6. If the specified mean life is 5000 hours then the
termination time is 0t =0.1200, so that t =0.12005000=600 hours. It means
that select 200 products from the submitted lot and 20 products will be allocated
to the 10 testers, we will reject this lot if more than 1 failure occurs during the 600
hours in each of the 20 groups otherwise accept it and the probability of lot
acceptance is 100% when the true mean is 20000 hours.
3. Comparative Study
Let us consider that the lifetime of a product follows a Weibull Distribution with
the shape parameter is 3. Suppose, we proposed (ERTP) to assure that the mean
life is higher than 1000 hours, the consumer’s and producer’s risk are 5% when

70 Mughal, Shahzadi, Hanif and Ali
_______________________________________________________________________________
the true mean is 1000 hours and 4000 hours respectively. Since, m =3,
=0.05, r =5, =7, =0 and 0 =4 from Table 5 the minimum termination
time and the probability of lot acceptance are a =116 hours and 2pL =0.9994
respectively for the proposed (ERTP). We will choose a sample of 35 products
and allocate 5 products to the 7 groups; we accept the lot and conclude that the
mean life is higher than 1000 hours if no failure occurs during the 116 hours. For
the same design parameters, the existing plan developed by Aslam and Jun (2009)
require 500 hours to reach the same decision and the probability of lot acceptance
is 2pL =0.9525 which is also less than the proposed (ERTP). Now we may
conclude that the proposed plan is more efficient and economical in the sense of
saving cost, time, energy and labor.
Acknowledgements
The authors thank the Chief Editor and reviewers for their useful comments which
helped to improve the quality of this paper.
References
1. Aslam, M., Mughal, A.R., Ahmed, M., and Zafaryab (2010a).Group
acceptance sampling plans for pareto distribution of the second kind. Journal
of Testing and Evaluation, 38(2), 1-8.
2. Aslam, M., Mughal, A.R., Hanif, M., and Ahmed, M. (2010b). Economic
reliability group acceptance sampling based on truncated life tests using
pareto distribution of the second kind. Communications of the Korean
Statistical Society, 17(5),725–732.
3. Aslam, M. and Jun, C.-H. (2009). A group acceptance sampling plan for
truncated life test having Weibull distributions. Journal of Applied Statistics,
36(9), 1021-1027.
4. Stephens, K. S. (2001). The Handbook of Applied Acceptance Sampling:
Plans, Procedures and Principles. ASQ Quality Press. Milwaukee, WI.
,
g c

Economic Reliability Group Acceptance Sampling Plan for Truncated Life Test Having
Weibull Distribution
_______________________________________________________________________________
71
Table 1: Minimum Termination Time and the Probability
of Lot Acceptance ( m =1)
r =5
0.25
0 g c 2pL a 0 g c 2pL a
2 - - - - 2 - - - -
4 17 3 0.9863
0.9854
0.4920
0.5000 4 3 3
0.9741
0.9707
0.9640
1.0000
6 4 2 0.9833
0.9820
0.4870
0.5000 6 3 3
0.9936
0.9927
0.9636
1.0000
8 4 2 0.9925
0.9919
0.4870
0.5000 8 2 2
0.9900
0.9732
0.6930
1.0000
10 2 1 0.9746
0.9574
0.3780
0.5000 10 2 2
0.9946
0.9852
0.6930
1.0000
0.10
2 - - - - 2 - - - -
4 27 3 0.9771
0.9769
0.4988
0.5000 4 5 3
0.9575
0.9517
0.9619
1.0000
6 7 2 0.9730
0.9688
0.4744
0.5000 6 5 3
0.9894
0.9879
0.9620
1.0000
8 7 2 0.9878
0.9859
0.4745
0.5000 8 2 2
0.9787
0.9732
0.9170
1.0000
10 7 2 0.9935
0.9925
0.4750
0.5000 10 2 2
0.9883
0.9852
0.9170
1.0000
0.05
2 - - - - 2 - - - -
4 35 3 0.9704
0.9702
0.4993
0.5000 4 29 4
0.9854
0.9848
0.9895
1.0000
6 9 2 0.9649
0.9601
0.4770
0.5000 6 6 3
0.9856
0.9855
0.9970
1.0000
8 9 2 0.9841
0.9819
0.4770
0.5000 8 3 2
0.9743
0.9600
0.8460
1.0000
10 9 2 0.9916
0.9904
0.4770
0.5000 10 3 2
0.9859
0.9779
0.8460
1.0000
0.01
2 - - - - 2 - - - -
4 54 3 0.9551
0.9544
0.4980
0.5000 4 44 4
0.9778
0.9770
0.9920
1.0000
6 54 3 0.9899
0.9897
0.4980
0.5000 6 10 3
0.9792
0.9759
0.9590
1.0000
8 13 2 0.9754
0.9740
0.4899
0.5000 8 10 3
0.9926
0.9914
0.9590
1.0000
10 13 2 0.9869
0.9861
0.4899
0.5000 10 4 2
0.9770
0.9706
0.9130
1.0000

72 Mughal, Shahzadi, Hanif and Ali
_______________________________________________________________________________
Table 2: Minimum Termination Time and the Probability
of Lot Acceptance ( m =1)
r =10
0.25
0 g c 2pL a 0 g c 2pL a
2 27 6 0.9569
0.9568
0.4998
0.5000 2 20 8
0.9728
0.9712
0.9920
1.0000
4 2 3 0.9709
0.9559
0.4390
0.5000 4 1 4
0.9769
0.9511
0.8111
1.0000
6 1 2 0.9711
0.9600
0.4390
0.5000 6 1 4
0.9953
0.9891
0.8111
1.0000
8 1 2 0.9862
0.9807
0.4390
0.5000 8 1 3
0.9892
0.9777
0.8020
1.0000
10 1 2 0.9924
0.9893
0.4390
0.5000 10 1 3
0.9949
0.9892
0.8020
1.0000
0.10
2 209 7 0.9659
0.9658
0.4997
0.5000 2 32 8
0.9545
0.9843
0.9990
1.0000
4 6 4 0.9832
0.9799
0.4997
0.5000 4 2 5
0.9815
0.9787
0.9690
1.0000
6 3 3 0.9871
0.9827
0.4591
0.5000 6 2 4
0.9934
0.9783
0.7450
1.0000
8 2 2 0.9793
0.9617
0.3950
0.5000 8 1 3
0.9892
0.9777
0.8020
1.0000
10 2 2 0.9887
0.9786
0.3950
0.5000 10 1 3
0.9949
0.9892
0.8020
1.0000
0.05
2 272 7 0.9559
0.9557
0.4990
0.5000 2 22 9
0.9802
0.9802
0.9990
1.0000
4 7 4 0.9769
0.9766
0.4980
0.5000 4 3 5
0.9788
0.9683
0.9140
1.0000
6 4 3 0.9835
0.9770
0.4540
0.5000 6 2 4
0.9892
0.9777
0.8390
1.0000
8 2 2 0.9693
0.9617
0.4590
0.5000 8 1 3
0.9822
0.9777
0.9320
1.0000
10 2 2 0.9830
0.9786
0.4590
0.5000 10 1 3
0.9915
0.9892
0.9320
1.0000
0.01
2 315 8 0.9689
0.9685
0.4991
0.5000 2 45 9
0.9613
0.9607
0.9970
1.0000
4 11 4 0.9655
0.9634
0.4930
0.5000 4 4 5
0.9641
0.9579
0.9650
1.0000
6 6 3 0.9747
0.9658
0.4580
0.5000 6 3 4
0.9833
0.9676
0.8470
1.0000
8 6 3 0.9908
0.9874
0.4580
0.5000 8 2 3
0.9788
0.9559
0.7980
1.0000
10 3 2 0.9740
0.9681
0.4640
0.5000 10 2 3
0.9901
0.9786
0.7980
1.0000

Economic Reliability Group Acceptance Sampling Plan for Truncated Life Test Having
Weibull Distribution
_______________________________________________________________________________
73
Table 3: Minimum Termination Time and the Probability
of Lot Acceptance ( m =2)
r =5
0.25
0 g c 2pL a 0 g c 2pL a
2 32 2 0.9994
0.9670
0.2480
0.5000 2 5 3
0.9805
0.9785
0.9820
1.0000
4 6 1 0.9995
0.9913
0.2380
0.5000 4 1 1
0.9923
0.9792
0.7640
1.0000
6 6 1 0.9999
0.9982
0.2380
0.5000 6 1 1
0.9984
0.9955
0.7640
1.0000
8 2 0 0.9962
0.9698
0.1750
0.5000 8 1 1
0.9995
0.9985
0.7640
1.0000
10 2 0 0.9976
0.9866
0.1750
0.5000 10 1 1
0.9998
0.9994
0.7640
1.0000
0.10
2 531 3 0.9999
0.9866
0.2480
0.5000 2 9 3
0.9724
0.9617
0.9495
1.0000
4 10 1 0.9992
0.9856
0.2380
0.5000 4 2 1
0.9908
0.9588
0.6698
1.0000
6 10 1 0.9998
0.9971
0.2380
0.5000 6 2 1
0.9981
0.9911
0.6698
1.0000
8 3 0 0.9930
0.9550
0.1940
0.5000 8 2 1
0.9994
0.9971
0.6698
1.0000
10 3 0 0.9955
0.9710
0.1940
0.5000 10 1 0
0.9867
0.9615
0.5810
1.0000
0.05
2 591 3 0.9999
0.9851
0.2590
0.5000 2 11 3
0.9599
0.9534
0.9740
1.0000
4 13 1 0.9990
0.9813
0.2380
0.5000 4 2 1
0.9813
0.9588
0.8060
1.0000
6 13 1 0.9998
0.9962
0.2380
0.5000 6 2 1
0.9961
0.9911
0.8060
1.0000
8 13 1 0.9999
0.9988
0.2380
0.5000 8 2 1
0.9987
0.9971
0.8060
1.0000
10 4 0 0.9944
0.9615
0.1890
0.5000 10 1 0
0.9777
0.9615
0.7540
1.0000
0.01
2 1063 3 0.9999
0.9734
0.2480
0.5000 2 95 4
0.9843
0.9830
0.9870
1.0000
4 19 1 0.9984
0.9728
0.2440
0.5000 4 6 2
0.9961
0.9939
0.9191
1.0000
6 19 1 0.9997
0.9945
0.2440
0.5000 6 3 1
0.9938
0.9867
0.8160
1.0000
8 19 1 0.9999
0.9982
0.2440
0.5000 8 3 1
0.9980
0.9957
0.8160
1.0000
10 5 0 0.9895
0.9521
0.2310
0.5000 10 3 1
0.9992
0.9982
0.8160
1.0000

74 Mughal, Shahzadi, Hanif and Ali
_______________________________________________________________________________
Table 4: Minimum Termination Time and the Probability
of Lot Acceptance ( m =2)
r =10
0.25
0 g c 2pL a 0 g c 2pL a
2 16 3 0.9999
0.9913
0.2450
0.5000 2 2 4
0.9954
0.9594
0.7590
1.0000
4 2 1 0.9995
0.9875
0.2240
0.5000 4 1 2
0.9996
0.9898
0.5555
1.0000
6 2 1 0.9999
0.9974
0.2240
0.5000 6 1 1
0.9996
0.9813
0.3590
1.0000
8 1 0 0.9962
0.9698
0.1750
0.5000 8 1 1
0.9999
0.9937
0.3590
1.0000
10 1 0 0.9976
0.9806
0.1750
0.5000 10 1 1
1.0000
0.9974
0.3590
1.0000
0.10
2 26 3 0.9999
0.9775
0.2467
0.5000 2 2 4
0.9736
0.9594
0.9410
1.0000
4 3 1 0.9989
0.9813
0.2390
0.5000 4 1 2
0.9978
0.9898
0.7530
1.0000
6 3 1 0.9998
0.9961
0.2390
0.5000 6 1 1
0.9985
0.9813
0.5180
1.0000
8 3 1 0.9999
0.9988
0.2390
0.5000 8 1 1
0.9995
0.9937
0.5180
1.0000
10 2 0 0.9967
0.9615
0.1451
0.5000 10 1 1
0.9998
0.9974
0.5180
1.0000
0.05
2 34 3 0.9999
0.9707
0.2470
0.5000 2 5 5
0.9889
0.9827
0.9510
1.0000
4 4 1 0.9987
0.9751
0.2350
0.5000 4 1 2
0.9944
0.9898
0.8910
1.0000
6 4 1 0.9997
0.9948
0.2350
0.5000 6 1 1
0.9967
0.9813
0.6320
1.0000
8 4 1 0.9999
0.9983
0.2350
0.5000 8 1 1
0.9989
0.9937
0.6320
1.0000
10 2 0 0.9944
0.9615
0.1890
0.5000 10 1 1
0.9996
0.9974
0.6320
1.0000
0.01
2 52 3 0.9998
0.9555
0.2460
0.5000 2 7 5
0.9790
0.9758
0.9810
1.0000
4 6 1 0.9979
0.9629
0.2380
0.5000 4 2 2
0.9957
0.9796
0.7490
1.0000
6 6 1 0.9996
0.9923
0.2380
0.5000 6 1 1
0.9883
0.9813
0.8790
1.0000
8 6 1 0.9999
0.9995
0.2380
0.5000 8 1 1
0.9961
0.9937
0.8790
1.0000
10 6 1 0.9999
0.9990
0.2380
0.5000 10 1 1
0.9984
0.9974
0.8790
1.0000

Economic Reliability Group Acceptance Sampling Plan for Truncated Life Test Having
Weibull Distribution
_______________________________________________________________________________
75
Table 5: Minimum Termination Time and the Probability
of Lot Acceptance ( m =3)
r =5
0.25
0 g c 2pL a 0 g c 2pL a
2 23 1 1.0000
0.9728
0.1180
0.5000 2 2 2
0.9929
0.9892
0.9397
1.0000
4 4 0 0.9998
0.9726
0.0940
0.5000 4 1 1
0.9996
0.9988
0.8206
1.0000
6 4 0 0.9999
0.9918
0.0940
0.5000 6 1 1
1.0000
0.9999
0.8206
1.0000
8 4 0 1.0000
0.9965
0.0940
0.5000 8 1 1
1.0000
1.0000
0.8206
1.0000
10 4 0 1.0000
0.9982
0.0940
0.5000 10 1 1
1.0000
1.0000
0.8206
1.0000
0.10
2 37 1 1.0000
0.9566
0.1200
0.5000 2 4 2
0.9993
0.9785
0.6610
1.0000
4 6 0 0.9996
0.9591
0.1040
0.5000 4 2 1
0.9999
0.9976
0.5200
1.0000
6 6 0 0.9999
0.9877
0.1040
0.5000 6 1 0
0.9959
0.9837
0.6240
1.0000
8 6 0 1.0000
0.9848
0.1040
0.5000 8 1 0
0.9983
0.9931
0.6240
1.0000
10 6 0 1.0000
0.9973
0.1040
0.5000 10 1 0
0.9991
0.9964
0.6240
1.0000
0.05
2 48 1 1.0000
0.9441
0.1201
0.5000 2 5 2
0.9907
0.9732
0.8700
1.0000
4 7 0 0.9994
0.9525
0.1160
0.5000 4 2 1
0.9989
0.9976
0.8700
1.0000
6 7 0 0.9998
0.9857
0.1160
0.5000 6 1 0
0.9909
0.9837
0.8110
1.0000
8 7 0 0.9999
0.9939
0.1160
0.5000 8 1 0
0.9962
0.9931
0.8110
1.0000
10 7 0 1.0000
0.9969
0.1160
0.5000 10 1 0
0.9980
0.9964
0.8110
1.0000
0.01
2 256 2 1.0000
0.9966
0.1880
0.5000 2 7 2
0.9811
0.9627
0.9100
1.0000
4 74 1 1.0000
0.9986
0.1194
0.5000 4 3 1
0.9982
0.9964
0.8800
1.0000
6 11 0 0.9997
0.9776
0.1124
0.5000 6 2 0
0.9919
0.9676
0.6190
1.0000
8 11 0 0.9999
0.9905
0.1124
0.5000 8 2 0
0.9966
0.9862
0.6190
1.0000
10 11 0 0.9999
0.9951
0.1124
0.5000 10 2 0
0.9983
0.9929
0.6190
1.0000

76 Mughal, Shahzadi, Hanif and Ali
_______________________________________________________________________________
Table 6: Minimum Termination Time and the Probability
of Lot Acceptance ( m =3)
r =10
0.25
0 g c 2pL a 0 g c 2pL a
2 6 1 1.0000
0.9692
0.1204
0.5000 2 1 2
0.9992
0.9530
0.5960
1.0000
4 2 0 0.9998
0.9726
0.0940
0.5000 4 1 1
1.0000
0.9948
0.3852
1.0000
6 2 0 0.9999
0.9918
0.0940
0.5000 6 1 0
0.9998
0.9676
0.1880
1.0000
8 2 0 1.0000
0.9965
0.0940
0.5000 8 1 0
0.9999
0.9862
0.1880
1.0000
10 2 0 1.0000
0.9982
0.0940
0.5000 10 1 0
1.0000
0.9929
0.1880
1.0000
0.10
2 10 1 1.0000
0.9493
0.1201
0.5000 2 1 2
0.9898
0.9530
0.8100
1.0000
4 3 0 0.9996
0.9591
0.1040
0.5000 4 1 1
0.9998
0.9948
0.5570
1.0000
6 3 0 0.9999
0.9877
0.1040
0.5000 6 1 0
0.9990
0.9676
0.3120
1.0000
8 3 0 1.0000
0.9948
0.1040
0.5000 8 1 0
0.9996
0.9862
0.3120
1.0000
10 3 0 1.0000
0.9973
0.1040
0.5000 10 1 0
0.9998
0.9929
0.3120
1.0000
0.05
2 63 2 1.0000
0.9904
0.1200
0.5000 2 1 2
0.9627
0.9530
0.9580
1.0000
4 13 1 1.0000
0.9989
0.1200
0.5000 4 1 1
0.9994
0.9948
0.6800
1.0000
6 4 0 0.9999
0.9837
0.1013
0.5000 6 1 0
0.9977
0.9676
0.4060
1.0000
8 4 0 0.9999
0.9931
0.1013
0.5000 8 1 0
0.9990
0.9862
0.4060
1.0000
10 4 0 1.0000
0.9964
0.1013
0.5000 10 1 0
0.9995
0.9929
0.4060
1.0000
0.01
2 96 2 1.0000
0.9854
0.1210
0.5000 2 3 3
0.9943
0.9784
0.8710
1.0000
4 20 1 1.0000
0.9983
0.1200
0.5000 4 1 1
0.9960
0.9948
0.9450
1.0000
6 6 0 0.9998
0.9756
0.1040
0.5000 6 1 0
0.9919
0.9676
0.6200
1.0000
8 6 0 0.9999
0.9896
0.1040
0.5000 8 1 0
0.9966
0.9862
0.6200
1.0000
10 6 0 1.0000
0.9947
0.1040
0.5000 10 1 0
0.9982
0.9929
0.6200
1.0000

Economic Reliability Group Acceptance Sampling Plan for Truncated Life Test Having
Weibull Distribution
_______________________________________________________________________________
77