economics 103 principles of microeconomics - sfu.cafriesen/lecture_2.pdf · economics 103...
TRANSCRIPT
© 2010 Pearson Education Canada
Economics 103
Principles of Microeconomics
Dr. Jane Friesen
TAs: Mohsen Javdani
Graeme Walker
Lecture notes available at www.sfu.ca/~friesen
TUTORIALS BEGIN THIS WEEK
See tutorial questions on website (based on Chapter 1 and
Appendix 1A
Lecture this week based on Chapter 2.

© 2010 Pearson Education Canada
Review of last week’s lecture
What is Economics?
The scope of Economics: two big economic questions
The methodology of economics

© 2010 Pearson Education Canada
Review of last week’s lecture
What is Economics?
Economics is the social science that studies the
choices that individuals, businesses, governments,
and entire societies make as they cope with scarcity
and the incentives that influence and reconcile those
choices.

© 2010 Pearson Education Canada
Review of last week’s lecture
First big economic question is really a set of questions:
How do choices end up determining what, how, and for
whom goods and services get produced?
Economics provides answers to these questions.

© 2010 Pearson Education Canada
Review of last week’s lecture
Second big economic question: When is the pursuit of
self-interest in the social interest?
Do we produce the right things in the right quantities?
Do we use our factors of production in the best way?
Do the goods and services go to those who benefit
most from them?
Is it possible that when each one of us makes choices that
are in our self-interest, it also turns out that these
choices are also in the social interest?

© 2010 Pearson Education Canada
The Methodology of Economics
Choice under scarcity implies trade-offs – more of one
thing means less of another
The cost of something is its opportunity cost – the
highest-valued alternative
Basic economic explanation for behaviour: choices
respond to incentives – comparison of marginal cost and
marginal benefit.
Review of last week’s lecture

© 2010 Pearson Education Canada
Outline of today’s lecture
Production possibilities and opportunity cost
Productive and allocative efficiency
Gains from trade
Economic coordination

© 2010 Pearson Education Canada
Production Possibilities and
Opportunity Cost
Two goods: cola and
pizza
Fixed resources
Fixed technology
Efficiency - the economy
is achieving maximum
production
Pizzas
(millions)
Cans of cola
(millions)
A 0 15
B 1 14
C 2 12
D 3 9
E 4 5
F 5 0
Production Possibilities
The PP Table shows the combinations of the maximum
amounts of the two goods that can be produced under
these assumptions.
© 2010 Pearson Education Canada
Production Possibilities and
Opportunity Cost
We can plot the values from the production possibilities
table to show the production possibilities frontier (PPF)
The PPF is the boundary between those combinations of
goods and services that can be produced and those that
cannot.
To illustrate the PPF, we focus on two goods at a time and
hold the quantities of all other goods and services
constant.
That is, we look at a model economy in which everything
remains the same (ceteris paribus) except the two goods
we’re considering.

© 2010 Pearson Education Canada
Production Possibilities and
Opportunity Cost
Production Possibilities
Frontier
Any point on the frontier
such as E and any point
inside the PPF such as Z
are attainable.
Points outside the PPF
are unattainable.

© 2010 Pearson Education Canada
Production Efficiency
We achieve production
efficiency if we cannot
produce more of one good
without producing less of
some other good.
Points on the frontier are
efficient.
Production Possibilities and
Opportunity Cost

© 2010 Pearson Education Canada
Any point inside the frontier, such as Z, is inefficient.
At such a point, it is possible to produce more of one good without producing less of the other good.
At Z, resources are either unemployed or misallocated.
Production Possibilities and
Opportunity Cost
© 2010 Pearson Education Canada
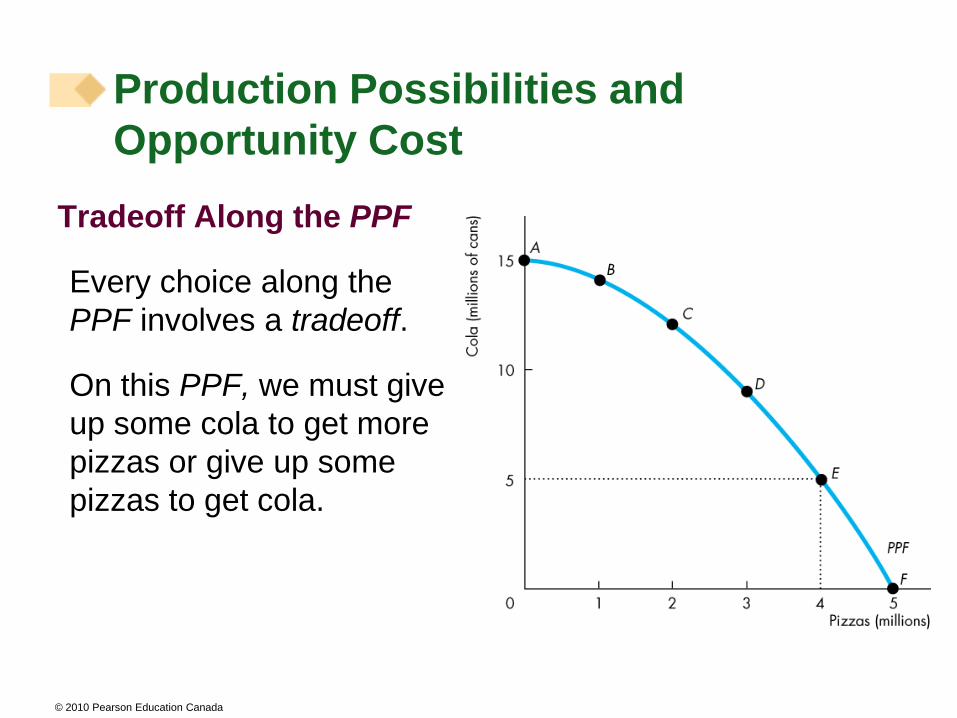
Tradeoff Along the PPF
Every choice along the
PPF involves a tradeoff.
On this PPF, we must give
up some cola to get more
pizzas or give up some
pizzas to get cola.
Production Possibilities and
Opportunity Cost

© 2010 Pearson Education Canada
Opportunity Cost
As we move down along
the PPF, we produce
more pizzas, but the
quantity of cola we can
produce decreases.
The opportunity cost of a
pizza is the cola forgone.
Production Possibilities and
Opportunity Cost
© 2010 Pearson Education Canada
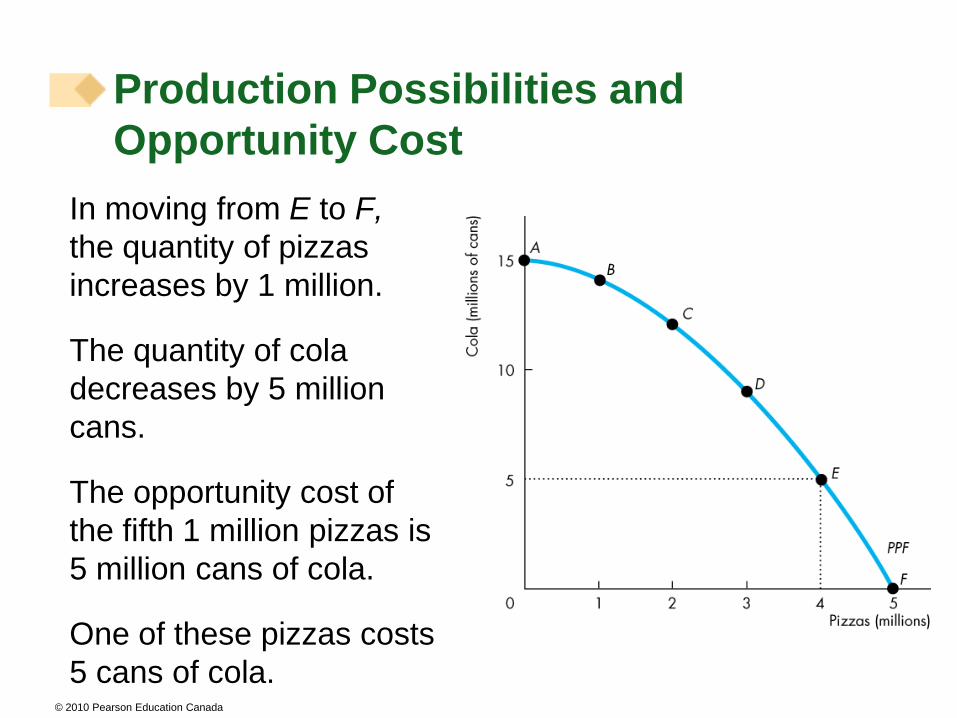
In moving from E to F,
the quantity of pizzas
increases by 1 million.
The quantity of cola
decreases by 5 million
cans.
The opportunity cost of
the fifth 1 million pizzas is
5 million cans of cola.
One of these pizzas costs
5 cans of cola.
Production Possibilities and
Opportunity Cost
© 2010 Pearson Education Canada
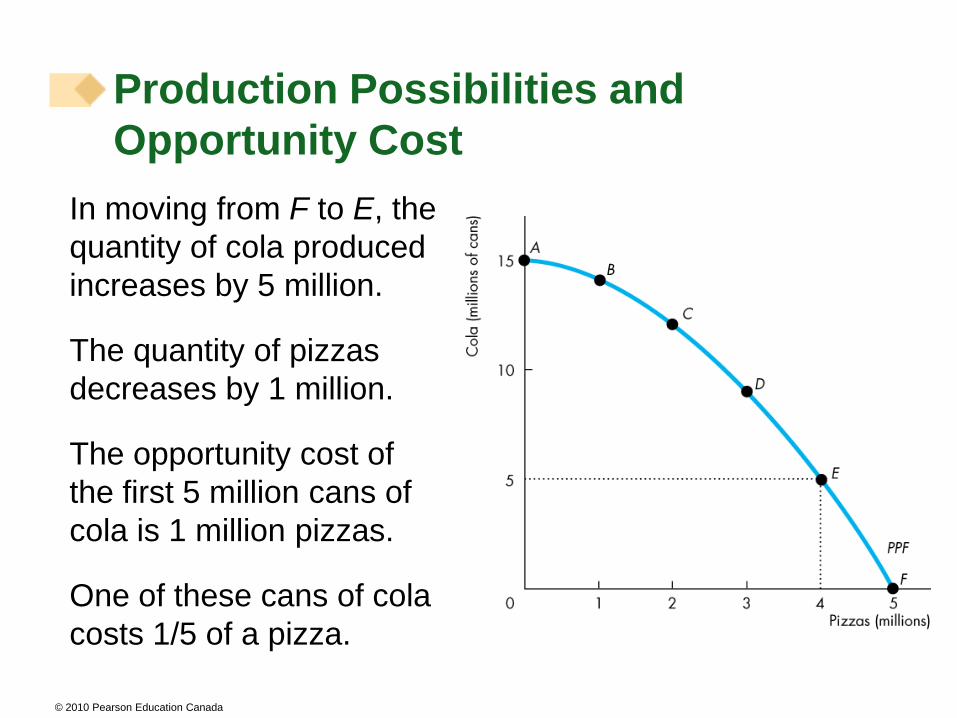
In moving from F to E, the
quantity of cola produced
increases by 5 million.
The quantity of pizzas
decreases by 1 million.
The opportunity cost of
the first 5 million cans of
cola is 1 million pizzas.
One of these cans of cola
costs 1/5 of a pizza.
Production Possibilities and
Opportunity Cost

© 2010 Pearson Education Canada
Note that the opportunity cost of a can of cola is the inverse of the opportunity cost of a pizza.
One pizza costs 5 cans of cola.
One can of cola costs 1/5 of a pizza.
Production Possibilities and
Opportunity Cost

© 2010 Pearson Education Canada
Because resources are
not equally productive in
all activities, the PPF
bows outward—is
concave.
The outward bow of the
PPF means that as the
quantity produced of each
good increases, so does
its opportunity cost.
Production Possibilities and
Opportunity Cost

© 2010 Pearson Education Canada
All the points along the PPF are efficient.
To determine which of the alternative efficient quantities
to produce, we compare costs and benefits.
The PPF and Marginal Cost
The PPF determines opportunity cost.
The marginal cost of a good or service is the opportunity
cost of producing one more unit of it.
Using Resources Efficiently

© 2010 Pearson Education Canada
Figure 2.2 illustrates the marginal cost of pizza.
As we move along the PPF in part (a), the opportunity cost of a pizza increases.
The opportunity cost of producing one more pizza is the marginal cost of a pizza.
Using Resources Efficiently

© 2010 Pearson Education Canada
Using Resources Efficiently
In part (b) of Fig. 2.2, the bars illustrate the increasing opportunity cost of pizza.
The black dots and the line MC show the marginal cost of pizza.
The MC curve passes through the centre of each bar.

© 2010 Pearson Education Canada
Preferences and Marginal Benefit
Preferences are a description of a person’s likes and
dislikes.
To describe preferences, economists use the concepts of
marginal benefit and the marginal benefit curve.
The marginal benefit of a good or service is the benefit
received from consuming one more unit of it.
We measure marginal benefit by the amount that a
person is willing to pay for an additional unit of a good or
service.
Using Resources Efficiently

© 2010 Pearson Education Canada
It is a general principle that the more we have of any
good, the smaller is its marginal benefit and the less we
are willing to pay for an additional unit of it.
We call this general principle the principle of decreasing
marginal benefit.
The marginal benefit curve shows the relationship
between the marginal benefit of a good and the quantity
of that good consumed.
Using Resources Efficiently
© 2010 Pearson Education Canada
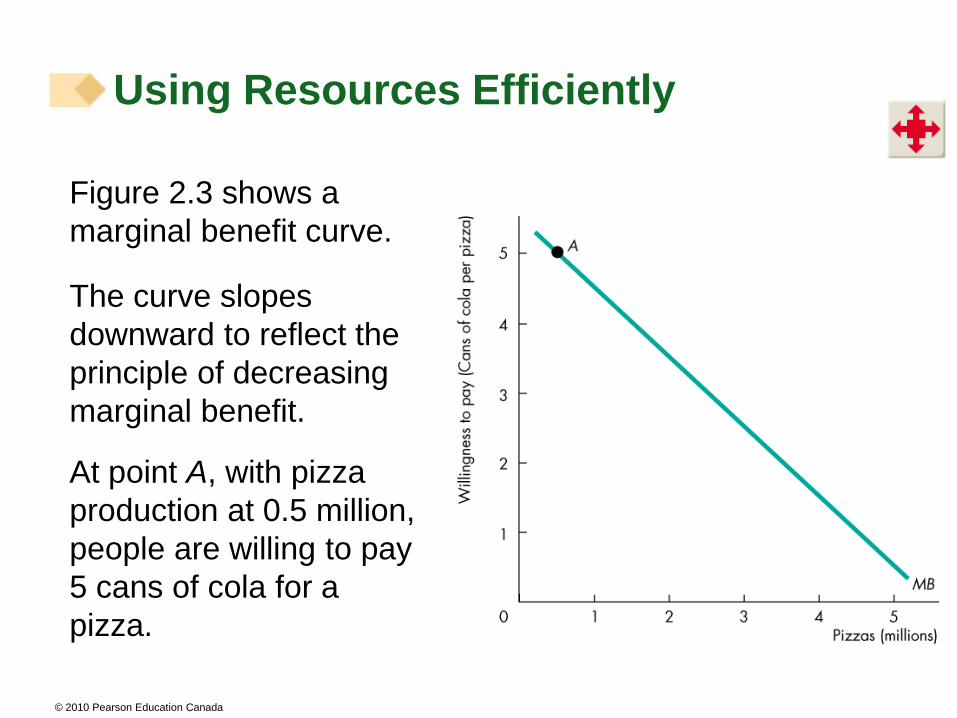
Figure 2.3 shows a
marginal benefit curve.
The curve slopes
downward to reflect the
principle of decreasing
marginal benefit.
At point A, with pizza
production at 0.5 million,
people are willing to pay
5 cans of cola for a
pizza.
Using Resources Efficiently

© 2010 Pearson Education Canada
At point B, with pizza
production at 1.5 million,
people are willing to pay
4 cans of cola for a
pizza.
At point E, with pizza
production at 4.5 million,
people are willing to pay
1 can of cola for a pizza.
Using Resources Efficiently

© 2010 Pearson Education Canada
Allocative Efficiency
When we cannot produce more of any one good without
giving up some other good, we have achieved production
efficiency.
We are producing at a point on the PPF.
When we cannot produce more of any one good without
giving up some other good that we value more highly, we
have achieved allocative efficiency.
We are producing at the point on the PPF that we prefer
above all other points.
Using Resources Efficiently

© 2010 Pearson Education Canada
Figure 2.4 illustrates allocative efficiency.
The point of allocative efficiency is the point on the PPF at which marginal benefit equals marginal cost.
This point is determined by the quantity at which the marginal benefit curve intersects the marginal cost curve.
Using Resources Efficiently

© 2010 Pearson Education Canada
We get more value from our resources by producing more pizzas.
On the PPF at point A, we are producing too much cola, and we are better off moving along the PPF to produce more pizzas.
If we produce fewer than 2.5 million pizzas, marginal benefit exceeds marginal cost.
Using Resources Efficiently
© 2010 Pearson Education Canada
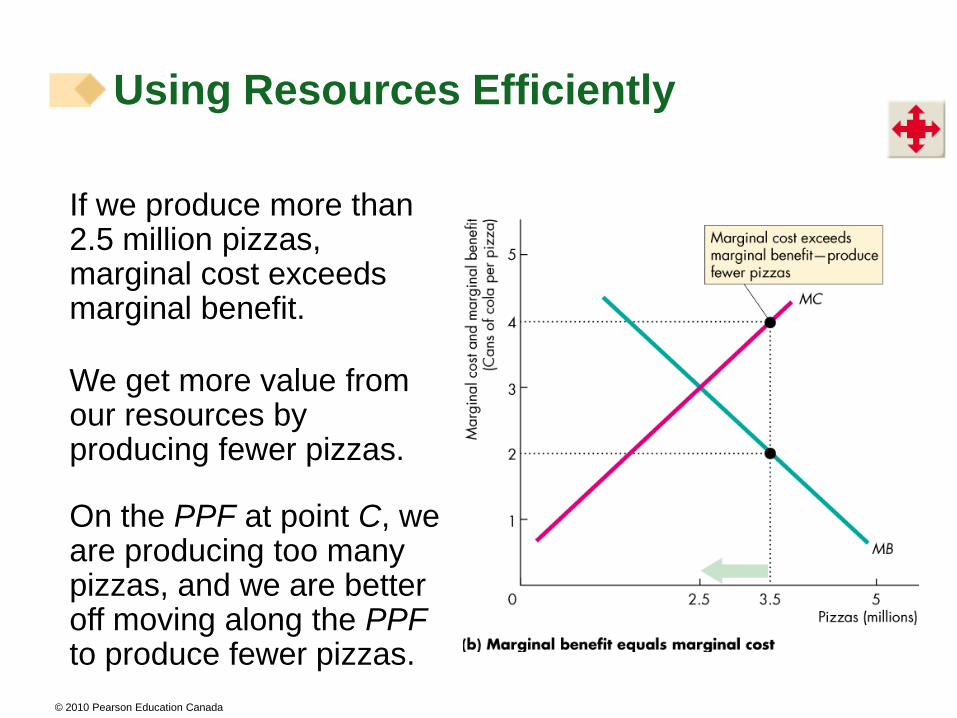
We get more value from our resources by producing fewer pizzas.
On the PPF at point C, we are producing too many pizzas, and we are better off moving along the PPFto produce fewer pizzas.
If we produce more than 2.5 million pizzas, marginal cost exceeds marginal benefit.
Using Resources Efficiently

© 2010 Pearson Education Canada
We cannot get more value from our resources.
On the PPF at point B, we are producing the efficient quantities of cola and pizzas.
If we produce exactly 2.5 million pizzas, marginal cost equals marginal benefit.
Using Resources Efficiently

© 2010 Pearson Education Canada
The expansion of production possibilities—and increase in
the standard of living—is called economic growth.
Two key factors influence economic growth:
Technological change
Capital accumulation
Technological change is the development of new goods
and of better ways of producing goods and services.
Capital accumulation is the growth of capital resources,
which includes human capital.
Economic Growth

© 2010 Pearson Education Canada
The Cost of Economic Growth
To use resources in research and development and
to produce new capital, we must decrease our
production of consumption goods and services.
So economic growth is not free.
The opportunity cost of economic growth is less
current consumption.
Economic Growth

© 2010 Pearson Education Canada
Figure 2.5 illustrates the
tradeoff we face.
We can produce pizzas or
pizza ovens along PPF0.
By using some resources
to produce pizza ovens
today, the PPF shifts
outward in the future.
Economic Growth

© 2010 Pearson Education Canada
Gains from Trade
Comparative Advantage and Absolute Advantage
A person has a comparative advantage in an activity if
that person can perform the activity at a lower opportunity
cost than anyone else.
A person has an absolute advantage if that person is
more productive than others.
Absolute advantage involve comparing productivities
while comparative advantage involves comparing
opportunity costs.

© 2010 Pearson Education Canada
Liz's opportunity cost of producing 1 salad is 1 smoothie.
Liz’s customers buy salads and smoothies in equal number,
so she produces 15 smoothies and 15 salads an hour.
Liz's Smoothie Bar
In an hour, Liz can
produce 30 smoothies
or 30 salads.
Liz's opportunity cost of
producing 1 smoothie is
1 salad.
Gains from Trade

© 2010 Pearson Education Canada
Joe's opportunity cost of
producing 1 smoothie is
5 salads.
Joe's opportunity cost of
producing 1 salad is 1/5
smoothie.
Joe's Smoothie Bar
In an hour, Joe can produce 6 smoothies or 30 salads.
Joe spends 10 minutes making salads and 50 minutes making
smoothies, so he produces 5 smoothies and 5 salads an hour.
Gains from Trade

© 2010 Pearson Education Canada
Liz’s Absolute Advantage
Liz is three times as productive as Joe.
Liz can produce 15 smoothies and 15 salads an hour whereas Joe can produce only 5 smoothies and 5 salads an hour.
Liz has an absolute advantage in producing smoothies and salads.
Gains from Trade

© 2010 Pearson Education Canada
Liz’s Comparative Advantage
Liz’s opportunity cost of a smoothie is 1 salad.
Joe’s opportunity cost of a smoothie is 5 salads.
Liz’s opportunity cost of a smoothie is less than Joe’s.
So Liz has a comparative advantage in producing smoothies.
Gains from Trade

© 2010 Pearson Education Canada
Joe’s Comparative Advantage
Joe’s opportunity cost of a salad is 1/5 smoothie.
Liz’s opportunity cost of a salad is 1 smoothie.
Joe’s opportunity cost of a salad is less than Liz’s.
So Joe has a comparative advantage in producing salads.
Gains from Trade

© 2010 Pearson Education Canada
Achieving Gains from Trade
Liz and Joe produce the
good in which they have a
comparative advantage:
Liz produces 30 smoothies
and 0 salads.
Joe produces 30 salads
and 0 smoothies.
Gains from Trade

© 2010 Pearson Education Canada
Liz and Joe trade:
Liz sells Joe 10 smoothies
and buys 20 salads.
Joe sells Liz 20 salads and
buys 10 smoothies.
After trade:
Liz has 20 smoothies and
10 salads.
Joe has 20 smoothies and
10 salads.
Gains from Trade
© 2010 Pearson Education Canada
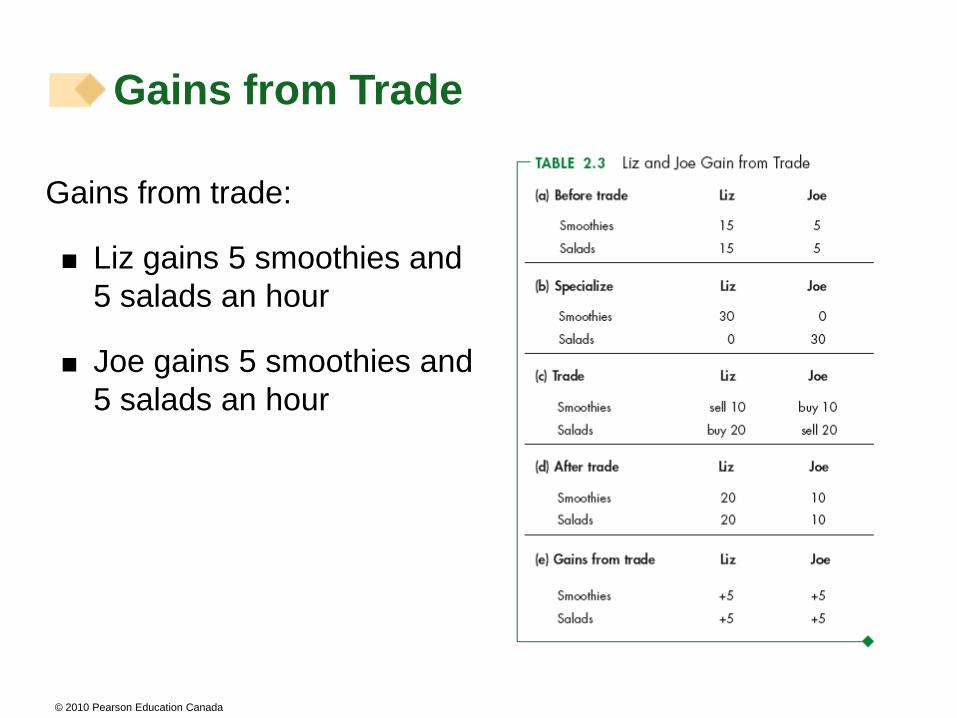
Gains from trade:
Liz gains 5 smoothies and
5 salads an hour
Joe gains 5 smoothies and
5 salads an hour
Gains from Trade

© 2010 Pearson Education Canada
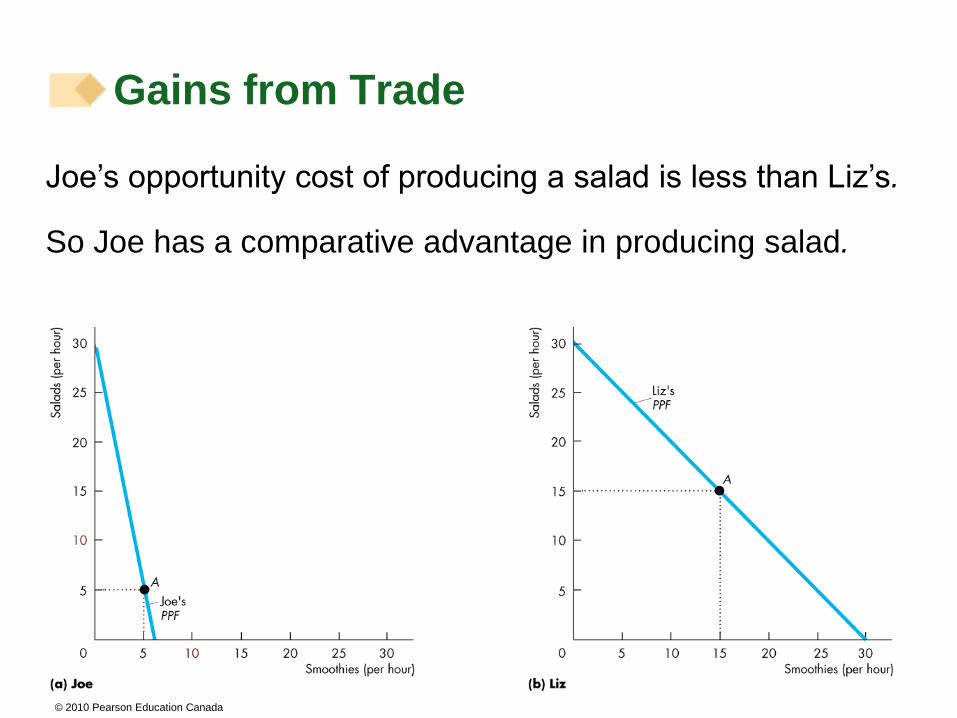
Figure 2.6 shows the gains from trade.
Joe initially produces at point A on his PPF.
Liz initially produces at point A on her PPF.
Gains from Trade
© 2010 Pearson Education Canada
Joe’s opportunity cost of producing a salad is less than Liz’s.
So Joe has a comparative advantage in producing salad.
Gains from Trade

© 2010 Pearson Education Canada
Liz’s opportunity cost of producing a smoothie is less than
Joe’s.
So Liz has a comparative advantage in producing smoothies.
Gains from Trade

© 2010 Pearson Education Canada
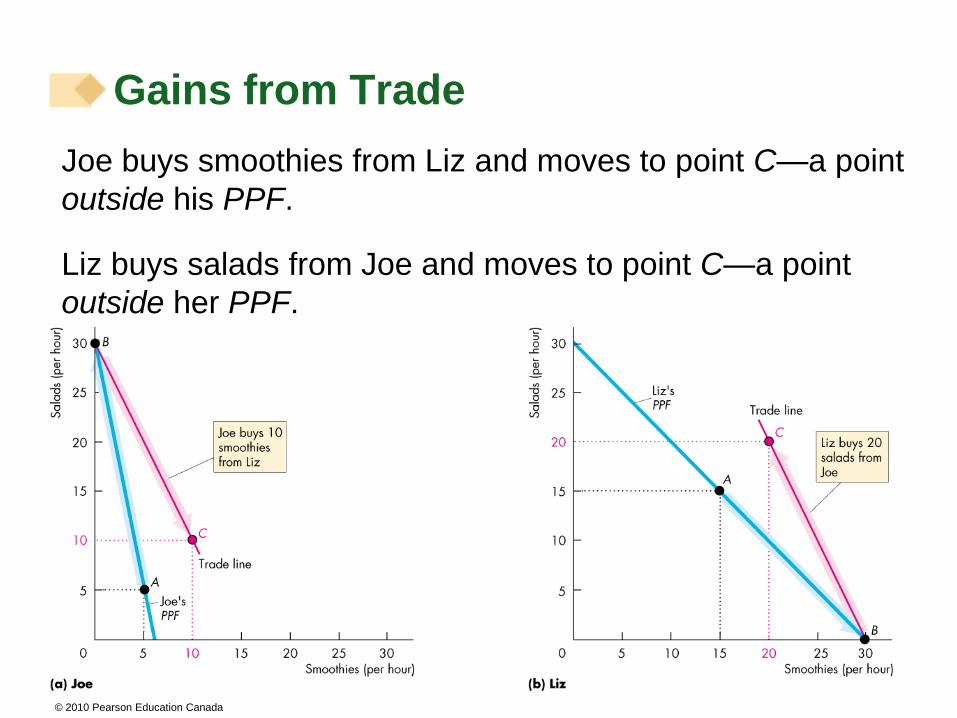
Joe specializes in producing salad and he produces
30 salads an hour at point B on his PPF.
Gains from Trade

© 2010 Pearson Education Canada
Liz specializes in producing smoothies and produces
30 smoothies an hour at point B on her PPF.
Gains from Trade

© 2010 Pearson Education Canada
They trade salads for smoothies along the red ―Trade line.‖
The price of a salad is 2 smoothies or the price of a
smoothie is ½ of a salad.
Gains from Trade
© 2010 Pearson Education Canada
Joe buys smoothies from Liz and moves to point C—a point
outside his PPF.
Liz buys salads from Joe and moves to point C—a point
outside her PPF.
Gains from Trade

© 2010 Pearson Education Canada
Dynamic Comparative Advantage
Learning-by-doing occurs when a person (or nation)
specializes and by repeatedly producing a particular
good or service becomes more productive in that
activity and lowers its opportunity cost of producing that
good over time.
Dynamic comparative advantage occurs when a
person (or nation) gains a comparative advantage from
learning-by-doing.
Gains from Trade

© 2010 Pearson Education Canada
What is the source of gains from
trade?
Resources are released from high-cost activities and
allocated towards relatively low-cost activities – total
production increases
Trade will take place at any price ratio that lies between the
opportunity costs of the two parties
• each person acquires one of the goods at a lower cost
through trade than through self-production
• both are better off
© 2010 Pearson Education Canada
To reap the gains from trade, the choices of individuals
must be coordinated.
To make coordination work, four complimentary social
institutions have evolved over the centuries:
Firms
Markets
Property rights
Money
Economic Coordination

© 2010 Pearson Education Canada
A firm is an economic unit that hires factors of production and organizes those factors to produce and sell goods and services.
A market is any arrangement that enables buyers and sellers to get information and do business with each other.
Property rights are the social arrangements that govern ownership, use, and disposal of resources, goods or services.
Money is any commodity or token that is generally acceptable as a means of payment.
Economic Coordination

© 2010 Pearson Education Canada
Circular Flows
Through Markets
Figure 2.7 illustrates
how households and
firms interact in the
market economy.
Factors of production
and goods and
services flow in one
direction.
Money flows in the
opposite direction.
Economic Coordination

© 2010 Pearson Education Canada
Coordinating
Decisions
Markets coordinate
individual
decisions through
price adjustments.
Economic Coordination

© 2010 Pearson Education Canada
How does a market economy solve the
coordinating problem? What, how and
for whom?
1. How is it determined what and how much will be
produced?
Firms that produce the wrong stuff will lose money and
contract or close.
Firms that produce the right stuff will be highly profitable
and expand.

© 2010 Pearson Education Canada
How does a market economy solve the
coordinating problem?
2. How is it determined how output will be produced?
Firms that find the least costly ways of combining
productive inputs will be able to sell the good most
profitably and will expand.

© 2010 Pearson Education Canada
How does a market economy solve the
coordinating problem?
3. How is it determined who is to receive the output
that is produced?
Will talk about this in depth, but distribution of consumer
goods is determined by willingness and abililty to pay
for them in a market system.
© 2010 Pearson Education Canada
Homework
Reading: Chapter 2
Tutorial questions:
Chapter 2 Problems and Applications
12, 13, 14, 15, 17, 18