economics 349 intermediate micro theory
DESCRIPTION
Economics 349 Intermediate Micro Theory. Fall 2013 Dr. Delemeester. Syllabus Quiz. Course Essentials. Course web page www.marietta.edu/~delemeeg/econ349 Microeconomics (Worth, 1e) by Goolsbee , Levitt, and Syverson Grade Exams (65%) Homework (20%) Spreadsheet Projects ( 15%). - PowerPoint PPT PresentationTRANSCRIPT

Economics 349Intermediate Micro Theory
Fall 2013Dr. Delemeester

Syllabus Quiz

Course Essentials• Course web page
• www.marietta.edu/~delemeeg/econ349
• Microeconomics (Worth, 1e) by Goolsbee, Levitt, and Syverson
• Grade▫ Exams (65%)▫ Homework (20%)▫ Spreadsheet Projects (15%)

Economic Roundtable• …to promote an interest in and to enlighten
its members and others in the community on important governmental, economic, and social issues…
• Business networking opportunity• Student memberships: $5
economicroundtable.org
Amity ShlaesAuthor/Journalist
Jim MeilEaton Corp.
Laurence Kotlikoff*
Boston University
Robert TylerPittsburgh Steelers
Affordable Care ActForum
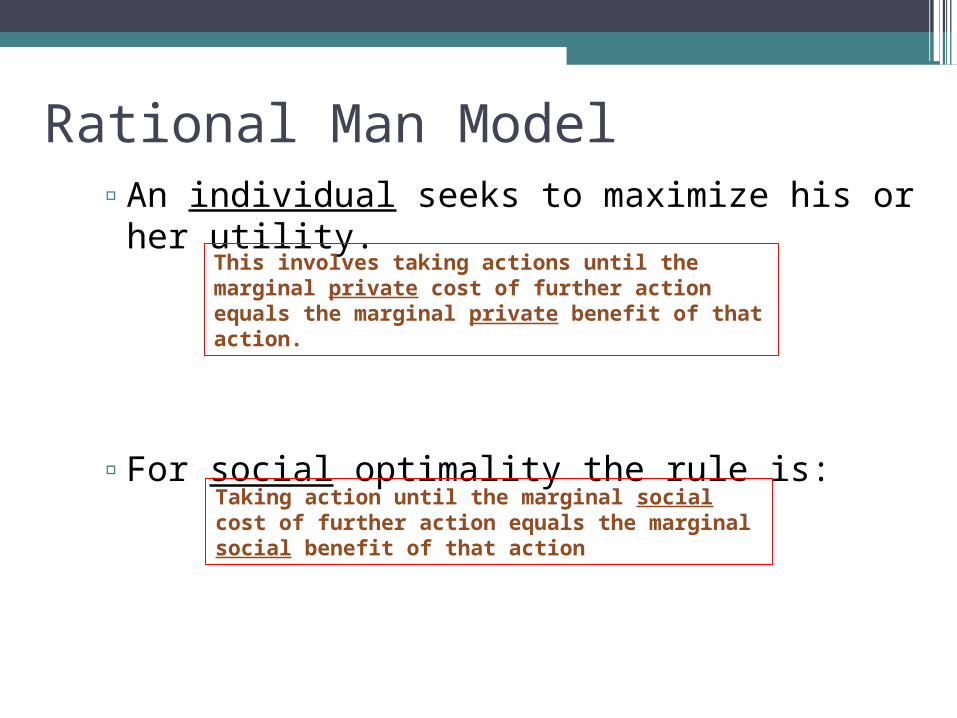
▫An individual seeks to maximize his or her utility.
▫For social optimality the rule is:
This involves taking actions until the marginal private cost of further action equals the marginal private benefit of that action.
Taking action until the marginal social cost of further action equals the marginal social benefit of that action
Rational Man Model

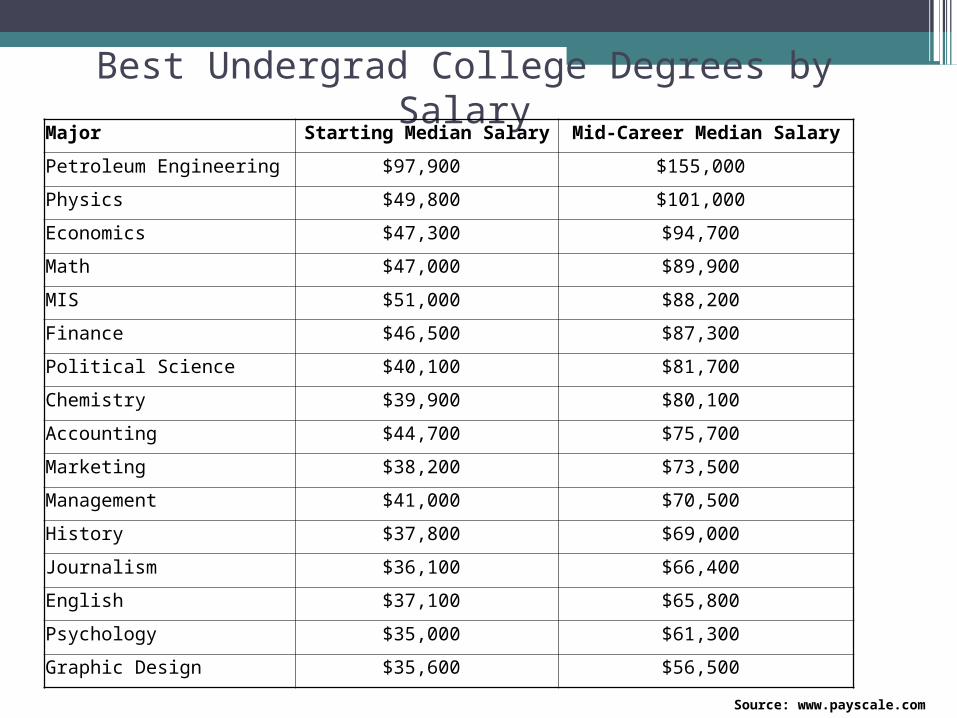
Best Undergrad College Degrees by SalaryMajor Starting Median Salary Mid-Career Median Salary
Petroleum Engineering $97,900 $155,000
Physics $49,800 $101,000
Economics $47,300 $94,700
Math $47,000 $89,900
MIS $51,000 $88,200
Finance $46,500 $87,300
Political Science $40,100 $81,700
Chemistry $39,900 $80,100
Accounting $44,700 $75,700
Marketing $38,200 $73,500
Management $41,000 $70,500
History $37,800 $69,000
Journalism $36,100 $66,400
English $37,100 $65,800
Psychology $35,000 $61,300
Graphic Design $35,600 $56,500
Source: www.payscale.com
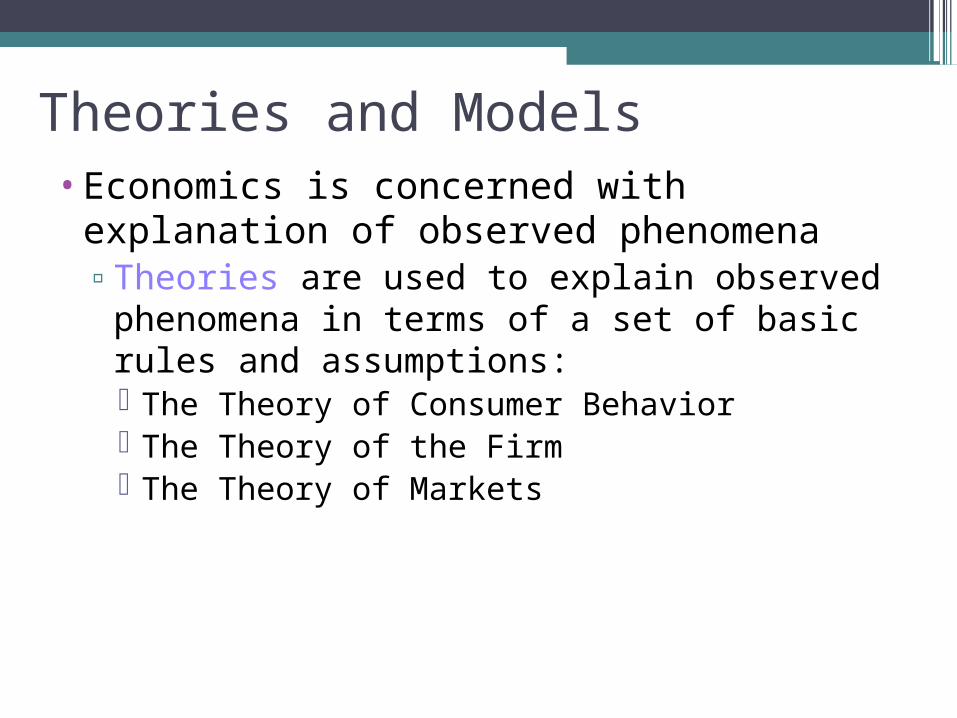
Theories and Models•Economics is concerned with explanation
of observed phenomena▫Theories are used to explain observed
phenomena in terms of a set of basic rules and assumptions: The Theory of Consumer Behavior The Theory of the Firm The Theory of Markets

Braille keypad on drive-up ATMs?

Redcoats and phalanxes?
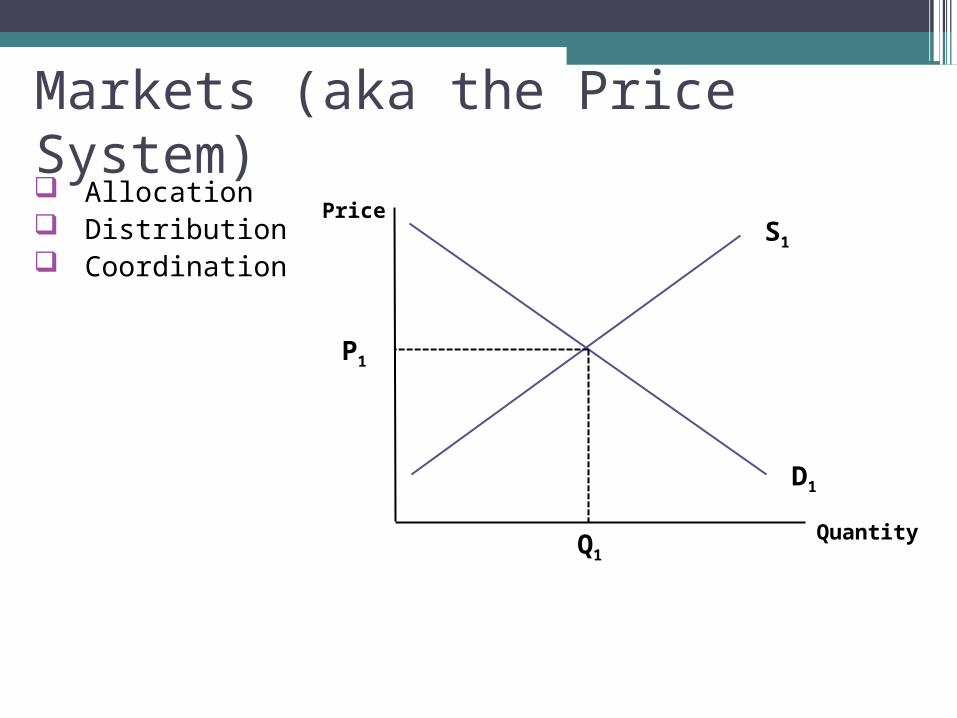
Allocation Distribution Coordinatio
n
Markets (aka the Price System)
S1
D1
Quantity
Price
P1
Q1
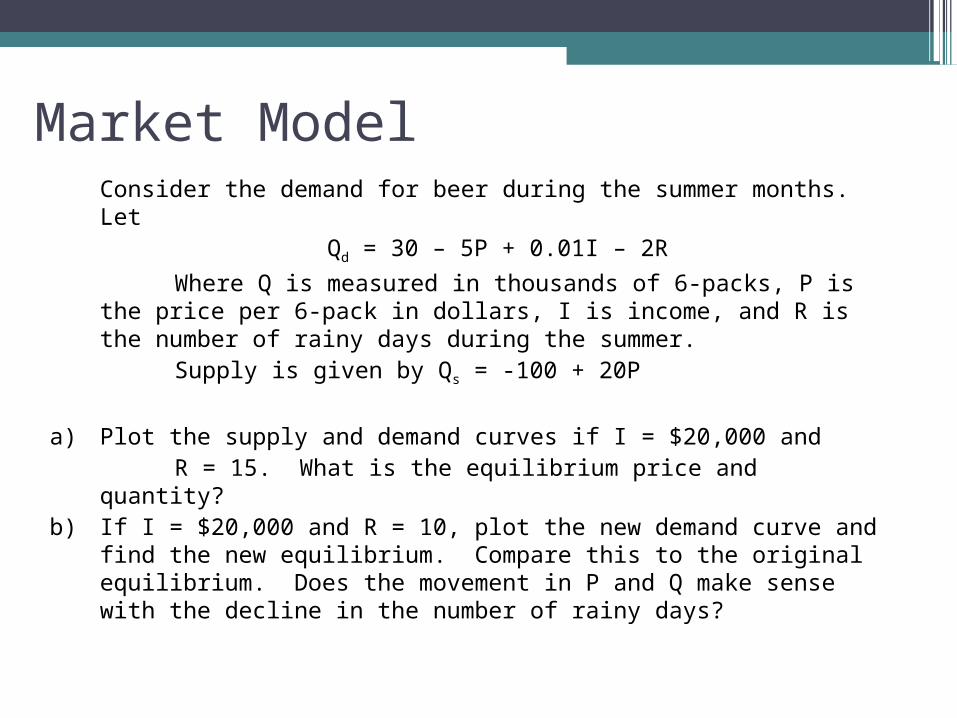
Consider the demand for beer during the summer months. Let
Qd = 30 – 5P + 0.01I – 2R
Where Q is measured in thousands of 6-packs, P is the price per 6-pack in dollars, I is income, and R is the number of rainy days during the summer.
Supply is given by Qs = -100 + 20P
a) Plot the supply and demand curves if I = $20,000 and R = 15. What is the equilibrium price and quantity?b) If I = $20,000 and R = 10, plot the new demand curve
and find the new equilibrium. Compare this to the original equilibrium. Does the movement in P and Q make sense with the decline in the number of rainy days?
Market Model
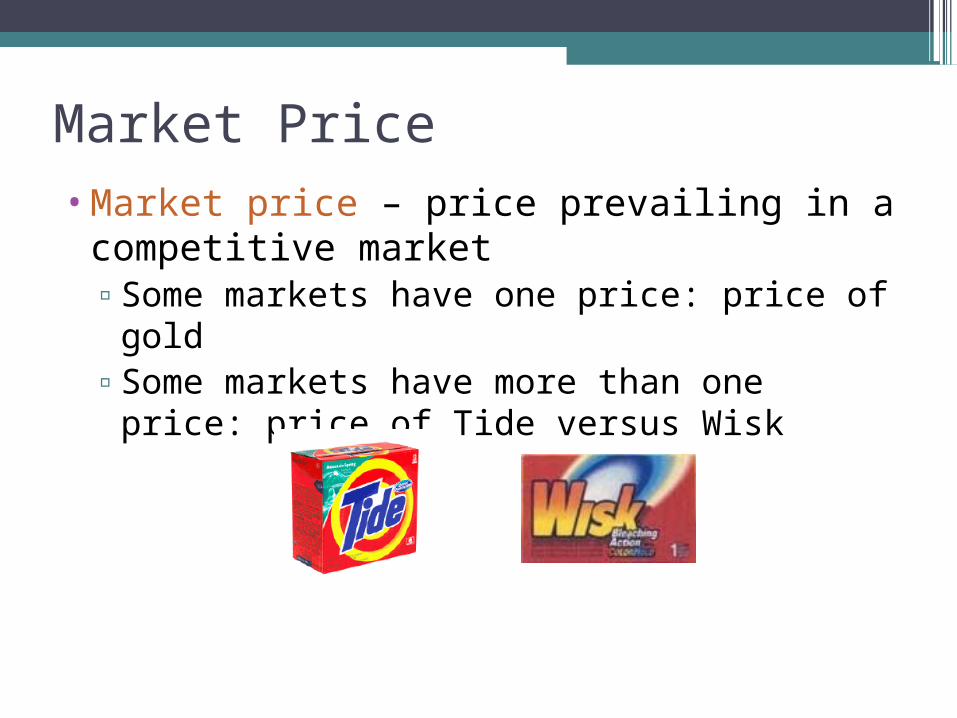
Market Price•Market price – price prevailing in a
competitive market▫Some markets have one price: price of gold▫Some markets have more than one price:
price of Tide versus Wisk

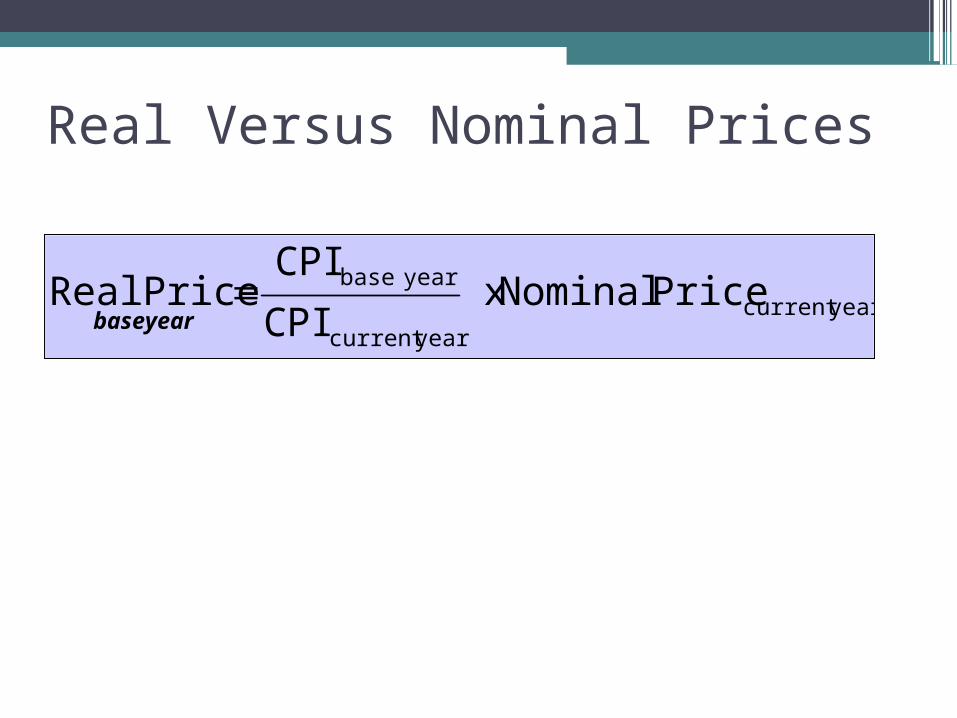
Real Versus Nominal Prices
yearcurrent yearcurrent
yearbase Price Nominal x CPI
CPI RealPrice
baseyear
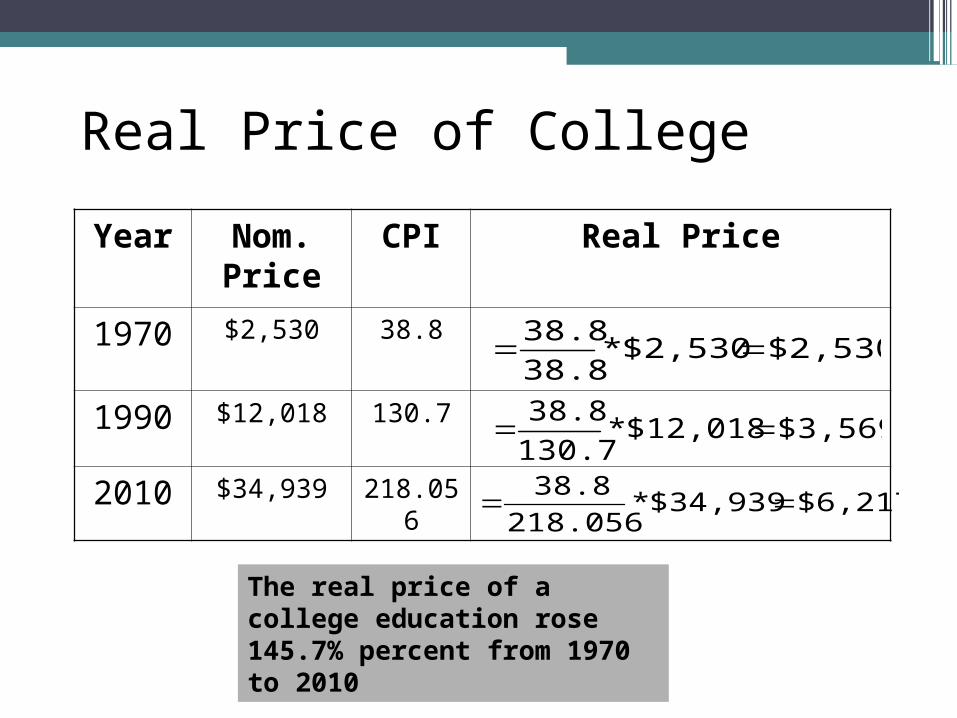
Real Price of College
Year Nom. Price
CPI Real Price
1970 $2,530 38.8
1990 $12,018 130.7
2010 $34,939 218.056
$3,569$12,018*130.738.8
$6,217$34,939*218.056
38.8
$2,530$2,530*38.838.8
The real price of a college education rose 145.7% percent from 1970 to 2010
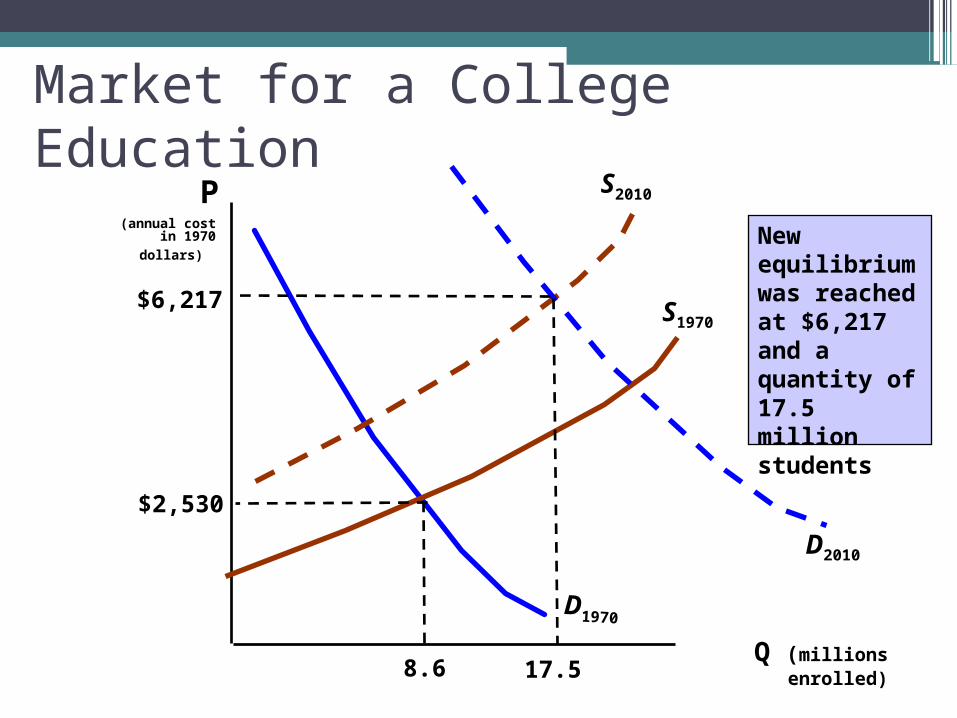
Market for a College Education
Q (millions enrolled)
(annual cost in 1970
dollars)
D1970
S1970
S2010
D2010
$6,217
17.5
New equilibriumwas reached at $6,217 and a quantity of 17.5 million students
$2,530
8.6
P
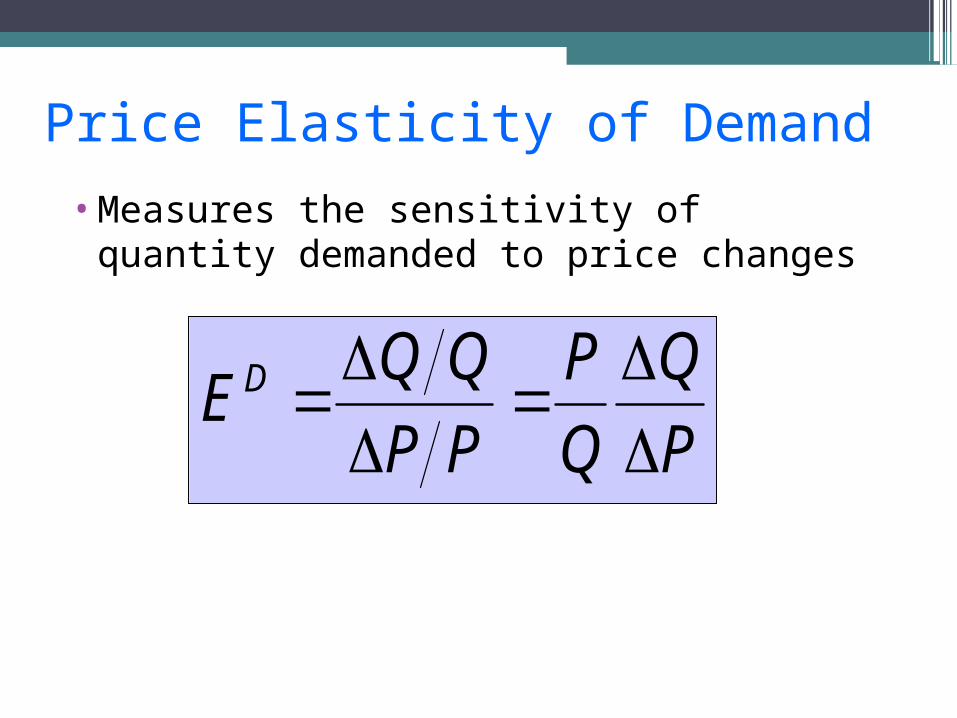
Price Elasticity of Demand
•Measures the sensitivity of quantity demanded to price changes
P
QE DDP
%
%P
Q
Q
P
PP
QQE D
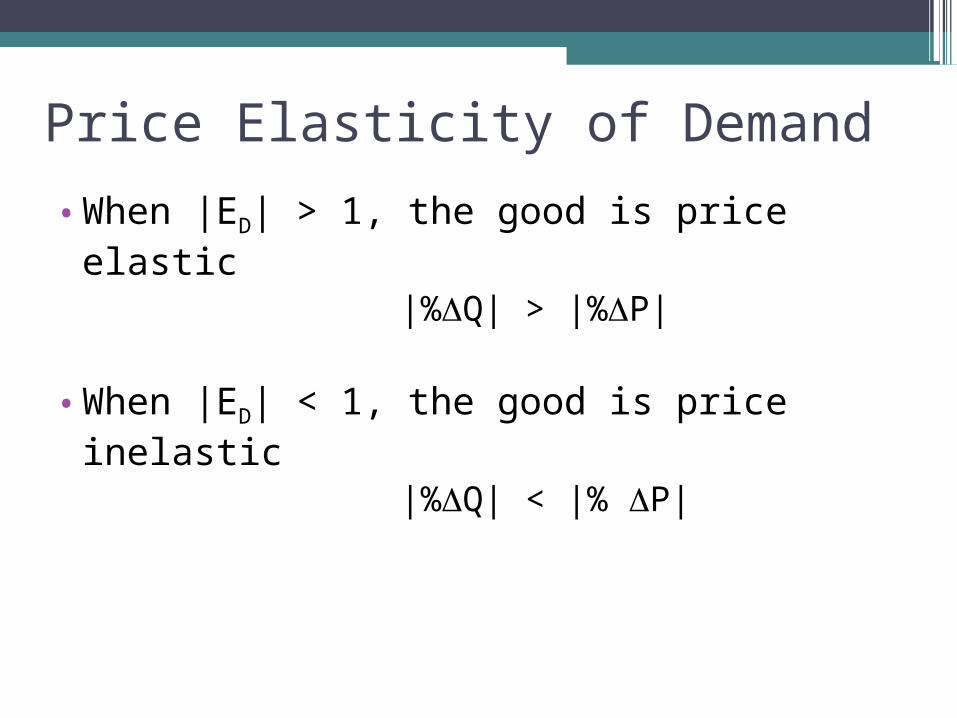
•When |ED| > 1, the good is price elastic|%Q| > |%P|
•When |ED| < 1, the good is price inelastic|%Q| < |% P|
Price Elasticity of Demand
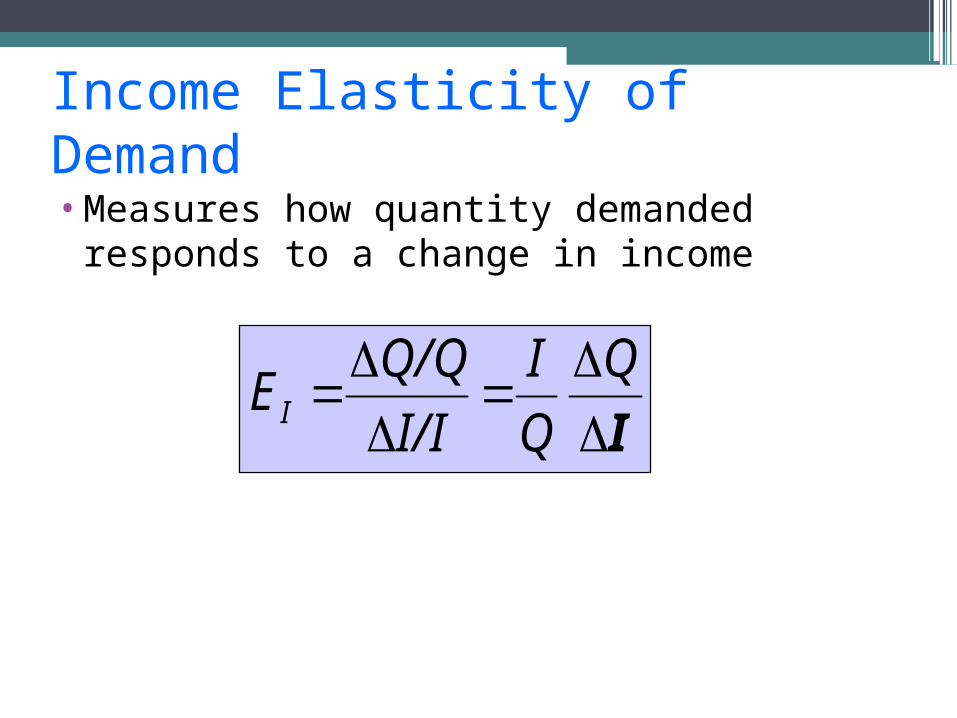
Income Elasticity of Demand
•Measures how quantity demanded responds to a change in income
I
Q
Q
I
I/I
Q/Q EI
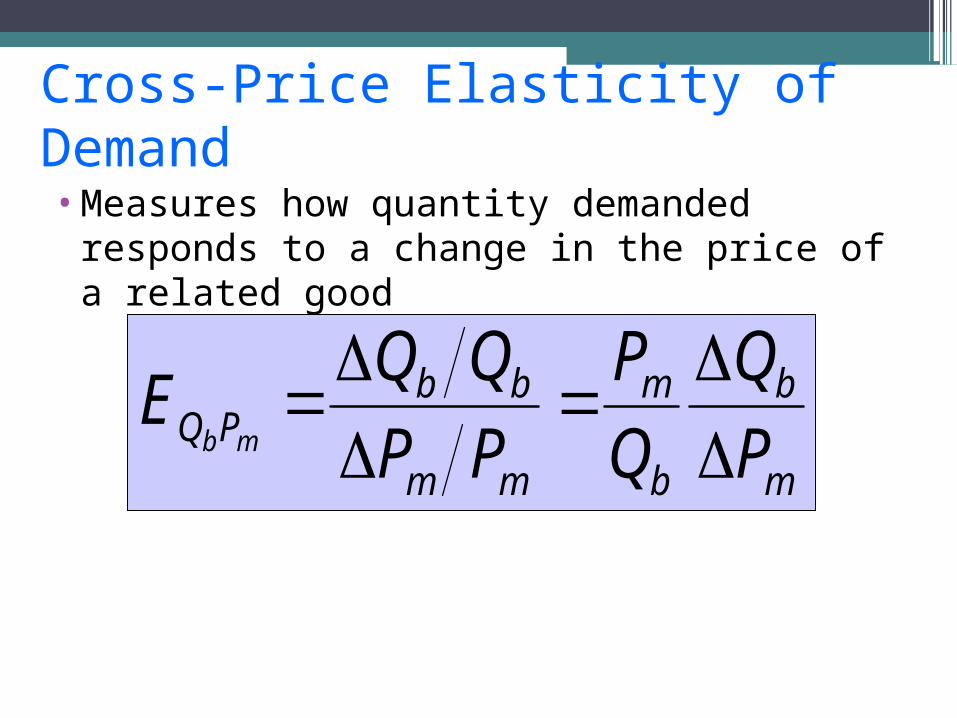
Cross-Price Elasticity of Demand•Measures how quantity demanded
responds to a change in the price of a related good
m
b
b
m
mm
bbPQ P
Q
Q
P
PP
QQE
mb
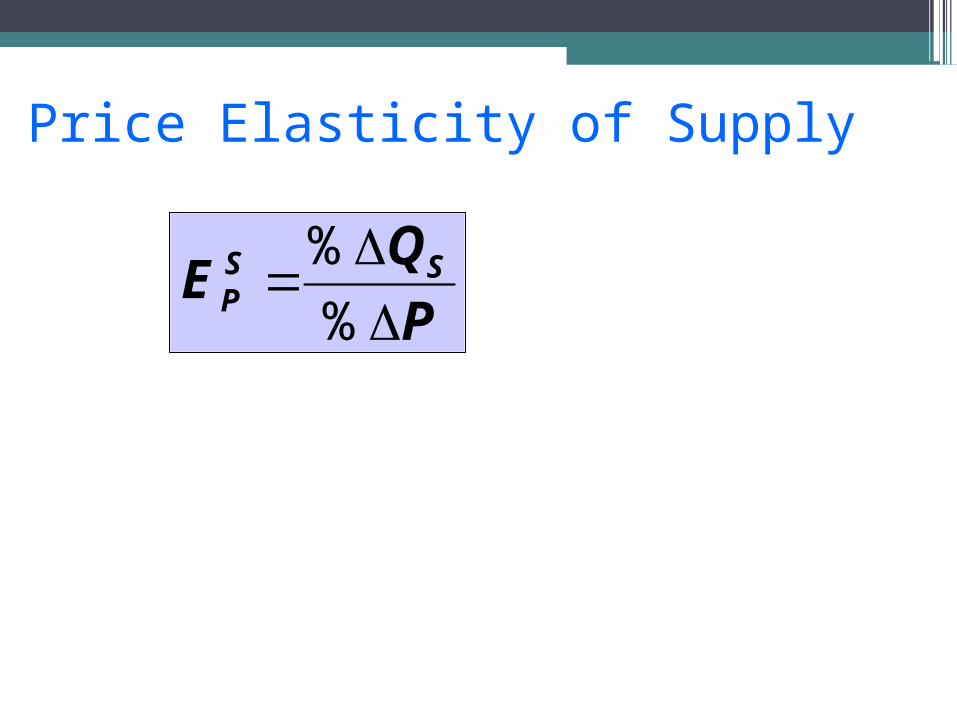
Price Elasticity of Supply
P
QE SSP
%
%
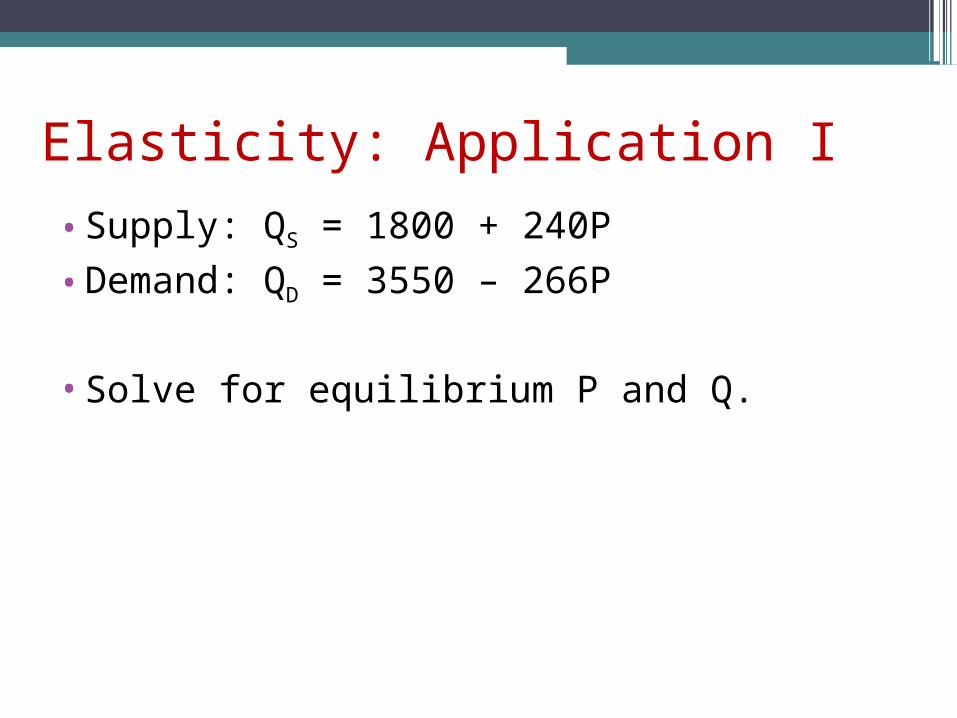
Elasticity: Application I
•Supply: QS = 1800 + 240P
•Demand: QD = 3550 – 266P
•Solve for equilibrium P and Q.
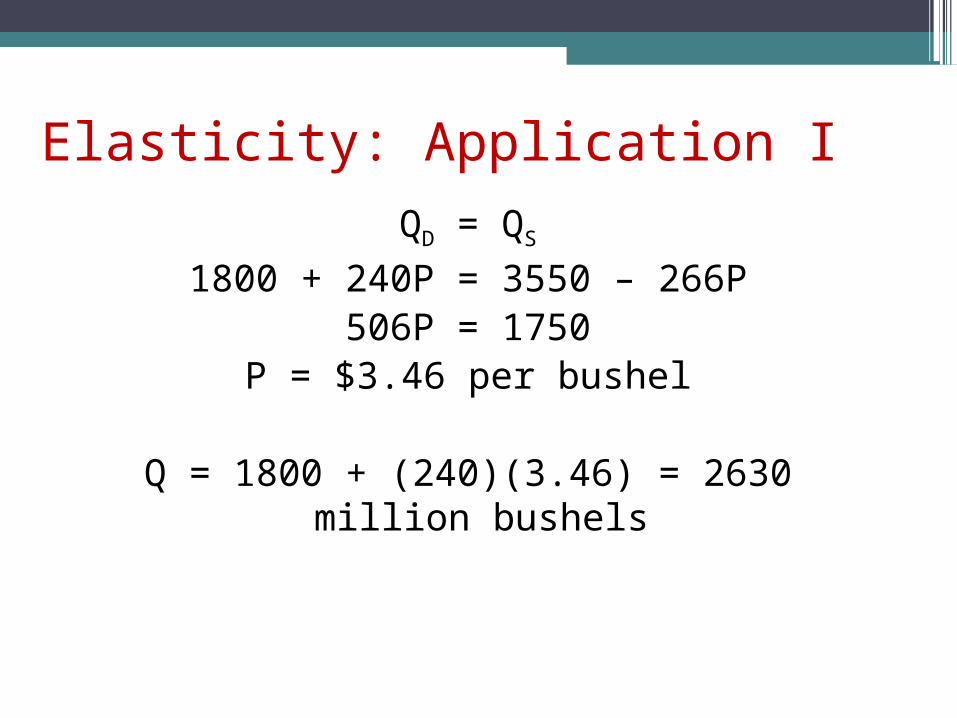
QD = QS
1800 + 240P = 3550 – 266P506P = 1750
P = $3.46 per bushel
Q = 1800 + (240)(3.46) = 2630 million bushels
Elasticity: Application I
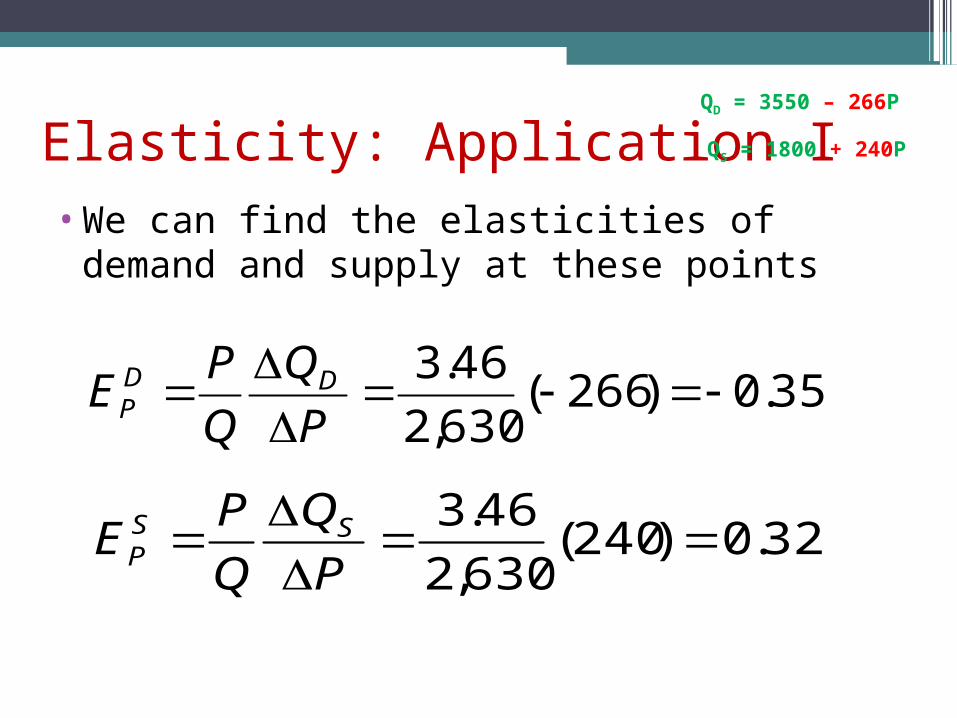
•We can find the elasticities of demand and supply at these points
35.0)266(630,2
46.3
P
Q
Q
PE DD
P
32.0)240(630,2
46.3
P
Q
Q
PE SS
P
Elasticity: Application IQD = 3550 – 266P
QS = 1800 + 240P
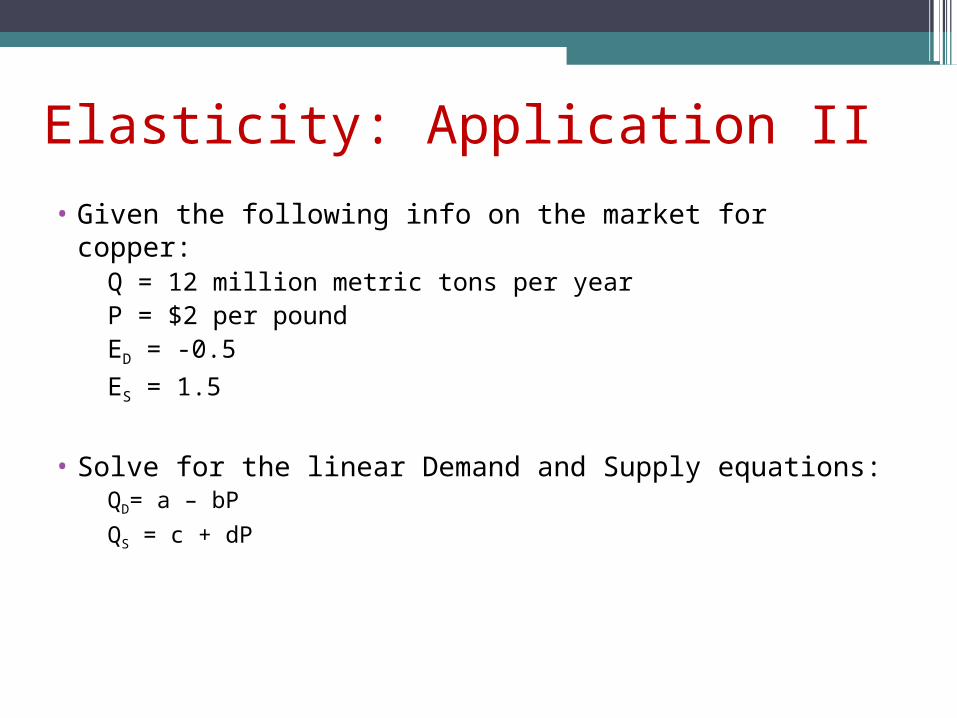
Elasticity: Application II
• Given the following info on the market for copper:Q = 12 million metric tons per yearP = $2 per poundED = -0.5
ES = 1.5
• Solve for the linear Demand and Supply equations:
QD= a – bP
QS = c + dP

Welfare Analysis
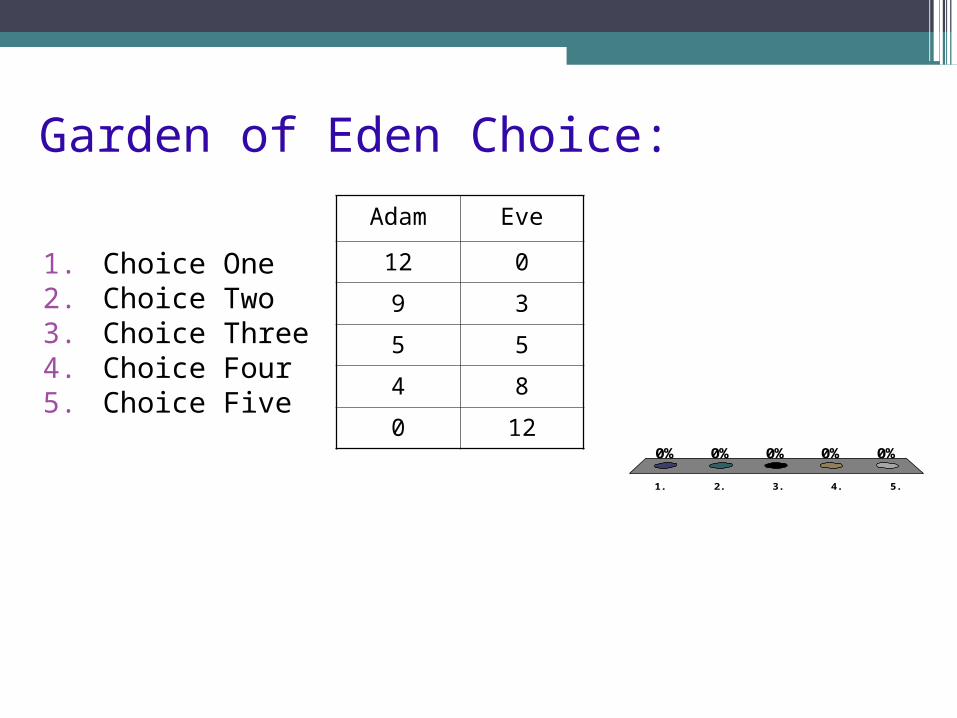
Garden of Eden Choice:
1. Choice One2. Choice Two3. Choice Three4. Choice Four5. Choice Five
1. 2. 3. 4. 5.
0% 0% 0%0%0%
Adam Eve
12 0
9 3
5 5
4 8
0 12
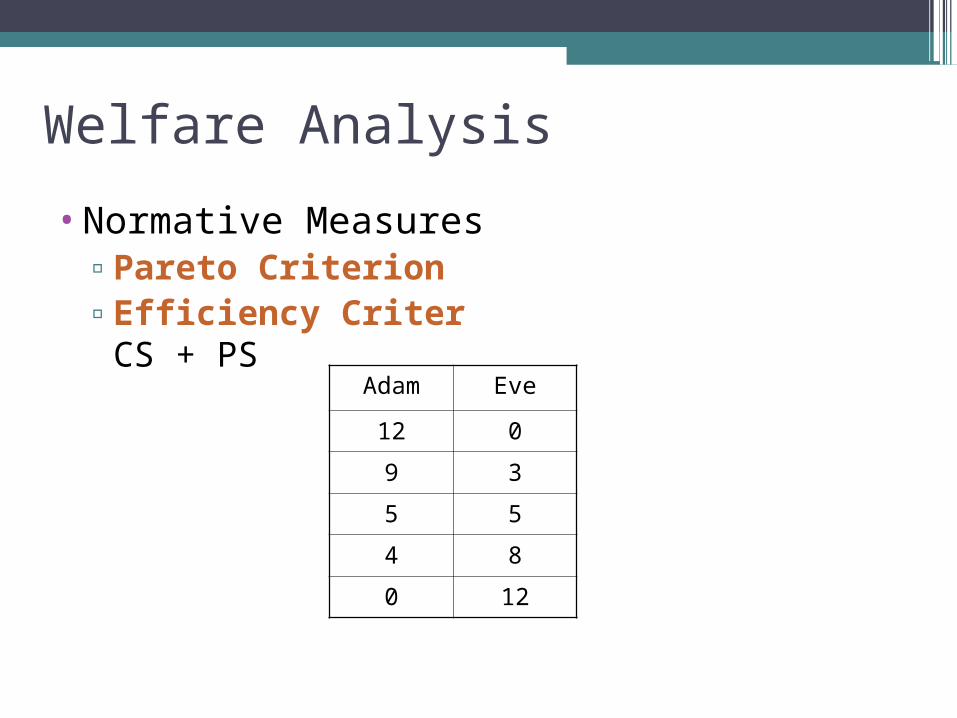
Welfare Analysis
•Normative Measures▫Pareto Criterion▫Efficiency Criterion: maximize SW = CS
+ PSAdam Eve
12 0
9 3
5 5
4 8
0 12
CS
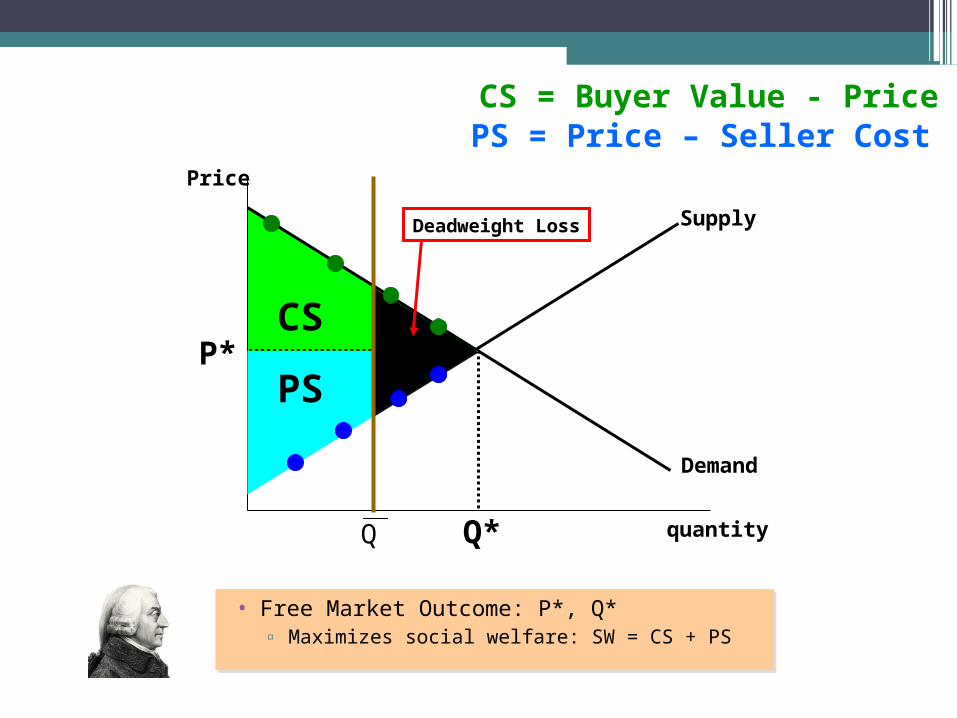
• Free Market Outcome: P*, Q*▫ Maximizes social welfare: SW = CS + PS
• Free Market Outcome: P*, Q*▫ Maximizes social welfare: SW = CS + PS
Supply
Demand
quantity
Price
Q*
P*PS
Deadweight Loss
Q
CS = Buyer Value - PricePS = Price – Seller Cost

Applications
•Price Ceilings•Price Floors•Taxes•Subsidies•Quotas