economics for healthcare managers, third edition
TRANSCRIPT

Copyright 2015 Health Administration Press
Economics for Healthcare Managers, Third Edition
Instructor’s Manual
Robert H. Lee Department of Health Policy and Management
University of Kansas
Copyright 2015 Health Administration Press
Contents Chapter 1: Why Health Economics? ............................................................................................... 5
Key Concepts .............................................................................................................................. 5
Solved Exercises ......................................................................................................................... 5
Case 1.1: An Upset Customer ..................................................................................................... 7
Case 1.2: Questions About Tax Exemptions .............................................................................. 8
Case 1.3: Why Is the Pressure to Reduce Healthcare Costs So Strong? ..................................... 8
Chapter 2: An Overview of the US Healthcare System .................................................................. 9
Key Concepts .............................................................................................................................. 9
Solved Exercises ......................................................................................................................... 9
Case 2.1: A Pain in the Back .................................................................................................... 11
Chapter 3: An Overview of the Healthcare Financing System ..................................................... 12
Key Concepts ............................................................................................................................ 12
Solved Exercises ....................................................................................................................... 12
Case 3.1: Federal Employees Health Benefits Program as the Model for Marketplace Plans . 14
Case 3.2: Group Health Cooperative’s Patient-Centered Medical Home ................................. 15
Chapter 4: Describing, Evaluating, and Managing Risk............................................................... 16
Key Concepts ............................................................................................................................ 16
Solved Exercises ....................................................................................................................... 16
Case 4.1: Betting on Medicare Advantage ............................................................................... 19
Case 4.2: Investing in Cardiology Services .............................................................................. 20
Case 4.3: Diversification by Joint Venture ............................................................................... 20
Chapter 5: Cost ............................................................................................................................. 22
Key Concepts ............................................................................................................................ 22
Solved Exercises ....................................................................................................................... 22
Case 5.1: Virginia Mason Medical Center ................................................................................ 27
Case 5.2: Improving Performance ............................................................................................ 28
Case 5.3: The Costs of Nonurgent Care in the Emergency Department ................................ 288
Chapter 6: Bending the Cost Curve .............................................................................................. 30
Key Concepts ............................................................................................................................ 30
Solved Exercises ....................................................................................................................... 30
Chapter 7: The Demand for Healthcare Products ......................................................................... 33
Key Concepts ............................................................................................................................ 33
Economics for Healthcare Managers, Third Edition – Instructor’s Manual 3
Copyright 2015 Health Administration Press
Solved Exercises ....................................................................................................................... 33
Case 7.1: MinuteClinic ............................................................................................................. 39
Chapter 8: Elasticities ................................................................................................................... 40
Key Concepts ............................................................................................................................ 40
Solved Exercises ....................................................................................................................... 40
Case 8.1: Mental Health Parity ................................................................................................. 43
Case 8.2: Reducing Waiting Time ............................................................................................ 43
Chapter 9: Forecasting .................................................................................................................. 45
Key Concepts ............................................................................................................................ 45
Solved Exercises ....................................................................................................................... 45
Case 9.1: Building a New Urgent Care Center ......................................................................... 52
Case 9.2: Forecasting the Demand for Transfusions ................................................................ 52
Chapter 10: Supply and Demand Analysis ................................................................................... 53
Key Concepts ............................................................................................................................ 53
Solved Exercises ....................................................................................................................... 53
Case 10.1: Worrying About Demand Shifts ............................................................................. 59
Case 10.2: How Large Will the Shortage of Primary Care Physicians Be? ............................. 60
Chapter 11: Maximizing Profits.................................................................................................... 62
Key Concepts ............................................................................................................................ 62
Solved Exercises ....................................................................................................................... 62
Case 11.1: Perfecting Patient Care ............................................................................................ 65
Case 11.2: Tax Exemption for Not-for-Profit Hospitals ........................................................... 66
Chapter 12: Pricing ....................................................................................................................... 67
Key Concepts ............................................................................................................................ 67
Solved Exercises ....................................................................................................................... 67
Case 12.1: Price Discrimination in Practice ............................................................................. 70
Case 12.2: What Should You Charge? ..................................................................................... 71
Case 12.3: Should My Firm Accept This Contract? ................................................................. 72
Chapter 13: Asymmetric Information and Incentives ................................................................... 73
Key Concepts ............................................................................................................................ 73
Solved Exercises ....................................................................................................................... 73
Case 13.1: Improving Safety..................................................................................................... 77

Economics for Healthcare Managers, Third Edition – Instructor’s Manual 4
Copyright 2015 Health Administration Press
Case 13.2: Improving Total Knee Replacement at Brigham and Women’s Hospital .............. 78
Chapter 14: Economic Analysis of Clinical and Managerial Interventions ................................. 79
Key Concepts ............................................................................................................................ 79
Solved Exercises ....................................................................................................................... 79
Case 14.1: Teledermatology ..................................................................................................... 82
Chapter 15: Profits, Market Structure, and Market Power ........................................................... 83
Key Concepts ............................................................................................................................ 83
Solved Exercises ....................................................................................................................... 83
Case 15.1: Deregulating Pharmaceutical Advertising .............................................................. 86
Chapter 16: Government Intervention in Healthcare Markets ...................................................... 88
Key Concepts ............................................................................................................................ 88
Solved Exercises ....................................................................................................................... 88
Case 16.1: Setting Prices for Walkers ....................................................................................... 92
Case 16.2: To Vaccinate or Not ................................................................................................ 92
Case 16.3: Diagnosing Chest Pains .......................................................................................... 93
Chapter 17: Regulation ................................................................................................................. 94
Key Concepts ............................................................................................................................ 94
Solved Exercises ....................................................................................................................... 94
Case 17.1: Monks, Caskets, and the Supreme Court ................................................................ 96
Case 17.2: Self-Regulation ....................................................................................................... 97
Case 17.3: Changing Consumer Information ............................................................................ 97
Chapter 18: Behavioral Economics .............................................................................................. 99
Key Concepts ............................................................................................................................ 99
Solved Exercises ....................................................................................................................... 99

Economics for Healthcare Managers, Third Edition – Instructor’s Manual 5
Copyright 2015 Health Administration Press
Chapter 1: Why Health Economics? Key Concepts Economics helps managers focus on key issues.
Economics helps managers understand goal-oriented decision making.
Economics helps managers understand strategic decision making.
Economics gives managers a framework for understanding costs.
Economics gives managers a framework for understanding market demand.
Economics gives managers a framework for assessing profitability.
Healthcare managers must deal effectively with risk and uncertainty.
Healthcare managers must contend with the management problems that insurance presents.
Information asymmetries create a number of problems for healthcare managers.
Not-for-profit organizations create unique problems for managers.
Rapid change in the healthcare system forces managers to lead their organizations into unfamiliar territory on a routine basis.
Solved Exercises1 1.1. Why is the idea that value depends on consumers’ preferences radical? The idea that “the
customer is always right” is not widely held in healthcare. Insisting that consumers’ preferences define value challenges the belief system of many professionals.
1.2. Mechanics usually have better information about how to fix automobiles than their customers do. What problems does this advantage create? Do mechanics or their customers do anything to limit these problems? In some cases mechanics take advantage of their customers. In other cases customers are reluctant to take their car to a mechanic or follow his advice. Customers try to use information from associates to identify reliable mechanics and try to patronize one mechanic, understanding that taking good care of repeat customers is in the self-interest of mechanics. Mechanics seek certification programs, develop brand names, and offer guarantees.
1 The discussion questions in this guide can be analyzed in some length. The answers provided here are merely illustrative. An instructor who chooses to focus on the answer to a question will surely develop a more detailed response.

Economics for Healthcare Managers, Third Edition – Instructor’s Manual 6
Copyright 2015 Health Administration Press
1.3. A mandatory health insurance plan costs $4,000. One worker earns $24,500 in employment income and $500 in investment income. Another worker earns $48,000 in employment income and $2,000 in investment income. A third worker earns $68,000 in employment income and $7,000 in investment income. A premium-based system would cost each worker $4,000. A wage tax–based system would cost each worker 8.5 percent of wages. An income tax–based system would cost each worker 8 percent of income. For each worker, calculate the cost of the insurance as a share of total income.
E = Employment Income $24,500 $48,000 $68,000
I = Investment Income $500 $2,000 $7,000
P = Premium cost of insurance $4,000 $4,000 $4,000
Premium as a percentage of income = P/(E + I) 16.0% 8.0% 5.3%
W = Wage tax cost of insurance = 0.085 E $2,083 $4,080 $5,780
Wage tax as a percentage of income = W/(E + I) 8.3% 8.2% 7.7%
T = Income tax cost of insurance = 0.085 (E + I) $2,000 $4,000 $6,000
Income tax as a percentage of income = T/(E + I) 8.0% 8.0% 8.0%
1.4. Which of the payment systems in Exercise 1.3 would impose the largest burden on those with incomes under $25,000: a plan financed via premiums, via the income tax, or via a payroll tax? The easiest way to look at this is to compare the cost as a percentage of income. The premium cost is 16 percent of income for those with incomes under $25,000, so it poses the greatest burden.
1.5. Which of the plans in Exercise 1.3 would be fairest? To answer this question requires a definition of fairness, and different individuals will have different definitions. For example, one definition could be that the price was the same for everyone. Only the premium-based plan meets this test. Another definition of fairness might be having cost be the same percentage of income for everyone. Only the income tax–based plan meets this test.
1.6. Which of these questions can you answer using positive economics? For which of the preceding questions must you use normative economics? “Which plan would be fairest?” clearly involves normative decisions. It is tempting, but not entirely correct, to say that the analysis of the burden of health insurance costs involves no normative judgments. Making the decision to analyze spending as a percentage of income also reflects the analyst’s belief that this is the best way to describe spending. What one chooses to analyze often reflects one’s values, even if the analysis that follows is completely positive.
Economics for Healthcare Managers, Third Edition – Instructor’s Manual 7
Copyright 2015 Health Administration Press
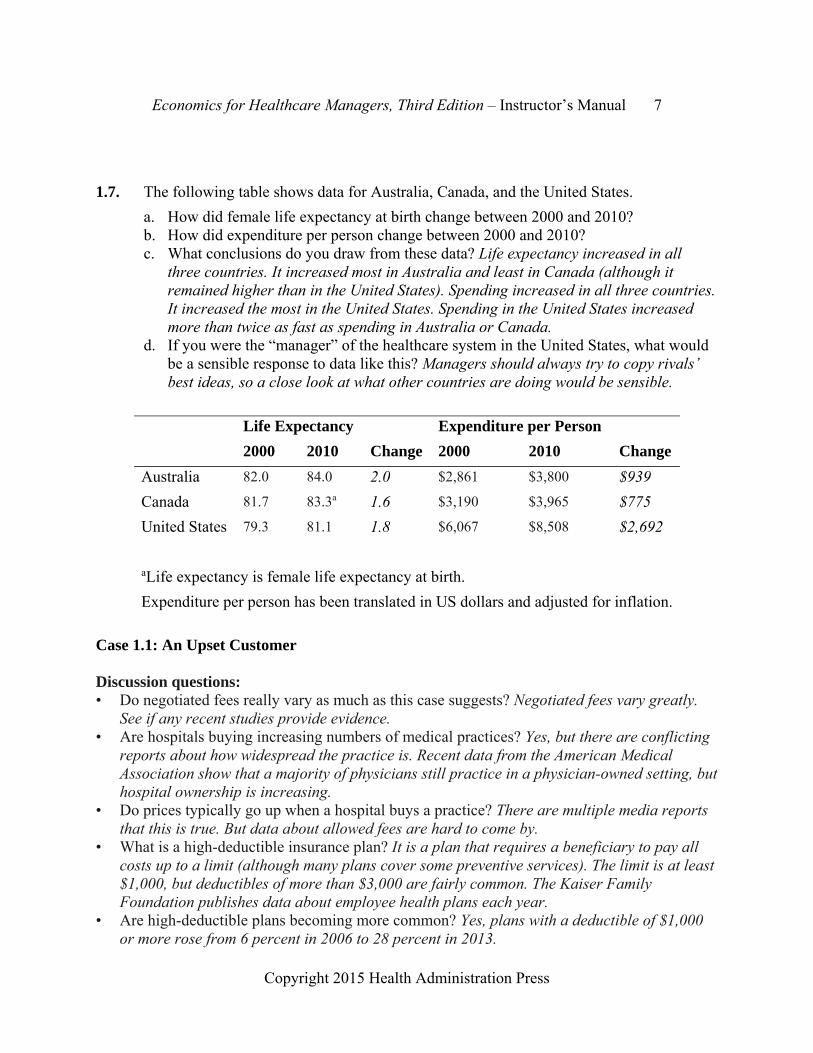
1.7. The following table shows data for Australia, Canada, and the United States.
a. How did female life expectancy at birth change between 2000 and 2010? b. How did expenditure per person change between 2000 and 2010? c. What conclusions do you draw from these data? Life expectancy increased in all
three countries. It increased most in Australia and least in Canada (although it remained higher than in the United States). Spending increased in all three countries. It increased the most in the United States. Spending in the United States increased more than twice as fast as spending in Australia or Canada.
d. If you were the “manager” of the healthcare system in the United States, what would be a sensible response to data like this? Managers should always try to copy rivals’ best ideas, so a close look at what other countries are doing would be sensible.
Life Expectancy Expenditure per Person
2000 2010 Change 2000 2010 Change
Australia 82.0 84.0 2.0 $2,861 $3,800 $939
Canada 81.7 83.3a 1.6 $3,190 $3,965 $775
United States 79.3 81.1 1.8 $6,067 $8,508 $2,692
aLife expectancy is female life expectancy at birth.
Expenditure per person has been translated in US dollars and adjusted for inflation.
Case 1.1: An Upset Customer Discussion questions: • Do negotiated fees really vary as much as this case suggests? Negotiated fees vary greatly.
See if any recent studies provide evidence. • Are hospitals buying increasing numbers of medical practices? Yes, but there are conflicting
reports about how widespread the practice is. Recent data from the American Medical Association show that a majority of physicians still practice in a physician-owned setting, but hospital ownership is increasing.
• Do prices typically go up when a hospital buys a practice? There are multiple media reports that this is true. But data about allowed fees are hard to come by.
• What is a high-deductible insurance plan? It is a plan that requires a beneficiary to pay all costs up to a limit (although many plans cover some preventive services). The limit is at least $1,000, but deductibles of more than $3,000 are fairly common. The Kaiser Family Foundation publishes data about employee health plans each year.
• Are high-deductible plans becoming more common? Yes, plans with a deductible of $1,000 or more rose from 6 percent in 2006 to 28 percent in 2013.

Economics for Healthcare Managers, Third Edition – Instructor’s Manual 8
Copyright 2015 Health Administration Press
• Is buying medical practices a profitable strategy for hospitals? Hospitals lose money on most practices that they buy. They may offset this via increased referrals.
• If you were this customer, how would you react? Case 1.2: Questions About Tax Exemptions Discussion questions: • What do hospitals have to do to qualify for tax-exempt status? The answer varies. In some
states there are specific requirements. In others there are not. The Affordable Care Act (ACA) sets some standards, but does not set dollar or percentage amounts.
• How much charity care do hospitals provide on average? No national data are available, but a 2010 study found that California not-for-profit hospitals provide $1,428,513,583 in charity care.
• How much is tax-exempt status worth to hospitals? The same study found that these hospitals saved $3,271,614,090 by being tax exempt.
• Should the University of Pittsburgh Medical Center be required to pay Pittsburgh taxes? Case 1.3: Why Is the Pressure to Reduce Healthcare Costs So Strong? Discussion questions: • Why is spending so much more than other countries on healthcare a problem? More
resources would be available for other goals. • What can Americans not buy due to high spending on healthcare? Examples would include
education (because of pressure on state budgets from Medicaid) or transportation (because of pressure on the federal budget from Medicaid).
• What factors other than healthcare affect population health? Nutrition, neighborhood safety, clean water, and many more factors affect health.
• Does this evidence suggest that the American healthcare system is not efficient? Spending more and getting poorer results does suggest inefficiency.

Economics for Healthcare Managers, Third Edition – Instructor’s Manual 9
Copyright 2015 Health Administration Press
Chapter 2: An Overview of the US Healthcare System Key Concepts Healthcare products are inputs into health.
Healthcare products are also outputs of the healthcare sector.
The usefulness of healthcare products varies widely.
Marginal analysis helps managers focus on the right questions.
Life expectancies have increased sharply in the United States in recent years.
Other wealthy countries have seen larger health gains with smaller cost increases.
The healthcare sector may change radically in response to technology and policy changes.
Solved Exercises 2.1. Identify a product that is one organization’s output and another organization’s input.
Among the possible examples are pharmaceuticals. They are produced in one organization and used in another.
2.2. Can you think of any initiatives that reflect the input view of healthcare? Corporate wellness programs are good examples. The belief is that better nutrition and exercise will result in healthier, more productive employees. Moreover, advocates believe that increasing the use of these nonmedical inputs will reduce the use of medical inputs.
2.3. What’s wrong with spending 17.2 percent of GDP on healthcare? Nothing, unless consumers and their representatives believe that this healthcare spending is not giving them enough value.
2.4. Americans spend more on smartphones than the citizens of other countries, yet this type of spending is seldom described as a problem. Why is spending more on healthcare different? The biggest difference is that Americans have directly voted with their dollars to increase spending on smartphones. Their decisions about healthcare spending seldom reflect the true cost of the resources involved (because of extensive subsidies). When it comes to healthcare, Americans usually feel they are spending “someone else’s money.” More accurately, they are paying indirectly for healthcare by paying taxes, by accepting lower wages, or by paying insurance premiums. Indirect payment creates an incentive to spend too much.
2.5. US national health expenditure was $7,026 per person in 2006 and $4,790 in 2000. The Consumer Price Index had a value of 201.6 in 2006 and a value of 172.2 in 2000. Adjusted for inflation, how much was spending in 2000? To adjust spending in 2000 for inflation simply multiply actual spending by the Consumer Price Index for 2006 and divide by the Consumer Price Index for 2000. This gives $5,608 = $4,790 201.6/172.2.
2.6. US national health expenditure was $148 per person in 1960 and $4,790 in 2000. The Consumer Price Index had a value of 29.6 in 1960 and a value of 172.2 in 2000. In 1960
Economics for Healthcare Managers, Third Edition – Instructor’s Manual 10
Copyright 2015 Health Administration Press
dollars, how much was spending in 2000? To adjust spending in 1960 for inflation simply multiply actual spending by the Consumer Price Index for 2006 and divide by the Consumer Price Index for 1960. This gives $1,008 = $148 201.6/29.6.
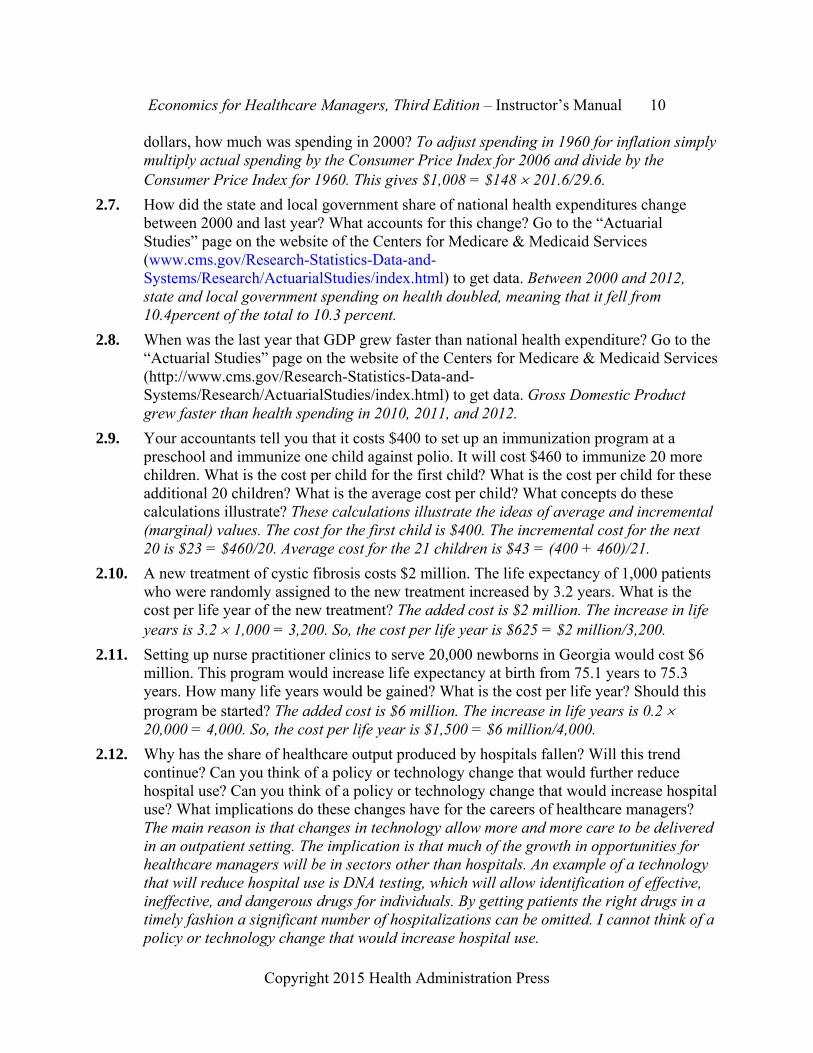
2.7. How did the state and local government share of national health expenditures change between 2000 and last year? What accounts for this change? Go to the “Actuarial Studies” page on the website of the Centers for Medicare & Medicaid Services (www.cms.gov/Research-Statistics-Data-and-Systems/Research/ActuarialStudies/index.html) to get data. Between 2000 and 2012, state and local government spending on health doubled, meaning that it fell from 10.4percent of the total to 10.3 percent.
2.8. When was the last year that GDP grew faster than national health expenditure? Go to the “Actuarial Studies” page on the website of the Centers for Medicare & Medicaid Services (http://www.cms.gov/Research-Statistics-Data-and-Systems/Research/ActuarialStudies/index.html) to get data. Gross Domestic Product grew faster than health spending in 2010, 2011, and 2012.
2.9. Your accountants tell you that it costs $400 to set up an immunization program at a preschool and immunize one child against polio. It will cost $460 to immunize 20 more children. What is the cost per child for the first child? What is the cost per child for these additional 20 children? What is the average cost per child? What concepts do these calculations illustrate? These calculations illustrate the ideas of average and incremental (marginal) values. The cost for the first child is $400. The incremental cost for the next 20 is $23 = $460/20. Average cost for the 21 children is $43 = (400 + 460)/21.
2.10. A new treatment of cystic fibrosis costs $2 million. The life expectancy of 1,000 patients who were randomly assigned to the new treatment increased by 3.2 years. What is the cost per life year of the new treatment? The added cost is $2 million. The increase in life years is 3.2 1,000 = 3,200. So, the cost per life year is $625 = $2 million/3,200.
2.11. Setting up nurse practitioner clinics to serve 20,000 newborns in Georgia would cost $6 million. This program would increase life expectancy at birth from 75.1 years to 75.3 years. How many life years would be gained? What is the cost per life year? Should this program be started? The added cost is $6 million. The increase in life years is 0.2 20,000 = 4,000. So, the cost per life year is $1,500 = $6 million/4,000.
2.12. Why has the share of healthcare output produced by hospitals fallen? Will this trend continue? Can you think of a policy or technology change that would further reduce hospital use? Can you think of a policy or technology change that would increase hospital use? What implications do these changes have for the careers of healthcare managers? The main reason is that changes in technology allow more and more care to be delivered in an outpatient setting. The implication is that much of the growth in opportunities for healthcare managers will be in sectors other than hospitals. An example of a technology that will reduce hospital use is DNA testing, which will allow identification of effective, ineffective, and dangerous drugs for individuals. By getting patients the right drugs in a timely fashion a significant number of hospitalizations can be omitted. I cannot think of a policy or technology change that would increase hospital use.
Economics for Healthcare Managers, Third Edition – Instructor’s Manual 11
Copyright 2015 Health Administration Press
Case 2.1: A Pain in the Back Discussion questions: • If imaging followed by surgery is as effective as conservative therapy, what’s wrong with
letting physicians and patients do what they want? Imaging followed by surgery will cost much more than conservative therapy, so it drives up costs.
• What explains this rise of imaging and surgery for back pain? It is not completely clear, but imaging and surgery are usually quite profitable for physicians and health systems. Some physicians may order imaging studies because of malpractice concerns.
• Who makes decisions about surgery? Patients decide on surgery, based on the recommendations of their physicians.
• Should insurers take action to reduce surgery rates? Should individuals? Insurers are in a better position to reduce rates than individuals, who may be poorly informed.
• How do providers’ revenues change if imaging and surgery rates rise? They go up. • How do patients’ costs change if imaging and surgery rates rise? They go up. • How do current incentive systems affect physicians’ and patients’ decisions? If they are paid
per procedure, imaging followed by surgery will be much more profitable for physicians than conservative therapy. Increasingly, though, high rates of imaging studies are being used as an indicator of poor quality, which makes imaging studies less attractive for physicians. For well-insured patients in a standard PPO, imaging followed by surgery will not entail very large out-of-pocket spending. For the increasing number of patients in high-deductible plans, the cost of imaging followed by surgery will be quite high.
Economics for Healthcare Managers, Third Edition – Instructor’s Manual 12
Copyright 2015 Health Administration Press
Chapter 3: An Overview of the Healthcare Financing System Key Concepts Consumers pay for most medical care indirectly, through taxes and insurance premiums. Direct payments for healthcare are often called out-of-pocket payments. Insurance pools the risks of high healthcare costs. Moral hazard and adverse selection complicate risk pooling. About 85 percent of the US population has medical insurance. Most consumers obtain coverage through an employer- or government-sponsored plan. Receiving insurance as a benefit of employment has significant tax benefits. Managed care has largely replaced traditional insurance. Managed care plans differ widely. Solved Exercises 3.1. Why is health insurance necessary? Health insurance is necessary because healthcare
costs are so skewed. Most people spend relatively little, but an unfortunate few spend huge amounts. People often want insurance to protect them from large, uncommon losses.
3.2. Explain how adverse selection and moral hazard are different, and give an example of each. Adverse selection involves individuals with different risks sorting themselves into different insurance pools. For example, young, healthy workers who do not have a personal physician are more likely to join an HMO than are older or less healthy workers who have an established relationship with a physician. So, average spending will be lower for the HMO group, even if the HMO does nothing to reduce costs. Moral hazard involves purchasing a product or purchasing more of a product because it is covered by insurance (and the consumer bears only part of the cost). For example, a consumer with coverage for flu shots is more likely to get them than a consumer without coverage.
3.3. “The United States is the land of the overinsured, the underinsured, and the uninsured.” What do you think that these concepts mean? Why might this comment be true? About 48 million Americans lacked health insurance as of 2014, so the third part of the comment is clear. Many Americans with insurance are overinsured because they have coverage for “uninsurable” expenses. A small expense that occurs with high probability, such as routine dental examinations or replacement of eyeglasses, costs much more to buy via insurance than it does directly and is said to be uninsurable. Insurance benefits are just ways of reducing taxes. These same consumers may have very limited coverage for uncommon, expensive services (which are precisely the sorts of expenses that insurance should cover). Consumers like these are underinsured, because they are at risk for catastrophic expenses. These first two comments are true largely because the tax code gives very large subsidies to high-income employees who get health insurance benefits at work and no subsidies to low-income employees who do not. Why so many people are left
Economics for Healthcare Managers, Third Edition – Instructor’s Manual 13
Copyright 2015 Health Administration Press
at risk for catastrophic expenses is not clear.
3.4. Private health insurers have been slow to develop and adopt proven cost containment innovations (e.g., case rates or disease management programs). Why do you think that is the case? Most have such a small market share that it is difficult to get providers to accept unfamiliar payment systems. In addition, a company that spent its resources to develop a successful program would find that other companies that did not would quickly copy it. The payoff to innovation is apt to be small. In addition, until recently many companies lacked the analytic capacity to assess cost containment strategies.
3.5. A radiology firm charges $2,000 per exam. Uninsured patients are expected to pay list price. How much do they pay? Usually they will pay $2,000.
3.6. A radiology firm charges $2,000 per exam. An insurer’s allowed fee is 80 percent of charges. Its beneficiaries pay 25 percent of the allowed fee. How much does the insurer pay? How much does the beneficiary pay? The allowed fee is $1,600 = 0.8*$2,000. Of this beneficiaries pay $400 and the insurer pays $1,200.
3.7. If the radiology firm raised its charge to $3,000, how much would the insurer pay? How much would the beneficiary pay? The allowed fee would rise $2,400 = 0.8 $3,000. Of this, beneficiaries pay $600 and the insurer pays $1,800.
3.8. A surgeon charges $2,400 for hernia surgery. He contracts with an insurer that allows a fee of $800. Patients pay 20 percent of the allowed fee. How much does the insurer pay? How much does the patient pay? The allowed fee is $800, of which patients pay $160 and the insurer pays $640.
3.9. You have incurred a medical bill of $10,000. Your plan has a deductible of $1,000 and coinsurance of 20 percent. How much of this bill will you have to pay directly? You will pay $2,800. The deductible is $1,000 and the coinsurance is $1,800 = 0.2 ($10,000 - $1,000).
3.10. Why do employers provide health insurance coverage to their employees? Employees want insurance coverage, so employers offer it to attract and retain them.
3.11. Your practice offers only a PPO with a large deductible, high coinsurance, and a limited network. You pay $400 per month for single coverage. Some of your employees have been urging you to offer a more generous plan. Who would you expect to choose the more generous plan and pay any extra premium? Such a plan would be most attractive to those who anticipate high expenditures, primarily those with pre-existing conditions.
3.12. What are the fundamental differences between HMO and PPO plans? PPO plans usually have larger provider networks and less restrictive coverage of out-of-network providers.
3.13. Suppose that your employer offered you $4,000 in cash instead of health insurance coverage. Health insurance is excluded from state and federal income taxes. (To keep the problem simple we will ignore Social Security and Medicare wage taxes.) The cash would be subject to state income taxes (8 percent) and federal income taxes (28 percent). How much would your after-tax income go up if you took the cash rather than the insurance?
Economics for Healthcare Managers, Third Edition – Instructor’s Manual 14
Copyright 2015 Health Administration Press
P = Pretax Amount $4,000
F = Federal income tax = -0.28*P -$1,120
S = State income tax § = -.08*P -$306
$2,560
These calculations matter in health insurance. For this worker, one dollar in cash payments results in only about 64 cents in after-tax income. Accordingly, as long as a dollar’s worth of health insurance is worth more than 64 cents, he or she will prefer insurance to cash.
3.14. How different would this calculation look for a worker who earned $500,000 and lived in Vermont? This worker would face a state income tax rate of 9.5 percent and a federal income tax rate of 35 percent. This worker would pay additional federal income taxes of $1,400 and additional state income taxes of $380. As a result, her take-home pay would only go up by $2,220, or 56 cents per dollar. So, the tax advantage of getting health insurance instead of cash is larger for this worker (and would be even if we factored in Medicare and Social Security taxes).
Case 3.1: Federal Employees Health Benefits Program as the Model for Marketplace Plans
Discussion questions:
• One plan costs $8,000. The government will pay $6,500. How much would a $10,000 plan cost the employee? The employee would pay $3,500.
• Is equal government payment important, regardless of the plan the employee chooses? Yes, it exposes the employee to the full incremental cost of a more expensive plan. This means that employees pay more attention to the costs of coverage.
• How does equal payment affect employees’ choices? Equal premiums encourage employees to choose less expensive plans.
• Would varying premiums (such as premiums based on age) work better, so that older employees would be attractive risks for insurers? They might, although there are tradeoffs between pricing insurance so that all groups of customers represent good risks, pooling risks over the largest groups possible, and keeping insurance as simple as possible.
• What problems would varying premiums cause? It might increase the number of uninsured workers, as older, low-income workers gamble that they will not get sick.
• Why didn’t insurers for the Federal Employees Health Benefits Program take aggressive steps (like creating narrow networks) to bring down premiums? It did not seem to be necessary to compete successfully for customers, because no other insurers were taking the steps either. And workers’ direct payments were modest, so there was little pressure from
Economics for Healthcare Managers, Third Edition – Instructor’s Manual 15
Copyright 2015 Health Administration Press
customers to take these steps.
• Why do the high incomes of federal employees affect their choices? Consumers with high incomes tend to be less price sensitive than consumers with low incomes. In the context of insurance, they tend to buy more generous plans that offer better protection against financial and medical risks. Because their tax rates are higher, they may also want coverage that turns predictable after-tax spending into pre-tax spending on insurance premiums.
Case 3.2: Group Health Cooperative’s Patient-Centered Medical Home Discussion questions: • Why would it make sense to become a network model HMO? By becoming a network model
HMO (one that signs contracts with some of its providers rather than owning them), Group Health could expand at lower cost.
• Would you like to get your primary care at a patient-centered medical home? This depends on personal preferences, so no right answer is possible. It may be a useful way to explore the features of patient-centered medical homes.
• Did it make sense for Group Health to support the patient-centered medical home transition? Group Health is an insurer as well as a provider of care. For an insurer, a patient-centered medical home offers a way of reducing medical costs. For a provider, a patient-centered medical home offers a practice environment that patients, doctors, and nurses prefer. This makes it easier to add patients and attract staff.
• Could an independent practice afford to become a patient-centered medical home? Perhaps it could if most of its competitors were patient-centered medical homes. Being a patient-centered medical home might be required to be an effective competitor. Otherwise, a patient-centered medical home adds costs and may reduce revenue, making it a problematic choice for an independent practice.
• Why is Medicare sponsoring patient-centered medical home demonstrations? Medicare wants to save money, improve beneficiaries’ experience of care, and improve beneficiaries’ health. A patient-centered medical home helps with all of these goals.
• How would a 6 percent reduction in hospitalization rates affect hospitals? They would become less profitable. As much as half of a hospital’s costs do not vary with volume, so a reduction in volume reduces revenue more than cost.

Economics for Healthcare Managers, Third Edition – Instructor’s Manual 16
Copyright 2015 Health Administration Press
Chapter 4: Describing, Evaluating, and Managing Risk Key Concepts Clinical and managerial decisions typically entail uncertainty about what will happen.
Decision makers often have imprecise estimates of the probabilities of various outcomes.
Decision making about risk involves describing, evaluating, and managing potential outcomes.
Insurance and diversification are two ways to manage risk.
Solved Exercises 4.1. Five of ten people earn $0, four earn $100, and one loses $100. What is the expected
payoff? What is the variance of the payoff? An average is just the sum of the earnings divided by the number of observations. In this case there are ten people with total earnings of $300, so the average is $30. A variance is the squared difference between each observation and the average, weighted by the share of observations with a value.
Person Earnings p*(Earnings – Average) 2 1 $0 $90 Average = $30.00 2 0 $90 Variance = 4,100 3 0 $90 4 0 $90 5 0 $90 6 100 $490 7 100 $490 8 100 $490 9 100 $490 10 (100) $1,690
4.2. There is a 50 percent chance of making $0, a 40 percent chance of making $100, and a 10 percent chance of losing $100. Calculate the expected value and variance of the payoff. How does your estimate compare to the previous problem? Your answer is the same, since 0.5 $0 + 0.4 $100 - 0.1 $100 = $30. The variance is 4,100 = 0.5 ($0 - $30)2 + 0.4 ($100 - $30)2+ 0.1 (-$100 - $30)2
Economics for Healthcare Managers, Third Edition – Instructor’s Manual 17
Copyright 2015 Health Administration Press
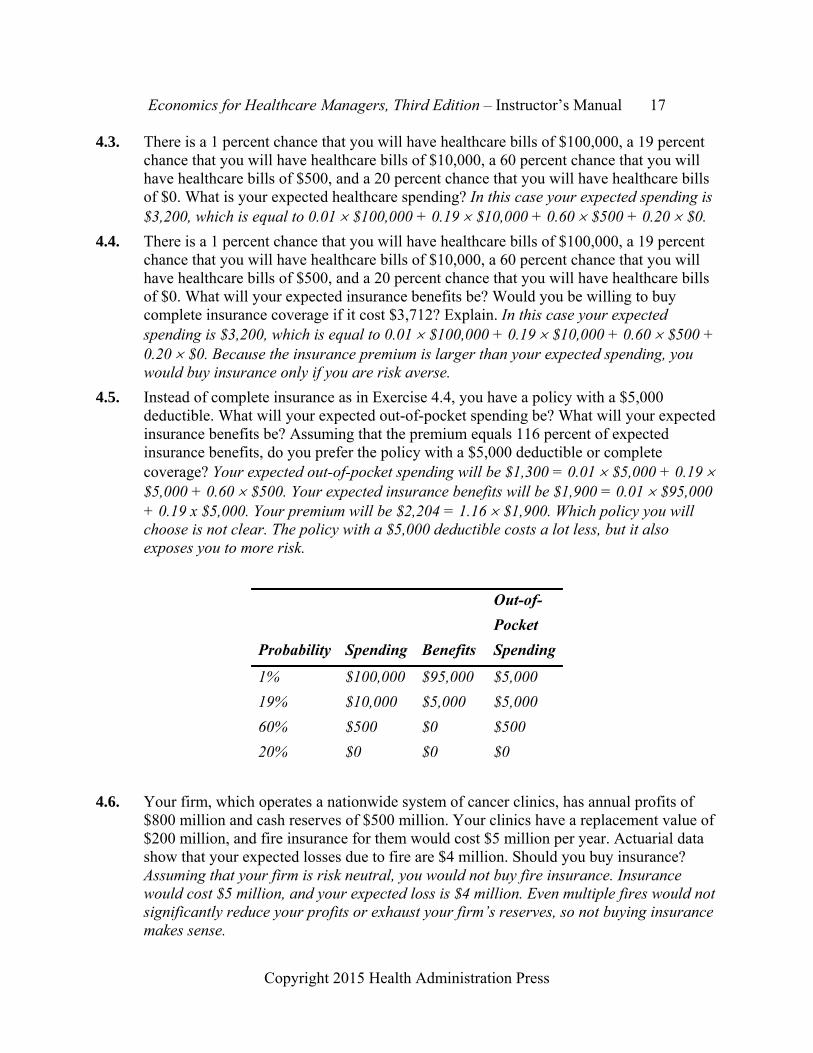
4.3. There is a 1 percent chance that you will have healthcare bills of $100,000, a 19 percent chance that you will have healthcare bills of $10,000, a 60 percent chance that you will have healthcare bills of $500, and a 20 percent chance that you will have healthcare bills of $0. What is your expected healthcare spending? In this case your expected spending is $3,200, which is equal to 0.01 $100,000 + 0.19 $10,000 + 0.60 $500 + 0.20 $0.
4.4. There is a 1 percent chance that you will have healthcare bills of $100,000, a 19 percent chance that you will have healthcare bills of $10,000, a 60 percent chance that you will have healthcare bills of $500, and a 20 percent chance that you will have healthcare bills of $0. What will your expected insurance benefits be? Would you be willing to buy complete insurance coverage if it cost $3,712? Explain. In this case your expected spending is $3,200, which is equal to 0.01 $100,000 + 0.19 $10,000 + 0.60 $500 + 0.20 $0. Because the insurance premium is larger than your expected spending, you would buy insurance only if you are risk averse.
4.5. Instead of complete insurance as in Exercise 4.4, you have a policy with a $5,000 deductible. What will your expected out-of-pocket spending be? What will your expected insurance benefits be? Assuming that the premium equals 116 percent of expected insurance benefits, do you prefer the policy with a $5,000 deductible or complete coverage? Your expected out-of-pocket spending will be $1,300 = 0.01 $5,000 + 0.19 $5,000 + 0.60 $500. Your expected insurance benefits will be $1,900 = 0.01 $95,000 + 0.19 x $5,000. Your premium will be $2,204 = 1.16 $1,900. Which policy you will choose is not clear. The policy with a $5,000 deductible costs a lot less, but it also exposes you to more risk.
Out-of-
Probability Spending Benefits Spending
1% $100,000 $95,000 $5,000
19% $10,000 $5,000 $5,000
60% $500 $0 $500
20% $0 $0 $0
4.6. Your firm, which operates a nationwide system of cancer clinics, has annual profits of $800 million and cash reserves of $500 million. Your clinics have a replacement value of $200 million, and fire insurance for them would cost $5 million per year. Actuarial data show that your expected losses due to fire are $4 million. Should you buy insurance? Assuming that your firm is risk neutral, you would not buy fire insurance. Insurance would cost $5 million, and your expected loss is $4 million. Even multiple fires would not significantly reduce your profits or exhaust your firm’s reserves, so not buying insurance makes sense.
Economics for Healthcare Managers, Third Edition – Instructor’s Manual 18
Copyright 2015 Health Administration Press
4.7. Your firm rents a supply management system to hospitals. You have received a buyout offer of $5 million. You forecast a 25 percent chance that you will have profits of $10 million, a 35 percent chance that you will have profits of $6 million, and a 40 percent chance that you will have profits of $2 million. Should you accept the offer? Explain. Your expected profit is $5.4 million = 0.25 $10 + 0.35 $6 + 0.4 $2. Since expected profits exceed the offer, you would accept it only if you were risk averse. Risk aversion means preferring a sure $5 million to a risky $5.4 million.
4.8. You were given a lottery ticket. The drawing will be held in five minutes. You have a 0.1 percent chance of winning $10,000. You refuse an offer of $11 for your ticket. Are you risk averse? Explain. You are not risk averse. The expected value of your ticket is $10 = 0.001 $10,000. By refusing a sure offer with a higher expected value, you have revealed that you are a risk seeker.
4.9. Your house is worth $200,000. Your risk of a catastrophic flood is 0.5 percent. Such a flood would destroy your house and would not be covered by homeowner’s insurance. Although you grumble, you buy flood coverage for $1,200. Are you risk averse or risk seeking? Your expected loss is $1,000 = 0.005 $200,000. Since you prefer a sure loss of $1,200 to a risky loss of $1,000, you must be risk averse.
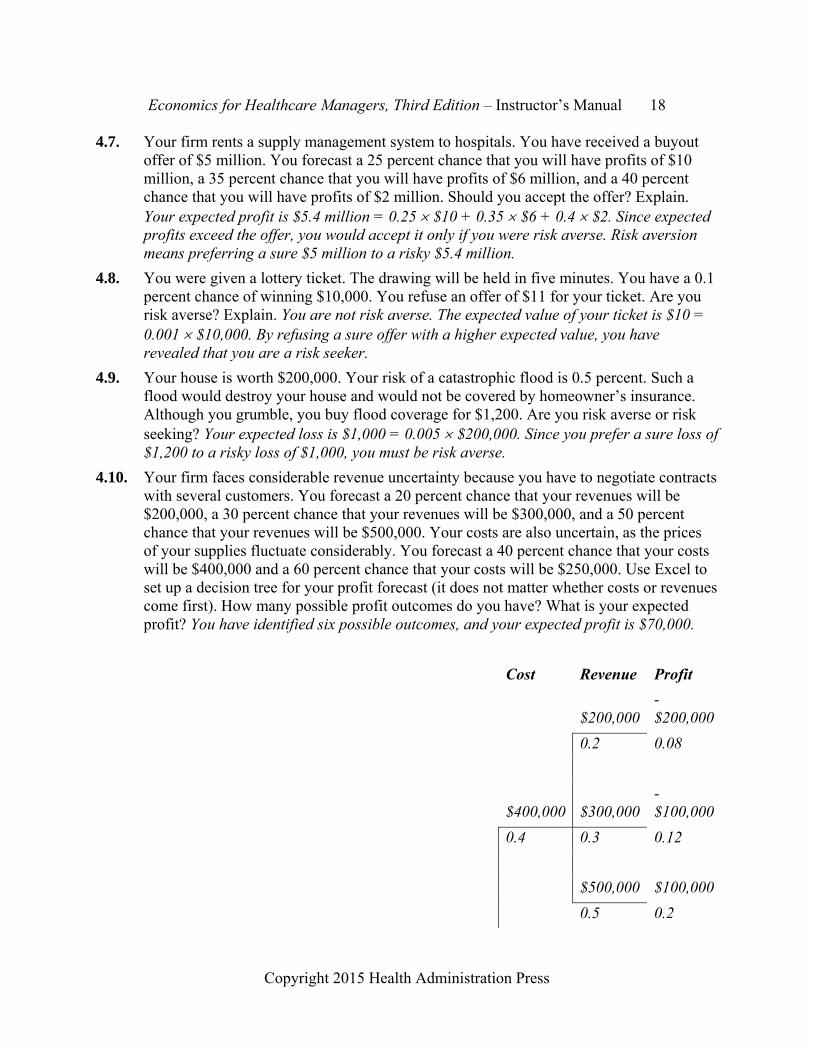
4.10. Your firm faces considerable revenue uncertainty because you have to negotiate contracts with several customers. You forecast a 20 percent chance that your revenues will be $200,000, a 30 percent chance that your revenues will be $300,000, and a 50 percent chance that your revenues will be $500,000. Your costs are also uncertain, as the prices of your supplies fluctuate considerably. You forecast a 40 percent chance that your costs will be $400,000 and a 60 percent chance that your costs will be $250,000. Use Excel to set up a decision tree for your profit forecast (it does not matter whether costs or revenues come first). How many possible profit outcomes do you have? What is your expected profit? You have identified six possible outcomes, and your expected profit is $70,000.
Cost Revenue Profit
$200,000 -$200,000
0.2 0.08
$400,000 $300,000 -$100,000
0.4 0.3 0.12
$500,000 $100,000
0.5 0.2

Economics for Healthcare Managers, Third Edition – Instructor’s Manual 19
Copyright 2015 Health Administration Press
Expected Profit = $70,000
$200,000 -$50,000
0.2 0.12
$250,000 $300,000 $50,000
0.6 0.3 0.18
$500,000 $250,000
0.5 0.3
4.11. Your firm has been sued for $3 million by a supplier for breach of contract. Your lawyers believe that there are three possible outcomes if the suit goes to trial. One, which the lawyers term “highly improbable,” is that your supplier will win the lawsuit and be awarded $3 million. Another, which the lawyers term “unlikely,” is that your supplier will win the lawsuit and be awarded $500,000. The third, which the lawyers term “likely,” is that your supplier will lose the lawsuit and be awarded $0. You have to decide whether to try to settle the case. To do so you need to assign probabilities to “highly improbable,” “unlikely,” and “likely.” What probabilities correspond to these statements? Going to trial will cost you $100,000 in legal fees. One of your lawyers believes that your supplier will settle for $100,000 (plus your legal fees of $25,000). Should you settle? It is not clear what probabilities correspond to these statements, and different people will have different ideas about what they are. Settling will cost you $125,000. Going to court will cost you $100,000. Assume for the moment that a “highly improbable” outcome is half as likely as an “unlikely” outcome. If an “unlikely” outcome has more than a 0.005 chance of happening, settling will be less expensive.
Case 4.1: Betting on Medicare Advantage Discussion questions: • What has happened to Medicare Advantage enrollment since 2012? A good source of current
information is State Health Facts at kff.org. • What has happened to Medicaid managed care enrollment since 2012? A good source of
current information is State Health Facts at kff.org. • Have any insurers pulled out of Medicaid managed care markets during the past year? This

Economics for Healthcare Managers, Third Edition – Instructor’s Manual 20
Copyright 2015 Health Administration Press
will require an internet search, as sources will vary. • Medicare Advantage contracts last a year. What is Aetna risking by betting that Medicare
Advantage will be an attractive opportunity? The main risk is that Medicare Advantage will stop being a profitable product. The company also could lose its initial investments.
• Is Medicare Advantage riskier than other forms of private health insurance? Medicare Advantage may be a little riskier, in that Congress can change the rules. However, companies and other insurance plan sponsors change their requirements too.
• What other healthcare firms also face risks due to changes in government policy? Virtually all healthcare firms face risks due to changes in policy. That includes firms that do little Medicare or Medicaid business.
Case 4.2: Investing in Cardiology Services Discussion questions: • How likely is a change in Medicare payment? What probability should you assign to it? You
certainly cannot assign an objective probability to it. This will be a subjective probability based on your understanding of the situation.
• What will happen to hospital profits if Medicare does switch to bundled payments? They will probably go down, because the organization that gets the bundled payment will have incentives to eliminate low-value services.
• How likely is a failure to recruit three excellent cardiologists? What probability should you assign to this endeavor? What will happen to profits if you are able to recruit only two excellent cardiologists? Again, this will be a subjective probability based on your understanding of the situation. Shea is “confident” that cardiologists can be recruited. That certainly means a probability in excess of 0.50.
• If you set up this scenario as a decision tree, which of your assumptions become clear to other decision makers? The probabilities and the profit forecasts become explicit.
• What are the advantages of making your assumptions clear? What are the disadvantages? The advantages are primarily that others can assess whether the assumptions are reasonable. Being forced to defend your assumptions (and sometimes changing them) will improve decision making. Having to defend your assumptions will add to your preparation time, which may be a disadvantage.
Case 4.3: Diversification by Joint Venture Discussion questions: • Why is expansion outside the United States an attractive form of diversification? Overseas
risks are likely to be uncorrelated with domestic risks. Different political and economic forces are likely to be at work. So, if things are going badly in the United States, they may be

Economics for Healthcare Managers, Third Edition – Instructor’s Manual 21
Copyright 2015 Health Administration Press
going well overseas. • What are the pitfalls of international expansion? An ongoing concern is that you may not
fully appreciate the risks you are accepting. Unfamiliarity with the history and culture may lead you to take on more risky projects than you anticipate.
• What are the potential pitfalls of other diversification efforts? See the answer to the pitfalls of international expansion. Another pitfall is that opportunities that you understand may have risks that are correlated with the risks in your core market. This means that things go well in the new markets when things go well in the core market, so you are not diversifying in a way that really reduces risk.
• What are the main risks that UPMC faces in its Pittsburgh operations? New competition and changes in insurance markets are the main ones.
Economics for Healthcare Managers, Third Edition – Instructor’s Manual 22
Copyright 2015 Health Administration Press
Chapter 5: Cost Key Concepts Costs depend on perspective.
Costs can be hard to measure.
Good managers have an accurate understanding of costs.
Goods and services an organization produces are called outputs.
Goods or service an organization uses in production are called inputs.
Incremental cost equals the change in cost resulting from a change in output.
Average cost equals the total cost of a process divided by the total output of a process.
Large firms have a cost advantage if there are economies of scale.
Multiproduct firms have a cost advantage if there are economies of scope.
Higher quality should mean higher costs. If not, the organization is inefficient.
Higher input prices mean higher costs.
Costs depend on outputs, technology, input prices, and efficiency.
Opportunity cost is the value of a resource in its best alternative use.
Sunk costs, which are costs you cannot change, should be ignored.
Solved Exercises 5.1. Why is it important to distinguish between fixed and variable costs? It is important
because increasing or reducing output only changes variable costs. A common mistake is to lump together fixed and variable costs, thus overestimating the cost of expanding output and overestimating the savings from reducing output.
5.2. Explain how a decrease in input prices or an increase in efficiency would affect costs. The effects would be the same.
5.3. You spent $500,000 on staff training last year. Why should this cost be treated as a sunk cost? Why should this cost be ignored in making a decision whether to switch coding software? Nothing that you can do this year will change what was spent on last year’s staff training. So it is a sunk cost and should be ignored in your software decision.
5.4. Your president bought two acres of land for $200,000 ten years ago. Although it is zoned for commercial use, it currently holds eight small, single-family houses. A property management firm that wants to continue leasing the eight houses has offered you $400,000 for the property. A developer wants to build a 12-story apartment building on
Economics for Healthcare Managers, Third Edition – Instructor’s Manual 23
Copyright 2015 Health Administration Press
the site and has offered $600,000. What value should you assign to the property? The next best (i.e., highest valued) use of the land is for an apartment building. Therefore, you should assign a value of $600,000.
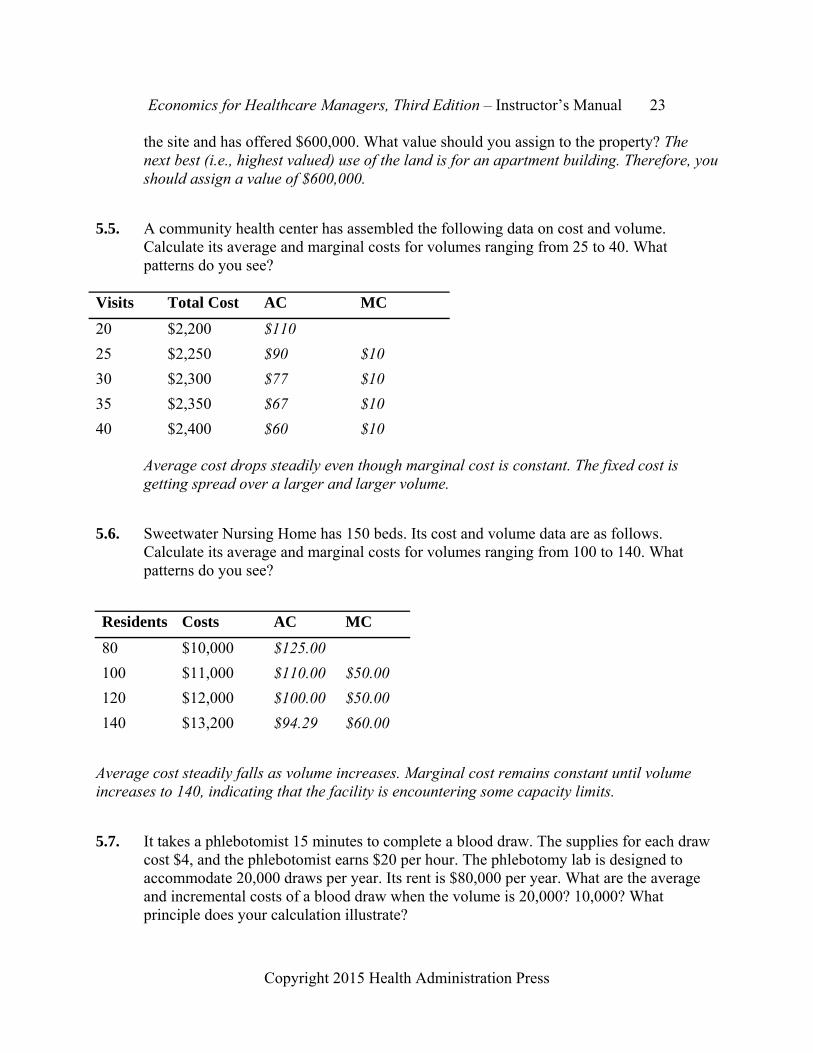
5.5. A community health center has assembled the following data on cost and volume. Calculate its average and marginal costs for volumes ranging from 25 to 40. What patterns do you see?
Average cost drops steadily even though marginal cost is constant. The fixed cost is getting spread over a larger and larger volume.
5.6. Sweetwater Nursing Home has 150 beds. Its cost and volume data are as follows. Calculate its average and marginal costs for volumes ranging from 100 to 140. What patterns do you see?
Residents Costs AC MC
80 $10,000 $125.00
100 $11,000 $110.00 $50.00
120 $12,000 $100.00 $50.00
140 $13,200 $94.29 $60.00
Average cost steadily falls as volume increases. Marginal cost remains constant until volume increases to 140, indicating that the facility is encountering some capacity limits.
5.7. It takes a phlebotomist 15 minutes to complete a blood draw. The supplies for each draw cost $4, and the phlebotomist earns $20 per hour. The phlebotomy lab is designed to accommodate 20,000 draws per year. Its rent is $80,000 per year. What are the average and incremental costs of a blood draw when the volume is 20,000? 10,000? What principle does your calculation illustrate?
Visits Total Cost AC MC
20 $2,200 $110
25 $2,250 $90 $10
30 $2,300 $77 $10
35 $2,350 $67 $10
40 $2,400 $60 $10

Economics for Healthcare Managers, Third Edition – Instructor’s Manual 24
Copyright 2015 Health Administration Press
Costs with a Wage of $20
Volume Total Cost AC MC
0 $80,000
20,000 $260,000 $13.00 $9.00
10,000 $170,000 $17.00 $9.00
The average cost of a blood draw when the volume is 20,000 is $13. The AC is $17 when the volume is 10,000. At smaller volumes the $80,000 in fixed costs results in higher average costs, even though marginal costs are constant.
5.8. How would the average and marginal costs change if the phlebotomist’s wage rose to $24 per hour? What principle does your calculation illustrate?
Costs with a Wage of $24
Volume Total Cost AC MC
0 $80,000
20,000 $280,000 $14.00 $10.00
10,000 $180,000 $18.00 $10.00
The marginal cost of a blood draw is $9 when the wage is $20. It rises to $10 when the wage is $24. The average cost rises by $1 as well. This shows that marginal (and average) costs rise when input prices rise.
5.9. A new computer lets a phlebotomist complete a blood draw in 10 minutes. The supplies for each draw cost $4, and the phlebotomist earns $20 per hour. The phlebotomy lab is designed to accommodate 20,000 draws per year. Its rent is $80,000 per year. What is the marginal cost of a blood draw? What principle does your calculation illustrate?
Costs with a Wage of $20 and a Time of 10 Minutes
Volume Total Cost AC MC
0 $80,000
20,000 $240,000 $12.00 $8.00
10,000 $160,000 $16.00 $8.00
Economics for Healthcare Managers, Third Edition – Instructor’s Manual 25
Copyright 2015 Health Administration Press
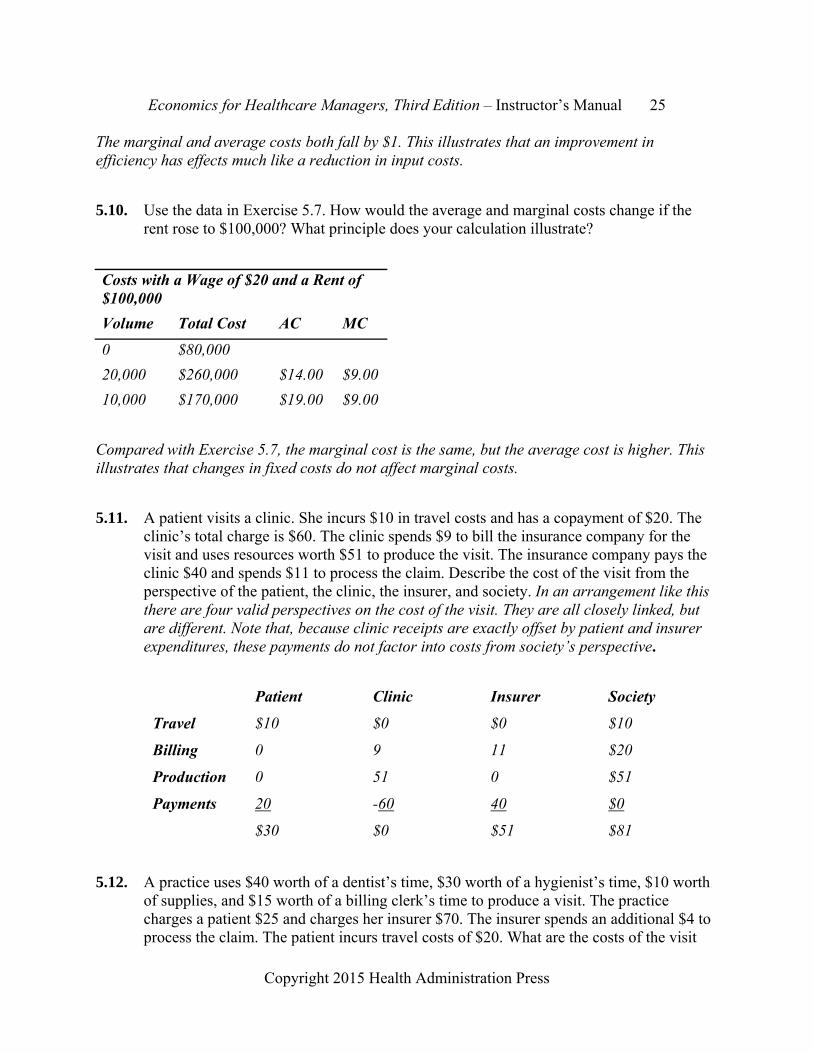
The marginal and average costs both fall by $1. This illustrates that an improvement in efficiency has effects much like a reduction in input costs.
5.10. Use the data in Exercise 5.7. How would the average and marginal costs change if the rent rose to $100,000? What principle does your calculation illustrate?
Costs with a Wage of $20 and a Rent of $100,000
Volume Total Cost AC MC
0 $80,000
20,000 $260,000 $14.00 $9.00
10,000 $170,000 $19.00 $9.00
Compared with Exercise 5.7, the marginal cost is the same, but the average cost is higher. This illustrates that changes in fixed costs do not affect marginal costs.
5.11. A patient visits a clinic. She incurs $10 in travel costs and has a copayment of $20. The clinic’s total charge is $60. The clinic spends $9 to bill the insurance company for the visit and uses resources worth $51 to produce the visit. The insurance company pays the clinic $40 and spends $11 to process the claim. Describe the cost of the visit from the perspective of the patient, the clinic, the insurer, and society. In an arrangement like this there are four valid perspectives on the cost of the visit. They are all closely linked, but are different. Note that, because clinic receipts are exactly offset by patient and insurer expenditures, these payments do not factor into costs from society’s perspective.
Patient Clinic Insurer Society
Travel $10 $0 $0 $10
Billing 0 9 11 $20
Production 0 51 0 $51
Payments 20 -60 40 $0
$30 $0 $51 $81
5.12. A practice uses $40 worth of a dentist’s time, $30 worth of a hygienist’s time, $10 worth of supplies, and $15 worth of a billing clerk’s time to produce a visit. The practice charges a patient $25 and charges her insurer $70. The insurer spends an additional $4 to process the claim. The patient incurs travel costs of $20. What are the costs of the visit

Economics for Healthcare Managers, Third Edition – Instructor’s Manual 26
Copyright 2015 Health Administration Press
from the perspective of society, the patient, the practice, and the insurer?
Patient Patient Insurer Society
Dentist’s time -$40 -$40
Hygienist’s time -$30 -$30
Supplies -$10 -$10
Claims processing -$4 -$4
Clerk’s time -$15 -$15
Travel cost -$20 -$20
Fee $95 -$25 -$70 $0
$0 -$45 -$74 -$119
5.13. Kim and Pat underwrite insurance. Each underwrites 50 accounts per month. Each account takes four hours to underwrite. The value of their time is $40 per hour. Monthly costs for each are $1,500 for an office, $2,000 for a receptionist, and $2,400 for a secretary. Calculate the average and incremental cost per case for Kim and Pat. Since costs are the same for Kim and Pat, we will only calculate Kim’s costs. Average cost simply equals total cost divided by total output. There are two ways to calculate incremental cost. One would be to add up the cost that each additional account requires. The only variable input is Kim or Pat’s time. Since each account takes four hours and time costs $40 per hour, incremental cost is $160. One could also calculate total costs at a volume of 50 and calculate the incremental cost of producing one more. This also finds an incremental cost of $160. Because there are fixed costs and incremental costs are constant, average cost goes down as volume goes up.
Volume 50 51
Kim's Time $8,000 $8,160
Rent $1,500 $1,500
Receptionist $2,000 $2,000
Secretary $2,400 $2,400
Total Cost $13,900 $14,060
Average cost $278 $276
Incremental cost $160
Economics for Healthcare Managers, Third Edition – Instructor’s Manual 27
Copyright 2015 Health Administration Press
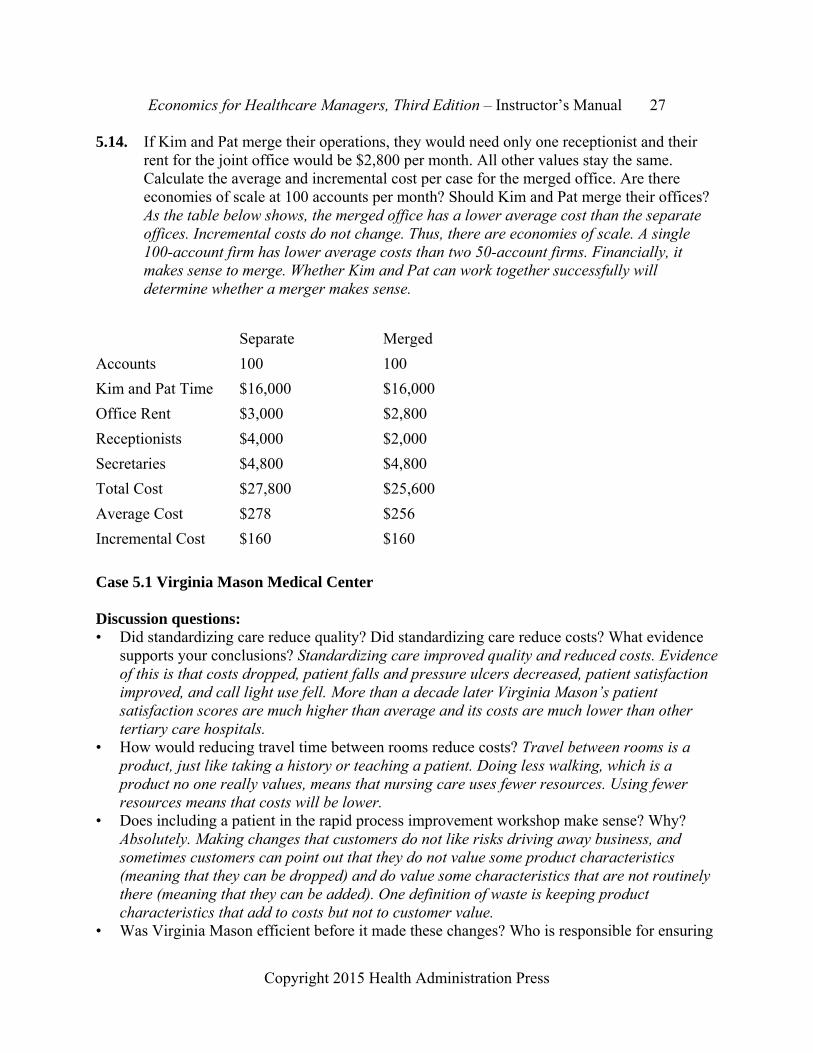
5.14. If Kim and Pat merge their operations, they would need only one receptionist and their rent for the joint office would be $2,800 per month. All other values stay the same. Calculate the average and incremental cost per case for the merged office. Are there economies of scale at 100 accounts per month? Should Kim and Pat merge their offices? As the table below shows, the merged office has a lower average cost than the separate offices. Incremental costs do not change. Thus, there are economies of scale. A single 100-account firm has lower average costs than two 50-account firms. Financially, it makes sense to merge. Whether Kim and Pat can work together successfully will determine whether a merger makes sense.
Separate Merged
Accounts 100 100
Kim and Pat Time $16,000 $16,000
Office Rent $3,000 $2,800
Receptionists $4,000 $2,000
Secretaries $4,800 $4,800
Total Cost $27,800 $25,600
Average Cost $278 $256
Incremental Cost $160 $160
Case 5.1 Virginia Mason Medical Center Discussion questions: • Did standardizing care reduce quality? Did standardizing care reduce costs? What evidence
supports your conclusions? Standardizing care improved quality and reduced costs. Evidence of this is that costs dropped, patient falls and pressure ulcers decreased, patient satisfaction improved, and call light use fell. More than a decade later Virginia Mason’s patient satisfaction scores are much higher than average and its costs are much lower than other tertiary care hospitals.
• How would reducing travel time between rooms reduce costs? Travel between rooms is a product, just like taking a history or teaching a patient. Doing less walking, which is a product no one really values, means that nursing care uses fewer resources. Using fewer resources means that costs will be lower.
• Does including a patient in the rapid process improvement workshop make sense? Why? Absolutely. Making changes that customers do not like risks driving away business, and sometimes customers can point out that they do not value some product characteristics (meaning that they can be dropped) and do value some characteristics that are not routinely there (meaning that they can be added). One definition of waste is keeping product characteristics that add to costs but not to customer value.
• Was Virginia Mason efficient before it made these changes? Who is responsible for ensuring

Economics for Healthcare Managers, Third Edition – Instructor’s Manual 28
Copyright 2015 Health Administration Press
that care is efficient? No, Virginia Mason was not efficient before the changes. Managers are responsible for making care more efficient. Managers are also responsible for making sure that frontline workers are engaged in improving efficiency.
• Why did the nurses resist the changes? Would you expect to encounter resistance in other departments? Resistance to change is common, especially when those involved are concerned that change will affect their professional roles. You should expect to encounter resistance in other departments as well.
Case 5.2 Improving Performance Discussion questions: • Could limiting the number of prostheses improve the quality of care? Yes, it simplifies what
other team members have to master. • Why was a team needed to choose the best way of doing knee replacements? The process
involves many people, and changes at any point can have major effects elsewhere. For example, changes in anesthesia could make recovery care easier or harder. Most performance improvement efforts seek input from those involved in the whole process.
• Is standardization like this common? Should it be? It is not common. Many argue it should be.
• Some of your staff object to standardizing care, calling it “cookbook nursing.” How do you respond? Focus on the benefits for patients. You are trying to improve their care and reduce their financial burdens. You are trying to make sure that your teams offer patients the best care possible.
• What would happen to your organization if insurers started steering patients to the most efficient providers and you were not one of them? Your volumes would drop. Most likely, profits would drop too, because fixed costs are very high for hospitals.
• Was Brigham and Women’s Hospital efficient before it made the changes described in this case? No.
Case 5.3 The Costs of Nonurgent Care in the Emergency Department
Discussion questions:
• Why do patients who are not critically ill go to emergency departments? Emergency departments are open whenever patients want to seek care. Many other providers offer very few weekend or evening visits. In addition, you do not need an appointment, and emergency departments must see anyone, whether they have insurance or not.
• Why do the variety of services emergency departments produce and the amount of overhead to be allocated make cost finding difficult? Overhead costs are very difficult to tie to particular services, so allocations are largely arbitrary. More overhead generally means cost estimates are more subjective. More overhead also means that average costs will be much higher than marginal costs. When many services get produced cost finding is more
Economics for Healthcare Managers, Third Edition – Instructor’s Manual 29
Copyright 2015 Health Administration Press
complex. You have fewer cases to work with, so estimates become less reliable. • Why was Morgan confident that costs could be reduced while quality could be improved? Is
this conclusion supported in the literature? The literature generally supports the conclusion that healthcare providers are not very efficient, meaning that they can increase quality while reducing costs.
• Thinking as a consumer, what would constitute higher quality in the emergency department? This is subjective.
• What options should the hospital consider? Obvious ones are expanded same-day appointments, expanded hours for primary care clinics, and urgent care clinics. Why would you be confident that these options would incur lower costs than an emergency department? These alternatives are open fewer hours, have less sophisticated equipment, have fewer personnel, have less skilled personnel, and generally treat simpler cases. Do you think quality would be higher? There is no right answer to this question, but most observers would argue that more patients being seen by their usual sources of care and less emergency department crowding would mean higher quality.
• If the hospital creates one or more urgent care clinics and adds evening and weekend hours to its primary care clinics, what will happen to emergency department volumes? What effect will that have on emergency department costs? Volumes will drop, probably by 15 percent or more. Overall costs will drop, but cost per visit will probably rise (without active cost reduction efforts). The drop in volume will increase fixed cost per visit, and the likely increase in the complexity of cases seen (as patients with simpler problems go elsewhere) will increase variable cost per visit.

Economics for Healthcare Managers, Third Edition – Instructor’s Manual 30
Copyright 2015 Health Administration Press
Chapter 6: Bending the Cost Curve Key Concepts The Triple Aim includes improving the experience of care for patients, improving population
health, and reducing healthcare costs per person.
The Affordable Care Act (ACA) has changed incentives for insurers and providers in a number of ways.
The ACA has already increased hospitals’ incentives to reduce readmissions.
Medicare Advantage HMOs are growing.
Multiple trials of Medicare accountable care organizations (contracts with potential gains for providers if cost and quality goals are met) are underway.
Private insurers are also testing accountable care organizations and simpler variants called narrow networks.
The prices that private insurers pay for similar products vary a great deal.
Private insurers are testing ways of steering patients to less expensive providers.
Multiple trials of bundled payments (fixed payments for an episode of care) are underway.
Multiple trials of medical homes are underway.
A number of states are shifting Medicaid beneficiaries to HMOs.
Some states have expanded Medicaid; some have not.
Some evidence indicates that the ACA’s initiatives have had positive effects.
The full effects of the ACA’s initiatives will not be known for years.
Solved Exercises 6.1. An insurance market consists of high-risk patients, who average $40,000 in spending per
year, and low-risk patients, who average $1,000 per year. Overall, low-risk patients represent 90 percent of the population. What would average spending be for a population
like this? Average spending would be $4,900, which equals 0.10 $40,000 + 0.90 $1,000.
6.2. Refer to Exercise 6.1. What would average spending be if low-risk patients were 92
percent of the population? Average spending would be $4,120, which equals 0.08
$40,000 + 0.92 $1,000.
6.3. Refer to Exercise 6.1. If an insurer sold 100,000 policies at $6,000, what would revenue be? What would medical costs be if the insurer paid for everything and low-risk patients were 90 percent of the population? How would that change if low-risk patients were 92

Economics for Healthcare Managers, Third Edition – Instructor’s Manual 31
Copyright 2015 Health Administration Press
percent of the population? Revenue would equal $600 million. If low-risk patients were 90 percent of the population, the insurer would spend $490 million, leaving $110 million to split between other costs and profit. If low-risk patients were 92 percent of the population, the insurer would spend $412 million, leaving $188 million to split between other costs and profit.
6.4. Why did hospitals have limited incentives to reduce readmissions prior to the ACA? Hospitals got paid for readmissions.
6.5. Refer to the box titled “Steering Patients to Less Expensive Providers” in this chapter. What would happen in the market for colonoscopies with a reference price of $500? What would happen in the market for colonoscopies with a reference price of $25? You would anticipate that some patients would switch to providers with lower prices. You would also expect some providers with high prices to reduce their prices. If the reference price fell to $25, you would anticipate that some patients would switch to initial fecal immunochemical tests followed by colonoscopies if there were abnormal results. You would also expect more patients to get tested, as fecal immunochemical tests are less trouble.
6.6. Go to the CMS Innovation Center http://innovation.cms.gov/index.html and see what ideas are being tested in a state of your choice.
6.7. Why would a system like John Muir Health launch a medical home that is intended to reduce its revenues? One reason is a conviction that a medical home is the right way to structure primary care. Another is the suspicion that the market is moving toward medical homes and the system would not want to be a late adopter.
6.8. How are a narrow network and an ACO different? Narrow networks are much simpler, as they do not usually incorporate all the requirements of an ACO. A narrow network is just an insurance plan with a limited number of providers.
6.9. What recent evidence about the performance of ACOs can you find? Are they growing? Are they saving money? Do enrollees seem to like the care they get? Is the quality of care good? The answers to Questions 6.9–6.14 can be found via Internet searches. The Centers for Medicare and Medicaid Services maintain a listing of ACOs, but it is not always up-to-date.
6.10. What recent evidence about the performance of medical homes can you find? Are they growing? Are they saving money? Do enrollees seem to like the care they get? Is the quality of care good?
6.11. What recent evidence about bundled payment can you find? Are they growing? Are they saving money? Do enrollees seem to like the care they get? Is the quality of care good?

Economics for Healthcare Managers, Third Edition – Instructor’s Manual 32
Copyright 2015 Health Administration Press
6.12. What recent evidence about Medicare Advantage HMOs can you find? Are they growing? Are they saving money? Do enrollees seem to like the care they get? Is the quality of care good?
6.13. How much did cost per Medicare beneficiary go up last year? (The Kaiser Foundation publishes these data on its website [http://kff.org/state-category/medicare/]).
6.14. Why would a health system want to participate in a trial of bundled payment?
6.15. What risk does a health system bear when it agrees to a bundled payment? The only risk is that costs will be higher than expected, meaning that profit per episode will be lower than expected.
6.16. What risk does a health system bear when it agrees to accept capitation? Capitation includes the risk of costs being higher than expected plus the risk that the number of episodes will be higher than expected.
Economics for Healthcare Managers, Third Edition – Instructor’s Manual 33
Copyright 2015 Health Administration Press
Chapter 7: The Demand for Healthcare Products Key Concepts The quantity demanded is the amount of a good or service purchased at a specific price when
all other factors are held constant.
When a product’s price rises, the quantity demanded usually falls.
Demand (a demand curve) describes the amounts of a good or service that will be purchased at different prices when all other factors are held constant.
An increase or decrease in demand reflects a shift in the entire list of amounts purchased at different prices. An increase or a decrease in demand results when another factor that influences consumer decisions changes.
Other factors that influence demand for healthcare products include consumer income, insurance coverage, perceptions of health status, perceptions of the productivity of other goods and services, and tastes.
The amount of money that a consumer pays directly for a product is called the out-of-pocket price for that good or service.
Because of insurance, the total price and the out-of-pocket price can differ quite a bit.
A complement is a good or service used instead of another good or service. Demand for a good falls if the price of a complement increases.
A substitute is a good or service used instead of another good or service. Demand for a good rises if a substitute rises in price.
Solved Exercises 7.1. Is the idea of demand is useful in healthcare, given the important role of agents? Study
after study finds that the demand for healthcare products is much like the demand for other products. Higher prices usually reduce consumption of healthcare products; lower prices usually increase consumption. Managers should not ignore possible reactions by agents. Neither should they ignore standard demand responses. Healthcare is not alone in having an important role for agents.
7.2. Should medical services be free? Justify your answer. For most consumers medical services should not be free. Consumers will tend to use free services until either the services have no added value or until other rationing devices (such as waits) curb demand.
7.3. Why might a consumer be “rationally ignorant” about the proper therapy for gallstones? Getting information takes time and energy that could be used in other ways (like fishing, working, or going to church). Because the probability of using this information is low for most consumers, the expected benefit of information is likely to be less than its expected cost.
Economics for Healthcare Managers, Third Edition – Instructor’s Manual 34
Copyright 2015 Health Administration Press
7.4. Why do demand curves slope down (i.e., sales volume usually rises at lower prices)? As the price of a product falls, fewer alternative uses of funds represent better values.
7.5. Why would consumers ever choose insurance plans with large deductibles? Because this type of insurance can cost a good deal less than insurance with small deductibles. Not covering small, relatively common expenses can reduce the cost of coverage a good deal.
7.6. During the last five years, average daily occupancy at Autumn Acres nursing home has slid from 125 to 95 even though Autumn Acres has cut its daily rate from $125 to $115. Do these data suggest that occupancy would have been higher if Autumn Acres had raised its rates? What changes in nonprice demand factors might explain this change? (The supply, or the number of nursing home beds in the area, has not changed during this period.) Since nursing homes have only a limited capacity to influence the decision making of potential residents, occupancy almost certainly would have been lower if Autumn Acres had not cut its rates. Many nursing home residents pay out of pocket for their care, so they are sensitive to price differences. Other factors affecting demand might be the growth of assisted living facilities, the expansion of home health services, or expansion of personal aide programs. Any of these could substitute for nursing home care. You also need to consider what has happened to the target population. Has it grown or shrunk? Has it gotten richer or poorer?
7.7. Your hospital is considering opening a satellite urgent care center about five miles from your main campus. You have been charged with gathering demographic information that might affect the demand for the center’s services. What data are likely to be relevant? You would clearly want data on the income, age, gender, and ethnicity distributions. You would also want data on the population density and rate of growth. Information about expenditure patterns—especially market share data for competitors—would also be very helpful.
7.8. How would each of the following changes affect the demand for acupuncture? The key issue is whether we are looking at a change in the price of acupuncture (which leads to a movement along a demand curve) or a change in a factor that shifts the whole demand curve.
a. The price of an acupuncture session increases. The quantity demanded would almost certainly drop. This would be like a shift from point C to point A in the graph below.
b. A reduction in back problems occurs as a result of sessions on stretching on a popular television show. Any reduction in symptoms should shift down the demand curve for acupuncture. This would be like a shift from the demand curve with point B to a demand curve with point A in the graph below.
c. Medicare reduces the copayment for acupuncture from $20 to $10. The quantity demanded would almost certainly rise. This would be like a shift from point A to point C in the graph below.
d. The surgeon general issues a warning that back surgery is ineffective. As a substitute becomes less attractive, the demand curve for acupuncture should shift
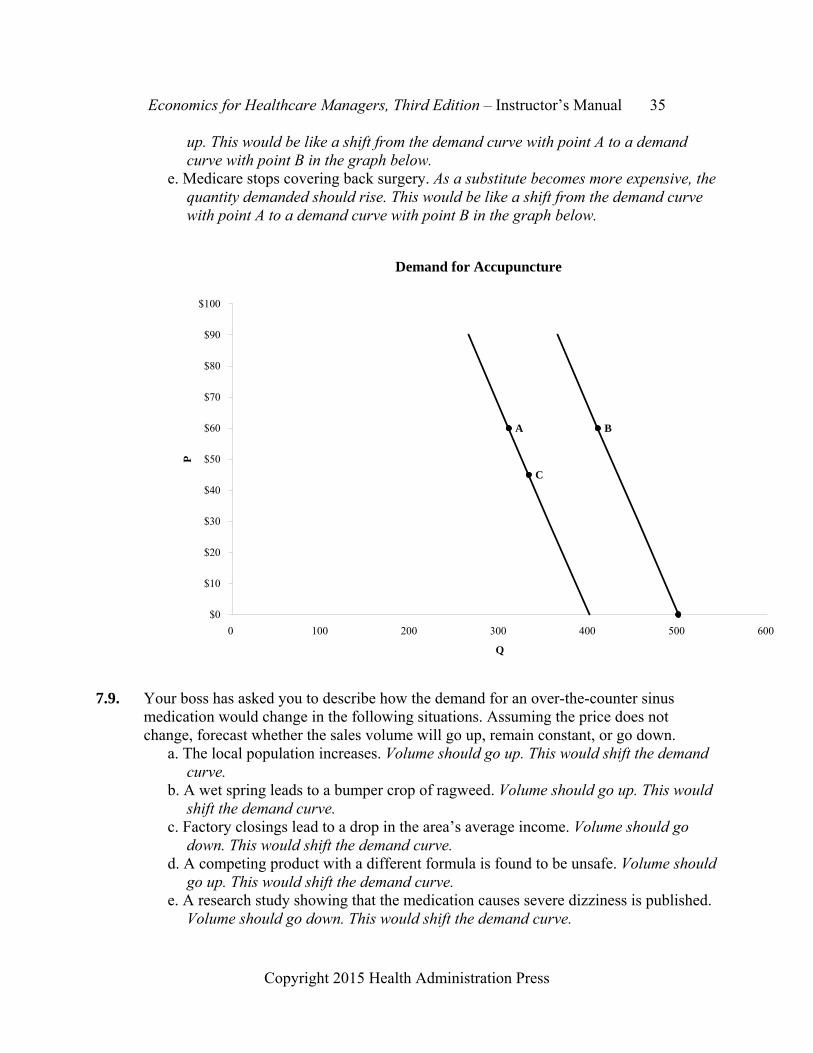
Economics for Healthcare Managers, Third Edition – Instructor’s Manual 35
Copyright 2015 Health Administration Press
up. This would be like a shift from the demand curve with point A to a demand curve with point B in the graph below.
e. Medicare stops covering back surgery. As a substitute becomes more expensive, the quantity demanded should rise. This would be like a shift from the demand curve with point A to a demand curve with point B in the graph below.
Demand for Accupuncture
C
A B
$0
$10
$20
$30
$40
$50
$60
$70
$80
$90
$100
0 100 200 300 400 500 600
Q
P
7.9. Your boss has asked you to describe how the demand for an over-the-counter sinus
medication would change in the following situations. Assuming the price does not change, forecast whether the sales volume will go up, remain constant, or go down.
a. The local population increases. Volume should go up. This would shift the demand curve.
b. A wet spring leads to a bumper crop of ragweed. Volume should go up. This would shift the demand curve.
c. Factory closings lead to a drop in the area’s average income. Volume should go down. This would shift the demand curve.
d. A competing product with a different formula is found to be unsafe. Volume should go up. This would shift the demand curve.
e. A research study showing that the medication causes severe dizziness is published. Volume should go down. This would shift the demand curve.

Economics for Healthcare Managers, Third Edition – Instructor’s Manual 36
Copyright 2015 Health Administration Press
f. The price of another sinus medication drops. Volume should go down. This would shift the demand curve.
7.10. A community has four residents. The table below shows the number of dental visits each
resident will have. Calculate the total quantity demanded at each price. Then graph the relationship between price and total quantity, with total quantity on the horizontal axis.
Price Abe’s
Quantity Beth’s Quantity
Cal’s Quantity
Don’s Quantity
Total Quantity
$40 0 0 0 1 1 $30 0 1 0 1 2 $20 0 1 0 2 3 $10 1 2 1 2 6 $0 1 2 1 3 7 7.11. A clinic focuses on three services: counseling for teens and young adults, smoking
cessation, and counseling for young parents. An analyst has developed a forecast of the number of visits each group will make at different prices. Calculate the total quantity demanded at each price. Then graph the relationship between price and total quantity, putting total quantity on the horizontal axis.
Price Teen Counseling Smoking Cessation Parent Counseling Total$80 10 0 0 10 $60 15 1 0 16 $40 20 2 0 22 $20 40 4 6 50 $0 50 6 8 64

Economics for Healthcare Managers, Third Edition – Instructor’s Manual 37
Copyright 2015 Health Administration Press
Total Demand for Counseling
$0
$10
$20
$30
$40
$50
$60
$70
$80
$90
0 10 20 30 40 50 60 70
Q
P
7.12. The price–quantity relationship has been estimated for a new prostate cancer blood test:
Q = 4,000 - 20 P. Use a spreadsheet to calculate the quantity demanded and total spending for prices ranging from $200 to $0, using $50 increments. For each $50 drop in price, calculate the change in revenue, the change in volume, and the additional revenue per unit. (Call the additional revenue per unit marginal revenue.)
Change in Change in MarginalPrice Quantity Revenue Quantity Revenue Revenue $200 0 $0 $150 1,000 $150,000 1,000 $150,000 $150 $100 2,000 $200,000 1,000 $50,000 $50 $50 3,000 $150,000 1,000 -$50,000 -$50 $0 4,000 $0 1,000 -$150,000 -$150
7.13. A physical therapy clinic faces a demand equation of Q = 200 - 1.5 P, where Q is
sessions per month and P is the price per session. a. The clinic currently charges $80. What is its sales volume and revenue at this
price?

Economics for Healthcare Managers, Third Edition – Instructor’s Manual 38
Copyright 2015 Health Administration Press
b. If the clinic raised its price to $90, what would happen to volume and revenue? Both would drop.
c. If the clinic lowered its price to $70, what would happen to volume and revenue? Both would rise. You always expect sales to rise, but an increase in revenue is not guaranteed.
Price Quantity Revenue $90 65 $5,850 $80 80 $6,400 $70 95 $6,650
7.14. Researchers have concluded that the demand for annual preventive clinic visits by
children with asthma equals 1 + 0.00004 Υ - 0.04 P. In this equation Y represents family income and P represents price. a. Calculate how many visits a child with a family income of $100,000 will make at
prices of $200, $150, $100, $50, and $0. If you predict that visits will be less than zero, convert your answer to zero.
b. Now repeat your calculations for a child with a family income of $35,000. c. How do your predictions for the two children differ? The quantity demanded will be
much smaller for the family with an income of $35,000. At most prices the quantity demanded will be zero.
d. Assume that the market price of a preventive visit is $100. Does this system seem fair? What fairness criteria are you using? There are many possible answers here.
e. Would your answer change if the surgeon general recommended that every child with asthma have at least one preventive visit each year? You would be concerned because low-income children would not get any visits unless the price were less than $50.
Quantity Quantity Family Family Income of Income of Price $100,000 $35,000 $200 0 0 $150 0 0 $100 1 0 $50 3 0 $0 5 2

Economics for Healthcare Managers, Third Edition – Instructor’s Manual 39
Copyright 2015 Health Administration Press
Case 7.1: MinuteClinic Discussion questions: • For what products is MinuteClinic a substitute? It is a substitute for primary care offices and
urgent care centers. • For what products is it a complement? It is a complement for primary care offices and
specialty care offices. • In what sense is MinuteClinic designed to meet the needs of patients? Patients want care that
fits their schedule. They also want to be able to have simple services handled easily. • Do you share the Rhode Island Medical Society’s concerns? The answers to this and the next
two questions depends on personal preferences, so no right answer is possible. It may be a useful way to explore interest group politics.
• Why might they be right? • Why might they be wrong? • A common criticism is that MinuteClinic locates its clinics in well-to-do areas. Is this a
concern? At one level this is not a concern. Businesses try to locate where their customers want them to be, and most of MinuteClinic’s customers will be at least reasonably well off. If a market system of healthcare yields acceptable outcomes in your view, this is not a concern. The problem arises if those who are not well off have difficulty accessing care (and they are apt to). You may conclude that a market system of healthcare yields unacceptable outcomes, in which case this is part of your concern.

Economics for Healthcare Managers, Third Edition – Instructor’s Manual 40
Copyright 2015 Health Administration Press
Chapter 8: Elasticities Key Concepts Economists use elasticities to avoid confusion about units.
An elasticity is the percentage change in one variable that is associated with a 1 percent change in another.
Elasticities allow quick calculations of the effects of strategic choices.
Managers can use elasticities to forecast sales.
To avoid ambiguities, use arc elasticities (which use the average of the starting and ending values as the denominator of percentage change calculations).
An income elasticity of demand is the percentage change in the quantity demanded that is associated with a 1 percent change in consumer income.
A price elasticity of demand is the percentage change in the quantity demanded that is associated with a 1 percent change in the price of a product.
A cross-price elasticity is the percentage change in the quantity demanded that is associated with a 1 percent change in the price of a substitute or complement.
Solved Exercises 8.1. Why are elasticities useful for managers? They allow managers to make strategic
decisions quickly. They are also useful for making sales forecasts and pricing decisions.
8.2. Why are price elasticities called “elastic” or “inelastic” when other elasticities are not? Unlike other elasticities, price elasticities are almost always negative. To avoid getting tangled in the fact that a smaller price elasticity signals that consumers are more price sensitive, economists use this specialized language for price elasticities of demand.
8.3. Why is the demand for healthcare products usually inelastic? Most healthcare products have very few close substitutes.
8.4. Why is the demand for an individual firm’s healthcare products usually elastic? The products of competing healthcare firms are usually fairly good substitutes.
8.5. Average visits per week equal 640 when the copay is $40 and equal 360 when the copayment is $60. a. Calculate the percent change in visits, percent change in price, and price elasticity of
demand using 640 and $40 as the denominators for percentage change calculations. b. Calculate the percent change in visits, percent change in price, and price elasticity of
demand using 360 and $60 as the denominators for percentage change calculations. c. Calculate the percent change in visits, percent change in price, and price elasticity of
demand using 500 and $50 as the denominator for percentage change calculations. (This calculation finds the arc elasticity.)

Economics for Healthcare Managers, Third Edition – Instructor’s Manual 41
Copyright 2015 Health Administration Press
d. How do your answers differ? Answer: Using 640 and $40 gives a 43.8 percent change in visits, a 50 percent change in price, and an elasticity of -0.88. Using 360 and $60 gives a 77.8 percent change in visits, a 33.3 percent change in price, and an elasticity of -2.33. Using the average values gives a 56 percent change in visits, a 40 percent change in price, and an elasticity of -1.40. Which base you use changes the resulting elasticities a lot. In fact, we might conclude that demand was inelastic or elastic, depending on how we did the calculations.
8.6. Sales are 3,100 at a price of $200 and 2,400 at a price of $300. Calculate the price elasticities of demand using $200 as the base value, then use $300 as the base value. Calculate the arc price elasticity and compare the three calculations. How do your answers differ? Using $200 as the base value implies that prices have increased by 50 percent and sales have fallen by 22.6 percent. Hence, the elasticity is -0.45. Using $300 as the base value implies that prices have decreased by 33.3 percent and sales have risen by 29.2 percent. Hence, the elasticity is -0.88. In contrast, the arc elasticity of demand is -0.64.
8.7. Per capita income in County A is $45,000. Per capita income in County B is $38,000. Physician visits average 3.4 per year in County A and 3.2 per year in County B. What is the arc income elasticity of demand for visits? Using the arc formula, the percentage change in visits is 6.1% = (3.4 - 3.2)/(3.4 + 3.2)/2). The arc percentage change in income is 16.9 percent. So, the arc income elasticity of demand is -0.36.
8.8. Median household income in County C is $54,021. Median household income in County D is $28,739. In County C, 17.4 percent of residents smoke. In County D, 28.4 percent of the residents smoke. What is the arc income elasticity of demand for tobacco use? Using the arc formula, the percentage change in tobacco use is -48.0% = (17.4% - 28.4%)/(17.4% + 28.4%)/2). The arc percentage change in income is 61.1 percent. So, the arc elasticity of demand is -0.79.
8.9. The price elasticity of demand is -1.2. Is demand elastic or inelastic? Demand is said to be elastic if the price elasticity of demand is smaller than -1.00. This estimate implies that demand is elastic. In this case a 1 percent increase in price will result in a 1.2 percent drop in sales, implying that sales are quite sensitive to price changes.
8.10. The price elasticity of demand is -0.12. Is demand elastic or inelastic? Demand is said to be inelastic if the price elasticity of demand is larger than -0.99 and smaller than 0. This estimate of the price elasticity is in this range, implying that demand is inelastic. The estimate also implies that a 1 percent increase in price will result in a 0.12 percent drop in sales, implying that sales are not very sensitive to variations in price.
8.11. If the income elasticity of demand is 0.2, how would the volume of services change if income rose by 10 percent? The income elasticity = 0.2 = percent change in quantity/percent change in income = percent change in quantity/0.1. So, the percent change in quantity = 0.2 0.1 = 0.02, or 2 percent.
8.12. You are a manager in a regional health system. Using an estimate of the price elasticity of demand of -0.25, calculate how much ambulatory visits will change if you raise prices by

Economics for Healthcare Managers, Third Edition – Instructor’s Manual 42
Copyright 2015 Health Administration Press
5 percent. You predict that visits will fall by 1.3 percent = -.25 .05.
8.13. If the cross-price elasticity of clinic visits with respect to pharmaceutical prices is -0.18, how much will ambulatory visits change if pharmacy prices rise by 5 percent? Are pharmaceuticals substitutes for or complements to clinic visits? You predict that clinic visits will fall by 0.9% = 0.009 = -.18 .05. Pharmaceuticals are complements. You know this because the cross-price elasticity is negative.
8.14. If the cross-price elasticity of clinic visits with respect to emergency department prices is 0.21, how much will ambulatory visits change if emergency department prices rise by 5 percent? Are emergency department visits substitutes for or complements to clinic visits?
You predict that clinic visits will rise by 1% = 0.01 = 0.21 .05. ED visits are substitutes. You know this because the cross-price elasticity is positive.
8.15. If the income elasticity of demand is 0.03, how much will ambulatory visits change if incomes rise by 4 percent? The income elasticity of demand equals (dQ/Q)/(dY/Y), with dQ/Q representing the percentage change in quantity and dY/Y the percentage change in income. By how much will the quantity demanded increase if income increases by 4 percent? The definition of an income elasticity and the statement of the problem tell us that (dQ/Q)/(dY/Y) = 0.03 and dY/Y = 0.04. Solving for dQ/Q, we find that dQ/Q = 0.03 0.04 = 0.0012, which is 0.12 percent.
8.16. A study estimates that the price elasticity of demand for Drug E is -3.41, but the price elasticity of demand the class of drugs as a whole is -0.22. a. Why is demand for Drug E more elastic than for the whole class of drugs? b. What would happen to revenues if the makers of Drug E raised prices by 10 percent? c. What would happen to industry revenues if all manufacturers raised prices by 10
percent? d. Why are the answers so different? Does this make sense? Other antidepressants are relatively good substitutes for drug E, so demand is elastic. In contrast, other therapies are not particularly good substitutes for the class of drugs, so demand is inelastic. A 10 percent increase in the price of Drug E should reduce sales by 34% = -10% 3.41. This would reduce revenue by 28% = 10% - 34% - 10% 34%. In contrast, a 10 percent increase in the price of the class of drugs should reduce sales by 2% = -10% 0.22. This would increase revenue by just under 8% = 10% - 2% -10% 2%.
8.17. The price elasticity of demand for the services of Kim Jones, MD, is -4.0. The price elasticity of demand for physicians’ services is -0.1. a. Why is demand so much more elastic for the services of Dr. Jones than for the
services of physicians in general? b. If Dr. Jones reduced prices by 10 percent, how much would volume and revenue
change? c. Suppose that all the physicians in the area reduced prices by 10 percent. How much
would the total number of visits and revenue change? d. Why are your answers to questions b and c so different?

Economics for Healthcare Managers, Third Edition – Instructor’s Manual 43
Copyright 2015 Health Administration Press
A 10 percent price cut for Dr. Jones should increase visits by 40% = -10% 4.00, and revenue would rise by about 26% = 40% - 10% - 10% 40%. In contrast, a 10 percent price cut by all physicians should increase sales by only 1% = -10% 0.10. Revenue would fall by about 9.1% = -0.091 = 1% - 10% - 10% 1%. Other physicians’ services are relatively good substitutes for those of Dr. Jones, so demand is elastic. In contrast, other products are not particularly good substitutes for physicians’ services, so demand is inelastic.
Case 8.1: Mental Health Parity Discussion questions: • Why does it matter whether demand for mental health services is more elastic than demand
for other services? If demand is more elastic, increasing insurance coverage will increase use more.
• The price elasticity of demand for ambulatory mental health services appears to be about -0.8, and the price elasticity for general ambulatory medical services appears to be about -0.3. How much would spending increase for each type of care if copays were cut from $40 to $25? Cutting the copay from $40 to $25 is a 37.5 percent reduction. These elasticities suggest a 30 percent increase in ambulatory mental health services (-0.8 -0.375 = 0.30) and an 11.25 percent increase in ambulatory medical services (-0.3 -0.375 = 0.1125).
• What managed care techniques do insurers use to control spending? Common techniques are requiring preauthorization, case management, benefit limits, and small networks of specialty providers.
• Is there evidence that better treatment of mental health problems reduces other spending? Most of the evidence suggests very small increases in overall health spending.
• Is there evidence that better treatment of mental health problems improves productivity? Having an untreated mental illness or substance abuse has been shown to lower earnings and reduce the likelihood of being employed.
• What is your recommendation to the Benefits Committee? There is no right or wrong answer to this question.
Case 8.2: Reducing Waiting Time Discussion questions: • Acton’s estimates suggest that demand is more sensitive to waiting time than to out-of-
pocket price. Why might that be the case? Insurance does not cover the cost of waiting time, and in some cases the cost of waiting exceeds the out-of-pocket cost for care.
• For the sake of argument, assume that the entire 10 percent increase in volume is due to the 28 percent reduction in waits for appointments. What elasticity of demand with respect to appointment waits do the data for the Christie Clinic imply? The number of visits increased by 10 percent and wait fell by 28 percent, so the elasticity is -0.36 = 0.10/0.28.
• Why would waits for patients result in waits for staff? Patients’ waits mean that they cannot

Economics for Healthcare Managers, Third Edition – Instructor’s Manual 44
Copyright 2015 Health Administration Press
go to the next step of their care. Sometimes that means that staff must wait for patients to show up.

Economics for Healthcare Managers, Third Edition – Instructor’s Manual 45
Copyright 2015 Health Administration Press
Chapter 9: Forecasting Key Concepts Making and interpreting forecasts are important jobs for managers.
Forecasts are planning tools, not rigid goals.
Sales and revenue forecasts are applications of demand theory.
Changes in demand conditions usually change forecasts.
Good forecasts should be easy to understand, easy to modify, accurate, transparent, and precise.
Forecasts combine history and judgment.
Percent adjustment, moving averages, and seasonalized regression analysis are common forecasting methods.
Assessing external factors is vital to forecasting.
Solved Exercises 9.1. The table lists visits for
the four clinics operated by your system. You anticipate that volumes will increase by 4 percent next year. Forecast the number of visits for each clinic, and explain what assumptions underlie your forecasts. For example, are you sure that all of the clinics can serve additional clients? This is a simple extrapolation. You anticipate that visits in Clinic 1 will rise to 17,306, visits in Clinic 2 will rise to 43,264, visits in Clinic 3 will rise to 25,958, and visits in Clinic 4 will rise to 34,611. This assumes that all of the clinics can add visits and that patients will demand additional visits. Either of these assumptions might be incorrect.
9.2. Your data for the clinics in Exercise 9.1 suggest that Clinic 2 is operating at capacity and is highly efficient. Its output is unlikely to increase. Furthermore, Clinic 4 has unused capacity but is unlikely to attract additional patients. How would these facts change your answer to question 9.1? Continue to assume that overall volume will rise to 121,139. For overall volume to rise 4 percent, Clinic 1 and Clinic 3 will have to increase visits by 11 percent.
9.3. You estimate that the price elasticity of demand for clinic visits is -0.25. You anticipate that a major insurer will increase the copayment from $20 to $25. This insurer covers 40,000 of your patients, and those patients average 2.5 visits per year. What is your forecast of the change in the number of visits? An increase in the copay from $20 to $25
Clinic 1 Clinic 2 Clinic 3 Clinic 4 Total
This year 16,640 41,600 24,960 33,280 116,480Next year 17,306 43,264 25,958 34,611 121,139
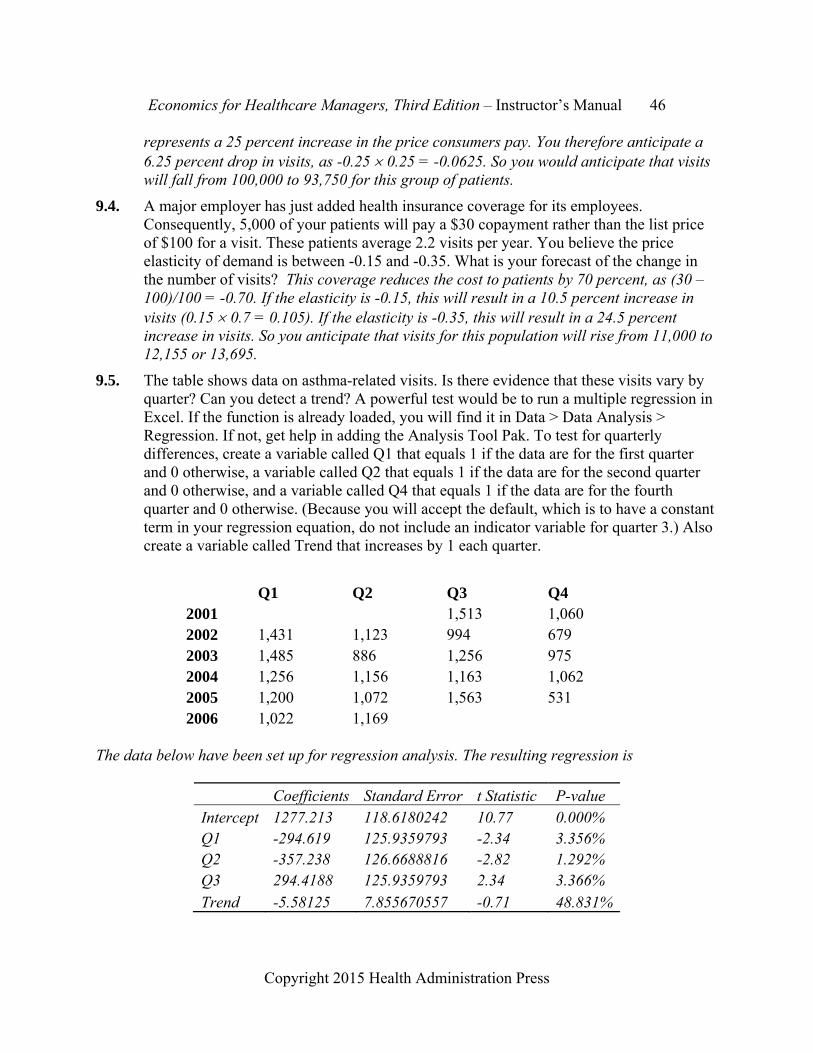
Economics for Healthcare Managers, Third Edition – Instructor’s Manual 46
Copyright 2015 Health Administration Press
represents a 25 percent increase in the price consumers pay. You therefore anticipate a 6.25 percent drop in visits, as -0.25 0.25 = -0.0625. So you would anticipate that visits will fall from 100,000 to 93,750 for this group of patients.
9.4. A major employer has just added health insurance coverage for its employees. Consequently, 5,000 of your patients will pay a $30 copayment rather than the list price of $100 for a visit. These patients average 2.2 visits per year. You believe the price elasticity of demand is between -0.15 and -0.35. What is your forecast of the change in the number of visits? This coverage reduces the cost to patients by 70 percent, as (30 – 100)/100 = -0.70. If the elasticity is -0.15, this will result in a 10.5 percent increase in visits (0.15 0.7 = 0.105). If the elasticity is -0.35, this will result in a 24.5 percent increase in visits. So you anticipate that visits for this population will rise from 11,000 to 12,155 or 13,695.
9.5. The table shows data on asthma-related visits. Is there evidence that these visits vary by quarter? Can you detect a trend? A powerful test would be to run a multiple regression in Excel. If the function is already loaded, you will find it in Data > Data Analysis > Regression. If not, get help in adding the Analysis Tool Pak. To test for quarterly differences, create a variable called Q1 that equals 1 if the data are for the first quarter and 0 otherwise, a variable called Q2 that equals 1 if the data are for the second quarter and 0 otherwise, and a variable called Q4 that equals 1 if the data are for the fourth quarter and 0 otherwise. (Because you will accept the default, which is to have a constant term in your regression equation, do not include an indicator variable for quarter 3.) Also create a variable called Trend that increases by 1 each quarter.
Q1 Q2 Q3 Q4 2001 1,513 1,060 2002 1,431 1,123 994 679 2003 1,485 886 1,256 975 2004 1,256 1,156 1,163 1,062 2005 1,200 1,072 1,563 531 2006 1,022 1,169
The data below have been set up for regression analysis. The resulting regression is
Coefficients Standard Error t Statistic P-value Intercept 1277.213 118.6180242 10.77 0.000% Q1 -294.619 125.9359793 -2.34 3.356% Q2 -357.238 126.6688816 -2.82 1.292% Q3 294.4188 125.9359793 2.34 3.366% Trend -5.58125 7.855670557 -0.71 48.831%
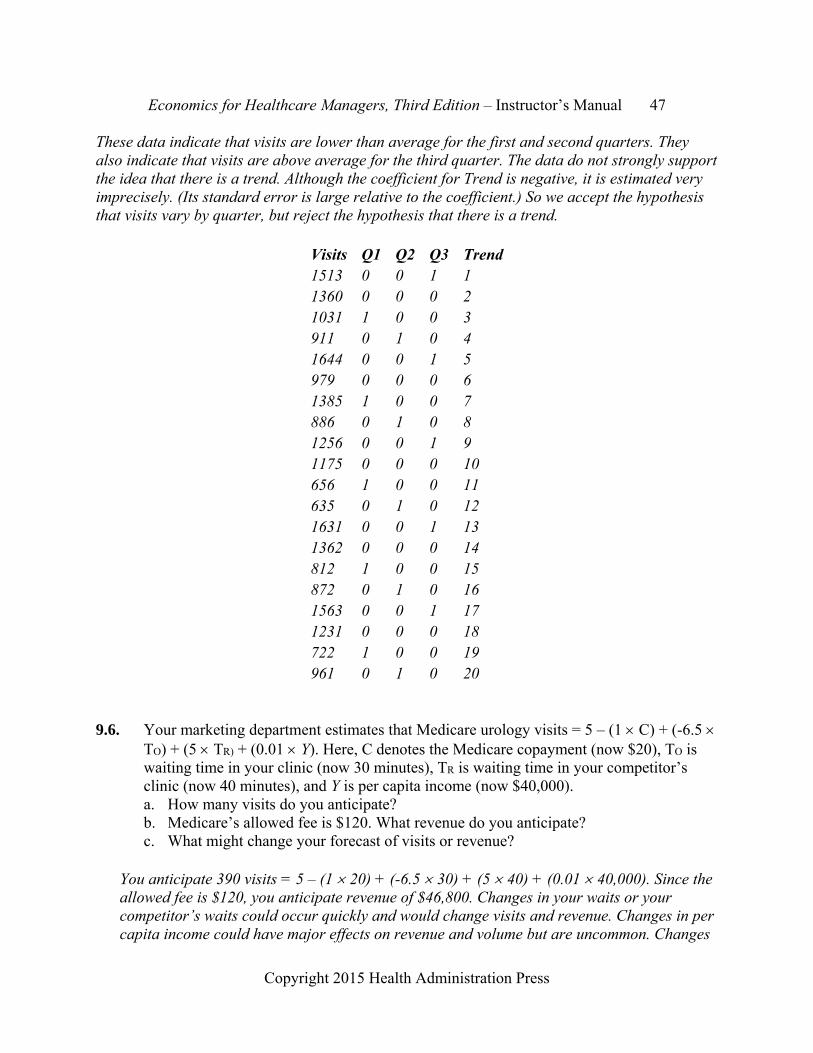
Economics for Healthcare Managers, Third Edition – Instructor’s Manual 47
Copyright 2015 Health Administration Press
These data indicate that visits are lower than average for the first and second quarters. They also indicate that visits are above average for the third quarter. The data do not strongly support the idea that there is a trend. Although the coefficient for Trend is negative, it is estimated very imprecisely. (Its standard error is large relative to the coefficient.) So we accept the hypothesis that visits vary by quarter, but reject the hypothesis that there is a trend.
Visits Q1 Q2 Q3 Trend1513 0 0 1 1 1360 0 0 0 2 1031 1 0 0 3 911 0 1 0 4 1644 0 0 1 5 979 0 0 0 6 1385 1 0 0 7 886 0 1 0 8 1256 0 0 1 9 1175 0 0 0 10 656 1 0 0 11 635 0 1 0 12 1631 0 0 1 13 1362 0 0 0 14 812 1 0 0 15 872 0 1 0 16 1563 0 0 1 17 1231 0 0 0 18 722 1 0 0 19 961 0 1 0 20
9.6. Your marketing department estimates that Medicare urology visits = 5 – (1 C) + (-6.5
TO) + (5 TR) + (0.01 Y). Here, C denotes the Medicare copayment (now $20), TO is waiting time in your clinic (now 30 minutes), TR is waiting time in your competitor’s clinic (now 40 minutes), and Y is per capita income (now $40,000). a. How many visits do you anticipate? b. Medicare’s allowed fee is $120. What revenue do you anticipate? c. What might change your forecast of visits or revenue?
You anticipate 390 visits = 5 – (1 20) + (-6.5 30) + (5 40) + (0.01 40,000). Since the allowed fee is $120, you anticipate revenue of $46,800. Changes in your waits or your competitor’s waits could occur quickly and would change visits and revenue. Changes in per capita income could have major effects on revenue and volume but are uncommon. Changes

Economics for Healthcare Managers, Third Edition – Instructor’s Manual 48
Copyright 2015 Health Administration Press
in the copayment would change volume, and changes in the allowed fee would change revenue.
9.7. Because of fluctuations in insurance coverage, the average price paid out of pocket (P) by patients of an urgent care center varied, as the table shows. The number of visits per month (Q) also varied, and an analyst believes the two are related. The analyst also thinks the data show a trend. Run a regression of Q on P and Period to test these hypotheses. Then use the estimated parameters a, b, and c and the values of Month and P to predict Q (number of visits). The prediction equation will have the form Q = a + (b Month) + (c P).
Month 1 2 3 4 5 6 7 8 9 10 11 12 P $21 $18 $15 $24 $18 $21 $18 $15 $20 $19 $24 $20 Q 193 197 256 179 231 214 247 273 223 225 198 211
The regression results are listed below. The regression predictions are given in the answer to Exercise 9.8.
Regression Statistics Multiple R 0.91 R Square 0.83 Adjusted R Square 0.79 Standard Error 12.65237 Observations 12
ANOVA
df SS MS F Significance F Regression 2 7084.174 3542.087 22.13 0.000 Residual 9 1440.743 160.0826 Total 11 8524.917
Coefficients Standard Error t Stat P-value
Intercept 373.582 25.878 14.44 0.000 Month 2.478 1.074 2.31 0.046 P -8.709 1.332 -6.54 0.000
9.8. Use the data in Exercise 9.7 to answer these questions: a. Calculate the naïve estimator, which is Qt = Qt-1.

Economics for Healthcare Managers, Third Edition – Instructor’s Manual 49
Copyright 2015 Health Administration Press
b. Calculate the two-period moving average forecast. For the first two periods this would be 195, which is (193+197)/2.
c. Calculate the mean absolute deviation for the regression forecast, the naïve forecast, and the two-period moving average forecast.
d. Which forecast seems to perform the best? e. Why is this the case?
Regression Naive Moving Average P Q Prediction |Deviation| Prediction |Deviation| Prediction |Deviation|$21 193 193.17 $18 197 221.77 $15 256 250.38 5.623236 197 59 207.4684 42.90838 $24 179 174.47 4.528648 256 77 236.074 61.60262 $18 231 229.20 1.795315 179 52 212.4241 16.78063 $21 214 205.55 8.445229 231 17 201.838 3.716752 $18 247 234.16 12.83965 214 33 217.3797 16.78063 $15 273 262.77 10.23406 247 26 219.8576 42.90838 $20 223 221.70 1.302475 273 50 248.4631 26.76562 $19 225 232.88 7.884609 223 2 242.2317 9.347122 $24 198 191.82 6.183804 225 27 227.2911 35.47487 $20 211 229.13 18.13103 198 13 212.3504 16.78063 Mean Absolute Deviation = 7.696805 35.6 27.30656
The regression prediction performs best by a substantial margin, and the naïve prediction performs worst. The MAD for the naïve model is 4.6 times as large as the MAD for the regression model. The MAD for the moving average model is 3.5 times as large.
9.9. Sales data are displayed in the table. a. Calculate the naïve estimator, which is Salest = Salest-1. b. Calculate the two-period and three-period moving averages. The two-period moving
average for the first two observations is 220.5, which is (224 + 217)/2. The three-period moving average for the first three observations is 217.3, which is (224 + 217 + 211)/3.
c. Calculate the mean absolute deviation for each of the forecasting methods.
Naïve Two Period MA Three Period MA Exp. SmoothingMon Sales Est. AD Est. AD Est. AD Est. AD
Feb 224 Mar 217 224 7 Apr 211 217 6 220.5 9.5 219.1 8.1
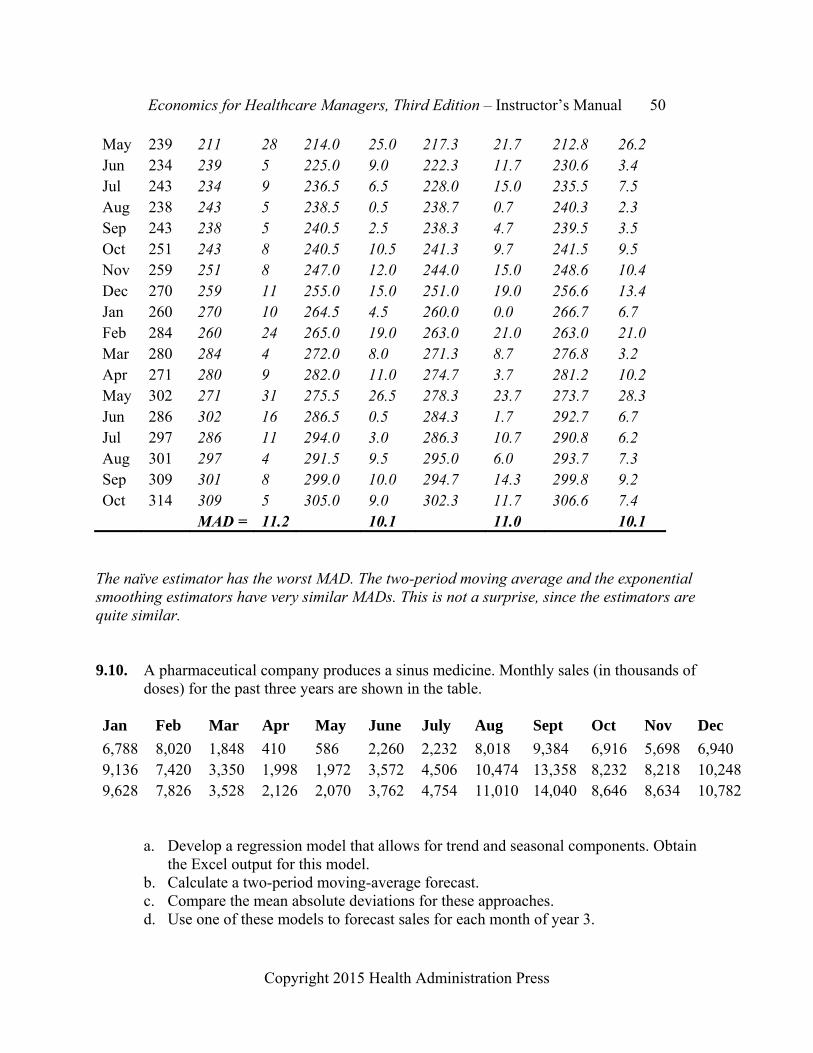
Economics for Healthcare Managers, Third Edition – Instructor’s Manual 50
Copyright 2015 Health Administration Press
May 239 211 28 214.0 25.0 217.3 21.7 212.8 26.2 Jun 234 239 5 225.0 9.0 222.3 11.7 230.6 3.4 Jul 243 234 9 236.5 6.5 228.0 15.0 235.5 7.5 Aug 238 243 5 238.5 0.5 238.7 0.7 240.3 2.3 Sep 243 238 5 240.5 2.5 238.3 4.7 239.5 3.5 Oct 251 243 8 240.5 10.5 241.3 9.7 241.5 9.5 Nov 259 251 8 247.0 12.0 244.0 15.0 248.6 10.4 Dec 270 259 11 255.0 15.0 251.0 19.0 256.6 13.4 Jan 260 270 10 264.5 4.5 260.0 0.0 266.7 6.7 Feb 284 260 24 265.0 19.0 263.0 21.0 263.0 21.0 Mar 280 284 4 272.0 8.0 271.3 8.7 276.8 3.2 Apr 271 280 9 282.0 11.0 274.7 3.7 281.2 10.2 May 302 271 31 275.5 26.5 278.3 23.7 273.7 28.3 Jun 286 302 16 286.5 0.5 284.3 1.7 292.7 6.7 Jul 297 286 11 294.0 3.0 286.3 10.7 290.8 6.2 Aug 301 297 4 291.5 9.5 295.0 6.0 293.7 7.3 Sep 309 301 8 299.0 10.0 294.7 14.3 299.8 9.2 Oct 314 309 5 305.0 9.0 302.3 11.7 306.6 7.4 MAD = 11.2 10.1 11.0 10.1
The naïve estimator has the worst MAD. The two-period moving average and the exponential smoothing estimators have very similar MADs. This is not a surprise, since the estimators are quite similar.
9.10. A pharmaceutical company produces a sinus medicine. Monthly sales (in thousands of doses) for the past three years are shown in the table.
Jan Feb Mar Apr May June July Aug Sept Oct Nov Dec
6,788 8,020 1,848 410 586 2,260 2,232 8,018 9,384 6,916 5,698 6,940 9,136 7,420 3,350 1,998 1,972 3,572 4,506 10,474 13,358 8,232 8,218 10,2489,628 7,826 3,528 2,126 2,070 3,762 4,754 11,010 14,040 8,646 8,634 10,782
a. Develop a regression model that allows for trend and seasonal components. Obtain the Excel output for this model.
b. Calculate a two-period moving-average forecast. c. Compare the mean absolute deviations for these approaches. d. Use one of these models to forecast sales for each month of year 3.

Economics for Healthcare Managers, Third Edition – Instructor’s Manual 51
Copyright 2015 Health Administration Press
A regression model with trend and seasonal components suggests that there is an increasing trend and that sales are significantly below normal in the second quarter.
Coefficients Standard Error t Statistic
Intercept 6694.43 1064.197 6.29 Trend 63.34 26.91225 2.35 Quarter 1 -1417.43 1051.416 -1.35 Quarter 2 -5925.12 1035.801 -5.72 Quarter 3 623.69 1026.318 0.61
Below are the third-year forecasts using the regression and using a two-year moving average. Overall, the regression model outperforms the moving average model, as the mean absolute deviation is smaller. (The mean absolute deviation is just the average of the absolute forecast deviations for year three.)
Moving Average Regression Forecast | Deviation | Forecast | Deviation |Jan 9,628 9,708 80 7,621 2,007Feb 7,826 10,205 577 7,684 1,944Mar 3,528 8,727 901 7,747 1,881Apr 2,126 5,677 3,951 3,303 6,325May 2,070 2,827 6,801 3,366 6,262June 3,762 2,098 7,530 3,430 6,198July 4,754 2,916 6,712 10,042 414Aug 11,010 4,258 5,370 10,105 477Sept 14,040 7,882 1,746 10,168 540Oct 8,646 12,525 2,897 9,608 20Nov 8,634 11,343 1,715 9,671 43Dec 10,782 8,640 988 9,735 107
Mean Absolute Deviation = 3,272 2,185
Economics for Healthcare Managers, Third Edition – Instructor’s Manual 52
Copyright 2015 Health Administration Press
Case 9.1: Building a New Urgent Care Center Discussion questions: • What happens to profits if the urgent care center has only 2,000 visits? Profits go down
sharply. Revenue falls to $250,000 and costs fall to $240,000, resulting in profits of only $10,000.
• To what extent does Kim’s forecast rely on judgment rather than data? Would additional information help resolve Angel’s concerns? What sort of data would you suggest gathering? Kim’s forecast relies heavily on assumptions, which is a form of judgment. Data from similar urgent care centers would be valuable.
• Does building the urgent care center seem risky? Could you do anything to reduce the amount of risk? The center is not especially risky, since a very large loss is unlikely. You could reduce the risk by leasing space or using space that is not used during the hours of the urgent care center. That way your fixed costs would be lower.
• Would there be any advantages to planning for a small patient volume and letting your customers surprise you? Suppose you plan for 2,000 visits but volume turns out to be 3,000. What happens? Would underestimating be better or worse than planning for 3,000 and getting only 2,000? Planning for a small patient volume and letting your customers surprise you might result in a poor patient experience and harm your brand. There would be long waits and unhappy staffers. Planning for 3,000 and getting only 2,000 just reduces profits.
Case 9.2 Forecasting the Demand for Transfusions Discussion questions: • What sort of model would you recommend to predict the demand for blood? What would you
do with your predictions? A seasonalized regression model would be the best choice. You would use the predictions to schedule drives and other strategies for getting blood.
• Why would the presence of seasonal effects be important? You could overpredict demand in slow periods and underpredict it in busy periods.
• Taylor suggested using a statistical model to forecast demand. What judgment does a statistical model require? You need to decide what variables should be in it and the way the model is set up.
• What sorts of changes in the environment would you need to account for in your forecasting model? Examples would include changes in surgical techniques and changes in the locations of surgery.
Economics for Healthcare Managers, Third Edition – Instructor’s Manual 53
Copyright 2015 Health Administration Press
Chapter 10: Supply and Demand Analysis Key Concepts A supply curve describes how much producers are willing to sell at different prices.
A demand curve describes how much consumers are willing to buy at different prices.
A demand curve describes how much consumers are willing to pay at different levels of output.
At the equilibrium price, producers want to sell the amount that consumers want to buy.
Markets generally move toward equilibrium outcomes.
Expansion of insurance usually makes the equilibrium price and quantity rise.
Insurance and professional advice influence the demand for medical goods and services.
Regulation and technology influence the supply of medical goods and services.
Demand and supply curves shift when a factor other than the product price changes.
Solved Exercises 10.1. Physicians’ offices supply some urgent care services (i.e., services patients seek for
prompt attention but not for preservation of life or limb). a. Name three other providers of urgent care services. b. What sort of shift in supply or demand would result in a market equilibrium with
higher prices and sales volume? c. What might cause such a shift? d. What sort of shift in supply or demand would result in a market equilibrium with
higher prices but lower sales volume? e. What might cause such a shift?
Emergency departments, urgent care clinics, and walk-in clinics supply urgent care services. A shift out in demand (perhaps due to higher consumer incomes) could lead to an equilibrium with higher prices and volume. A shift inward in supply (perhaps due to higher wages for nurses) could lead to an equilibrium with higher prices but lower volume.
10.2. Suppose the market equilibrium price for immunizations is $40 and the volume is 25,000. a. Identify three providers of immunization services. b. What sort of shift in supply or demand would reduce both prices and sales volume? c. What might cause such a shift? d. What sort of shift in supply or demand would result in a market equilibrium with a
price above $40 and a volume below 25,000? e. What might cause such a shift?
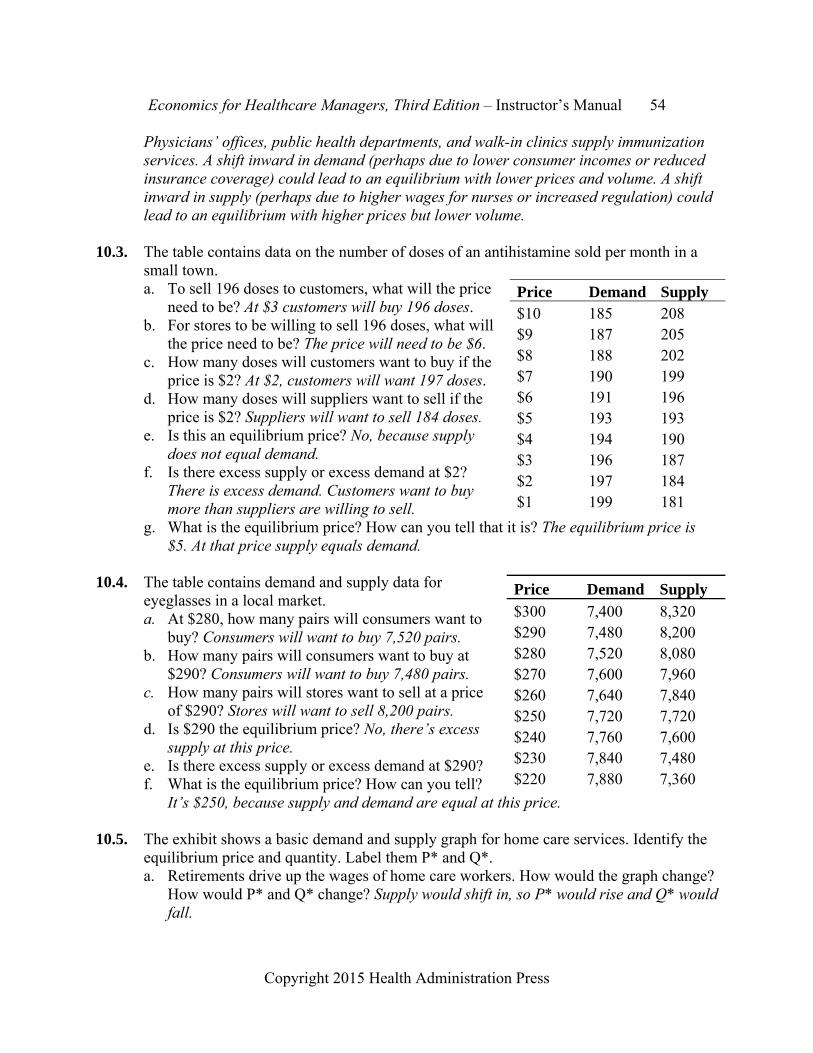
Economics for Healthcare Managers, Third Edition – Instructor’s Manual 54
Copyright 2015 Health Administration Press
Physicians’ offices, public health departments, and walk-in clinics supply immunization services. A shift inward in demand (perhaps due to lower consumer incomes or reduced insurance coverage) could lead to an equilibrium with lower prices and volume. A shift inward in supply (perhaps due to higher wages for nurses or increased regulation) could lead to an equilibrium with higher prices but lower volume.
10.3. The table contains data on the number of doses of an antihistamine sold per month in a small town. a. To sell 196 doses to customers, what will the price
need to be? At $3 customers will buy 196 doses. b. For stores to be willing to sell 196 doses, what will
the price need to be? The price will need to be $6. c. How many doses will customers want to buy if the
price is $2? At $2, customers will want 197 doses. d. How many doses will suppliers want to sell if the
price is $2? Suppliers will want to sell 184 doses. e. Is this an equilibrium price? No, because supply
does not equal demand. f. Is there excess supply or excess demand at $2?
There is excess demand. Customers want to buy more than suppliers are willing to sell.
g. What is the equilibrium price? How can you tell that it is? The equilibrium price is $5. At that price supply equals demand.
10.4. The table contains demand and supply data for
eyeglasses in a local market. a. At $280, how many pairs will consumers want to
buy? Consumers will want to buy 7,520 pairs. b. How many pairs will consumers want to buy at
$290? Consumers will want to buy 7,480 pairs. c. How many pairs will stores want to sell at a price
of $290? Stores will want to sell 8,200 pairs. d. Is $290 the equilibrium price? No, there’s excess
supply at this price. e. Is there excess supply or excess demand at $290? f. What is the equilibrium price? How can you tell?
It’s $250, because supply and demand are equal at this price. 10.5. The exhibit shows a basic demand and supply graph for home care services. Identify the
equilibrium price and quantity. Label them P* and Q*. a. Retirements drive up the wages of home care workers. How would the graph change?
How would P* and Q* change? Supply would shift in, so P* would rise and Q* would fall.
Price Demand Supply $10 185 208 $9 187 205 $8 188 202 $7 190 199 $6 191 196 $5 193 193 $4 194 190 $3 196 187 $2 197 184 $1 199 181
Price Demand Supply
$300 7,400 8,320 $290 7,480 8,200 $280 7,520 8,080 $270 7,600 7,960 $260 7,640 7,840 $250 7,720 7,720 $240 7,760 7,600 $230 7,840 7,480 $220 7,880 7,360

Economics for Healthcare Managers, Third Edition – Instructor’s Manual 55
Copyright 2015 Health Administration Press
b. Improved technology lets home care workers monitor use of medications without going to clients’ homes. How would the graph change? How would P* and Q* change? Supply would shift out, so P* would fall and Q* would rise.
c. The number of people needing home care services increases. How would the graph change? How would P* and Q* change? Demand would shift out, so P* and Q* would both rise.
d. A change in Medicare rules expands coverage for home care services. How would the graph change? How would P* and Q* change? Demand would shift out, so P* and Q* would both rise.
Demand
Supply
Quantity
Pri
ce
10.6. The demand function is Q = 600 - P, with P being the price paid by consumers. Put a list
of prices ranging from $400 to $0 in a column labeled P. (Use intervals of $50.) a. Consumers have insurance with 40 percent coinsurance. For each price calculate the
amount that consumers pay. (Put this in column PNet). b. Calculate the quantity demanded when there is insurance. (Put this in column DI). c. Plot the demand curve, putting P (not PNet) on the vertical axis. d. The quantity supplied equals 2 P. Put these values in a column labeled S. e. What is the equilibrium price? f. How much do consumers spend? g. How much does the insurer spend?
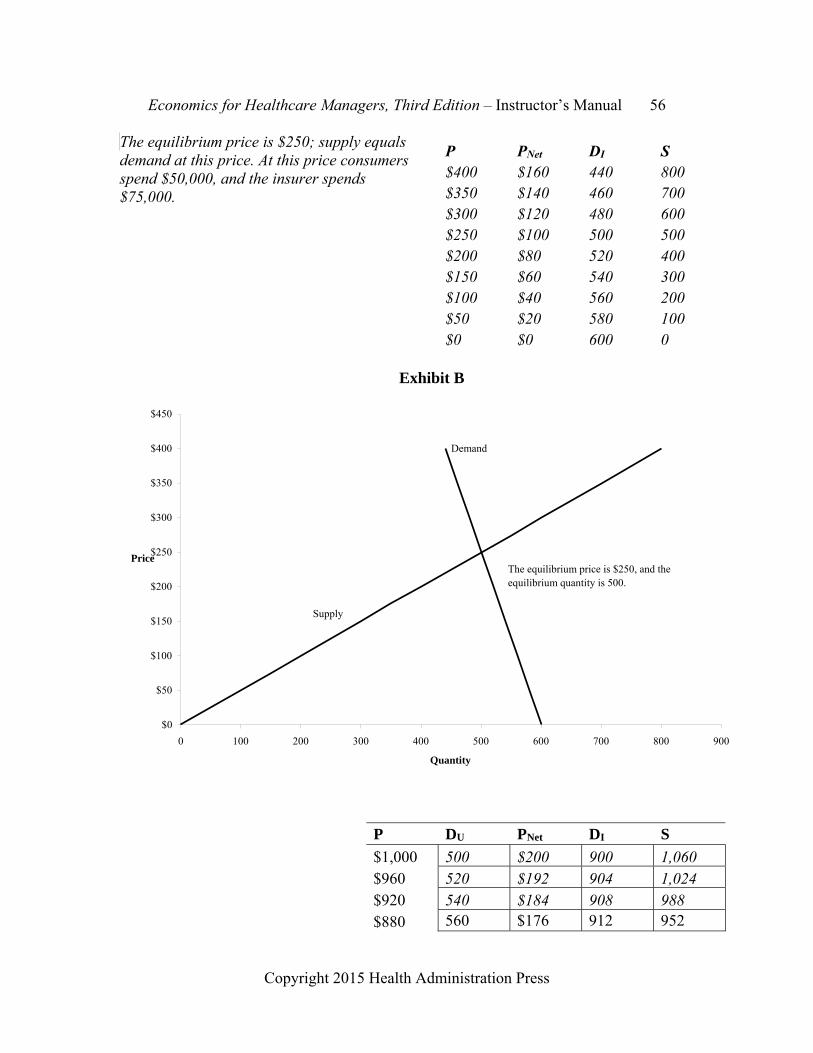
Economics for Healthcare Managers, Third Edition – Instructor’s Manual 56
Copyright 2015 Health Administration Press
The equilibrium price is $250; supply equals demand at this price. At this price consumers spend $50,000, and the insurer spends $75,000.
P PNet DI S $400 $160 440 800 $350 $140 460 700 $300 $120 480 600 $250 $100 500 500 $200 $80 520 400 $150 $60 540 300 $100 $40 560 200 $50 $20 580 100 $0 $0 600 0
P DU PNet DI S
$1,000 500 $200 900 1,060 $960 520 $192 904 1,024 $920 540 $184 908 988 $880 560 $176 912 952
Exhibit B
Supply
Demand
$0
$50
$100
$150
$200
$250
$300
$350
$400
$450
0 100 200 300 400 500 600 700 800 900
Quantity
Price The equilibrium price is $250, and the equilibrium quantity is 500.

Economics for Healthcare Managers, Third Edition – Instructor’s Manual 57
Copyright 2015 Health Administration Press
10.7. The demand function is Q = 1,000 - (0.5 P). P is the price paid by consumers. Calculate the quantity demanded when there is no insurance. (Put these values in column DU of the table.) a. The state mandates
insurance coverage with 20 percent coinsurance, meaning that the demand function becomes 1,000 - (0.5 0.2 P).
b. For each price, calculate the amount that consumers pay. (Put this in column PNet.) c. Calculate the quantity demanded when there is insurance. (Put this in column DI.) d. Plot the two demand curves, putting P (not PNet) on the vertical axis. e. How do DU and DI differ? Which is more elastic? DI is steeper and less elastic than
DU.
10.8. The supply function for the product in Exercise 10.7 is 160 + (0.9 P). P is the price received by the seller. At the equilibrium price, the quantity demanded will equal the quantity supplied.
a. What was the equilibrium price before coverage? After? $600 before, and $840 after. b. After coverage begins, how much will the product cost insurers? How much will the
product cost patients? How much did patients pay for the product before coverage started? Before it was covered, patients paid $420,000 for the product. After coverage, patients paid $153,888 and insurers paid $615,552.
$840 580 $168 916 916 $800 600 $160 920 880 $760 620 $152 924 844 $720 640 $144 928 808 $680 660 $136 932 772 $640 680 $128 936 736 $600 700 $120 940 700 $560 720 $112 944 664

Economics for Healthcare Managers, Third Edition – Instructor’s Manual 58
Copyright 2015 Health Administration Press
Exhibit C
$0
$200
$400
$600
$800
$1,000
$1,200
0 200 400 600 800 1,000 1,200
Quantity
Price
DU
DI
S

Economics for Healthcare Managers, Third Edition – Instructor’s Manual 59
Copyright 2015 Health Administration Press
Case 10.1: Worrying About Demand Shifts Discussion questions: • Exhibit 10.2 shows the current situation. What did Terry think the graph would look like
after the home health care agency entered the market? What did Tracey think the new graph would look like?
• Over the next few years, what demographic changes seem likely to shift the demand for
nursing home care? The aging of the population is the main shift. • What changes in the local market might cause the sort of shift in demand that Terry is
concerned about? Examples might include an effective treatment for dementia, opening of several continuing care retirement communities, or expansion of the Program for All-Inclusive Care for the Elderly to the local area.
DStatus Quo DTerry
DTracey
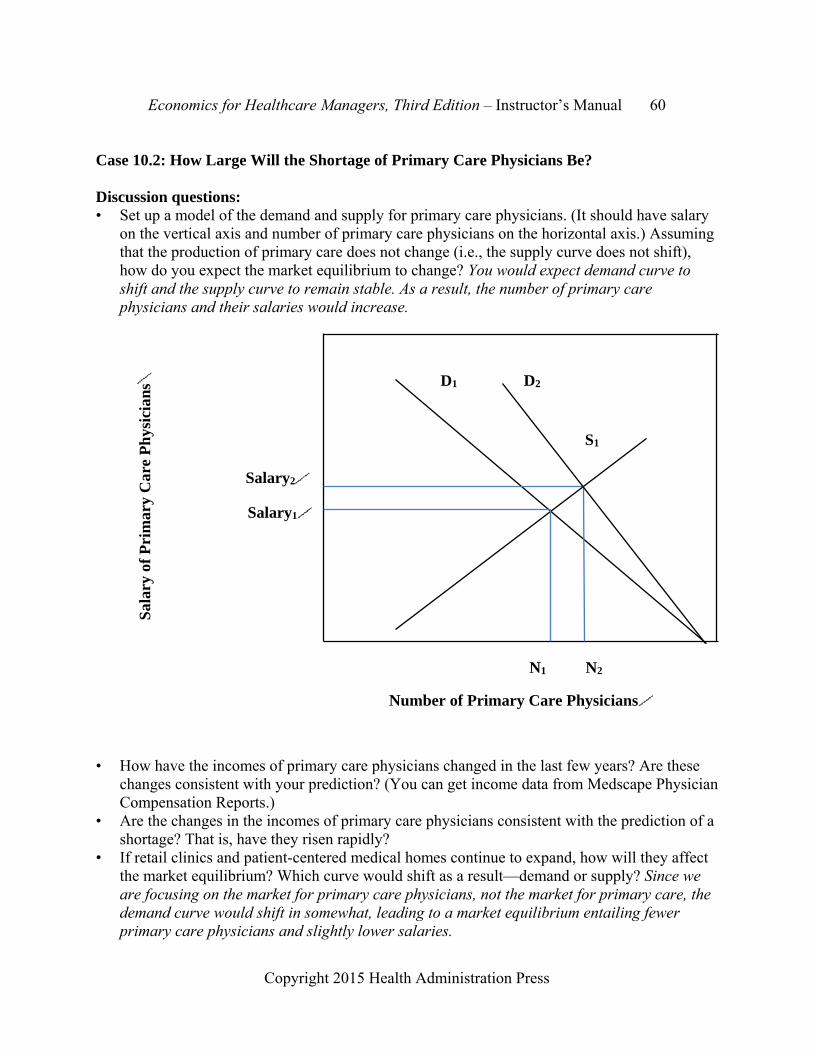
Economics for Healthcare Managers, Third Edition – Instructor’s Manual 60
Copyright 2015 Health Administration Press
Case 10.2: How Large Will the Shortage of Primary Care Physicians Be? Discussion questions: • Set up a model of the demand and supply for primary care physicians. (It should have salary
on the vertical axis and number of primary care physicians on the horizontal axis.) Assuming that the production of primary care does not change (i.e., the supply curve does not shift), how do you expect the market equilibrium to change? You would expect demand curve to shift and the supply curve to remain stable. As a result, the number of primary care physicians and their salaries would increase.
• How have the incomes of primary care physicians changed in the last few years? Are these
changes consistent with your prediction? (You can get income data from Medscape Physician Compensation Reports.)
• Are the changes in the incomes of primary care physicians consistent with the prediction of a shortage? That is, have they risen rapidly?
• If retail clinics and patient-centered medical homes continue to expand, how will they affect the market equilibrium? Which curve would shift as a result—demand or supply? Since we are focusing on the market for primary care physicians, not the market for primary care, the demand curve would shift in somewhat, leading to a market equilibrium entailing fewer primary care physicians and slightly lower salaries.
D1
S1
N2N1
Salary1
Number of Primary Care Physicians
Sal
ary
of P
rim
ary
Car
e P
hys
icia
ns
D2
Salary2

Economics for Healthcare Managers, Third Edition – Instructor’s Manual 61
Copyright 2015 Health Administration Press
D1
S1
N2N1
Salary1
Number of Primary Care Physicians
Sal
ary
of P
rim
ary
Car
e P
hys
icia
ns
D2
Salary2
D3
Salary3
N3
Economics for Healthcare Managers, Third Edition – Instructor’s Manual 62
Copyright 2015 Health Administration Press
Chapter 11: Maximizing Profits Key Concepts All healthcare managers need to understand how to maximize profits.
Most healthcare organizations are inefficient, so cost reductions can increase profits.
To maximize profits, organizations should expand as long as marginal revenue exceeds marginal cost.
Marginal cost is the change in total cost associated with a change in output.
Marginal revenue is the change in total revenue associated with a change in output.
Managers need to understand their costs and not confuse incremental cost with average cost.
The agency problem arises because the goals of stakeholders may not coincide.
Solved Exercises 11.1. A clinic has $1 million in revenues and $950,000 in costs. What is its operating margin?
Its operating margin is 5 percent = ($1,000,000 - $950,000)/$1,000,000.
11.2. The owners of the clinic in Exercise 11.1 invested $400,000. What is the return on investment? Is it adequate? Its return on investment is 12.5 percent = ($1,000,000 - $950,000)/$400,000. Whether this is adequate depends on the level of risk and the other opportunities available to the investors. For some safe investments, 12.5 percent is an excellent return. For some risky investments, 12.5 percent is too low to be interesting.
11.3. A laboratory has $4.2 million in revenues and $3.85 million in costs. What is its operating margin? The operating margin is 8.33 percent = ($4,200,000 - $3,850,000)/$4,200,000.
11.4. The owners of the laboratory in Exercise 11.3 invested $6 million. What is the return on investment? The return on investment is 5.83 percent = ($4,200,000 - $3,850,000)/$6,000,000.
11.5. Go to the website of the Board of Governors of the Federal Reserve System (www.federalreserve.gov). What is the current annual yield for one-year Treasury securities?
11.6. Go to the Yahoo! Finance website (http://finance.yahoo.com) and look up the operating margin and return on equity for Community Health Systems (symbol = CYH). How does this company compare to Aetna (AET), Amgen (AMGN), Laboratory Corporation of America (LH), and Tenet Healthcare Corporation (THC)?
11.7. A not-for-profit hospital realizes a 3 percent return on its $200,000 investment in its home health unit. Its current revenue after discounts and allowances is $382,000. Administrative costs are $119,000, clinical personnel costs are $210,000, and supply costs are $47,000. Providing home health care is not a core goal of the hospital, and it

Economics for Healthcare Managers, Third Edition – Instructor’s Manual 63
Copyright 2015 Health Administration Press
will sell the home health unit if it cannot realize a return of at least 12 percent. A process improvement team has recommended significant changes in the home health unit’s billing processes. The team has concluded that these changes could reduce costs by $20,000 and increase revenues by $5,000. Analyze the data that follows and assess whether the changes will make the home health unit profitable enough to keep.
Old New Revenue $382,000 $387,000Cost $376,000 $356,000Profit $6,000 $31,000 Return on investment 3% 16%
The home health unit now realizes a return on investment of 16 percent.
11.8. The table shows cost and revenue data for an outpatient surgery clinic. Calculate the
clinic’s marginal cost, marginal revenue, and profits at each level of output. Which price maximizes its profits?
Surgeries 250 300 350 400 450 Price $2,000 $1,920 $1,800 $1,675 $1,550 Revenue $500,000 $576,000 $630,000 $670,000 $697,500 Cost $516,000 $538,500 $563,500 $591,000 $621,000 Marginal Revenue $1,520 $1,080 $800 $550 Marginal Cost $450 $500 $550 $600 Profit ($16,000) $37,500 $66,500 $79,000 $76,500
A price of $1,675 maximizes profits.
11.9. The price–quantity relationship has been estimated for a new prostate cancer blood test: Q = 4,000 - (20 P). Use a spreadsheet to calculate the quantity demanded and total spending for prices ranging from $200 to $0, using $50 increments. For each $50 drop in price, calculate the change in revenue, the change in volume, and the additional revenue per unit. (Call the additional revenue per unit marginal revenue.)
Change in Change in Marginal Price Volume Revenue Volume Revenue Revenue $200 0 $0 $150 1,000 $150,000 1,000 150,000 150 $100 2,000 $200,000 1,000 50,000 50 $50 3,000 $150,000 1,000 -50,000 -50 $0 4,000 $0 1,000 -150,000 -150

Economics for Healthcare Managers, Third Edition – Instructor’s Manual 64
Copyright 2015 Health Administration Press
11.10. The table shows output and cost data. Calculate the average total cost, average fixed cost,
average variable cost, and marginal cost schedules. If the price were $500, should the firm shut down in the short run? In the long run?
Quantity 0 5 10 15 20 25 30 35
Total Cost $20,000 $20,500 $20,975 $21,425 $21,850 $22,300 $22,775 $23,275
Average Total Cost $4,100 $2,098 $1,428 $1,093 $892 $759 $665
Avg. Fixed Cost $4,000 $2,000 $1,333 $1,000 $800 $667 $571
Avg. Variable Cost $100 $98 $95 $93 $92 $93 $94
Marginal Cost $100 $95 $90 $85 $90 $95 $100
Since marginal cost is well below $500, the firm should not shut down in the short run. But these total cost figures imply that the firm should shut down in the long run. It will continue to be unprofitable.
11.11. A clinic’s average and marginal cost per case is $400. It charges $600 per case and serves
1,000 customers. Its marketing team predicts that it will expand its sales to 1,250 if it cuts its price to $550. How do profits change if it cuts prices? What is the firm’s marginal revenue? Why is marginal revenue not equal to $550?
Change in Marginal Price Volume Revenue Volume Revenue Revenue $600 1,000 $600,000 $550 1,250 $687,500 250 87,500 350
Marginal revenue is less than $550 because the clinic had to give discounts to existing customers to sell the additional 250 cases. Signing this contract reduces profits by $12,500.

Economics for Healthcare Managers, Third Edition – Instructor’s Manual 65
Copyright 2015 Health Administration Press
11.12. A clinic’s average and marginal cost per case is $400. It charges $600 per case and serves 1,000 customers. Its marketing team predicts that it will expand its sales to 1,250 if it signs a contract for a price of $550 with a local health maintenance organization. How do profits change if it signs the contract? What is the firm’s marginal revenue? Why is its marginal revenue different from the marginal revenue in the previous exercise?
Change in Marginal Price Volume Revenue Volume Revenue Revenue $600 1,000 $600,000 $550 250 $137,500 250 137,500 550 1,250 $737,500
In this case the clinic only gives a discount to the HMO patients. So marginal revenue equals the price the clinic charges the HMO patients. Signing this contract increases profits by $37,500.
Case 11.1: Perfecting Patient Care Discussion questions: • Why is inefficiency common in healthcare? Doesn’t competition force organizations to be
efficient? Many healthcare markets are not very competitive, so competition may not force efficiency increases. In addition, many healthcare firms are not-for-profit. This also may reduce incentives to be efficient. Finally, for many years providers had the option of increasing prices to insured patients to keep profits high. That’s often easier to do than improving efficiency (unless you cannot increase prices any longer).
• What evidence do we have that process redesign can improve efficiency? Isn’t process redesign just another name for making employees work harder? Is there evidence that employees will accept the redesign? There’s quite strong evidence that better processes can improve efficiency and reduce costs. The book On the Mend by John Toussaint offers a number of examples. Usually process redesign is a way of making employees’ work easier, not making them work harder. Process redesign can also improve the quality and safety of care. As a result, workers often welcome process design.
• Plenty of evidence indicates that problems with quality of care harm patients, but won’t improving quality cost more? How could better quality not cost more? Usually poor quality results in doing things over. It’s usually less expensive to do things right the first time.

Economics for Healthcare Managers, Third Edition – Instructor’s Manual 66
Copyright 2015 Health Administration Press
Case 11.2: Tax Exemption for Not-for-Profit Hospitals Discussion questions: • What evidence about the level of community benefit provided by not-for-profit and for-profit
hospitals is available? Most studies find that the level of community benefit is quite similar for not-for-profit and for-profit hospitals.
• Why does using list prices tend to inflate estimates of community benefit? List prices are two to five times larger than the amounts hospitals accept as payment in full. So if the hospital routinely gets paid $500 for a service with a list price of $1,000, the list price overstates what the hospital contributed to charity.
• Are there other important differences between not-for-profit and for-profit hospitals? For-profit hospitals are a little less likely to offer services with low profit margins.
• Would the city be better off if it taxed the hospital and paid for charity care? Probably. • More broadly, is tax exemption a good way to encourage private organizations to serve the
public interest? The link with the public interest is quite weak. • What should the board of assessors do? What are its options? The board’s options include the
status quo, taxing the hospital and paying for charity care, setting a measureable community benefit standard, demanding that the hospital make payments in lieu of taxes, and others. Which is the right answer is not clear, as the board’s decision will reflect political as well as economic analyses.

Economics for Healthcare Managers, Third Edition – Instructor’s Manual 67
Copyright 2015 Health Administration Press
Chapter 12: Pricing Key Concepts Pricing is important.
Marginal cost pricing maximizes profits in most cases.
Marginal cost pricing uses estimates of the price elasticity of demand and incremental costs to set the profit-maximizing price.
The consequences of setting price incorrectly can be substantial.
Price discrimination is common in healthcare and other industries.
Price discrimination can substantially increase profits.
Contracting demands the same information as pricing.
Solved Exercises 12.1. The marginal cost pricing model calculates a markup over marginal costs using estimates
of the price elasticity of demand. Will any other pricing strategy result in higher profits? No, any higher or lower price will reduce profits.
12.2. If cost shifting is just a useful public relations ploy, why does it get so much attention? Because price discrimination is a contentious issue with the public.
12.3. Will raising prices increase the rate of return from a line of business? It depends. If prices were below the profit-maximizing level, raising them would increase profits. Otherwise, raising prices would reduce profits.
12.4. Can you think of a healthcare firm that does not price discriminate (i.e., charge different customers different amounts for the same product)? Over-the-counter drug manufacturers.
12.5. Price discrimination requires the ability to distinguish customers who are the most price sensitive and the ability to prevent arbitrage (resale by customers who buy at low prices). What attributes of healthcare products make these tasks easy to do? Most healthcare products must be delivered directly to the customer. Many healthcare products are services, which are very difficult to resell. The type of insurance that customers have is usually a good marker of who is the most price sensitive.
12.6. Your pharmacy provides services to Medicare and PPO patients. You estimate a price elasticity of demand of -2.2 for Medicare patients and -5.3 for PPO patients. Your marginal and average cost for dispensing a prescription is $2. What is the profit-maximizing dispensing fee for Medicare and PPO patients? Why might the price elasticities of demand differ? The profit-maximizing price for Medicare patients is -$2 2.2/(1 - 2.2) = $3.67. The profit-maximizing price for PPO patients is -$2 5.3/(1 - 5.3) = $2.47. The elasticities might differ because PPOs will exclude providers with prices

Economics for Healthcare Managers, Third Edition – Instructor’s Manual 68
Copyright 2015 Health Administration Press
that are too high from the core network. 12.7. Your dental clinic provides 3,000 exams for private pay patients and 1,000 exams for
members of a union. Your fixed costs are $50,000 and your incremental cost is $40. a. Private pay patients have a price elasticity of demand of -3. What do you charge
them? You charge them -$40 3/(1 - 3) = $60. b. The union has negotiated a fee of $50. Is it profitable to treat members of the union?
Yes, each union patient generates $50 in revenue and costs $40. c. What would happen to your profits if you stopped treating members of the union? If
you stopped treating union members your profits would fall by $10,000. d. If the union negotiated a fee of $45 instead, what would you charge private pay
patients? You would still charge them $60. That is the price that maximizes profit. e. What does this tell you about cost shifting versus price discrimination? Price
discrimination is a standard consequence of profit-maximizing behavior. Cost shifting requires another basis.
Volume Price Revenue Cost
$50,000 Fixed 3,000 $60 $180,000 $120,000 Variable 1,000 $50 $50,000 $40,000 Variable $230,000 $210,000
12.8. You provide therapeutic massage services, focusing on stress reduction services that are
not covered by insurance. Your monthly overhead is $2,000. You value your time at $20 per half hour (how long a therapeutic massage takes). Supplies per massage cost $4. You currently charge $75 per massage and have a monthly volume of 100 clients per month. Your trade journal says that a 5 percent reduction in prices typically results in a 7.5 percent increase in volume. What would happen to your volume, revenues, and profits if you cut your price to $70? If you raised your price to $80? Given this information, you expect that a 6.7 percent increase in prices will reduce sales by 10 percent = -0.067 1.5. Likewise, a 6.7 percent decrease in prices will increase sales by 10 percent. With sales of 90 and a price of $80, your revenue will be $7,200. Your costs will be $4,160, so your profits will be $3,040. This is a little less than your current profits of $3,100. If you cut prices to $70, sales will increase to 110, but profits will go down to $3,060. The marginal cost pricing rule suggests that your price should be $72, but all of these prices yield similar profits.
12.9. The table shows case-mix-adjusted price and volume data for Dunes Hospital. Calculate its marginal cost, marginal revenue, and profits at each level of output. What price should it choose?

Economics for Healthcare Managers, Third Edition – Instructor’s Manual 69
Copyright 2015 Health Administration Press
Case-Mix-Adjusted Price and Volume Data for Dunes Hospital Admissions 6,552 9,048 9,672 9,984 10,296 Revenue $52,416,000 $70,574,400 $73,507,200 $73,881,600 $74,131,200Cost $42,588,000 $59,264,400 $63,835,200 $66,393,600 $68,983,200Price $8,000 $7,800 $7,600 $7,400 $7,200 MR $7,275 $4,700 $1,200 $800 MC $6,681 $7,325 $8,200 $8,300 Profit $9,828,000 $11,310,000 $9,672,000 $7,488,000 $5,148,000
The hospital should choose a price of $7,800. If it cuts the price to $7,600, marginal revenue drops below marginal cost and profits fall. 12.10. Your firm spent $100 million developing a new drug. It has now been approved for sale,
and each pill costs $1 to manufacture. Your market research suggests that the price elasticity of demand in the general public is -1.1. a. What price do you charge the public? The marginal cost pricing model suggests that
you should charge $11 = -1 1.1/(1 - 1.1). b. What would happen to profits if you charged twice as much? If you charged twice as
much, demand would drop sharply. The elasticity suggests that demand would drop to zero, but the elasticity may not be reliable for such a large price increase. In any event, sales are likely to drop so much that profits would fall.
c. What role does the $100 million in development costs play in your pricing decision? None; it’s a fixed cost.
d. The Medicaid agency has made a take-it-or-leave-it offer of $2 per pill. Do you accept? Why or why not? Your profits will be higher if you take it. Marginal revenue ($2) exceeds marginal cost ($1).
12.11. Why are most healthcare providers able to charge different groups of purchasers different prices for the same products? Because virtually all services and most goods cannot be easily resold, price discrimination is possible.
12.12. A clinic has incremental costs per case of $10 and overhead costs of $100,000. It faces a price elasticity of demand of -2.
a. What is the clinic’s profit-maximizing price? It is $20 = -10 2/(1 - 2). b. How would the profit-maximizing price change if overhead costs doubled? It would
not change. c. With excess capacity, would serving Medicaid customers for a fee of $16 make
sense? It would. Marginal revenue from private patients is only $10, and marginal revenue from Medicaid is $16.
d. How would the profit-maximizing price change if Medicaid raised its fee to $18? It would not change.
12.13. You manage a not-for-profit hospital in a competitive market. Suppose you decide to charge less than the profit-maximizing price to your customers.
Economics for Healthcare Managers, Third Edition – Instructor’s Manual 70
Copyright 2015 Health Administration Press
a. What effect would that decision have on profits? By definition, it would reduce profits.
b. What effect would that decision have on you and your career? Delivering profits that fall short of expectations generally dampens career prospects.
12.14. Assume the price elasticity of demand for physicians’ services is -0.2. If your marginal cost per visit is $20, what is your profit-maximizing price if you control 5 percent of the market? What is your profit-maximizing price if you control 15 percent of the market? What lessons do you draw from this information? With a 5 percent market share, your firm’s price elasticity of demand will be -4.00 = -0.2/0.05. The profit-maximizing price will be $26.67. With a 15 percent market share, your firm’s price elasticity of demand will be -1.33 = -0.2/0.15. The profit-maximizing price will be $80. The implication is that market share leads to market power and higher markups.
12.15. A busy urgent care clinic has average costs of $40 and incremental costs of $60.
a. How could incremental costs be higher than average costs? The clinic faces much higher than average costs to serve the last few customers. It may need to add staff or pay overtime to do so.
b. The clinic charges $80 for a visit. What price elasticity of demand does this information imply? Assuming that the clinic charges the profit-maximizing price, a price of $80 implies an elasticity of -4.00 when the incremental cost is $60. The marginal cost pricing model implies that $80 = $60 ε/(1 + ε), which implies that ε = -4.00.
c. Volume is currently 200 visits per week. What are the clinic’s profits? Profits equal revenue minus cost, which is $80 200 - $40 200 = $8,000.
d. An HMO guarantees at least at least 10 patients per week. It proposes a fee of $55. Should the clinic accept the contract? No, incremental cost is $60, and the HMO will be paying only $55.
e. What happens to profits if it accepts the contract? Profits will fall by $50 per week: ($55 - $60) 10.
Case 12.1: Price Discrimination in Practice Discussion questions: • Why do drug firms give discounts voluntarily? Because they have concluded that doing so is
more profitable than not giving discounts. This is a form of price discrimination. If the drug firms have really good marketing departments, giving discounts should be quite profitable.
• Do other healthcare providers routinely give discounts to some customers? Discounts are common in healthcare. The price you pay for most services is the result of negotiations between your provider (or the system she is part of) and an insurer. If a provider treats patients with 100 types of insurance, she will typically get paid 100 different amounts for each service.
• Why do the uninsured typically pay the highest prices? The uninsured are typically in a very bad bargaining position. They represent just themselves, so the provider need not worry

Economics for Healthcare Managers, Third Edition – Instructor’s Manual 71
Copyright 2015 Health Administration Press
about any significant loss of business. They may not be able to credibly threaten to take their business elsewhere. And they may not understand that list prices are fantasies. So they may not even ask for a discount.
• Why would a hospital usually get a better price for a drug than an insurance company? A hospital can credibly threaten not to use the drug or use it rarely. An insurer will find that more difficult, because the physicians who make recommendations do not work for it (unless it is an HMO).
• Why does the VA get such low prices? The VA is big, is very focused on keeping costs down, and can credibly threaten not to use a product.
• Suppose a law was enacted that required drug manufacturers to give state Medicaid agencies the same price they negotiated with the VA. How would Medicaid and VA prices change? VA prices would surely go up, as its bargaining position would be weakened. Medicaid prices might go down a bit, but they would surely wind up higher than the original prices the VA negotiated.
• Should Medicare adopt the VA formulary? Medicare could almost certainly get lower prices if it adopted a strict formulary and negotiated with drug manufacturers. Congress has prohibited Medicare from doing so. This probably reflects both concerns about excessive federal power and effective lobbying by drug manufacturers. As Chapter 16 notes, parties with clear interests can often be very effective players in the political process. Drug manufacturers have a clear interest in making sure that Medicare cannot negotiate drug prices.
Case 12.2: What Should You Charge? Discussion questions: • By law, you must charge everyone the same price. What do you charge? You would charge
$33.25, the price at which marginal revenue is closest to marginal cost. At this price marginal revenue is $20.33 and marginal cost is $20. Dropping the price to $33 would push marginal revenue below marginal cost.
• Your costs equal $100,000 plus $20 per visit. What are your revenues, costs, and profits? Your revenues are $669,156.25 and your costs are $502,500, so your profits are $166,656.
• If you could charge low-income and high-income customers different prices, what prices would you charge each group? What would your revenues, costs, and profits be? Would this scenario be ethical? How would you try to identify the two groups? (You cannot do income surveys of your patients.) If you could charge the groups separate prices, you would charge the low-income customers $29.75 and charge the high-income customers $34.75. Your revenues would be $682,406.25, costs would be $497,500, and profits would be $184,906, an 11 percent increase. So price discrimination increases profits. I cannot think of a scenario in which charging poorer people less than richer people would be unethical. Identifying the two groups would be the really hard part. You could locate one service near a poorer area and another near a wealthier area. An easier strategy would be to agree to a lower price with an insurer that serves less wealthy people and a higher price with an insurer that serves more wealthy clients.

Economics for Healthcare Managers, Third Edition – Instructor’s Manual 72
Copyright 2015 Health Administration Press
Volume Revenue Price Low Inc. High Inc. Total Low Inc. High Inc. Total $35.75 2,125 14,250 16,375 $75,968.75 $509,437.50 $585,406.25 $35.25 2,375 14,750 17,125 $83,718.75 $519,937.50 $603,656.25 $34.75 2,625 15,250 17,875 $91,218.75 $529,937.50 $621,156.25 $34.25 2,875 15,750 18,625 $98,468.75 $539,437.50 $637,906.25 $33.75 3,125 16,250 19,375 $105,468.75 $548,437.50 $653,906.25 $33.25 3,375 16,750 20,125 $112,218.75 $556,937.50 $669,156.25 $32.75 3,625 17,250 20,875 $118,718.75 $564,937.50 $683,656.25 $32.25 3,875 17,750 21,625 $124,968.75 $572,437.50 $697,406.25 $31.75 4,125 18,250 22,375 $130,968.75 $579,437.50 $710,406.25 $31.25 4,375 18,750 23,125 $136,718.75 $585,937.50 $722,656.25 $30.75 4,625 19,250 23,875 $142,218.75 $591,937.50 $734,156.25 $30.25 4,875 19,750 24,625 $147,468.75 $597,437.50 $744,906.25 $29.75 5,125 20,250 25,375 $152,468.75 $602,437.50 $754,906.25 $29.25 5,375 20,750 26,125 $157,218.75 $606,937.50 $764,156.25 $28.75 5,625 21,250 26,875 $161,718.75 $610,937.50 $772,656.25 $28.25 5,875 21,750 27,625 $165,968.75 $614,437.50 $780,406.25 $27.75 6,125 22,250 28,375 $169,968.75 $617,437.50 $787,406.25 $27.25 6,375 22,750 29,125 $173,718.75 $619,937.50 $793,656.25 Case 12.3: Should My Firm Accept This Contract? Discussion questions: • Why is your initial response to reject the offer? It gives you less revenue than the status quo. • Why might overhead go down if you accept the contract? Overhead should fall because
billing becomes much simpler. • Why might utilization rates go down? You expect that your physicians’ recommendations
will eventually become more conservative, because utilization no longer increases revenue or profit.
• What are the risks of accepting or refusing? The main risk of accepting is that profits might fall. Given that you are a fairly small practice, a catastrophically expensive case might be very harmful to you. The risk of refusing is that one of your competitors might accept and take away a substantial portion of your business.
• What should you do next? Should you accept the proposal? Should you make a counteroffer? I would recommend making a counteroffer that protects you from some of the risks that simple capitation would expose you to. This might include stop-loss insurance on very expensive cases, adjusting the capitation rate for known risks, or outlier payments.
Economics for Healthcare Managers, Third Edition – Instructor’s Manual 73
Copyright 2015 Health Administration Press
Chapter 13: Asymmetric Information and Incentives Key Concepts Asymmetric information is a situation in which one party to a transaction has better
information about it than another.
Asymmetric information allows the better informed party to act opportunistically.
Asymmetric information is a common problem for managers.
Aligning incentives helps reduce the problems associated with asymmetric information.
Concerns about risk, complexity, measurement, strategic responses, and team production limit the extent of incentive-based payments.
Only a few forms of incentive-based contracts are common in healthcare.
Solved Exercises 13.1. Describe some healthcare situations in which an agent has taken advantage of a principal.
Then describe some healthcare transactions that have not taken place because of fears about asymmetric information. Suppose that a physician recommended an MRI for a patient with back pain. The physician would know that the results of the MRI would not be likely to change the diagnosis or therapy. The patient might not know this. Examples of transactions that do not take place because of asymmetric information include the inability of some willing purchasers to buy health insurance (because the insurer is concerned that the consumer is especially likely to use care) or the unwillingness of a patient to have recommended care (because she fears that the physician’s recommendations are self-serving).
13.2. Identify some ways that nursing homes can signal high quality to consumers. Which of these signals are most apt to be reliable? Examples would be fancy public areas, high prices, Joint Commission accreditation, and high scores from surveyors. The last two are more apt to be reliable.
13.3. Provide an example of costly monitoring in the healthcare workplace. Can you think of an employment contract that would allow a reduction in monitoring without a reduction in quality? An example would be tracking hours for your billing staff. A contract that paid these staff a base salary plus a bonus based on the proportion of bills that were collected within 30 days and a penalty based on the proportion uncollected after 90 days might allow a reduction in monitoring.
13.4. What are some strategies for reducing adverse selection in insurance markets? What sorts of problems do these solutions cause? Adverse selection can be reduced by letting insurers set premiums based on age, gender, and medical history. This reduces risk spreading, as high-risk people will pay higher premiums. Adverse selection can also be
Economics for Healthcare Managers, Third Edition – Instructor’s Manual 74
Copyright 2015 Health Administration Press
reduced by requiring that everyone buy the same plan. This, however, reduces consumer choice. Alternatively, adverse selection can be reduced by imposing waiting periods or by excluding pre-existing conditions. Unfortunately, this increases risks for potential buyers and can lock high-risk people into an insurer or a job.
13.5. One physical therapist is paid $20 per session. Another is paid $400 per week plus $20 per session in excess of 20 sessions per week. A third is paid $400 per week, plus $200 per week for having all paperwork complete and filed within 48 hours, plus $20 per session in excess of 30 sessions per week. How do the therapists’ incentives to produce sessions compare? How do their incentives to complete paperwork differ? At the margin, each therapist is paid $20 per session. That is, each will get paid $20 for session 31. The main difference between the three is that the third therapist has a significant incentive to have her paperwork complete and up-to-date. The other two therapists derive no immediate financial benefit from timely completion of paperwork. Getting the paperwork done is likely to be an ongoing irritant for them.
13.6. One physician is paid $100 per visit. Another is paid $2,500 per week plus $100 per session in excess of 20 sessions per week. A third is paid $2,000 per week plus $100 per session in excess of 20 sessions per week. The third physician is also paid a weekly bonus of $500 for being in the top quartile in management of common chronic diseases, appropriate antibiotic use, preventive counseling, screening tests, and appropriate prescribing in elderly patients. How do the physicians’ incentives compare? As in the first question, the incentives are the same at the margin. Each visit after the twentieth pays each physician $100. The third physician has financial incentives to stay in the top quartile on the quality measures.
13.7. The Federal Trade Commission requires that firms advertise truthfully. Why does this promote competition? Would firms be better or worse off if the Federal Trade Commission adopted a “let the buyer beware” policy? Truthful advertising promotes competition because it provides information that customers need to make good decisions. If advertising is seen as being unreliable, customers will not rely on it as a source of information. This will mute competition among existing firms, frustrate entry by new firms, and discourage the introduction of innovative products. Customers will tend to stick with products that have been satisfactory in the past when information about new products is expensive or unreliable. In most cases this will result in higher markups for the makers of well-known products, because the demand for these products will become less elastic. Nonetheless, firms will generally be worse off under a “let the buyer beware” policy. Expanding into new markets and introducing new products—the forces that drive growth—will be very difficult, so firms will stagnate.
13.8. Your firm sells backup generators to hospitals and clinics. The generators are guaranteed to operate on demand for two years. Your data show that the generators run an average of 42 hours per year. Your firm offers an extended warrantee that covers the next three years. Your data show that repairs are needed for 2 percent of units during this three-year period. When repairs are needed, the average cost is $4,000. You charge $400 for the extended warrantee, and about 20 percent of your clients buy it.

Economics for Healthcare Managers, Third Edition – Instructor’s Manual 75
Copyright 2015 Health Administration Press
a. The extended warranty has been a consistent money loser. Claims average $1,000 per customer. How could this situation happen, given the data above? Your firm is probably experiencing adverse selection (and possibly some moral hazard). The extended warranty is especially attractive to firms with above average use or exceptionally challenging operating environments. These firms may be skimping on maintenance as well.
b. Would raising the premium to $1,000 solve this problem? No, that would exacerbate the problem. Only firms with exceptionally high use rates or especially difficult operating conditions would buy the warranty if the premium were $1,000.
c. What would you recommend that your company do to solve this problem? One strategy would be to bundle a maintenance contract with the extended warranty. That way you could be sure that routine maintenance was being done properly. You could also monitor usage when doing the maintenance.
13.9. For the population as a whole, average healthcare spending is $1,190. Those with a
family history of cancer (5 percent of the population) spend $20,000 on average, and those with no family history (95 percent of the population) spend $200. An insurer is offering first-dollar coverage for $1,200. a. You are not risk averse and do not have a family history of cancer. Do you buy
coverage? Your expected spending is $200, and you are not risk averse. Coverage costs $1,200, so you would not buy it.
b. You are not risk averse and have a family history of cancer. Do you buy coverage? Your expected spending is $20,000. Coverage costs $1,200, so you would buy it.
c. If you were risk averse, how would your answers to the two previous questions change? You might buy coverage even without a family history of cancer if you were sufficiently risk averse. After all, some people with no family history of cancer get cancer. You would buy coverage if you had a family history of cancer whether you were risk neutral or risk averse.
d. What could an insurer do to prevent this sort of adverse selection? Underwriting is a standard strategy. By doing a history and physical on each person who tries to buy coverage, the insurer can sort them into risk groups. Simply asking potential customers about their family history would let an insurer sort them into high-risk and low-risk groups.
e. What would be wrong with having everyone undergo a physical exam to qualify for coverage? It adds to costs without changing the underlying risks.
13.10. You want to hire a new laboratory technician. Excellent technicians generate $1,000 in value-added service each week. Adequate technicians generate $500 in value-added service each week. Half of the graduates are excellent, and half are adequate. a. You cannot tell who is highly capable and who is adequate. You are prepared to pay
each technician according to the value he or she adds. What salary do you offer? You will be forced to offer a wage suitable for adequate technicians. If you offer a wage high enough to attract excellent technicians, you will also attract, hire, and overpay many adequate technicians.
b. Who will accept this offer? If you offer $500 per week, only adequate technicians will
Economics for Healthcare Managers, Third Edition – Instructor’s Manual 76
Copyright 2015 Health Administration Press
accept. c. Is there any way that excellent technicians could communicate their productivity?
There are many ways. Scores on standardized tests, grades in training, or perhaps willingness to accept incentive-based contracts will signal high productivity to potential employers.
d. Propose a compensation system that will attract both types of technicians and will pay no one more than the value he or she adds. A fair incentive-based system could attract both types. A piece rate is one incentive system. Another would be bonuses or promotions for employees who demonstrate high productivity. A complicating factor is that employees may be uncertain about their potential productivity. Work is different from training, and indifferent students may turn out to be good employees.
13.11. A new test identifies individuals with a genetic predisposition to develop heart disease before age 70. People who are predisposed to heart disease cost twice as much to insure as those who are not. a. Can you make a case that a law prohibiting this test would be a good idea? Unless the
test improves the effectiveness of treatment, it will not change the odds of heart disease for individuals or the population. As a result, it adds costs without adding benefits.
b. The test is not expensive. Would you prefer to skip the test and buy insurance at a premium that covers everyone or take the test and buy insurance at a premium that covers your group? Although this might be a bad idea, insurers in a competitive market would feel considerable pressure to encourage customers to take the test. Sorting customers into high-risk and low-risk groups is a strategy that can pay off quickly.
13.12. Your hospital wants to buy practices to expand its primary care networks. You are aware that physicians who want to sell their practices differ. Some love to practice medicine and love seeing patients. They want to sell their practices to focus on patient care 50 hours per week. Some physicians love to play golf and want to provide patient care no more than 35 hours per week. Propose a compensation plan that will allow you to hire only physicians who love to practice. A compensation plan that rewards physicians for being productive, for being accessible to patients, for serving patients well, and for meeting clinical quality standards will be attractive to physicians who love seeing patients and will be unattractive to physicians who love playing golf.
13.13. Having access to the books and understanding local markets better than new owners, the owners of medical practices generally understand their finances better than prospective buyers do. What sorts of transactions will tend to take place as a result of this information asymmetry? What sorts of transactions tend not to take place? What can buyers and sellers do to offset this information asymmetry? Sales are most apt to take place when buyers overestimate the value of a practice. (When the seller is retiring, this need not be true, although the successful bidder is still apt to have the most optimistic view of the value of the practice.) Because buyers know this, the value of practices will tend to be depressed. A partial remedy for this problem is the practice of “due diligence,” in which a buyer gets access to the books after signing a contract to purchase a practice. Another
Economics for Healthcare Managers, Third Edition – Instructor’s Manual 77
Copyright 2015 Health Administration Press
partial remedy is to hire a buyer’s agent who has experience in these transactions. Large firms may employ experienced acquisition specialists. Then, of course, the incentives of a buyer’s agent or acquisition specialist are not the same as the incentives of the buyer.
13.14. You are considering acquiring a firm rumored to have developed an effective gene therapy for diabetes. The value of the firm depends on this therapy. If the therapy is effective, the firm is worth $100 per share; otherwise, the firm is worth no more than $20 per share. Your company’s management and marketing strengths should increase the share price by at least 50 percent in either case. You must make an offer for the firm now, before the results of clinical trials are in. The current owner of the firm will sell for the right price. Make an offer for the firm. Explain why you think your offer makes sense. If the therapy is ineffective, the firm is worth $30 a share to you. Some price between $20 and $30 a share will lead the owners to sell as long as the therapy is ineffective. The owner will not sell at prices like this if there is a reasonable chance the firm will be effective. Even a 15 percent chance of success would push the value per share to the current owner over $30, as its expected value will be p $20 + (1 - p) 100. Your offer has to assume that the therapy is ineffective, because owners who think that are the most willing to sell.
Case 13.1: Improving Safety Discussion questions: • Who is the principal and who is the agent in this scenario? The principal is the system and
the agent is the nursing home administrator. • How is the agent better informed than the principal? The agent has firsthand knowledge
about steps taken to improve safety and injuries to workers. The system relies on the administrator to tell it about both of these.
• How do poorly aligned incentives affect the system and individual administrators? Administrators are rewarded for profitability, and that does not include the workers’ compensation premium (which depends in part on how many injuries employees had). So administrators may undervalue improvements in safety.
• What could the system do to convince nursing home administrators to improve safety? If bonuses and promotions were based in part on worker safety, administrators would be motivated to improve safety.
• Are financial incentives a part of the action plan? Why or why not? It is not vital that there be explicit payments for improved safety, but it cannot be excluded from consideration. In many cases, promotion and retention are more powerful incentives than raises or bonuses. Visible praise for administrators who have taken steps to improve safety can be an important incentive, as it signals the importance of the issue to administrators.
• How could nursing home administrators signal to the company that they are improving safety? They can make safety goals and resources a standard agenda item at staff meetings. They can praise and reward employees who report or help resolve safety problems. They can appoint a chief safety officer. They can track follow-through on safety concerns. They can regularly survey employees about safety concerns.
Economics for Healthcare Managers, Third Edition – Instructor’s Manual 78
Copyright 2015 Health Administration Press
Case 13.2: Improving Total Knee Replacement at Brigham and Women’s Hospital Discussion questions: • Why would standardization reduce costs? How could it improve quality? Standardization
reduces inventories and improves a hospital’s bargaining position. Both reduce costs. Standardization improves quality by choosing products with good records of safety, reliability and effectiveness. Standardization also simplifies what staff do, which also improves quality.
• How could the hospital reward physicians for helping standardize prostheses? A hospital can hire physicians for clinical management services. This could include standardization. Medicare regulations limit the ability of hospitals to share the savings from cost-reduction efforts by offering bonuses or a share of the savings. This does not apply to efforts to reduce costs for patients with private insurance, nor does it apply to fixed payments for services rendered. If the physicians are employees, the hospital can offer bonuses based on improved quality of care.
• How would this reward system help align incentives? If physicians are eligible for financial and nonfinancial rewards for improving quality, their interests become similar to the hospital’s
• Are any strategies less likely to cause problems with the Medicare Inspector General? The Office of the Inspector General has extended the safe harbor that allows hospital systems to donate EMR systems to affiliated physicians without running afoul of the Stark laws. A hospital can join one of the gainsharing or bundled payment demonstrations.
• Why would choosing a standard prosthesis improve the hospital’s bargaining position? Once the hospital can credibly threaten not to use a prosthesis unless it gets a good price, suppliers have to negotiate. If physicians choose prostheses independently, they have little interest in getting a lower price.

Economics for Healthcare Managers, Third Edition – Instructor’s Manual 79
Copyright 2015 Health Administration Press
Chapter 14: Economic Analysis of Clinical and Managerial Interventions
Key Concepts Analyses of interventions are designed to support decisions, not make them.
Comparing the most plausible alternatives is vital. Well-done analyses will not be enlightening if we consider the wrong choices.
Four types of analysis are common: cost minimization analysis (CMA), cost-effectiveness analysis (CEA), cost–utility analysis (CUA), and cost–benefit analysis (CBA).
The simplest and most productive type of analysis is CMA.
CBA and CUA are potentially more powerful but pose many questions.
Modeling costs entails identifying the perspective involved, the resources used, and the opportunity costs of those resources.
Focusing on the direct costs of interventions is best.
Modeling benefits is the most difficult part of economic evaluation of clinical interventions.
Solved Exercises
14.1. Why have economic analyses of clinical and administrative innovations become more important? There are two reasons. First, healthcare markets have become more competitive. Instead of hospital or physician shortages, there are patient shortages. This increases the pressure on healthcare organizations to compete on the basis of price, making economic analysis of innovations more important. Second, the shifts toward case-based reimbursement and capitation make reducing costs a much more important management strategy. Billing rules no longer determine what is profitable. Organizations need to assess what changes are efficient.
14.2. Why is cost-minimization analysis most likely to be useful for managers? It is the simplest and most reliable type of analysis, because it limits its examination of benefits to making sure that the less expensive option has clinical outcomes that are at least as good as the alternatives. CMA also focuses on innovations that increase efficiency, which is a primary concern for managers.
14.3. Why would an economist object to including overhead costs in a CMA analysis? The key question is “Would adopting this innovation change these overhead costs?” Usually the answer is “no,” meaning that these costs should not be included in the CMA analysis. Any of these analyses of clinical and managerial interventions needs to focus on the costs that change if one choice is made rather than another.
14.4. A clinic finds that it can reduce costs by eliminating appointments. The clinic is able to eliminate some telephone staff, and physicians become more productive. Patients wait

Economics for Healthcare Managers, Third Edition – Instructor’s Manual 80
Copyright 2015 Health Administration Press
until the physician is available, so the physician has virtually no downtime. Does this analysis adopt a societal view of costs? Why might this analysis result in a bad managerial decision? It ignores costs that patients face as a result of eliminating appointments, so this analysis does not use a societal perspective. This is likely to be a bad management decision, because patients are likely to seek providers who do not impose these sorts of costs on them.
14.5. Treating a patient with congestive heart failure with tPlex rather than Isother increases average life expectancy to 12.3 years from 11.5 years. The added cost of therapy is $14,000. What is the cost per life year? Should you choose tPlex or Isother? The cost per life year is $17,500. Spending $14,000 more adds 0.8 year to life expectancy. Dividing $14,000 by 0.8 gives $17,500. This is an example of cost-effectiveness analysis. No definite answer is possible, but the cost per life year is so low that it seems likely that you will choose tPlex.
14.6. Compared with a drip system, a new type of infusion pump reduces the cost of administering chemotherapy from $25 per dose to $20 per dose. The complication rate of each system is 2 percent. Which should you choose? What sort of analysis should you do? The evidence suggests that the two pumps have equivalent clinical effects. Hence, you should choose the cheaper one. This case calls for a cost-minimization analysis.
14.7. After choosing between the options in Exercise 14.6, you discover that an infusion pump with a dosage monitoring system costs $15 per dose. Its monitoring functions reduce the complication rate to 1 percent. Which of the three options do you prefer? What principle does this illustrate? In this case, the pump with the dosage monitoring system is both less expensive and safer than the alternatives. It dominates them. This illustrates the importance of considering the right alternatives. The most common sort of mistake is to miss a very good option.
14.8. Switching from one anesthesia drug to another reduces costs by $100 per patient. What additional information do you need to do a cost-minimization analysis? You need compelling information that both drugs are clinically comparable. If the cheaper drug were not as good as the alternative, you might choose it. However, a cost-minimization analysis would not be appropriate in this case.
14.9. A vaccine costs $200 per patient. Administration of the vaccine to 1,000 people is expected to increase the number of pain-free days for this population from 360,000 to 362,000. Calculate the cost per additional pain-free day due to vaccination. Is vaccination a good investment? Cost increases by $200,000 and pain-free days increase by 2,000. So the cost per pain-free day is $200. This sounds like a reasonable figure, but there are no clear standards for what an additional pain-free day should be worth.
14.10. An acute care hospital has found that having geriatric nurse specialists take charge of discharge planning for stroke patients reduces length of stay from 5.4 days to 5.2 days. On average the geriatric nurse specialist (who earns $27 per hour including fringe benefits) spends 3.3 hours on discharge planning per patient. Supply and telephone costs are less than $10 per discharge plan. Your accounting staff tell you that the average cost

Economics for Healthcare Managers, Third Edition – Instructor’s Manual 81
Copyright 2015 Health Administration Press
per day is $860 and the incremental cost per day is about $340. Is this innovation financially attractive? Whether it is or not, what alternatives should the hospital consider? The cost of this innovation is $10 + 3.3 $27, which equals $99.10. The savings are 0.2 $340, which equals $68. Assuming that the care is of equal quality with or without geriatric nurse specialists taking charge of discharge planning for stroke patients, this is not a financially attractive innovation. The alternatives would certainly include having a less highly skilled person doing the discharge planning and seeing if the process could be streamlined, so that less time would be needed.
14.11. The current cost function for a lab that evaluates Pap smears is C = 200,000 + 25 Q. Q, the annual volume of tests, is forecast to be 30,000. The incremental cost is $25 because each evaluation requires $20 worth of a technician’s time and $5 worth of supplies. Calculate the average cost of an evaluation. Average cost is $31.67 for the current system.
14.12. You are comparing replacement of the current lab, which has a cost function of C = 200,000 + 25 Q, with an automated lab that has a cost function of C = 300,000 + 20 Q. Doing so would reduce the error rate from 1.5 percent to 1 percent. Your volume is expected to be 18,000 tests per year. Should you choose the automated lab? Briefly explain your logic. At a volume of 18,000, total and average cost are higher for the automated system, which has higher fixed costs and lower incremental costs than the current system. Average cost is $36.67 for the automated system and $36.11 for the current system. So, for this level of volume, choose the current system.
14.13. The expected cost of Betazine therapy is $544. It is effective 57 percent of the time, with a 6 percent chance of an adverse drug reaction. The following table shows data for Alphazine, a new treatment. Estimate the rate of adverse drug reaction and the expected cost of treatment. Use Excel to construct a decision tree for this problem. Should you choose Alphazine or Betazine?
Probability Cost Effective 63% Adverse Drug Reaction 5% $700 No Adverse Drug Reaction 95% $500 Ineffective 37% Adverse Drug Reaction 5% $800 No Adverse Drug Reaction 95% $600
Probability Cost
5% 3.2% $700
ADR
63%
Effective

Economics for Healthcare Managers, Third Edition – Instructor’s Manual 82
Copyright 2015 Health Administration Press
95% 59.9% $500
No ADR
5% 1.9% $800
ADR
37%
Ineffective
95% 35.2% $600
No ADR
The expected cost for Alphazine is $547 = 3.2% $700 + 59.9% $500 + 1.9% 800 + 35.2% $600. Alphazine costs more but is more effective, and it has a lower incidence of side effects. Because the expected cost difference is so small, one could reasonably choose Alphazine without doing a cost–benefit analysis or a cost–utility analysis.
Case 14.1: Teledermatology Discussion questions: • Does Shea’s point about patients’ costs make sense? Yes, ignoring patients’ costs omits a
major part of the picture. • Which perspective on costs looks more like a societal perspective to you? Shea’s does. • Would using telemedicine equipment mean giving up face-to-face dermatologist visits? No. • What would be the advantage, if any, of being able to serve patients in the western half of the
state? It would increase the pool of potential customers and improve care for people who have difficulty accessing it now.
• What would be the advantage, if any, of being able to offer telemedicine group visits? The costs would be lower, so taking more time would be feasible.
• What is your assessment of the promise of telemedicine for this practice? This has the potential to significantly expand the size of the practice.

Economics for Healthcare Managers, Third Edition – Instructor’s Manual 83
Copyright 2015 Health Administration Press
Chapter 15: Profits, Market Structure, and Market Power Key Concepts If the demand for its products is not perfectly elastic, a firm has some market power.
Most healthcare providers have some market power because their rivals’ products are not perfect substitutes.
Having fewer rivals increases market power.
Firms with no rivals are called monopolists.
Firms with only a few rivals are called oligopolists.
More market power allows larger markups over marginal cost.
Barriers to entry increase market power.
Regulation is often a source of market power.
Product differentiation and advertising can also be sources of market power.
Solved Exercises 15.1. What does it mean to have market power? Are firms with market power extremely
profitable? A firm with market power competes with firms whose products are imperfect substitutes. Having market power means that the demand for the firm’s products is “not very” elastic, so the firm can build significant markups over marginal cost into its prices. If, because of fixed costs, marginal cost is enough less than average cost, even very large markups over marginal cost will not result in adequate profits.
15.2. Can you identify a healthcare firm with market power? What characteristics led you to choose the firm that you did? Virtually every healthcare firm has some market power. The key question is whether other firms’ products are perfect substitutes.
15.3. Why would a merger reduce costs? Why would a merger increase markups? Why do many mergers fail nonetheless? A merger could reduce costs if some overhead services (e.g., information technology or accounting) could be shared. Mergers can also make it profitable to rationalize the merged firm’s mix of output. If two hospitals merge, for example, only one might staff a 24-hour emergency room. A merger also increases market share, thus making it possible for the merged firm to raise prices (effectively the merged firm faces less elastic demand than the two firms that merged). Many mergers fail because managers fail to implement the service rationalizations that sparked interest in the merger. Mergers often fail because the cultures of the two merging organizations do not fit well.
15.4. What information would you like to have when planning advertising spending? You need to know the marginal cost of producing the product, its price, the marginal cost of producing advertising, and the marginal increase in sales that advertising generates.

Economics for Healthcare Managers, Third Edition – Instructor’s Manual 84
Copyright 2015 Health Administration Press
15.5. Why might banning advertising drive up prices? If banning advertising makes demand less elastic (because consumers find it harder to compare features and prices), firms will have an incentive to increase markups.
15.6. Offer examples of attribute-based product differentiation and information-based product differentiation. Many examples are possible. Single-port cholecystectomy is gall bladder surgery that uses only one entry point (usually the navel) rather than the several entry points of standard laparoscopic surgery. As a result, patients should have less scarring, less postoperative pain, less blood loss, faster recovery time, and fewer complications. This is attribute-based product differentiation, which should offer different outcomes to patients. In contrast, the difference between a brand name of ibuprofen and a generic brand will largely be one of familiarity. Nonetheless, some people will pay a premium to get the brand name. Usually branded products advertise to maintain this familiarity and perception of higher quality. This is an example of information-based product differentiation.
15.7. Two physical therapy firms want to merge. The price elasticity of demand for physical therapy is -0.40. Firm A has a volume of 10,400, fixed costs of $50,000, marginal costs of $20, and a market share of 12 percent. Firm B has a volume of 15,600, fixed costs of $60,000, marginal costs of $20, and a market share of 12 percent. The merged firm has a volume of 26,000, fixed costs of $100,000, marginal costs of $20, and a market share of 20 percent.
a. What are the total costs, prices, revenues, and profits for each firm and for the merged firm? See the table below.
b. How does the merger affect markups and profits? As you can see in the table below, the merged firms are much more profitable. The main reason is the higher markup that the firms can set. Though the firms were able to realize some cost savings, this was a minor part of the higher profits.
Q MC FC TC Share ε Price Revenue Profit APT 10,400 $20 $50,000 $258,000 8% -5.00 $25.00 $260,000 $2,000 BPT 15,600 $20 $60,000 $372,000 12% -3.33 $28.57 $445,714 $73,714 Merged 26,000 $20 $100,000 $620,000 20% -2.00 $40.00 $1,040,000 $420,000
15.8. A local hospital offered to buy Firm A in Exercise 15.7 for $5,000, and the offer was refused. However, many observers now perceive that Firm A is “in play” and may be sold if the right offer comes along.
a. In successful transactions, purchasers have typically paid 10 times current profits. How much would Firm A be worth to a buyer from outside the industry? Ten times current profits would be $20,000, so that seems like a reasonable estimate.
b. Would you expect that Firm B would be willing to pay more or less than an outside buyer? Firm B should be willing to pay substantially more than an outside buyer, since Firm B could increase profits from $73,714 to $420,000 by doing so.

Economics for Healthcare Managers, Third Edition – Instructor’s Manual 85
Copyright 2015 Health Administration Press
c. What is the most Firm B would be willing to pay for Firm A? Using the 10 times current profits rule, Firm B should be willing to pay as much as $3,462,860. Acquiring Firm A would increase annual profits by $346,286.
15.9. Two clinics want to merge. The price elasticity of demand is -0.20, and each clinic has fixed costs of $60,000. One clinic has a volume of 7,200, marginal costs of $60, and a market share of 2 percent. The other clinic has a volume of 10,800, marginal costs of $60, and a market share of 4 percent. The merged firm would have a volume of 18,000, fixed costs of $80,000, marginal costs of $60, and a market share of 6 percent.
a. What are the total costs, revenues, and profits for each clinic and the merged firm? See the table below.
b. How does the merger affect markups and profits? The merger more than doubles markups and more than quadruples profits.
Q MC FC TC Share Elasticity Price Revenue Profit Clinic 1 7,200 $60 $60,000 $492,000 2% -10.00 $66.67 $480,000 -$12,000 Clinic 2 10,800 $60 $60,000 $708,000 4% -5.00 $75.00 $810,000 $102,000 Merged 18,000 $60 $80,000 $1,160,000 6% -3.33 $85.71 $1,542,857 $382,857
15.10. What would each of the clinics in Exercise 15.9 be worth to an outside buyer (using the guideline of 10 times annual profits)? What would each of the clinics be worth to each other? Clinic 1 would be worthless to an outside buyer, and Clinic 2 would be worth just over $1 million. Clinic 1 would be worth $2.8 million to Clinic 2, and Clinic 2 would be worth $3.9 million to Clinic 1.
15.11. A hospital anticipates that spending $100,000 on an advertising campaign will increase bed days by 1,000. The marketing department anticipates that each additional bed day will yield $2,000 in additional revenue and will increase costs by $1,200. Should the hospital proceed with the advertising campaign? Yes, the additional bed days will generate $2 million in new revenue and will required $1.2 million in new production costs. Subtracting the new production costs and the costs of the advertising campaign from $2 million gives a forecast that the advertising campaign will increase profits by $800,000.
15.12. A clinic is considering reducing its advertising budget by $20,000. The clinic forecasts that visits will drop by 100 as a result. Costs are $140 per visit and revenues are $180 per visit. Should the clinic reduce its advertising budget? Costs will drop by $34,000 = $20,000 + ($140 100). Revenues will drop by $18,000 = $180 100. So profits will go up by $16,000. The clinic should reduce its advertising budget.
15.13. The price elasticity of demand for dental services is -0.25. In a market with 100 dentists, the local dental society demanded and got an 8 percent increase in prices from the dominant dental insurance company. What should happen to the dentists’ revenues and profits? (Assume that average cost equal marginal cost.) Would this agreement be stable? Explain. We can forecast that the quantity demanded will drop by about 2 percent (=

Economics for Healthcare Managers, Third Edition – Instructor’s Manual 86
Copyright 2015 Health Administration Press
0.08 -0.25). As a result, revenues will increase by about 6 percent (= 8% - 2%). Costs should fall, because the quantity demanded has fallen. Lower costs and higher revenues mean that profits will increase, but the agreement will not be stable. Each dentist faces a price elasticity of demand on the order of -25 (=-0.25/0.01), and will increase revenues by cutting prices. Even if individual dentists have larger shares of smaller local markets, they have an incentive to cut prices.
15.14. The marginal cost of a physician visit is $40. In a county with 50 physicians, the local medical society negotiated a rate of $90. Previously, any physician who offered discounts to an insurer or a patient could be cited for unethical behavior, be expelled from the medical society, and lose admitting privileges to the county’s sole hospital. But having lost an antitrust lawsuit, the medical society has agreed to stop enforcing its prohibitions against discounting, to allow any physician with a valid license to be a member of the medical society, and to stop linking admitting privileges to medical society membership.
a. The price elasticity of demand for physician’s services is -0.18. What price maximizes profits for the individual physicians in the county? Each physician has a 2 percent market share, so the profit-maximizing price is $45. Marginal cost is $40, each physician faces a price elasticity of -9 = -0.18/0.02, and the markup is 1.125 = (-9/(1-9).
b. If all the physicians act independently, will their incomes go up or down? Their incomes will go down. A 50 percent price cut will result in a 9 percent increase in visits, implying that total revenue will drop by 45.5 percent = -50% + 9% - 50% 9%.
c. Is there any way that the physicians could legally act to sustain a price of $90? If the physicians formed 10 groups, each with a 10 percent market share, the profit-maximizing price would be $90. The calculation is that the groups face price elasticities of -1.80 = -0.18/0.1. For an elasticity of -1.80 the profit-maximizing price is $90 = -$40 1.80/(1 - 1.80).
Case 15.1: Deregulating Pharmaceutical Advertising Discussion questions: • How could advertising be a barrier to entry? Existing firms can spend heavily on advertising;
new firms may find it hard to do so. Using advertising to differentiate your product is called the market power theory of advertising.
• Could advertising reduce barriers to entry for a new product? Almost by definition, consumers will be unfamiliar with a new product that is cheaper or better. Being able to advertise innovative products is important to gain market share.
• Presumably drug companies are trying to differentiate their products from the competition. Will consumers be better off or worse off if the companies succeed? The answer to this is not clear, as the answers to the first two questions indicate. There is some limited evidence that advertising does alert consumers to treatments that might be better for them. Some of the concerns are that consumers may be fooled by advertisements for new, expensive drugs that are not innovative. Much of this is addressed by insurance plans that encourage patients to

Economics for Healthcare Managers, Third Edition – Instructor’s Manual 87
Copyright 2015 Health Administration Press
start with inexpensive drugs and move to newer, more expensive drugs only if the cheaper ones are found wanting.
• Consumers generally favor direct-to-consumer advertising, and healthcare professionals generally oppose it. Does this difference in attitudes make sense? It does, as direct-to-consumer advertising puts professionals in a bind. If a patient asks for a drug that is not appropriate, the professional either prescribes a drug that she would prefer not to or spends uncompensated time trying to steer the consumer toward another choice.

Economics for Healthcare Managers, Third Edition – Instructor’s Manual 88
Copyright 2015 Health Administration Press
Chapter 16: Government Intervention in Healthcare Markets Key Concepts Given the right conditions, competitive markets can produce optimal outcomes.
Markets organize vast amounts of information about costs and preferences.
Perfectly competitive markets lead to efficient production and consumption.
Markets are dynamically efficient.
Most markets are imperfect.
Markets may be inefficient when externalities or public goods are present.
Markets may be inefficient when competition or information is imperfect.
Efficient market outcomes may not be equitable.
Clear assignment of property rights may improve market outcomes.
Taxes or subsidies may improve the efficiency of some markets.
Public provision of some products may be efficient.
Solved Exercises 16.1. Global warming is a classic example of a public good. Analyze this comment and explain
your answer. This is almost certainly true, although the regional effects of global warming vary considerably. Any reduction in global warming will affect everyone in the community, and it is hard to imagine how or why someone would be excluded from the benefits of reduced global warming.
16.2. The existence of market failure does not signal what should be done in response. Analyze this comment and explain your answer. The existence of market failure just tells us that market outcomes will not be ideal. Some responses by governments may yield better outcomes than imperfect markets; some responses by governments may yield worse outcomes.
16.3. Imperfect competition is the norm, so healthcare markets cannot work. Analyze this comment and explain your answer. Most healthcare providers have some market power, so healthcare markets are unlikely to work perfectly. Will they work better or worse than the alternatives? We do not know. That depends on the market and the alternatives.
16.4. Markets work; governments do not. Analyze this comment and explain your answer. This is clearly too strong. In most countries the government plays a major role in some parts of healthcare. At a minimum, governments finance some public health activities, and most governments are heavily involved in provision of acute medical care.
16.5. Are market forces strong enough to deliver efficient healthcare? Please explain your

Economics for Healthcare Managers, Third Edition – Instructor’s Manual 89
Copyright 2015 Health Administration Press
answer. There is no clear right answer to this question, although the worldwide pattern of major government roles in healthcare suggests that the answer cannot be an unqualified “yes.” Perhaps a better question would be, “Are there contexts in which market forces are strong enough to deliver efficient healthcare? If so, what are those contexts?”
16.6. For each scenario, assess whether an externality is present. a. Vaccinating children against influenza reduces its incidence among the elderly. This
is a classic example of an externality. The benefits of vaccination partly accrue to people who have not been vaccinated.
b. Newly graduated nurses flock to teaching hospitals for training. After working for a year, many leave to work for competitors. This training activity is likely to be reflected in the wages that newly graduated nurses get in teaching hospitals. If so, there would be no externality.
c. A couple who planned to move to Florida to retire find that the plummeting housing market has wiped out their equity. There really is no externality here. Market prices are correctly conveying information about value.
d. Physicians complain that they spend a third of their time explaining to patients why television advertisements about medications for their conditions do not apply to them. The medication ads increase costs for physicians. This is a classic example of an externality.
16.7. The supply of measles vaccine is given by Q = 450 P. The demand for measles vaccine is given by 20,000 - 50 P. a. What is the market equilibrium price and quantity? In equilibrium Q = 450 P =
20,000 - 50 x P. This implies a market equilibrium of P = $40 and Q = 18,000. b. The demand curve implies that private willingness to pay is P = 400 - Q/50. However,
external benefits are associated with each measles vaccination, so the social demand curve is Q = 20,000 - 50 (P - 5). What is the equilibrium price and quantity if these external benefits are considered? In equilibrium Q = 450 P = 20,250 - 50 P. The equilibrium price will be $40.50, and the equilibrium quantity will be 18,225. Both of these are slightly higher than the market equilibrium.
c. Propose an intervention that will result in this equilibrium volume. A subsidy for consumers could work. For 18,225 to be demanded, the price would have to be $35.50. So a subsidy for consumers of $5 = $40.50 - $35.50 would be needed.
16.8. The supply of an antibiotic is Q = 30 P - 200. The demand for it is Q = 8,800 - 20 P. a. What is the market equilibrium price and quantity? In equilibrium Q = 30 P - 200 =
8,800 - 20 P. This implies a market equilibrium of P = $180 and Q = 5,200. b. Use of the antibiotic creates $20 in external costs due to water pollution. Would the
market outcome be different if a $20 tax were levied on producers instead? No, the outcome would be the same. The equilibrium of 30 (P - 20) - 200 = 8,800 - 20 P is P = $172 and Q = 4,960.
16.9. Vaccination schedules are predictable, meaning that insurance coverage for vaccinations does not protect consumers against risks. Insurance coverage for vaccinations drives up costs because more people get vaccinated if coverage is available and because insurers
Economics for Healthcare Managers, Third Edition – Instructor’s Manual 90
Copyright 2015 Health Administration Press
have overhead costs. Does insurance coverage for vaccines do anything useful? Explain your answer. Insurance coverage for vaccinations is not about insurance. There are two reasons for insurers to provide coverage nonetheless. First, there may be external effects of vaccinations, in that one person’s vaccination reduces the chance of others becoming infected. A subsidy would be appropriate in this case. Second, imperfectly informed consumers may use insurance coverage as a signal of what to do. That is, a consumer may not have a clear sense of the advantages and disadvantages of being vaccinated, but the insurance subsidy provides a simple message that it is a sensible course.
16.10. About two-thirds of funding for substance abuse treatment comes from taxpayers. Does substance abuse treatment have external benefits that warrant this level of public funding? Examples of the external benefits of reducing substance abuse include fewer injuries to innocent victims when the number of impaired drivers is reduced, less crime when the number of addicts is reduced, and reductions in the trauma for family, friends, neighbors, and bystanders when impaired behavior is reduced.
16.11. Provide examples of the following types of government intervention in healthcare: a. Government production. The NIH conducts intramural research. b. Subsidies for products. Free vaccinations at health departments. c. Taxes on products. Cigarette taxes. d. Price regulation. Medicare-allowed fees. e. Quality regulation. State surveys of nursing homes. f. Inaction. Failure to address climate change.
16.12. Provide healthcare examples of the following types of market failure: a. External benefits. Vaccination is a classic example. Some of the benefits of
vaccination arise because diseases become less transmissible. b. External costs. Secondhand smoke appears to harm the health of nonsmokers. c. Public goods. Clean air and information are often public goods. d. Imperfect competition. Many towns have only one hospital. e. Imperfect information. People who want to buy insurance know more about their
health status than insurers do. As a result, some healthy people have trouble buying coverage at reasonable rates.
16.13. Private foundations support medical research. Doesn’t their support prove that tax funding of medical research is unnecessary? Please explain. No, it proves nothing. The tax law provisions that make private foundations possible are one approach to funding research. Furthermore, there is no guarantee that private foundations will be able to support the right amount of research.
16.14. Public health information can be broadcast at a cost of $100. Public health information is a pure public good, in that many people can use the information simultaneously and preventing people from using the information is very difficult. One group of residents has a demand curves for public health information of the form Q = 50 - P. Here Q is the number of public health broadcasts per month and P is the price per broadcast. Another group has a demand curve of Q = 140 - P.
Economics for Healthcare Managers, Third Edition – Instructor’s Manual 91
Copyright 2015 Health Administration Press
a. At a price of $100 per broadcast, how many broadcasts per month will be demanded? (Add the quantities demanded by each group.) At a price of $100, the first group will demand 0 broadcasts (50 - P equals 0 for any price larger than $50) and the other group will demand 40 broadcasts (140 - P equals 40 when P equals $100). So market demand will be 80.
b. What is the total willingness to pay for 85 broadcasts? (Recast the demand curve to reveal willingness to pay and add the amounts for the two groups. For one group, willingness to pay equals 50 - Q. For the other, it equals 140 - Q. For both groups the minimum is $0.) At a quantity of 85, total willingness to pay equals 10,000 (0) + 2 (140 - 85) = $110, indicating that willingness to pay still exceeds cost at a quantity of 85. Because consumption is non-rival, we add the willingness to pay of everyone in the community to calculate the marginal benefit at each level of output.
c. At what level of output does willingness to pay equal $100? At outputs over 50, willingness to pay equals 2 (140 - Q). So willingness to pay equals $100 when Q equals 90.
d. What do these results imply? If everyone acts independently, too few broadcasts will be provided. For a public good like this, some mechanism for summing the willingness to pay of all potential beneficiaries is needed to prevent this.
16.15. Every 1 percent reduction in the level of particulates in the air costs $200,000. Low-income residents in a region have a demand for particulate reduction of R = 10 - P (R is the level of particulate reduction and P is the price per 1 percent reduction). High-income residents have a demand for particulate reduction of R = 40 - 2P. a. Is reduction of the level of particulates a public or private good? Clean air in a city
can be consumed by many people simultaneously, and it would be almost impossible to prevent someone from benefiting from it. Cleaner air is a public good.
b. What will the market demand for particulate reduction be? No reduction will be demanded privately. No individual’s willingness to pay approaches $200,000.
c. What is the optimal level of particulate reduction? A 39 percent reduction in particulates will be optimal. At this level, willingness to pay will equal $200,000, since 600,000 0 + 400,000 (20 - 0.5 R) = $200,000 when R = 39. We have solved this problem by adding the willingness to pay of 600,000 low-income people (P = 10 - R) and 400,000 high-income people (P = 20 - 0.5 R).
16.16. Few orthopedic surgeons publish data describing their surgical volumes, infection rates, mortality rates, functional gain rates, or customer satisfaction rates. a. How much would a regulation requiring publication of such data cost? The regulation
itself would not cost much. The costs would be felt by surgeons who have to compile the data and by the organization that publishes it.
b. Would such a regulation improve the workings of the market? It should, although there is no guarantee that it will. Better information can improve patient decision making and may create incentives for quality improvement. If surgeons and patients are unable or unwilling to react to the information, the information may not lead to better market outcomes.
Economics for Healthcare Managers, Third Edition – Instructor’s Manual 92
Copyright 2015 Health Administration Press
c. Would such a regulation be an appropriate government activity? Information should be a public good, because the cost of supplying it to one more person is very close to $0 and consumption need not be rival. So this could well be an appropriate role for government.
d. Do we need a regulation requiring publication of data for surgeons if private physician rating firms already exist? If the market produces too little information, there could still be a good case for intervention.
Case 16.1: Setting Prices for Walkers Discussion questions: • What are the risks of a bidding process like the one described in this case? Most of the risks
are political, in that pushing for bidding will run into vigorous opposition from retailers, wholesalers, and manufacturers with little payoff from consumers.
• Why would elected representatives side with the manufacturers and retailers on this issue? Manufacturers and retailers care a lot about their prices, and they will support representatives who support them.
• Suppose that Medicare sought bids for enough cardiac care to serve beneficiaries in your hometown. What would happen economically and politically? Could you design a way of insulating Medicare from political pressure? Would you want to? In essence Medicare would be ending the cardiac services of the losing bidders. This would create hard-to-see gains and easy-to-see losses, as people getting better, cheaper cardiac care would be invisible and people losing their jobs as cardiac programs close would be highly visible. There are a couple of ways to limit political pressure. One is to rely on hard-to-follow bureaucratic procedures that are difficult to explain in the political arena. Ask yourself: Do you understand the basis for changes in the Medicare fee schedule? Do you care? Another way is to create a mechanism in advance that would make it harder for Congress to overturn a decision. That would allow members of Congress to complain but to no effect unless the decision really had no support.
• What problems other than paying too much might distorted fee schedules cause? If a product is much more profitable than alternatives, it will tend to be overused. Since there are harms associated with all medical interventions, this will increase the harms more than the benefits.
Case 16.2: To Vaccinate or Not Discussion questions: • What are the external effects of a vaccine? Unvaccinated people are afforded some
protection by vaccinated people. • Would too few people be vaccinated if it were not mandatory? What evidence supports your
conclusion? Each individual bears all of the costs of his or her vaccination, but some of the benefits go to others, some of whom cannot be vaccinated because they are too young or have a compromised immune system. At one time, pertussis afflicted more than 250,000 American children yearly, killing 9,000. Vaccinations reduced that to just 1,000 new cases

Economics for Healthcare Managers, Third Edition – Instructor’s Manual 93
Copyright 2015 Health Administration Press
annually by 1976; but by 2008, cases had soared to more than 10,000 annually because many people were opting out.
• What steps do governments take to increase vaccination rates? Many require vaccination for school entry. Some launch advertising campaigns. Many subsidize vaccinations.
• What steps do private companies take to increase vaccination rates? Why? They require vaccinations in some cases and often subsidize them. Preventable illnesses can significantly reduce productivity. In healthcare, ill workers can infect patients.
Case 16.3: Diagnosing Chest Pains Discussion questions: After reading this case, would you be more or less willing to have a CT scan done if an
emergency room physician recommended it? How confident would you be that your choice was a good one? This is a question about opinions, so no right answer exists.
Had the woman asked her physicians what the alternatives were, they probably would have discussed a stress test. Would you expect a patient who fears that she is having a heart attack to ask for alternatives? Explain your logic. This is a question about opinions, so no right answer exists.
Emergency department staff are unlikely to know the list prices or allowed fees for a CT scan. How can consumers make good choices without information about price? Obviously consumers cannot make good choices without information about alternatives and prices.
Do you think hospitals should be required to provide an estimate of the cost of procedures before a patient chooses to have one done? Explain your logic. This is a question about opinions, so no right answer exists.
Do you think information about prices would have influenced the patient’s decision or the physicians’ recommendations? I find it hard to believe that a patient would have agreed to $17,000 worth of treatment without further consultation. In most other fields it would be considered unprofessional to suggest a course of action without some idea of cost.

Economics for Healthcare Managers, Third Edition – Instructor’s Manual 94
Copyright 2015 Health Administration Press
Chapter 17: Regulation Key Concepts Healthcare is extensively regulated.
Regulation can make or break an organization (or its competitors).
The objective of regulation is consumer protection.
The rationale for consumer protection regulations is consumer ignorance.
Legislation and regulation reflect interest group politics.
When markets are imperfect, regulation cannot always improve outcomes.
Providers are likely to “capture” the regulatory process.
Market responses to consumer ignorance can limit the need for regulation.
Solved Exercises 17.1. Why are many consumers apt to be rationally ignorant about their options? Because the
probability of using information is so low, the expected benefit of information about many illnesses will be lower than the expected cost of getting information.
17.2. Why would insurance coverage tend to increase rational ignorance? Because insurance pays much of the cost of treatment, consumers’ incentives to find the least expensive source of treatment or the least expensive type of treatment are muted.
17.3. A proposal has been advanced to limit advertising of pharmaceutical prices to prevent unfair pricing by national chains. You estimate that limits on price advertising will change the price elasticity of demand from -5.63 to -4.43. The marginal cost of a typical prescription is $40. A typical small pharmacy fills 25 prescriptions per day. A typical consumer fills 20 prescriptions per year. What economic effects will the limit have on consumers and pharmacists? Which group is likely to be the more effective advocate for its position? If demand becomes less elastic, pharmacists will find it advantageous to raise prices. The profit-maximizing price will rise from $48.64 to $51.66. This will increase pharmacists’ profits from $67,387 to $90,962, a gain of $23,575. Individual consumers will have to pay these higher prices, so the typical consumer’s spending on pharmaceuticals will rise from $973 to $1,033, an increase of $60. Individuals who stand to gain $23,575 are likely to be more effective advocates for their position than individuals who stand to lose $60.
Elasticity MC Price Quantity Profit
Pharmacists’ calculations -5.63 40 $48.64 7,800 $67,387
-4.43 40 $51.66 7,800 $90,962
$23,575

Economics for Healthcare Managers, Third Edition – Instructor’s Manual 95
Copyright 2015 Health Administration Press
Price Quantity Spending
Consumers’ calculations $48.64 20 $973
$51.66 20 $1,033
$60
17.4. Prices for a medical procedure average $1,000 and range from $800 to $1,200. How much could a consumer paying full price save by getting the best price? Suppose that insurance is responsible for 75 percent of the consumer’s spending and that out of-pocket spending is limited to $250. How much could the consumer save by getting the best price? A consumer could save $400 by paying $800 rather than $1,200. If out-of-pocket spending were 25 percent of the total (up to a maximum of $250), a consumer would save only $50 by getting the best price. Although many people would be willing to do some research to save $50, for many people careful price shopping might not be a good investment. Such a person would be rationally ignorant about the price of the procedure. Insurance reduces the incentive to invest resources in finding the best price, so it increases incentives to be rationally ignorant.
17.5. Why are many economists opposed to licensure of medical facilities and personnel? There are three reasons. First, certification, which provides information about the training and skills of providers, addresses the rational ignorance of consumers about as well as licensure. Second, by prohibiting some mutually beneficial transactions (e.g., dental cleaning by independent hygienists), licensure tends to reduce consumer well-being in ways that certification does not. Third, the interest group model of regulation predicts that licensure will regularly be used to advance the interests of the regulated group, not the interests of consumers.
17.6. Identify circumstances in which both public and private regulation are present. Which serves consumers better? Why? There are multiple examples of this in healthcare. One example would be medical licensure, which is public regulation, and hospital privileges, which is a form of private regulation. Medical licensure allows unlimited privileges to anyone with a valid license in a state. In principle, a license would let a physician who completed general practice training 40 years ago and has never done any surgery before perform brain surgery. Because hospitals are at risk for negligent acts of physicians who practice in them, hospital privileges restrict the practices of physicians to areas in which they can demonstrate competence.
17.7. Find out who is on the board of the licensing agency for one of the health professions for your state. Does the board include more members of the profession being regulated or more consumers? There are many answers to this question, but in most cases representatives of the profession will outnumber representatives of the public. A website that allows you to easily visit a number of medical licensing boards is http://www.docboard.org/.
17.8. To reduce the costs of resolving insurance disputes, the area’s insurers have required that customers use arbitration. Arbitrators are required to be knowledgeable about medicine

Economics for Healthcare Managers, Third Edition – Instructor’s Manual 96
Copyright 2015 Health Administration Press
and insurance contracts. Why might you anticipate that the arbitration mechanism would wind up favoring the interests of the insurers? Arbitrators are likely to be drawn from the insurance or medical fields. They may know many people in the health insurance field and are apt to be sympathetic to the perspective of insurers. In addition, the next job of many arbitrators may well be in the insurance industry. Coming to favor the industry position would not be a surprise.
17.9. How might the Food and Drug Administration be subject to capture? Who would be likely to capture the agency? Pharmaceutical firms would benefit from capturing the Food and Drug Administration. Employees may be drawn from the pharmaceutical industry, and former Food and Drug Administration employees are likely to be valuable to pharmaceutical firms. Because the stakes are high, pharmaceutical firms will be sure to try to influence the decision making process on an ongoing basis. This influence may be applied directly to employees or indirectly via legislators or citizens. The easy thing to do would be for Food and Drug Administration employees to become sympathetic to the industry.
17.10. Hospital privileges usually restrict what physicians can do. Medical licenses do not. What drives this difference? A state licensing board grants licenses, while the credentialing committee of a hospital grants privileges. The key difference is that hospitals are increasingly at risk for the acts or omissions of independent contractor physicians. So, if a hospital permits a physician to practice in ways that are unsafe, the hospital is liable for any resulting harm.
17.11. Consumers Union, the Leapfrog Group, and the Department of Health and Human Services have websites that provide consumer information about hospitals. Why are multiple sources of information available? Which of these sources did you find the most interesting? This question has no right answer.
17.12. Give an example of a healthcare product that is financed by the government but produced by private firms. Can you explain why this arrangement exists? Two examples are obvious. One is that much of Medicare is actually operated by private firms that contract with the government. The other is that, although government employees conduct some research, the government funds far more research that is carried out by outside organizations. There are two complementary reasons for this. One is that the externalities are primarily about financing. That is, funding for insurance and research will be inadequate because there are significant external benefits associated with each. The other reason is that it may be more efficient to contract with private firms because they can be expected to compete for the work and will have lower costs.
Case 17.1: Monks, Caskets, and the Supreme Court Discussion questions: • Why were funeral directors so opposed to the monks making caskets? It appears that the low
prices charged by the monks threatened very profitable sales. • Why would licensing casket makers be a good idea? Given that there were no standards for
Economics for Healthcare Managers, Third Edition – Instructor’s Manual 97
Copyright 2015 Health Administration Press
coffins and there appear to be no genuine safety issues, licensure only appears to be a good idea if you are competing in the casket market.
• In medicine, licensure and certification coexist. Is this true in any other fields? It is. Teachers, appraisers, counselors, and other professionals may need both credentials.
• How do licensure and certification differ in their protections for ill-informed consumers? In medicine, at least, certification appears to offer better protection; certification generally has higher standards for continuing education than licensure. As this case illustrates, interest groups can use licensure to try to limit competition. It is difficult to do this with certification.
Case 17.2: Self-Regulation Discussion questions: • Who sits on your state’s board that regulates pharmacy, medicine, and dentistry? Does the
board contain any consumer representatives? Are members of the regulated profession a majority of the board?
• Could such boards function without representatives of the profession? Realistically, could a licensing board not be dominated by the profession in question? A board would certainly need representatives of the profession in order to regulate the profession effectively. A board with a majority of consumer representatives and adequate staff support might be harder for the profession to capture. But it is important to understand that, when it comes to professional regulation, the interests of the profession are more intense than the interests of the public at large and the interests of the profession do not fade.
• How would consumers be hurt if your state stopped licensing pharmacists and started certifying them instead? How would these two systems differ? Is this scenario an example of a result of regulatory capture? Can you suggest a strategy that would ensure that the licensing board would serve the public interest? The two systems would differ primarily in that uncertified practice would not be a crime, but misrepresenting one’s certification would be. A common criticism is that state boards are much more enthusiastic about punishing unlicensed providers whose work overlaps with licensed providers than incompetent or unethical licensees.
• Suppose your state stopped licensing pharmacists. Would hospitals replace high-paid pharmacists with untrained or minimally trained personnel? Would retail pharmacies replace high-paid pharmacists with untrained or minimally trained personnel? Explain your answers. Hospitals almost certainly would not replace pharmacists, because hospitals rely on pharmacists’ analyses and compounding skills to care for very ill patients. Retail pharmacies might well increase the number of minimally trained personnel (as mail order pharmacies have done) because a significant share of retail work is routine.
Case 17.3: Changing Consumer Information Discussion questions: • What evidence can you find that report cards have improved quality? A number of studies
have found that report cards have improved quality. For example, Chou et al., 2014, “Competition and the Impact of Online Hospital Report Cards,” Journal of Health

Economics for Healthcare Managers, Third Edition – Instructor’s Manual 98
Copyright 2015 Health Administration Press
Economics, show that hospitals improved care in response to CABG report cards. Likewise, Ayanian et al., 2013,“Medicare Beneficiaries More Likely to Receive Appropriate Ambulatory Services in HMOs Than in Traditional Medicare,” Health Affairs, showed Medicare Advantage beneficiaries were more likely to receive appropriate ambulatory services than beneficiaries in traditional Medicare. Medicare Advantage uses sophisticated report cards to describe insurance plans and their networks of providers.
• By what mechanisms could report cards improve reported market outcomes? Improvement can come through weeding out poor performers, by steering patients to superior performers, and by increasing the rewards to improved quality (so most providers improve).
• Does the scarcity of scientific evidence on the effectiveness of report cards matter? • Could publication of performance data be advantageous to hospitals or physicians? It
rewards high-quality performers and may let them charge higher prices. • How do report cards address information asymmetries? Would reducing information
asymmetries guarantee better markets? Report cards pull information together so that the information asymmetries are smaller. They also tend to increase information to providers, who may lack reliable evidence about quality as well. There is no guarantee that report cards will improve outcomes, but most of the evidence seems to suggest that they do.
• Does it matter whether report cards are produced by governments or private organizations? The key question is whether the information gathered is complete and credible. Governments have an advantage in completeness, because they can require or incentivize provision of information. Like some private organizations, governments can be susceptible to political power, so it is not clear who would do the better job.
• Why are a few patient switches enough to influence market outcomes? Most healthcare providers have significant fixed costs, so modest changes in volume can have larger effects on profits.

Economics for Healthcare Managers, Third Edition – Instructor’s Manual 99
Copyright 2015 Health Administration Press
Chapter 18: Behavioral Economics Key Concepts Brainpower and time are scarce resources, so shortcuts in decision making make sense.
Some shortcuts result in poor decisions.
Some decisions appear to reveal inconsistent preferences.
Status quo bias means that some people tend to avoid even beneficial changes.
Overconfidence often leads to poor decisions.
Problematic shortcuts include availability, anchoring, confirmation, and hindsight bias.
Awareness of framing bias is especially important in management.
Changes in how choices are set up can improve decision making.
Solved Exercises 18.1. You will receive a $10,000 insurance payment in two months. If you are willing to pay
for expedited handling, you can be paid in one month. Would you be willing to pay $50? $100? $200? More? There are no wrong answers to this question. The key is whether answers to this question and 18.2 are similar.
18.2. You will receive a $20,000 insurance payment in 12 months. If you are willing to accept a reduced payment, you can be paid in 11 months. Would you be willing to accept $19,800? $19,500? $19,000? Less?
18.3. What annual interest rate is implied by your answer to Exercise 18.1? You calculate this by dividing $10,000 by the difference of $10,000 and the amount you are willing to pay for expedited handling, then taking this the result to the 12th power and subtracting 1. For example, if you were willing to pay $100, the result would be ($10,000/$9,900)12 - 1 = 0.1281781, or 12 percent. For $50 the implied interest rate is 6.2 percent. For $150 it is 19.9 percent. For $200 it is 27.4 percent, for $250 it is 35.5 percent, for $300 it is 44.1 percent, and for $350 it is 53.3 percent. Use Excel to calculate the interest rate for other amounts.
18.4. What annual interest rate is implied by your answer to Exercise 18.2? Is it the same as the rate in Exercise 18.3? Why would this matter? If the rates differ, you are at risk for making inconsistent decisions. You are discounting future events at different rates depending on how far in the future they are.
18.5. How are Exercises 18.1 and 18.2 different? How are your answers to them different? The main difference is that 18.1 looks at a choice in one month and 18.2 looks at a choice in 11 months. If discount rates decline over time, the answers to these questions may differ.
Economics for Healthcare Managers, Third Edition – Instructor’s Manual 100
Copyright 2015 Health Administration Press
A more subtle difference is that 18.1 asks you to pay more or less, but 18.2 asks you to accept more or less.
18.6. How could you use behavioral economics to increase the number of insured employees in your firm? A powerful tool would be to have the default option be that everyone was insured in a plan with the employee’s premium payments paid before taxes. People would be free to decline coverage, switch plans, or change payment methods during open enrollment, so this would not affect freedom of choice. Just this change would probably increase insurance rates substantially. Another tool would be to limit the choices to a handful, so that choice was not overwhelming. You might also supply information about key issues in a simplified format and include key information like typical out-of-pocket expenditures and maximum out-of-pocket expenditures.
18.7. How likely is someone aged 25 to 44 to have an emergency department visit? What is the probability of having two visits? What is a typical charge for emergency department visit? On the basis of your answers, would someone aged 25 to 44 willing to buy coverage for emergency department care (with a $50 copayment) if it cost $250 per year? There is a 20 percent chance of an emergency department visit and a 7 percent chance of two. The typical charge is $1,200. With a copay of $50, expected spending would be $310.50 = 0.20 $1,150 + 0.07 $1,150.
18.8. What was your forecast of emergency department spending in Exercise 18.7? Your forecast should equal the probability of one emergency department visit times the typical charge plus the probability of two visits times the typical charge. The question here is about internal consistency. Your estimates should have this form, even if your predictions of probabilities and charges are wrong.
18.9. A town has two hospitals. One averages 30 births per day; the other averages 15. Overall, half of the babies are boys, but some days more than 60 percent of the babies are boys. Is either hospital likely to have a greater number of days with a high proportion of boys? The smaller hospital is much more likely to have more days with a high proportion of boys.
18.10. Eighty percent of the participants at a meeting are physicians. The rest are nurse practitioners. Your neighbor Amy is there. She is 40, married, and highly motivated. Colleagues have told you that Amy is extremely capable and promises to be very successful. What is the probability that Amy is a physician? The answer should be 80 percent. Nothing in the question told you anything that would help you choose.
18.11. Will you be in the top half of your class or the bottom? What proportion of your classmates will forecast that they will be in the top half? What implications does this scenario have for decision making? This is usually an example of overconfidence. More than half of the class will typically predict they will be in the upper half.
18.12. You have finished interviewing candidates for an assistant director position. One of them stands out as the best candidate to you. You know that this view sets you up for

Economics for Healthcare Managers, Third Edition – Instructor’s Manual 101
Copyright 2015 Health Administration Press
confirmation bias as you check references. What steps can you take to prevent this bias? You could have someone else do the background checks. You could ask a set of standard factual questions about each candidate. You could do the background checks on interview candidates before the interviews, so this won’t be affected by the interview.
18.13. Your vice president is an accountant and believes that accountants make the best practice managers. One of the three finalists for a practice management has an accounting background. Everyone on the search team has ranked this candidate lowest of the finalists. You fear that your vice president will tend to selectively read the team’s recommendations and lean toward hiring this person. What can you do to offset this potential confirmation bias? You can have the accountant be the last interview. If the first two candidates have gotten strong rankings, your vice president will probably find it difficult to give the accountant an even higher ranking. You can try to standardize the interview questions beforehand and focus on issues that are important for the job. You also need to ask why you have rated other candidates higher. Getting agreement on desired attributes before interviews can be important.
18.14. Thirty-four percent of the employees in your health system are obese, and 16 percent of their children are obese as well. Obese employees are less productive, have higher medical costs, and miss more work. Employees with obese children also miss more work, so persuading employees and their families to lose weight looks like a good investment for the system. In fact, effective, clearly cost-effective interventions are available to reduce obesity, and you offer them to your employees and their families. You have recently begun to make weight loss interventions available for free, but only 1 percent of your employees have signed up for them. What behavioral economics tools can you use to help your employees lose weight? You have many tools available to you. Set up an incentive program. For example, let employees deposit $1, $2, or $3 dollars per week and offer to pay back twice as much if they meet their 12-week weight loss goals. They lose increasing amounts of their contributions if they fall short, but you could also offer to pay back three times as much as they have saved at 24 weeks and four times as much at 48 weeks. Both the employees’ contributions and the relatively quick payout are important. The employees’ contributions create a sense of commitment on their part, and the quick payouts make them more likely to stay engaged. Reorganize the company cafeteria to make it smarter. Reduce the size of the plates. (People eat less when plates are smaller.) Offer two choices of fresh vegetables and two choices of healthy salad at the start of the cafeteria line. (When people can choose between healthy foods, they eat more of them.) Display a choice of fruit in attractive bowls near the cash register. Offer a discount meal card that loses its value at the end of a month if not used in the cafeteria. Pay local fast-food restaurants to change their default options. People are much more likely to eat a salad if that is the default option for the meal deal instead of fries. Offer
Economics for Healthcare Managers, Third Edition – Instructor’s Manual 102
Copyright 2015 Health Administration Press
employees discounts on Fuel Bands or FitBits. These are designed to track food consumption and activity. You might tie the discount to their weight loss. Have employees pay something up front with the rest due later. People who lose little or no weight get very small discounts. People who meet weight loss targets get the full discount. Offer a discount on healthy foods that are ordered in advance. Assuming that people want to eat healthier food but succumb to temptation when they are hungry in the grocery store, this has them order food when they cannot make bad choices and means that they will have to throw away things they have paid for. Set up a lottery for people who join weight loss programs. Anyone who joins the program is entered in a lottery. Winners are announced weekly to the entire organization.