economics - mcgraw-hill educationhighered.mheducation.com/sites/dl/free/0077107756/160113/... ·...
TRANSCRIPT

EconomicsEighth Edition
prelims 10/11/05 1:31 pm Page i

prelims 10/11/05 1:31 pm Page ii

iii
London · Boston · Burr Ridge, IL · Dubuque, IA · Madison, WI · New York
San Francisco · St. Louis · Bangkok · Bogotá · Caracas · Kuala Lumpur · Lisbon
Madrid · Mexico City · Milan · Montreal · New Delhi · Santiago · Seoul · Singapore
Sydney · Taipei · Torontoecon
omics Economics
Eighth Edition
David Begg
Stanley FischerRudiger Dornbusch
prelims 10/11/05 1:31 pm Page iii

Economics Eighth EditionDavid Begg, Stanley Fischer and Rudiger DornbuschISBN-13: 978-007710775-8ISBN-10: 0-07-7107756
Published by McGraw-Hill EducationShoppenhangers RoadMaidenheadBerkshireSL6 2QLTelephone: 44 (0) 1628 502 500Fax: 44 (0) 1628 770 224Website: www.mcgraw-hill.co.uk
British Library Cataloguing in Publication DataA catalogue record for this book is available from the British Library
Library of Congress Cataloging in Publication DataThe Library of Congress data for this book has been applied for from the Library of Congress
Acquisitions Editor: Kirsty ReadeSenior Development Editor: Caroline HowellSenior Production Editor: Eleanor HayesMarketing Director: Petra Skytte
Text design by Claire Brodmann Book Designs, Lichfield, Staffs.Cover design by Ego Creative LtdTypeset by Northern Phototypesetting Co Ltd, BoltonPrinted and bound in Spain by Mateu Cromo Artes Graficas SA, Madrid
Published by McGraw-Hill Education (UK) Limited an imprint of The McGraw-Hill Companies, Inc., 1221 Avenue of the Americas, New York, NY 10020. Copyright © 2005 by McGraw-Hill Education (UK)Limited. All rights reserved. No part of this publication may be reproduced or distributed in any form or by anymeans, or stored in a database or retrieval system, without the prior written consent of The McGraw-HillCompanies, Inc., including, but not limited to, in any network or other electronic storage or transmission, orbroadcast for distance learning.
ISBN-13: 978-007710775-8ISBN-10: 0-07-7107756© 2005. Exclusive rights by The McGraw-Hill Companies, Inc. for manufacture and export. This book cannot bere-exported from the country to which it is sold by McGraw-Hill.
iv
prelims 10/11/05 1:31 pm Page iv

DedicationFor Honora, Mary and Robin
prelims 10/11/05 1:31 pm Page v

vi
prelims 10/11/05 1:31 pm Page vi

vii
vii
Brief table of contents
Detailed table of contents ix
Suggested outlines for a shortened course xviii
Getting the most out of this book xx
Preface xxi
Acknowledgements for the eighth edition xxiii
Guided tour xxiv
Technology to enhance learning and teaching xxvi
1. Economics and the economy 3
2. Tools of economic analysis 15
3. Demand, supply and the market 30
4. Elasticities of demand and supply 47
5. Consumer choice and demand decisions 64
6. Introducing supply decisions 85
7. Costs and supply 101
8. Perfect competition and pure monopoly 120
9. Market structure and imperfect competition 142
10. The labour market 162
11. Different types of labour 185
12. Factor markets and income distribution 201
13. Risk and information 222
14. The information economy 241
15. Welfare economics 259
16. Government spending and revenue 279
17. Industrial policy and competition policy 298
18. Natural monopoly: public or private? 315
Part one Introduction 1
Part two Positive microeconomics 45
Part three Welfare economics 257
prelims 10/11/05 1:31 pm Page vii

Brief table of contents
viii
viii
19. Introduction to macroeconomics 335
20. Output and aggregate demand 353
21. Fiscal policy and foreign trade 367
22. Money and banking 384
23. Interest rates and monetary transmission 401
24. Monetary and fiscal policy 418
25. Aggregate supply, prices and adjustment to shocks 430
26. Inflation, expectations and credibility 447
27. Unemployment 469
28. Exchange rates and the balance of payments 484
29. Open economy macroeconomics 500
30. Economic growth 517
31. Business cycles 536
32. Macroeconomics: taking stock 549
33. International trade 567
34. Exchange rate regimes 589
35. European integration 605
36. Less developed countries 622
Appendix: Answers to review questions 638
Glossary 646
Index 657
Part five The world economy 565
Part four Macroeconomics 333
prelims 10/11/05 1:31 pm Page viii

ix
Detailed table of contents
Suggested outlines for a shortened course xviiiGetting the most out of this book xxPreface xxiAcknowledgements for the eighth edition xxiiiGuided tour xxivTechnology to enhance learning and teaching xxvi
Part one Introduction 1Chapter 1 Economics and the economy 3
1.1 Economic issues 41.2 Scarcity and the competing use of resources 61.3 The role of the market 81.4 Positive and normative 111.5 Micro and macro 12
Summary 13Review questions 14
Chapter 2 Tools of economic analysis 152.1 Economic data 162.2 Index numbers 172.3 Nominal and real variables 182.4 Measuring changes in economic variables 202.5 Economic models 202.6 Models and data 212.7 Diagrams, lines and equations 222.8 Another look at ‘other things equal’ 242.9 Theories and evidence 252.10 Some popular criticisms of economics and economists 25
Summary 27Review questions 28
Chapter 3 Demand, supply and the market 303.1 The market 303.2 Demand, supply and equilibrium 313.3 Demand and supply curves 323.4 Behind the demand curve 333.5 Shifts in the demand curve 353.6 Behind the supply curve 363.7 Shifts in the supply curve 373.8 Free markets and price controls 383.9 What, how and for whom 40
Summary 42Review questions 44
prelims 10/11/05 1:31 pm Page ix

Detailed table of contents
x
x
Part two Positive microeconomics 45Chapter 4 Elasticities of demand and supply 47
4.1 The price responsiveness of demand 474.2 Price, quantity demanded and total expenditure 524.3 Further application of the price elasticity of demand 534.4 Short run and long run 554.5 The cross-price elasticity of demand 554.6 The effect of income on demand 564.7 Inflation and demand 594.8 Elasticity of supply 594.9 Who really pays the tax? 60
Summary 62Review questions 63
Chapter 5 Consumer choice and demand decisions 645.1 Demand by a single consumer 645.2 Adjustment to income changes 715.3 Adjustment to price changes 735.4 The market demand curve 785.5 Complements and substitutes 795.6 Transfers in kind 79
Summary 80Review questions 81Appendix: Consumer choice with measurable utility 82
Chapter 6 Introducing supply decisions 856.1 Business organization 856.2 A firm’s accounts 866.3 Firms and profit maximization 906.4 Corporate finance and corporate control 916.5 The firm’s supply decision 926.6 Marginal cost and marginal revenue 946.7 Marginal cost and marginal revenue curves 97
Summary 99Review questions 99
Chapter 7 Costs and supply 1017.1 Input and output 1017.2 Costs and the choice of technique 1027.3 Long-run total, marginal and average costs 1047.4 Returns to scale 1057.5 Average cost and marginal cost 1097.6 The firm’s long-run output decision 1107.7 Short-run costs and diminishing marginal returns 1107.8 A firm’s output decision in the short run 1157.9 Short-run and long-run costs 117
Summary 117Review questions 118
prelims 10/11/05 1:31 pm Page x

Detailed table of contents
xi
xi
Chapter 8 Perfect competition and pure monopoly 1208.1 Perfect competition 1218.2 A perfectly competitive firm’s supply decision 1228.3 Industry supply curves 1258.4 Comparative statics for a competitive industry 1288.5 Global competition 1308.6 Pure monopoly: the opposite limiting case 1318.7 Profit-maximizing output for a monopolist 1328.8 Output and price under monopoly and competition 1348.9 A monopoly has no supply curve 1368.10 Monopoly and technical change 138
Summary 139Review questions 140
Chapter 9 Market structure and imperfect competition 1429.1 Why market structures differ 1439.2 Monopolistic competition 1469.3 Oligopoly and interdependence 1479.4 Game theory and interdependent decisions 1509.5 Reaction functions 1529.6 Entry and potential competition 1569.7 Strategic entry deterrence 1579.8 Summing up 159
Summary 160Review questions 161
Chapter 10 The labour market 16210.1 The firm’s demand for factors in the long run 16310.2 The firm’s demand for labour in the short run 16410.3 The industry demand curve for labour 16810.4 The supply of labour 16910.5 Industry labour market equilibrium 17410.6 Transfer earnings and economic rents 17510.7 Do labour markets clear? 17610.8 UK wages and employment 179
Summary 180Review questions 181Appendix: Isoquants and the choice of production technique 182
Chapter 11 Different types of labour 18511.1 Productivity differences 18611.2 Discrimination 19111.3 Trade unions 194
Summary 199Review questions 199
Chapter 12 Factor markets and income distribution 20112.1 Physical capital 20212.2 Rentals, interest rates and asset prices 203
prelims 10/11/05 1:31 pm Page xi

Detailed table of contents
xii
xii
12.3 Saving, investment and the real interest rate 20712.4 The demand for capital services 20812.5 The supply of capital services 20912.6 Equilibrium and adjustment in the market for capital services 21212.7 The price of capital assets 21312.8 Land and rents 21412.9 Allocating a fixed land supply between competing uses 21512.10 The facts again 21612.11 Income distribution in the UK 217
Summary 219Review questions 220Appendix: The simple algebra of present values and discounting 221
Chapter 13 Risk and information 22213.1 Individual attitudes to risk 22213.2 Insurance and risk 22413.3 Uncertainty and asset returns 22713.4 Portfolio selection 22913.5 Efficient asset markets 23313.6 More on risk 236
Summary 239Review questions 240
Chapter 14 The information economy 24114.1 E-products 24114.2 Consuming information 24214.3 Distributors of information 24614.4 Setting standards 25014.5 Recap 25114.6 Boom and bust of the dot.com companies 251
Summary 254Review questions 255
Part three Welfare economics 257Chapter 15 Welfare economics 259
15.1 Equity and efficiency 25915.2 Perfect competition and Pareto efficiency 26115.3 Distortions and the second best 26415.4 Market failure 26615.5 Externalities 26715.6 Environmental issues 27015.7 Other missing markets: time and risk 27415.8 Quality, health and safety 274
Summary 276Review questions 278
prelims 10/11/05 1:31 pm Page xii

Detailed table of contents
xiii
xiii
Chapter 16 Government spending and revenue 27916.1 Taxation and government spending 28116.2 The government in the market economy 28116.3 The principles of taxation 28516.4 Taxation and supply-side economics 28916.5 Local government 29016.6 Economic sovereignty 29116.7 Political economy: how governments decide 293
Summary 295Review questions 296
Chapter 17 Industrial policy and competition policy 29817.1 Industrial policy 29917.2 Economic geography 30217.3 The social cost of monopoly power 30317.4 Competition policy 30817.5 Mergers 310
Summary 313Review questions 314
Chapter 18 Natural monopoly: public or private? 31518.1 Natural monopoly 31618.2 Nationalized industries 31718.3 Public versus private 32118.4 Privatization in practice 32418.5 Regulating private monopolies 32518.6 The private finance initiative 327
Summary 330Review questions 330
Part four Macroeconomics 333Chapter 19 Introduction to macroeconomics 335
19.1 The big issues 33619.2 The facts 33619.3 An overview 33719.4 National income accounting 33919.5 What GNP measures 347
Summary 350Review questions 351
Chapter 20 Output and aggregate demand 35320.1 Components of aggregate demand 35520.2 Aggregate demand 35720.3 Equilibrium output 35720.4 Another approach: planned saving equals planned investment 35920.5 A fall in aggregate demand 36020.6 The multiplier 36220.7 The paradox of thrift 363
prelims 10/11/05 1:31 pm Page xiii

Detailed table of contents
xiv
xiv
Summary 365Review questions 366
Chapter 21 Fiscal policy and foreign trade 36721.1 Government and the circular flow 36821.2 The government and aggregate demand 36821.3 The government budget 37221.4 Deficits and the fiscal stance 37421.5 Automatic stabilizers and discretionary fiscal policy 37521.6 The national debt and the deficit 37721.7 Foreign trade and income determination 378
Summary 381Review questions 383
Chapter 22 Money and banking 38422.1 Money and its functions 38422.2 Modern banking 38622.3 How banks create money 38822.4 The monetary base and the money multiplier 39022.5 Measures of money 39222.6 Competition between banks 39322.7 The demand for money 394
Summary 398Review questions 399
Chapter 23 Interest rates and monetary transmission 40123.1 The Bank of England 40123.2 The Bank and the money supply 40223.3 Lender of last resort 40423.4 Equilibrium in financial markets 40423.5 Monetary control 40723.6 Targets and instruments of monetary policy 40923.7 The transmission mechanism 409
Summary 415Review questions 416
Chapter 24 Monetary and fiscal policy 41824.1 Monetary policy rules 41824.2 The IS–LM model 42024.3 The IS–LM model in action 42224.4 Shocks to money demand 42324.5 The policy mix 42424.6 The effect of future taxes 42624.7 Demand management revisited 428
Summary 428Review questions 429
Chapter 25 Aggregate supply, prices and adjustment to shocks 43025.1 Inflation and aggregate demand 43125.2 Aggregate supply 43325.3 Equilibrium inflation 434
prelims 10/11/05 1:31 pm Page xiv
Detailed table of contents
xv
xv
25.4 The labour market and wage behaviour 43725.5 Short-run aggregate supply 43825.6 The adjustment process 43925.7 Sluggish adjustment to shocks 44125.8 Tradeoffs in monetary objectives 444
Summary 445Review questions 446
Chapter 26 Inflation, expectations and credibility 44726.1 Money and inflation 44826.2 Inflation and interest rates 45026.3 Inflation, money and deficits 45226.4 Inflation, unemployment and output 45326.5 The costs of inflation 45926.6 Defeating inflation 46226.7 The Monetary Policy Committee 464
Summary 466Review questions 467
Chapter 27 Unemployment 46927.1 The labour market 47027.2 Analysing unemployment 47127.3 Explaining changes in unemployment 47527.4 Cyclical fluctuations in unemployment 47927.5 The cost of unemployment 480
Summary 482Review questions 483
Chapter 28 Exchange rates and the balance of payments 48428.1 The foreign exchange market 48428.2 Exchange rate regimes 48728.3 The balance of payments 48828.4 The real exchange rate 49028.5 Determinants of the current account 49128.6 The financial account 49228.7 Internal and external balance 49428.8 The long-run equilibrium real exchange rate 495
Summary 498Review questions 499
Chapter 29 Open economy macroeconomics 50029.1 Fixed exchange rates 50029.2 Macroeconomic policy under fixed exchange rates 50329.3 Devaluation 50429.4 Floating exchange rates 50729.5 Monetary and fiscal policy under floating exchange rates 51129.6 The pound since 1980 512
Summary 514Review questions 515
prelims 10/11/05 1:31 pm Page xv

Detailed table of contents
xvi
xvi
Chapter 30 Economic growth 51730.1 Economic growth 51830.2 Growth: an overview 51930.3 Technical knowledge 52130.4 Growth and accumulation 52330.5 Growth through technical progress 52630.6 Growth in the OECD 52730.7 Endogenous growth 53030.8 The costs of growth 532
Summary 533Review questions 534
Chapter 31 Business cycles 53631.1 Trend and cycle: statistics or economics? 53731.2 Theories of the business cycle 53831.3 Real business cycles 54131.4 An international business cycle? 54431.5 UK recovery after 1992 54531.6 The odyssey after 2001 546
Summary 547Review questions 548
Chapter 32 Macroeconomics: taking stock 54932.1 Areas of disagreement 55032.2 New Classical macroeconomics 55432.3 Gradualist monetarists 55632.4 Moderate Keynesians 55732.5 Extreme Keynesians 55932.6 A summing up 560
Summary 561Review questions 562
Part five The world economy 565Chapter 33 International trade 567
33.1 Trade patterns 56833.2 Comparative advantage 57033.3 Intra-industry trade 57533.4 Gainers and losers 57733.5 The economics of tariffs 57833.6 Good and bad arguments for tariffs 58033.7 Tariff levels: not so bad? 58533.8 Other trade policies 585
Summary 587Review questions 588
Chapter 34 Exchange rate regimes 58934.1 The gold standard 59034.2 An adjustable peg 59134.3 Floating exchange rates 593
prelims 10/11/05 1:31 pm Page xvi

Detailed table of contents
xvii
xvii
34.4 Speculative attacks on pegged exchange rates 59434.5 Fixed versus floating 59634.6 International policy co-ordination 59834.7 The European Monetary System 599
Summary 602Review questions 603
Chapter 35 European integration 60535.1 The Single Market 60535.2 Benefits of the Single Market 60635.3 From EMS to EMU 60735.4 The economics of EMU 61035.5 Central and Eastern Europe 614
Summary 619Review questions 620
Chapter 36 Less developed countries 62236.1 World income distribution 62236.2 Obstacles to development 62336.3 Development through trade in primary products 62536.4 Industrialization 62936.5 Borrowing to grow 63136.6 Development through structural adjustment 63336.7 Aid 634
Summary 635Review questions 636
Appendix: Answers to review questions 638
Glossary 646
Index 657
prelims 10/11/05 1:31 pm Page xvii

xviii
Suggested outlines for a shortened course
As a lecturer using this textbook to deliver an economics module, you may not be able to usethe complete text. Below are some suggestions on how it may be used on a short economicscourse, or as a text for a microeconomics or macroeconomics module.
First option
A short introduction to economics1 Economics and the economy2 Tools of economic analysis3 Demand, supply and the market4 Elasticities of demand and supply6 Introducing supply decisions7 Costs and supply8 Perfect competition and pure monopoly9 Market structure and imperfect competition
10 The labour market12 Factor markets and income distribution15 Welfare economics19 Introduction to macroeconomics20 Output and aggregate demand21 Fiscal policy and foreign trade22 Money and banking23 Interest rates and monetary transmission24 Monetary and fiscal policy32 Macroeconomics: taking stock33 International trade
Second option
An introduction to microeconomics1 Economics and the economy2 Tools of economic analysis3 Demand, supply and the market4 Elasticities of demand and supply5 Consumer choice and demand decisions6 Introducing supply decisions7 Costs and supply8 Perfect competition and pure monopoly9 Market structure and imperfect competition
10 The labour market12 Factor markets and income distribution15 Welfare economics16 Government spending and revenue17 Industrial policy and competition policy
prelims 10/11/05 1:31 pm Page xviii

Suggested outlines for a shortened course
xix
xix
18 Natural monopoly: public or private?33 International trade
Third option
An introduction to macroeconomics1 Economics and the economy2 Tools of economic analysis3 Demand, supply and the market
19 Introduction to macroeconomics20 Output and aggregate demand21 Fiscal policy and foreign trade22 Money and banking23 Interest rates and monetary transmission24 Monetary and fiscal policy25 Aggregate supply, prices and adjustment to shocks26 Inflation, expectations and credibility27 Unemployment28 Exchange rates and the balance of payments29 Open economy macroeconomics30 Economic growth31 Business cycles32 Macroeconomics: taking stock34 Exchange rate regimes
Also available from McGraw-Hill:
Begg, Fischer and Dornbusch, Foundations of Economics, 3rd edition– Tailored to suit a 10–12 week foundation module in economics, for use with economics
specialist or non-specialist students.
Begg and Ward, Economics for Business– A new text for students of economics on business and management programmes that
focuses on economics problems faced by businesses.
prelims 10/11/05 1:31 pm Page xix
xx
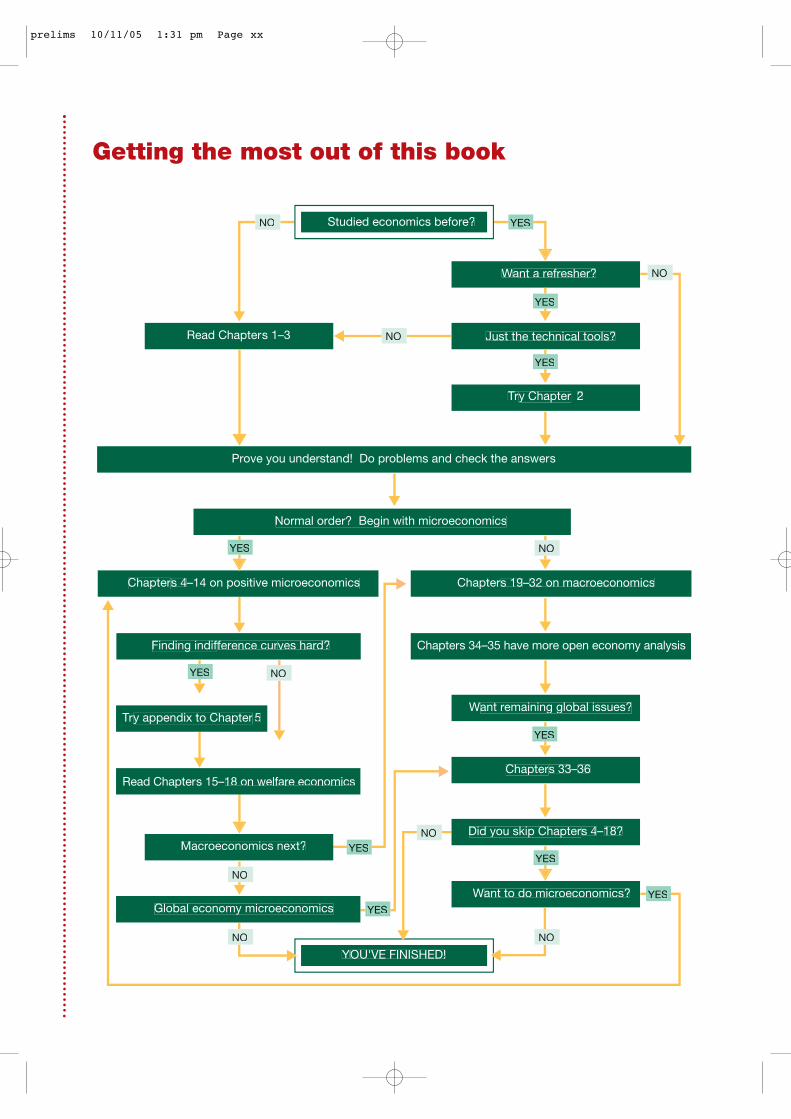
Getting the most out of this book
Studied economics before?
YOU'VE FINISHED!
Read Chapters 1–3
Finding indifference curves hard? Chapters 34–35 have more open economy analysis
Want a refresher?
Normal order? Begin with microeconomics
Chapters 4–14 on positive microeconomics Chapters 19–32 on macroeconomics
Just the technical tools?
Try Chapter 2
Want remaining global issues?Try appendix to Chapter 5
Read Chapters 15–18 on welfare economics
Global economy microeconomics
Chapters 33–36
Want to do microeconomics?
Prove you understand! Do problems and check the answers
Macroeconomics next?
NO
YES
Did you skip Chapters 4–18?
NO
NO
NO
NO
YES
YES
YESYES
YES
YES NO
NO
YES
YES
NO YES
NO
prelims 10/11/05 1:31 pm Page xx

xxi
Preface
Economics is much too interesting to be left to professional economists. It affects almost every-thing we do, not merely at work or at the shops but also in the home and the voting booth. Itinfluences how well we look after our planet, the future we leave for our children, the extent towhich we can care for the poor and the disadvantaged, and the resources we have for enjoyingourselves.
These issues are discussed daily, in bars and buses as well as cabinet meetings and board-rooms. The formal study of economics is exciting because it introduces a toolkit that allows abetter understanding of the problems we face. Everyone knows a smoky engine is a bad sign,but sometimes only a trained mechanic can give the right advice on how to fix it.
This book is designed to teach you the toolkit and give you practice in using it. Nobody car-ries an enormous toolbox very far. Useful toolkits are small enough to be portable but containenough proven tools to deal both with routine problems and unforeseen circumstances. Withpractice, you will be surprised at how much light this analysis can shed on daily living. Thisbook is designed to make economics seem as useful as it really is.
How much do economists disagree?
There is an old complaint that economists never agree about anything. This is simply wrong.The media, taxi drivers, and politicians love to talk about topics on which there is disagreement;it would be boring TV if all participants in a panel discussion held identical views. But econom-ics is not a subject in which there is always an argument for everything. There are answers tomany questions. We aim to show where economists agree – on what and for what reason – andwhy they sometimes disagree.
Economics in the 21st century
Our aim is to allow students to understand today’s economic environment. This requires mas-tering the theory and practising its application. Just as the theory of genetics or informationtechnology is slowly progressing, so the theory of economics continues to make progress, some-times in dramatic and exciting ways.
We believe in introducing students immediately to the latest ideas in economics. If thesecan be conveyed simply, why force students to use older approaches that work less well? Tworecent developments in economics underlie much of what we do. One is the role of information,the other is globalization.
How information is transmitted and manipulated is central to many issues in incentives andcompetition, including the recent boom in e-commerce. Ease of information, coupled with lowertransport costs, also explains trends towards globalization, and associated reductions in nationalsovereignty, especially in smaller countries. Modern economics helps us make sense of ourchanging world, think about where it may go next, and evaluate choices that we currently face.
Learning by doing
Few people practise for a driving test just by reading a book. Even when you think you under-stand how to do a hill start, it takes a lot of practice to master the finer points. In the same way,we give you lots of examples and real-world applications not just to emphasize the relevance ofeconomics but also to help you master it for yourself. We start at square one and take you slowly
prelims 10/11/05 1:31 pm Page xxi

Preface
xxii
xxii
through the tools of theoretical reasoning and how to apply them. We do not use algebra andthere are very few equations in the book. The best ideas are simple and robust, and can usuallybe explained quite easily.
How to study
Don’t just read about economics, try to do it! It is easy, but mistaken, to read on cruise control,highlighting the odd sentence and gliding through paragraphs we have worked hard to simplify.Active learning needs to be interactive. When the text says ‘clearly’, ask yourself ‘why’ is itclear? See if you can construct the diagram before you look at it. As soon as you don’t followsomething, go back and read it again. Try to think of other examples to which the theory couldbe applied. The only way to check you really understand things is to try the review questionsand see if you got the right answer. The eighth edition has comprehensive answers, which youwill find on pages 638–45. You can also explore the on-line resources centre that accompaniesthis book for extra learning resources, and may also wish to consider using the student work-book that accompanies this text.
To assist you in working through this text, we have developed a number of distinctive studyand design features. To familiarize yourself with these features, please turn to the Guided Touron pages xxiv–xxv, overleaf.
Changes to the eighth edition
The eighth edition has been thoroughly revised, even though we have kept to the familiar andproven structure, to ensure that it keeps up with the latest thinking about our evolving worldand the way in which economics can make sense of it.
Specific changes to the new edition include:
� A complete revision of the discussion of UK competition policy, reflecting changes in legis-lation and regulatory practice, themselves a response to evolving market conditions that weexplain.
� A realistic discussion of modern monetary policy using inflation targeting. Traditionalanalyses that rely on IS/LM with fixed money supply are more obsolete than ever, and thecore of Part 4 integrates the new monetary policy into traditional discussions of aggregatesupply and the Phillips curve.
� The eighth edition streamlines the pioneering discussion of the new monetary policy, firstintroduced in the seventh edition, stripping it down to its bare essentials to make it fullyaccessible to students learning economics for the first time.
� Fully updated throughout to include 2003/2004 data in graphs and tables, and many newcontemporary boxes to illustrate key ideas with relevance to students.
� Revised design that places key terms in the margin for easy reference, and that aims to makethe text easier to navigate and use.
� More resources provided for lecturers.
Supplementary resources
Economics eighth edition offers a comprehensive package of resources for the teaching andlearning of economics. The resources offered with the new edition have been developed inresponse to feedback from current users in order to provide lecturers with a variety of teachingresources for class teaching, lectures and assessment. Students are also offered a range of extramaterials to assist them in learning, revising and applying the principles of economics.
prelims 10/11/05 1:31 pm Page xxii

xxiii
Acknowledgements for the eighth edition
We thank the team at McGraw-Hill for their support, advice and enthusiasm, and the manyreaders of previous editions who took the trouble to write with suggestions for improvementsand ideas for the new edition.
We would like to thank the following reviewers who provided helpful suggestions andcomments on the book as it progressed through its revisions:
Steve Cook, University of SwanseaTom Craven, University of Ulster at Jordanstown Richard Godfrey, University of Wales Institute, CardiffDavid Gray, University of Lincoln Anthony Heyes, Royal Holloway, University of LondonPietie Horn, University of Stellenbosch, South AfricaGeoffrey Killick, University of WestminsterJan Peter Madsen, Copenhagen Business School, DenmarkMahmood Messkoub, University of LeedsLiezl Nieuwoudt, University of Stellenbosch, South AfricaNicholas Perdikis, University of Wales AberystwythRobert Simmons, University of LancasterThea Sinclair, University of NottinghamGerard Turley, National University of Ireland, GalwayNalini Vittal, Royal Holloway, University of LondonMichael Wood, London South Bank University
prelims 10/11/05 1:31 pm Page xxiii

xxiv
Guided tour
Part openingsThere are five Part Openers, which introducethe topics and themes covered throughoutthe five parts of the text.
Learning outcomesEach chapter opens with a set of learningoutcomes that introduce the issues that will beaddressed in the chapter and offer a guide tothe students for their revision and learning.
Figures and tablesEach chapter provides a number of figures andtables to help you to visualize the variouseconomic models, and to illustrate andsummarize important concepts. Captions offerthorough explanations of important figures.
Important key conceptsThese are highlighted throughout each chapterand provide key points for ease of reference. A glossary at the end of the book compiles thekey terms for handy reference.
44
Positive micro-economics
Positive economics looks at how the economy functions. Microeconomics
takes a detailed look at particular decisions without worrying about all the
induced effects elsewhere. Part 2 studies in detail the demand behaviour of
consumers and the supply behaviour of producers, showing how markets work
and why different markets exhibit different forms of behaviour. By applying similar
tools to the analysis of input markets, we can also understand why some people
earn so much more than others.
Chapter 4 examines the responsiveness of demand and supply behaviour.
Chapter 5 develops a theory of demand based on self-interested choice by con-
sumers. Chapter 6 introduces different types of firm and considers motives behind
production decisions. Chapter 7 analyses how costs of production influence the
output that firms choose to supply. Chapters 8 and 9 explore how differences in
market structure affect competition and the output decision of firms. Chapters 10 to
12 analyse input markets for labour, capital and land, which determine the distribu-
tion of income. Chapter 13 explains why people dislike risk, how institutions develop
to shift risk on to those who can bear it more cheaply, and why informational prob-
lems can inhibit the development of markets for some commodities. Chapter 14
uses the microeconomic analysis of Part 2 to examine recent developments in the
information economy.
Contents
�4 Elasticities of demand and supply 00
�5 Consumer choice and decisions demand 00
�6 Introducing supply decisions 00
�7 Costs and supply 00
�8 Perfect competition and pure monopoly 00
45
part two
Part 2 : Positive microeconomics
142
142
142
Market structure andimperfect competition
Learning outcomesBy the end of this chapter, you should understand:
�1 imperfect competition, oligopoly and monopolistic competition
�2 how cost and demand affect market structure
�3 how globalization changes domestic market structure
�4 equilibrium in monopolistic competition
�5 the tension between collusion and competition in a cartel
�6 game theory and strategic behaviour
�7 the concepts of commitment and credibility
�8 reaction functions and Nash equilibrium
�9 Cournot and Bertrand competition
�10 Stackelberg leadership
�11 why there is no market power in a contestable market
�12 innocent and strategic entry barriers
Perfect competition and pure monopoly are useful benchmarks of the extremes of marketstructure. Most markets are between the extremes. What determines the structure of aparticular market? Why are there 10 000 florists but only a few chemical producers?
How does the structure of an industry affect the behaviour of its constituentfirms?
A perfectly competitive firm faces a horizontal demand curve at the marketprice. It is a price-taker. Any other type of firm faces a downward-sloping demandcurve for its product and is imperfectly competitive.
For a pure monopoly, the demand curve for the firm and the industry coin-cide. We now distinguish two intermediate cases of an imperfectly competitivemarket structure.
The car industry is an oligopoly. The price of Rover cars depends not only onits own output and sales but also the output of Ford and Toyota. The corner gro-cer’s shop is a monopolistic competitor. Its output is a subtle package of physicalgoods, personal service and convenience for local customers. It can charge aslightly higher price than an out-of-town supermarket. But, if its prices are toohigh, even local shoppers travel to the supermarket.
As with most definitions, the lines between different market structures canget blurred. One reason is ambiguity about the relevant definition of the market.
9chapter
An imperfectly competitivefirm faces a down-sloping
demand curve. Its output pricereflects the quantity of goods it
makes and sells.
An oligopoly is an industrywith few producers, each
recognizing theirinterdependence. An industry
with monopolisticcompetition has many sellers
of products that are closesubstitutes for one another.Each firm has only a limited
ability to affect its output price.
economies near the bottom of their LAC2 curves. It is an oligopoly. Attempts to expand eitherfirm’s output beyond q4 quickly meet decreasing returns to scale and prevent a firm drivingcompetitors out of business.
The crucial determinant of market structure is minimum efficient scale rel-ative to the size of the total market as shown by the demand curve. Table 9.2summarizes our analysis of the interaction of market size and minimum efficientscale. When the demand curve shifts to the left, an industry previously withmany firms may have room for only a few. Similarly, a rise in fixed costs, raising
the minimum efficient scale, reduces thenumber of firms. In the 1950s there weremany European aircraft makers. Today,the research and development costs of amajor commercial airliner are huge. Apartfrom the co-operative European ventureAirbus Industrie, only the American giant
The Boeing Company survives.Monopolistic competition lies between oligopoly and perfect competition. Monopolistic
competitors supply different versions of the same product, such as the particular location of anewsagent.
Evidence on market structure
The larger the minimum efficient scale relative to the market size, the fewer the number ofplants – and probably the number of firms – in the industry. What number of plants (NP) oper-ating at minimum efficient scale does a market size allow? Chapter 7 discussed estimates ofminimum efficient scale in different industries. By looking at the total purchases of a productwe can estimate market size. Hence we can estimate NP for each industry.
Part 2 : Positive microeconomics
144
144
Output q of a firm and output Q of the industry
0
Pric
e, a
vera
ge c
osts
P3
P2
P1
q1 q2 q4 Q 3 Q 2 Q1
LAC 3
LAC 2
LAC 1
D
D
Figure 9.1 Demand, costs, and market structure
DD is the industry demand curve. In a competitive industry, minimum efficient scale occurs at an output level q1, when firms have averagecost curves LAC1. The industry can support a very large number of firms whose total output is Q1 at the price P1. When LAC3 describesaverage costs, the industry will be a natural monopoly. When a single firm produces the entire industry output, no other firm can break intothe market and make a profit. For intermediate positions such as LAC2 the industry can support a few firms in the long run, and no singlefirm can profitably meet the entire demand. The industry will be an oligopoly.
Minimum efficient scale isthe lowest output at which a
firm’s LAC curve stops falling.
Table 9.2 Demand, cost and market structure
Minimum efficient scale relative to market size
Tiny Intermediate Large
Perfect competition Oligopoly Natural monopoly
Even industries with only a few key players have some small firms on thefringe. The total number of firms can be a misleading indicator of the structureof the industry. Economists use the N-firm concentration ratio to measure thenumber of key firms in an industry.
Thus, the 3-firm concentration ratio tells us the market share of the largestthree firms. If there are three key firms, they will supply most of the market. If the industry isperfectly competitive, the largest three firms will only have a tiny share of industry output andsales.
It would be nice to look at cross-country evidence to see if market structures always obeyour theory. If this is to be an independent check, we really need national data before globaliza-tion and European integration became important. Table 9.3 examines evidence for the UK,France and Germany for the mid-1970s.
CR is the 3-firm concentration ratio, the market share of the top three firms. NP is the num-ber of plants at minimum efficient scale that the market size allows. If our theory of marketstructure is correct, industries with big scale economies relative to market size, and thus fewplants NP, should have a large concentration ratio CR. Such industries should have few keyfirms. Conversely, where NP is very high, economies of scale are relatively unimportant and thelargest three firms should have a much smaller market share. CR should be low.
Table 9.3 confirms that this theory of market structure fits these facts. Industries such asrefrigerator and cigarette manufacture had room for few plants operating at minimum efficientscale: these industries had high degrees of concentration. The largest three firms controlledalmost the whole market. Scale economies still mattered in industries such as brewing andpetroleum refining: the top three firms had about half the market. Industries such as shoemak-ing quickly met rising average cost curves, had room for many factories operating at minimumefficient scale and thus were much closer to competitive industries. The top three firms in shoe-making had under one-fifth of the market.
Globalization and multinationals
Table 9.3 showed data before the rise of globalization and multinationals. Glob-alization reflects cheaper transport costs, better information technology and adeliberate policy of reducing cross-country barriers in order to get efficiencygains from large scale and specialization. Multinationals sell in many countriesat the same time. They may, or may not, also produce in many countries.
Chapter 9: Market structure and imperfect competition
145
145
The N-firm concentrationratio is the market share of the
largest N firms in the industry.
Table 9.3 Concentration and scale economies
UK France GermanyIndustry CR NP CR NP CR NP
Refrigerators 65 1 100 2 72 3
Cigarettes 94 3 100 2 94 3
Refineries 79 8 60 7 47 9
Brewing 47 11 63 5 17 16
Fabrics 28 57 23 57 16 52
Shoes 17 165 13 128 20 197
Note: Concentration ratio CR is % market share of 3 largest firms; number of plants NP is market size divided byminimum efficient scale.
Sources: F. M. Scherer et al., The Economics of Multiplant Operation, Harvard University Press, 1975; and F. M.Scherer, Industrial Market Structure and Economic Performance, Rand McNally, 1980.
Globalization is the closerintegration of markets across
countries. Multinationals arefirms operating in many
countries simultaneously.
Is Eurostar a monopoly in cross-channel trains or an oligopolist in cross-channel travel? Simi-larly, when a country trades in a competitive world market, even the sole domestic producermay have little influence on market price. We can never fully remove these ambiguities butTable 9.1 shows some things to bear in mind as we proceed through this chapter. The tableincludes the ease with which new firms can enter the industry, which affects the ability of exist-ing firms to maintain high prices and supernormal profits in the long run.
Some industries are legal monopolies, the sole licensed producers. Patent laws may confer tem-porary monopoly on producers of a new process. Ownership of a raw material may confermonopoly status on a single firm. We now develop a general theory of how demand and costinteract to determine the likely structure of each industry.
The car industry is not an oligopoly one day but perfectly competitive the next. Long-runinfluences determine market structures. Eventually, one firm can hire another’s workers andlearn its technical secrets.
Figure 9.1 shows the demand curve DD for the output of an industry in the long run. Sup-pose all firms and potential entrants face the average cost curve LAC1. At the price P1, free entryand exit means that each firm produces q1. With the demand curve DD, industry output is Q1.The number of firms in the industry is N1 (= Q1/q1). If q1, the minimum average cost output onLAC1, is small relative to DD, N1 will be large. Each firm has a tiny effect on industry supply andmarket price. We have found a perfectly competitive industry.
Next, suppose that each firm has the cost curve LAC3. Scale economies are vast relative to the market size. At the lowest point on LAC3, output is big relative to the demand curve DD. Suppose initially two firms each make q2. Industry output is Q2. The market clears at P2
and both firms break even. If one firm expands a bit, its average costs fall. Its higher output also bids the price down. With lower average costs, that firm survives but the other firm losesmoney. The f irm that expands undercuts its competitor and drives it out ofbusiness.
This industry is a natural monopoly. Suppose Q3 is the output at which itsmarginal cost and marginal revenue coincide. The price is P3 and the naturalmonopoly makes supernormal profits. There is no room in the industry for otherfirms with access to the same LAC3 curve.
A new entrant needs a big output to get average costs down. Extra output onthis scale so depresses the price that both firms make losses. The potential entrant
cannot break in.Finally, we show the LAC2 curve with more economies of scale than a competitive industry
but fewer than a natural monopoly. This industry supports at least two firms enjoying scale
Chapter 9: Market structure and imperfect competition
143
143
Table 9.1 Market structure
Competition Number of firms Ability to affect price Entry barriers Example
Perfect Lots Nil None Fruit stall
Imperfect: Monopolistic Many Little Small Corner shop
Oligopoly Few Medium Bigger Cars
Monopoly One Large Huge Post Office
5.1 Why market structures differ9.1
A natural monopoly enjoyssuch scale economies that it
has no fear of entry by others.
prelims 10/11/05 1:31 pm Page xxiv

Guided tour
xxv
xxv
BoxesExamples throughout the chapters bringeconomics to life and demonstrate theapplication of theories and concepts tocontemporary issues.
End of chapter summaryThis briefly reviews and reinforces the maintopics covered in each chapter, offering a usefulrevision too and a means of testing that a solidunderstanding of the key topics has developed.
Review questionsThese questions encourage you to review andapply the knowledge you have acquired fromeach chapter and can be undertaken to testyour understanding or as a focus fordiscussion in class. Students can checkprogress by reviewing the answers at theback of the book.
Chapter appendicesThese sections at the end of the chaptersprovide further explanations of economicmodels for those who wish to use them. Theyare not necessary to understand theeconomics of the text but rather for thosewho are interested in expanding theirknowledge further.
Prices versus quantities
If free markets tend to overpollute, society can cut pollution either by regulating the quantity ofpollution or by using the price system to discourage such activities by taxing them. Is it moresensible to intervene through the tax system than to regulate quantities directly?
Many economists prefer taxes to quantity restrictions. If each firm is charged the sameprice or tax for a marginal unit of pollution, each firm equates the marginal cost of reducingpollution to the price of pollution. Any allocation in which different firms have different mar-ginal costs of reducing pollution is inefficient. If firms with low marginal reduction costs con-tract further and firms with high marginal reduction costs contract less, lower pollution isachieved at less cost.
The main problem with using taxes rather than quantity restrictions is uncertainty aboutoutcome. Suppose pollution beyond a critical level has disastrous consequences, for exampleirreversibly damaging the ozone layer. By regulating the quantity directly, society can ensure a
Part 3 : Welfare economics
272
272
Chlorofluorocarbons (CFCs), gases used in things likeaerosols, are destroying the ozone layer that protectsthe earth from solar rays. Without this sunscreen, morepeople develop skin cancer. Organizing internationalcutbacks in atmospheric pollution is difficult: eachcountry wants to free-ride, enjoying the benefits ofother countries’ cutbacks but making no contributionof its own. The Montreal Protocol on substances thatdeplete the ozone layer was signed by nearly 50 coun-tries in 1987. Before the Protocol, projected ozonedepletion was 5 per cent by 2025 and 50 per cent by2075. In the Protocol, countries agreed to take stepsto reduce ozone depletion to 2 per cent by 2025 withno further deterioration thereafter. Such optimisticaims are hard to achieve.
A second type of atmospheric pollution is evenmore important. The greenhouse effect arises fromemissions of CFCs, methane, nitrous oxide and, espe-cially, carbon dioxide. Greenhouse gases are the directresult of pollution and the indirect result of the atmos-phere’s reduced ability to absorb them. Plants convertcarbon dioxide into oxygen. Chopping down forests toclear land for cattle, as global demand for hamburgersrises, has accelerated the greenhouse effect.
The consequence is global warming. People inLondon and Stockholm get better suntans, people inAfrica face drought and famine. As icecaps melt, thesea rises, flooding low-lying areas. By 2070 the tem-perature will have risen by 4 °C, and the sea by 45 cen-
timetres. As with acid rain, organizing collective inter-national cutbacks has been difficult.
In 1997 the Kyoto Protocol agreed national tar-gets for lower emissions of greenhouse gases.Becoming binding in 2008–12, the Kyoto deal wouldhave cut emissions by 5 per cent relative to the 1990level, but by much more relative to the growth that ado-nothing policy would have allowed. The tableshows 1990 levels, actual behaviour in the 1990s andthe target for 2012.
1990 emissions 2012 target (% change (million tonnes) from 1990 level)
Japan 1190 – 6
USA 5713 – 7
Germany 1204 –21
UK 715 –12
Italy 532 – 6
France 498 0
Spain 301 +15
In 2001 US President George W Bush announcedthat the United States would not ratify the Kyoto Pro-tocol because it did not oblige poorer countries suchas India and China to do their share of pollution reduc-tion. In July 2001, after a meeting in Bonn, 178 coun-tries decided to proceed with a weaker version of theKyoto Protocol, despite the refusal of the United Statesto participate.
BOX 15-2 Atmosphere of pollution
Technical progress and capital investment in the basic utilities – energy and water supply– meant that jobs continued to contract in the sector. Table 10.1 confirms that, with so muchcapital per worker, workers are very productive and are highly paid. However, privatization andgreater competition within this sector have eroded the bargaining power of workers, who havenot secured substantial wage increases over the last decade.
� In the long run, a firm chooses a production technique to minimize the cost of a particularoutput. By considering each output, it constructs a total cost curve.
� In the long run, a rise in the price of labour (capital) has a substitution effect and anoutput effect. The substitution effect reduces the quantity of labour (capital) demanded asthe capital–labour ratio rises (falls) at each output. But total costs and marginal costs ofoutput increase. The more elastic the firm’s demand curve and marginal revenue curve, themore the higher marginal cost curve reduces output, reducing demand for both factors. Fora higher price of a factor, the substitution and output effects both reduce the quantitydemanded.
� In the short run, the firm has fixed factors, and probably a fixed production technique.The firm can vary short-run output by varying its variable input, labour, which is subject todiminishing returns when other factors are fixed. The marginal physical product of labourfalls as more labour is hired.
� A profit-maximizing firm produces the output at which marginal output cost equals marginaloutput revenue. Equivalently, it hires labour until the marginal cost of labour equals itsmarginal revenue product. One implies the other. If the firm is a price-taker in its outputmarket, the MRPL is its marginal value product, the output price times its marginalphysical product. If the firm is a price-taker in the labour market, the marginal cost of labouris the wage rate. A perfectly competitive firm equates the real wage to the marginal physicalproduct of labour.
� The downward-sloping marginal physical product of labour schedule is the short-rundemand curve for labour (in terms of the real wage) for a competitive firm. Equivalently, themarginal value product of labour schedule is the demand curve in terms of the nominalwage. The MVPL schedule for a firm shifts up if the output price increases, the capital stockincreases or if technical progress makes labour more productive.
� The industry’s labour demand curve is not merely the horizontal sum of firms’ MVPLcurves. Higher industry output in response to a wage reduction also reduces the outputprice. The industry labour demand curve is steeper (less elastic) than that of each firm, andmore inelastic the more inelastic is the demand curve for the industry’s output.
� Labour demand curves are derived demands. A shift in the output demand curve for theindustry will shift the derived factor demand curve in the same direction.
� For someone already in the labour force, a rise in the hourly real wage has a substitutioneffect tending to increase the supply of hours worked, but an income effect tending toreduce the supply of hours worked. For men, the two effects cancel out almost exactly inpractice but the empirical evidence suggests that the substitution effect dominates forwomen. Thus women have a rising labour supply curve; for men it is almost vertical.
� Individuals with non-labour income may prefer not to work. Four things raise theparticipation rate in the labour force: higher real wage rates, lower fixed costs of working,lower non-labour income and changes in tastes in favour of working. These explain thetrend for increasing labour force participation by married women over the last few decades.
Part 2 : Positive microeconomics
180
180
SUMMARY
The choice of technique can be examined with techniques similar to the indifferencecurve–budget line approach used to study consumer choice in Chapter 5. Figure10.A1 plots input quantities of capital K and labour L. Points A, B, C, and Dshow the minimum input quantities needed to make 1 unit of output using eachof four different techniques. Technique A is the most labour-intensive, requiringLA units of labour and KA units of capital to make 1 unit of output. Technique Dis the most capital intensive. Connecting A, B, C, and D yields an isoquant (iso =the same, quant = quantity).
Figure 10.A1 shows 4 techniques but we canimagine that there are other techniques. Figure10.A2 shows smooth isoquants. Isoquant I corre-sponds to a particular output. Each point on iso-quant I reflects a different technique, from verycapital intensive to very labour intensive.
Higher isoquants, such as I, show higher out-put levels since more inputs are required. Each iso-quant shows different input combinations to make agiven output. The isoquants constitute an isoquantmap.
Three properties of isoquants are important.First, they cannot cross. Each isoquant refers to adifferent output. Second, each isoquant slopesdown. To make a given output, a technique can usemore capital only if it uses less labour and vice versa.Hence isoquants must slope down. Third, Figure10.A2 each isoquant becomes flatter as we movealong it to the right, as Figure 10.A2 shows. Movingdown a given isoquant, it takes more and more extracapital input to make equal successive reductions in
the labour input required to produce a given output.In Figure 10.A2 the line L0K0 is an isocost line. It shows different input combinations with
the same total cost. For a given cost, the firm can use more units of capital only if it uses fewerunits of labour. Facing given prices at which different inputs may be hired, we can say twothings about isocost lines.
First, the slope of the isocost line reflects the relative price of the two factors of production.Beginning at K0, where all the firm’s money is spent on capital, the firm can trade off 1 unit of
Part 2 : Positive microeconomics
182
182
Appendix Isoquants and the choice of production technique
An isoquant shows minimumcombinations of inputs to makea given output. Different pointson an isoquant reflect different
production techniques.
To help you grasp the key concepts of this chapter check out the
extra resources posted on the Online Learning Centre at www.mcgraw-hill.co.uk/
textbooks/begg. There are quick test questions, economics examples and
access to Powerweb articles, all for free!
For even more exercises, recaps and examples to help you study, purchase a copy of the Economics
Student Workbook. Simply visit www.mcgraw hill.co.uk/textbooks/begg and follow the links to the
Workbook to buy your copy.
Capital0
Lab
our
KAKAK K
LA
D
C
B
A
Figure 10.A1 An isoquant
Points A, B, C, and D show different input combinations requiredto produce 1 unit of output. By connecting them we obtain anisoquant that shows the different input combinations which canproduce a particular level of output.
capital for more units of labour the cheaper the wage rate relative to the rental cost of capital.Second, facing given factor prices, by raising spending a firm can have more capital and morelabour. A higher isocost line parallel to L0K0 shows a higher spending on inputs. Along the iso-cost line L1K1 the firm spends more on inputs than along the isocost line L0K0.
To minimize the cost of making a given output, a firm chooses the point of tangency of thatisoquant to the lowest possible isocost line. At this point, the (negative) slope of the isocost lineequals the (negative) slope of the isoquant. If w is the wage rate and r the rental cost of a unitof capital, the slope of the isocost line is r/w. What about the slope of the isoquant?
With an extra unit of capital, the firm gains MPK units of output, where MPK is the mar-ginal physical product of capital. But along an isoquant output is constant. By shedding a unitof labour the firm gives up MPL units of output. Lowering labour input by [–MPK/MPL] keepsoutput constant when capital input is 1 unit higher. The isoquant’s slope [–MPK/MPL] tells usby how much labour is changed to keep output constant when capital is 1 unit higher. Hencethe tangency condition in Figure 10.A2 implies:
Slope of isocost line = –r/w = –MPK/MPL= slope of isoquant (A1)
Point A in Figure 10.A2 is the least-cost way to make the output shown by isoquant I¢. We canrepeat this analysis for every other isoquant showing different outputs. That is how we derivethe total cost curve discussed in the text.
Chapter 10: The labour market
183
183
Capital0
Lab
our
K0K0K
I"'
I"I'
I
I
K1K1K K
A
BC
D
L1
L0
L
I"'
I"
I'
Figure 10.A2 Cost minimization
Each isoquant such as I shows a particular output level.Higher isoquants such as I≤ show higher output levels.Straight lines such as L0K0 are isocost lines showing differentinput combinations having the same total cost. The slope ofan isocost line depends only on relative factor prices. Ahigher isocost line such as L1K1 implies a larger total cost. Toproduce a given output, such as that corresponding to theisoquant I ¢, the firm chooses the point of tangency of thatisoquant to the lowest possible isocost line. Thus poiint A isthe cost minimizing way to produce the output level on I ¢ andpoint B the cost minimizing way to produce the output levelon I≤.
Capital
Lab
our
K1K1K K
L
I"
I"
B'
I'
I'
B
C
L1
L2
Figure 10.A3 The effect of a wage increase
At the old factor prices the firm’s output level corresponds tothe isoquant I≤. All isocost lines have the same slope as L1K1and the firm produces its given output most cheaply bychoosing the point B where the isoquant is tangent to thelowest possible isocost line L1K1. A wage increase makes allisocost lines flatter, parallel to L2K1. Each unit of capitalsacrificed now allows the purchase of less additional labour.The wage increase has a pure substitution effect from B to B¢where the original isoquant I ≤ has the same slope as the newisocost lines. Firms substitute capital for labour. But with highermarginal costs at each output level, the firm’s profit-maximizingoutput is reduced, say to the level corresponding to theisoquant I¢. On this isoquant, costs are minimized by producingat C to reach the lowest possible isocost line L2K1 at the newfactor prices. The move from B¢ to C is the pure effect inducedby the shift in the firm’s marginal cost curve for its output.
� The industry supply curve of labour depends on the wage paid relative to wages in otherindustries using similar skil ls. Equilibrium wage differentials are the monetarycompensation for differences in non-monetary characteristics of jobs in different industriesundertaken by workers with the same skill. Taking monetary and non-monetary rewardstogether, there is then no incentive to move between industries.
� When the labour supply curve to an industry is less than perfectly elastic, the industry payshigher wages to expand employment. For the marginal worker, the wage is a pure transferearning, required to induce that worker into the industry. For workers prepared to work inthe industry at a lower wage, there is an element of economic rent (the difference betweenincome received and transfer earnings for that individual).
� In free market equilibrium, some workers choose not to work at the equilibrium wage rate.They are voluntarily unemployed. Involuntary unemployment is the differencebetween desired supply and desired demand at a disequilibrium wage rate. Workers wouldlike to work but cannot find a job.
� There is considerable disagreement about how quickly labour markets can get back toequilibrium if initially in disequilibrium. Possible causes of involuntary unemployment areminimum wage agreements, trade unions, scale economies, insider–outsiderdistinctions and efficiency wages.
�1 (a) Explain why the marginal product of labour eventually declines. (b) Show in a diagram theeffect of an increase in the firm’s capital stock on its demand curve for labour.
�2 Over the last 100 years the real wage has risen but the length of the working week has fallen.(a) Explain this result using income and substitution effects. (b) Explain how an increase in thereal wage could cause everyone in employment to work fewer hours but still increase thetotal amount of work done in the economy.
�3 Why should the labour supply curve to an industry slope upwards even if the aggregatelabour supply to the economy is fixed?
�4 Answer the questions with which we began the chapter. (a) Why can a top golfer earn morein a weekend than a university professor earns in a year? (b) Why can students studyingeconomics expect to earn more than equally smart students studying philosophy?
�5 Common fallacies Why are the following statements wrong? (a) There is no economicreason why a sketch that took Picasso one minute to draw should fetch £100 000. (b) Higherwages must raise incentives to work.
To check your answers to these questions, go to pages 000–000.
Chapter 10: The labour market
181
181
REVIEW QUESTIONS
disaster is avoided. Indirect control, through taxes or charges, runs the risk that the govern-ment does its sums wrong and set the tax too low. Pollution is then higher than intended andmay be disastrous.
Regulating the total quantity of pollution, with spot checks on compliance by individualproducers, is a simple policy that avoids the worst outcomes. However, by ignoring differencesin the marginal cost of reducing pollution across different polluters, it does not reduce pollutionin the way that is cost-minimizing to society.
Lessons from the United States
The US has gone furthest in trying to use property rights and the price mechanism to cut backpollution efficiently. The US Clean Air Acts established an environmental policy that includesan emissions trading programme and bubble policy.
The Acts lay down a minimum standard for air quality and impose pollution emission con-trols to particular polluters. Any polluter emitting less than their specified amount gets an emis-sion reduction credit (ERC), which can be sold to another polluter wanting to exceed its allocatedpollution limit. Thus, the total quantity of pollution is regulated but firms that can reduce pol-lution cheaply have an incentive to do so, and sell off the ERC to firms for which pollution reduc-tion is more expensive. We get closer to the efficient solution in which the marginal cost ofpollution reduction is equalized across firms.
When a firm has many factories, the bubble policy applies pollution controls to the firm asa whole. The firm can cut back most in the plants in which pollution reduction is cheapest.
Thus, the US policy combines ‘control over quantities’ for aggregate pollution, where therisks and uncertainties are greatest, with ‘control through the price system’ for allocating effi-ciently the way these overall targets are achieved.
Chapter 15: Welfare economics
273
273
Experts in the emerging market for climate-friendly
investment fear a key scheme to cut the amount of
carbon dioxide (CO2) reaching the atmosphere
could fail. The controversy centres on the EU Emis-
sions Trading Scheme which comes into force next
year and forms a central plank of the policy to meet
the targets set by the Kyoto climate change agree-
ment. Most countries are still well adrift of those tar-
gets which require EU emissions to be 8 per cent
below 1990 levels over the period 2008 – 12.
Adapted from BBC News Online, 30 April 2004.
A market in emission permits should create a financialincentive to invest in cleaner technology. But such asystem will only work if the price of permits is higherthan the cost of investing in lower emission productiontechnologies. The concern at present is that govern-ments within the EU are oversupplying permits to busi-ness, leading to an excess supply and a fall in the priceof permits. For 2004 Italy has provided permits which
are 111 per cent of total CO2 emissions in 2000. As aresult the forward market in permits fell from m12 pertonne of CO2 to m6 per tonne.However, there are other considerations. The UK gov-ernment has suggested that it will restrict the supply ofpermits to the extent that the UK more than meets itsobligations under the Kyoto agreement. However,business is concerned that the resulting higher price ofemission permits will place UK business at a significantcosts disadvantage to its EU rivals.
Country CO2 emissions (tonnes per capita)
UK 9.3France 6.3Germany 10.5Italy 7.3Netherlands 11.0Czech Republic 12.0
Source: OECD
BOX 15-3 EU climate targets in trouble?
prelims 10/11/05 1:31 pm Page xxv

xxvi
Technology to enhance learning and teaching
Visit www.mcgraw-hill.co.uk/textbooks/jobber today
Online Learning Centre (OLC)
After completing each chapter, log on to thesupporting Online Learning Centre website.Take advantage of the study tools offered toreinforce the material you have read in the textand to develop your knowledge of economics ina fun and effective way. A range of resources areof fered providing revision tools and exampractice.
The new edition provides the complete package of materials for students of economics:
� Additional case studies with exercises – new cases in economics with questions enablestudents to apply and anlayse concepts from the book.
� Chapter-by-chapter student test questions – to check understanding of key topics andideas with progress tests online.
� Interactive exercises including animated graphs – to demonstrate how economicmodels work in practice.
� Crossword quizzes – to test knowledge of key terms in economics with interactivepuzzles.
� Web links to a wealth of economics sourcesavailable online.
� Learning objectives – to check thatcomprehension of the concepts explained ineach chapter.
� Glossary of technical terms and morelearning tools, all available with the book.
Visit the OLC at www.mcgraw-hill.co.uk/textbooks/begg for access to all these materialsfree with every student purchase of the textbook.
Visit www.mcgraw-hill.co.uk/textbooks/begg today
Resources for Students
prelims 10/11/05 1:31 pm Page xxvi

Technology to enhance learning and teaching
xxvii
xxvii
PowerWeb
Free with this book you will receive a pass card that contains a password for PowerWeb. Byentering the password into the Online Learning Centre, you will be able to access a subject-
specific online database containing carefullyrefered articles and daily news feeds abouteconomics topics.
PowerWeb is perfect for researchingessays and assignments, keeping in touchwith current af fairs and seeing how thetopics you have learnt apply to economics inthe real world. Ideal for expanding yourknowledge of up-to-the-minute economicsstories and issues – free of charge.
Workbook to accompany Begg Economics Eighth Edition
ISBN 0077107802
Would you like access to a range of extraquestions, exercises and examples to help youget to grips with economics? The workbookaccompanying this book provides a range ofextra assessments and questions that canhelp you to practise your skills in economicsand prepare for the exam. Tailored to thebook, it is a comprehensive and invaluabletool to help you pass your economics module.Visit www.mcgraw-hill.co.uk for moreinformation and to purchase a copy.
prelims 10/11/05 1:31 pm Page xxvii

Technology to enhance learning and teaching
xxviii
xxviii
Study skills
Need help with exams, essays,assignments or research projects?Open University Press publishesguides to study, research and examskills, to help undergraduate andpostgraduate students through theiruniversity studies.
Visit www.openup.co.uk/ss/to see the full selection.
Computing skills
If you would like to brush up on your computing skills, we have a range of titles covering MSOffice applications such as Word, Excel, PowerPoint, Access and more.
Get a £2 discount off these titles by entering the promotional code app when orderingonline at www.mcgraw-hill.co.uk/app
Online Learning Centre: Lecturer Area
Lecturers can find a range of resources and tools to support their teaching at the OnlineLearning Centre Website. a test bank of questions is also available on CD-ROM.
� Access to PowerWeb, a topic-by-topic database of economics articles and news storiesfor access to regularly updated material for teaching and for students’ independentresearch.
� Lecturer Manual of teaching tips for delivering a principles of economics module.
� Lecture presentations in PowerPoint for use in lectures, seminar or handouts,including all of the graphs and diagrams from the textbook.
� A variety of extra exercises, case materials and ideas for teaching principles ofeconomics.
A CD-ROM test bank of questions is also available for use in generating multiple choicequizzes for progress tests and for creating more formal assessments.
To access all of the Online Learning Centre student resources, and to contact yourMcGraw-Hill representative, simply visit the website at www.mcgraw-hill.co.uk/textbooks/begg and follow the instructions to register for a password.
Resources for Lecturers
prelims 10/11/05 1:31 pm Page xxviii

Primis content centre
Can’t find the perfect book for your course? Ifyou need to supplement your course withadditional cases or content, create apersonalized e-Book for your students. Visitwww.primiscontentcenter.com or [email protected] for moreinformation.
Technology to enhance learning and teaching xxix
prelims 10/11/05 1:31 pm Page xxix