economics of greenhouse tomato production in the...
TRANSCRIPT

ECONOMICS OF GREENHOUSE TOMATO PRODUCTION IN THE SOUTHEAST Robert G McElroy Jomes E Pallas Jr Warren K Trotter
ECONOMICS STATISTICS AND COOPERATIVES SERVICE ESCS-02 Us DEPARTMENT OF AGRICULTURE
BIBLIOGRAPHIC OAT JL R~po la 3 I~cjricn bull 4ccuioo No SHEET ESCS-02 ~_ Tule~J Sub(id~ 5 lIopalt lJ~
ECONOMICS OF GREENHOUSE TOMATO PRODUCTION IN TIlE SOUTIlEAST March 1978 1 Aurh1 B I~(omin~ O~i74ion R~p Robert G lkEiroy James E Pallas Jr bull mld arren K Trotter -gt0 ESCS-02
9 P~(ormi~ Uniuian Nam anJ Add 10 PoiooTkWo~ UniL No National Economic A1alysls Division Economica Statistics and Cooperatives Service 11 ConaeGrn No US Department of Ag~itul[u~e
Washington D C 20250 IJ T)pe of Repellt llt 10ltgtlt1
t~orod
Final--1969-77
u
16 ~bc Greenhouse tomato aereage in the Southeast inerensed nearly 700 percent bet~een 1969 nnd 1974 An average operation consisted of 8000 square feet covered with polyethylene Up to three eraps can be grovn Ylarly but two crops (spring and fall) give higher net returns lnvernmeat coats for four 2OOO-square-foot pL~gtic greenshyhouses were approximately $28000 in 1977 Total annual costs for this size operashytion with tWO crops auld be $]8117 Using gloss or fiberglass woulll increase the cost Recent taste [lstS ho~ a preference for greenhouse tomatoes over- field-grovn Florida tomatoes suggesting a higher market price could be corrunanded
17 Key IJ onJ Pctln An~hmiddot bull 11 Ilerrrmiddot
Tomatoes Product development Greenhouses COllt engineering Farm buildings Cost effectiveness Horticulture Polyethylene Vegetables Glass Economic analysis Fiberglass reinforced plastics Investments Marketing Market research Harket value
17b 1nlllrerorenmiddotEndltd Tor_
Greenhouse tomatoes Field-grovn tomatoes zz Current IlTIS prices areFlorida Paper $450Gardening Fiche SJOOTUllte tests Prices 8ubjeet to change Contact NTIS Southeast for current price list Price codes
170 lt Ski I IJrIJ lt1 02-B 02-D 06-H will be AO) for paper AOl for fiche
LB A dfull ~r~ bullbull t After in tilll dis tribllt ion copies 19 ~( )- Cl~slt (ThRmiddotp I
viII be for sale only by National Technical Informn-IN~cS1~~middotH1~-__~cC2-____ _ tion Service 5285 Port Royal Rood I SprinGfield I Va r r n~ r rillS n 10 22161 I~~SCUSSIFII-D See above
llilS Hl~M liAr JlE RIoPRODlItEU
CONTENTS
Summary bullbullbullbullbullbullbullbullbullbullbullbullbullbullbullbullbullbullbullbullbullbullbullbullbull iv
Introduction 0 bullbullbull 1 Market Patterns 3 Taste Panel Tests 3
Management Systems and Break-even Analysis 7 Costs 8 Esfimated Profits and Break-even Points 8
Economics of Other Producing Regions bullbull 14
Furtl1er Cons-iderations middot0 bullbullbullbullbullbullbullbullbullbullbullbullbullbullbull 15
References 1700 bullbullbullbullbullbullbullbullbullbullbull bullbullbullbullbullbullbullbullbullbullbullbullbullbullbullbullbullbullbullbullbullbullbull
19Appendix bullbullbullbullbullbullbullbullbullbullbullbullbullbull
Use of brand names in this publication is for identi shyication only and does not imply endorsement by the US Department of Agriculture
ACKNOWLEDGMENT
The authors wish to thank Joseph E Burnside Jr and th~ Rural Development Center Tifton Ga for support of the horticultural iesearch on which most of this report is b~~eCi
On Jan~aryl 1978 three USDA agencies--the Economic Research Service the Statistical Reporting Service and the Farmer Cooperative Service--merged into a new organshyization the Economics Statistics and Cooperatives Service
This report was written prior to a recent reorganizashytion which placed the Agricultural Research Service CARS) in a newly created Science and Education Administracion (SEA) All references in this manuscript to ARS chereshyfore relate co SEA
iii
SUMMARY
Average annual costs of establishing -a new small-scale greenhouse tomato operation (8000 square feet) in the Southeast va-ry from approximately $11000 to $20000 depending on struCtu_ral desigI1 and cropping schedule Highest entrepreneurial proJi__ts are realized with a polyetllylene-eovereci -house growing bot~ fallatid spring crops
Operations of a_rgund 8000 square feet are common in ~h-e Southeast in contra~t to muell larger operations -in the Indiana-Ohio area The industry is -well established in the Northeast but has orily rece~tly developed in the Southeast where growth has been quite rapid
Ri~~ng fuel costs and lack of marketing expe~~ence are the main gro~ers I p~()blems The wide difference Ln producer costs between Florida-grown field tomatoes and greenhouse ~omatoes limits the market for the greentJouse product Recent taste tests however show consumer preference for greenhouse tomatoes
Greenhouse tomato growers should e_s~ablish marketing channels before beginning production AmSlTIg the ma~keting possibilities are direct growerretailer sales roadside stands a~d route sa)_e-s To be successful the grower must understand the many facets of the business have managerial skills and patience and wor~ hard
March 1 ~78
ECONmncs OF GREENHOUSE TOMATO
PRODUCTION IN THE SOUTHEAST
Robert G McElroy James E Pallas Jr
Warren K Trotter
INTRODUCTION
Annu~l per capita consumption of fresh tomatoes is exceeded f)ly by ~hat- of lettuce and potatoe among fresh vegetable productsil Consumption of fresh tomatoes remained fairly contant at around 12 pounds (54 kg) between 1965 and 1975 al~_h9ugh processed tomato ketchup an-d t_(Hnato sauce consumption increased This situation nowever reflects only connnercial production the popularity of home gardens -would increase the total In this paper discussion is limited to fresh tomatoes although processing-type tomatoes could also be grown in greenhouses
Interest in greenhouse tomato production in the SOutheast has been stimulated by several factors Aggressive- promotion by greenhouse manufacturers is one factor but claims made by advertisers as to the profitability of a greenhouse operation are frequent-ly e~aggerated For example a recent ad read -- $40000 per year net income with only five greenhouses less than one acre of land and nine hours per week per greenhouse (~) ~ A net income of approximately $40000 requires a beJ9re~tax income of $64000 Considering current cos ts and tabor requirements as presented later in this report this would anmi~1-1y require nearly 14 acres and over middot15000 labor hours (for just 8 months production)
Another factor is the iilterest in alternative enterprises for rural development The Agricultural
l Although the tomato is botanical-ly a fruit it is customarily classed with vegetables in US agriculture
l) Underscored numbers in parentheses refer to reference items at the end of the report
1
Research Service (ARS) u S Department of Agric~Jture (USDA)- at Ci-emso~ SC is conducting research in the area of greenh6use-residence combinations Thcent Rural Development Center at Reidsville Ga is working with rural families in growing greenhouse tQmatqes forthe Savannah market
The industry appeals to retirees and others -looking for a part-time source of income Since greenhouse_ tomatoes are typically grown during the wi_nter when 0 tIter crops require minimal attention many small farmers see this as an opportunity to mor~ ~ully utilize their time in an off season
The greenhouse tomato has been gro_wTI in the -North Central United States since the beginning of this century (2) Before the developmerit 01 modern efficient t~ansportation it provided the only supp~y of fresh tomatoes in the area du_ring the late fall and winte_r Competition is nO- more keen from field-grown to~toes from Florida and Mexico but the longtime accepcance of the product continues
In the Southeast the industry is relatively new but growing Between 1969 and 1974 tile area under pr_oduction of gre~nhouse tomatoes in the Southeast (North Csectlrolina Kentucky Georgia Alabama ~ssissipp~ Tennessee Virginia and South Carolina) increa~ed approximately 700 percent (9 12) lJorth Carolina is the leading fiouthern State with an-estimated 14 million square feet (130000 square meters) devoted to the crop lt~) Growers in North Cardlina use amiddot low cost structure and fuel oil heating
Rising fuel costs present a major problem to t_he grmvers The lack of marketing experie_rice by growers is another problem Due to the_e and other factors many people who try 10 c-ofnmercially produce greenhouse vegetables are not successful In an attempt to better deal with the~e
problem growers are asking their State experiment statiilns and ARSUSDA Eor help
Ongoing research at several southea-stern centers is concentrating on these probleTItS Scientists at the ARS Southern Piedmont Conservat-ion Research Center Watkinsville Ga are deveipplng cultural pract-ices to recommend for this area The University of Georgia is working on a similar project In Alabama the Tennessee Valley Authority is experimenting with heating greenhouses using heated waste water frq~ power generating plants Solar energy co(ve_rsion for ~supplemental heat is being tested in Florida South Ca~olina and other States
2
This report presents the resu~ts of economic research un~erta~en in cooperation with the Agricultural Research Service the primary objectiveof the report is to develop basic economic guidelines for plant science research on greenhouse vegetables and to provide benchmark data for
those involved in the industry Specifically this includes
1 Determining the pattern of seasonal variation in market prices for selected southeastern markets as a basis for determining most favorable marketing seasons
2 Evaluating seasonal changes in the or1g1ns and volume of market supplies for selected southeastern markets and
3 Est ima ting break-even pr_ices under al terna tivel managentent systems and for different type structures and evaluating their sensitivity to wage rates and average yields
t1arket Patterns
Greenhouse toma toes grown during the fall middotJinter and spring m~nths must compete for a share of the market with the mature green and vine-ripe field-grown tomatoes from Florfda Hexico and California During the summer months locally grown field tomatoes mal~e up the largest share of local markets The sources of supply of fresh tomatoes in the two major southeastern markets are shown in figure 1
Average wholesale prices for field-grown tomatoes for these markets are snown in figuremiddot 2 1ITO periods of high prices are evident a winter high from November through January and a spring high from April through July Data are not kept ori monthly prices for greenhouse tomatoes in the Southeast but f~om figure 2 it can be seen that the greenhouse grower should harvest during these high-price months to better compete in the market
Taste Panel Tests
Field-grQoffi tomatoes for shipping to distant markets are generally of two classes depending on their stage of maturity at harvest These are mature green and vine-ripe which are predominant in Florida and Mexico respectively Mature green tomatoes are harvested in the green stage and
J
Figure l--Tomato unloads by point of origin 1975-76
Atlanta CAR LOTS OF 36000 LBS New Orleans 60
iOth
120 rv1exico
shy Florida
80
40
0 f- gt Z m c c gt- Z J ~ f- gt Z m c c gt- Z J ~0 w w ~ w 0 w w ~ J w
~ 0 Z 0 ~ ~ ~ ~ ~ 0 z 0 ~ ~ ~ ~ USDA NEG ESCS 2982-78 11)
bull bull bull
~
Figure 2--Wholesale prices for field grown tomatoes 1970-76 average
CENTSLB
36
34
32
30
28
middot middot middot middot middot middotbullmiddot middotbullmiddot middot middot middot middotbullmiddot middot bullbull middot middotbullmiddot
middotbullbull middotmiddotbull ~ bullmiddotbullmiddot middot middotbullbullbullmiddot middot middot middot middot~ middot middotbullmiddot
26
_Atlanta
bullbullbullbullbullbull New 0le8ns
24
22
middotbull bull middot ~
middotmiddot middotbull middot middotbullmiddot middot middot middotmiddot middot middot middotmiddot middot middotmiddot middotmiddotmiddot middotmiddot middotmiddotbullbull middotmiddotbullbull
bullbullbullbullbullbull
bull
SEP OCT NOV DEC JAN FEB MAR APR MAY JUN JUL AUG
USDA NEG ESCS 2983-78-(11
5
I ~
ma~y are then treated with a hormone C2-Chloroethyl- I phosphonic acid) to hasten ripeni~g Vine-ripe tomatoes are generally hBrvested when they just -begin to change cOldr Both classes can withstand the handling and time requir1ed to ship long distances The greenhouse tomato is harveste1d at almost full ripeness However this makes it more perishshyable arid normally limits the distance it can be shi-ppe~ to market
I I
Ttvo tests were conducted by the USDA at the Richard B Russell Agricul tural Research Center Athens Ga to I determine if there was a discernible taste difference between field-grown and greenhouse tomatoes One test ranked 18 varieties of greenhouse tomatoes by characteristics (acidity sweetness firmness of flesh and toughness of skin) and the second ranked five samples (one field-grown and four greenhouse var-ieti~s) by taste preference
In testing the greenhouse and field-grown tomatoes sample selection and preparation were as fol_lows
The commercial field-groWl- samples were obtained from the State Farmers1 Market -in Atlanta These had been grown in Florida ~and Mexico and shipped greet) to the market I The samples remained at room temperature to ripen for evalua tion Greenhouse samples were harvested as breakeirs
70(beginning to turn red) and kep-t at C unt~il they were evaluated On the evaluation day individual fruits wer~ selected from each variety accordirig to transmittance I
readings 00 a Heotec -
Rephobiospect A range of 015 to 030 - I
was selected as the coIor~ange that best corresponded to rip-eoess characteristics as de~ermined subjectively by I experim~nteis Many factors determine optimum ripeness Interna1 c-olor transmittance provides an objective means of selecting fruits of consistent internal color Panelist~
bull - bull i
ranked the samples 1 = best to 5 = worst The results are shown in table 1
The tast~ tests indicate that consumers prefer the greenhouse toma toes over field-grown tomatoes For the greenhouse tomato to sell though it must be visually I distinguishable by the consumer Tradit-ionally the calyx (st~m) _has been left on the fruit More recently individual stickers identifying the product have been affixed to tIfe tomato similar to the br~nd stickers seen on some bananas
6
Table l--Sum of ~anks and mean ra_nkings for taste test of greenhouse and commercial tomatoes
Sample Number Sum of Overa-llMean(cultivar) in sample rank rank
Rapid lJ 30 70 2 33 1
Floradel lj 30 71 2 37 2
Super X 11 30 72 240 3
Tropic II 30 99 330 4
halter 21 30 138 460 5
11 Greenhouse variety II Commercfal field variety
MANAGEMENT SYSTEMS AND BREAK-EVEN ANALYSIS
Gre-enhouse tomato produc tion in the Southeast is typically a small enterprise An average greenhouse operation includes four houses of approximatley 2000 square feet (185 square meters) each with newer houses usually covered with polyethylene or fiberglass (sect) These houses are principally one of two general designs quonset shaped ui-ing -gaJvanized steel pipe as framing and ridge and furrow shaped using either wood framing for plastic houses or aluminum for glass houses The quonset house is the less expensive and easier to set up
Approximately 500 plants would be found in a typical house of -2000 square feet In most areas of the Southeast peat moss or pine bark mixed with vermiculite is frequently used as a growing medium Researcl has SltOWTI that two beds of 5 to 6 feet each in width with four rows of plants produce maximum yield (8) and maximize bed space with respect to wal1-ways Ohio studies (2) recommend 8-11000 plants per acre (20-27000 plants pe~ hectare) at 500 plants per house this averages 10890 plants per acre
7
Cropping sChLulCS usually found are one crop per year (spring) and two crops per year (spring and fall) Fall crops are typically set in the houses in September and harvested pound)orn mid-October through December Spring crops are set in Janu-ary and h~rves ted from Harch into July These two cropping sche~ules in addition to the choice of house design make up management systems from which the grower must plan his operation
i In this study each of the above management systems was
considered and ~h~e1 comp~redmiddot Profitability of -each system was determined by deriving current costs Input coefficients from ARS research along with prices from northeast Georgia l sources were used in sefting up the budgets
Costs
Table 2 shows I the production costs for an BOOO-squareshyfoot operaton Except for the polyethylene when it is used as a covering th~s~ costs are applicable -to all systems Since the useful rife of polyethylene is normally just 1 ye_ar it is considered a production cost while fiberglass aild glass are considered fixed costs
Table 3 gives the estimated iriitial capital investment required for the rpodel plastic greenho~se operation These data are blt~sed on Ia survey of grmvers in the Te~n_essee Valley items d~r~ctly related_ to the number of plants (eg string and lclips) are adjusted to ref-lect the number of plants used inthis r~port With the exception of the strueture itself a1l items are applicable to each system It should be noted that this schedule depiets a complete modern ope~~tion ~t new costs
Assuming an interest rate of 85 percent on half of the investment for boih capitai a-hd produc_tion costs 40- percent tax assessment at 30 milis 05 percen~ for insurance and 1 pereen~ for repairs enterprise budgets for each syst~em and cropping schedule lean be derived as shown in table 4
Estimated Profits and Break-even Poirits
The costs f~orri table 4 can be used to estimate annual before-tax profits and b~~k-even points Examples are shown in table -5and figure 3 In table 5 two cropping schedules are shOn along With th_rEie w~ge rates for each of
8
Table 2--Annual product-ion costs for four 2OOO-square-foot plastic greenhouses June 1977
Spring Spring Inputs crop amp fall
only crops
Dollars
Medium 1) Pine b_ark vermiculite and dolomite 807 1614 Fertilizer (5-10-15 and 0-20-0) 14 27
Covering (4M polyethylene) Lining for beds 32 32 Double layer covering 128 128 Labor 70 70
Seedling production 138 245
InsecticJde an~J fungicide 230 460
319 639
Heating fuel (LP-gas) Spring crop 2722 2722 Fall crop 1705
Electricity 589 982
Labor $250hr Production 1900 3800H~rvest and grading 750 1500
Total 7699 13924
iJ Planting medium l-ife has not been fully determined The ARS greenhouses in WatkinSVille Ga still have their original medium (6 crops in J years) Themiddotannual costs here represent this life of 3 years for the medium Quantiti~s of the i-rtgredients are based on ARS research and are sirilishylar to those discussed in (~)
9
Table 3--Capital requirements for four ~OOO-square-foot pla~tic greenhouses -19Z7
Item
Structure (pipe lumber etc)
Construction labor
EJJectrical and plumbing
Heating (gas heaters)
~ater system (pump well etc~
Humidi~y control
Cooling unit
Crop growing equipment
Eight fans
Four fan jets and center tubes
Motorized shutters for ventilation
String and clips for plant support
Bed frame
Freight
Other
Total
Inifial cosf
Dollars
2000
400
2448
4090
2403
956
1348
387
1238
662
1860
590
1728
1008
288
28406
Useful Annual life cost
Years Dollars
20 100
20 20
20 122
10 409
20 120
10 96
10 135
10 39
10 124
5 132
10 186
5 118
10 173
10 101
10 29
1904
Source (J) plus 44 percent for friflation (from Wholesale Price Index)
10
Table 4--Tbtal annual costs for four 2000-_~quare-foot greenhouses 1977
Cropping schedule
Fixed costs Depreciation Interest Taxes Insurance Maintenance and repairs
Total
Production costs Production supplies Heating fuel Electricity Labor $250hr Interest
Total
Total annual costs
Q~~nset double Qu-onset Ridge amp furroW- plastic coyer flberg1ass cover glass cover
Spring Spring Spring SPIing amp Spring amp Spring amp
fall fall fall
Dollars
1904 1904 2384 2384 2651 26511207 1207 1403 1403 1913 1913
341 341 396 396 540 540142 142 165 165 225 225284 284 330 330 450 450
3878 3878 4678 4678 5779 5779
1669 3163 1508 2985 1508 29852722 4427 2722 4427 2722 4427
589 982 589 982 589 9822720 5370 2650 5300 2650 5300
164 297 159 291 159 291
7864 14239 7628 13 985 7628 13985
n742 18117 12306 18663 13407 19764
~
Price per
pound
40
45
50
55
60
65
40
45
50
55
60
65
40
45
50
55
60
65
Spring crop
Plastic
-1442 -142
1158 2458 3758 5058
-2082 -782
518 1818 3118 4418
-2722 -1422
-122 1178 2478 3778
Table 5--Estimated annual entrepreneurial profits (dollars)
only 13 1bs (59 kg)p1ant Spring and fall crops 21 1bs
Fiberglass Glass Plastic Fiberglass
Wage rate $200hr
-2076 -3177 -1087 -1703 -776 -1877 1013 397
524 -577 3113 2497 1824 723 5213 4597 3124 2023 7313 6697 4424 3323 9413 8797
Wage rate $250hr
-2716 -3817 -2267 -2883 -1416 -2517 -167 -783
-116 -1217 1933 1317 1184 83 4033 3417 2484 1383 6133 5517 3784 2683 8233 7617
vage rate $300hr
-3356 -4457 -3447 -4063 -2056 -3157 -1347 -1963
-756 -1857 753 137 544 -557 2853 2237
1844 743 4953 4337 3144 2043 7053 6437
-- bull
(95 kg) p1ant
Glass
-2804 -704
1396 3496 5596 7696
-3984 -1884
216 2316 4416 6516
-5164 -3064
-946 1136 3236 5336
Figure 3--Break-even prices and yields for greenhouse tomatoes wage rate = $250 per-hour in plastic house)
CENTSLB
75 r---------------------------------------------------------------------------~
50 2 CtopsYoar
gt-shyw
1 CropYear
25
a 10
USDA
12 14 16 LBPLANT SPACE
18 20 22 24
NEG ESCS 2837-78 III
the three- structures~ The profits are the retur_l_s exp_ected at each price For examplcent f~r one crop annually in the pl~st-ic house at a wage rate of $250 per hour and an averlge annual yield of 13 pounds per plant negative profits are shown at prices of $45 per pound and less while $50 per pound are required for positive profits (to the nearest $05) For two crops per year the yield per plant is the total weight for both crops (yield per space occupied by one plant) Tomato prices in the two-crop schedule1are average prices for both crops (each crops price weighted by that crops percentage of its average yield to total annual yield)
It may be 61 interest t9 d~tehnine a~ just whatmiddot price (or w~ge ate or yield) the operation will break even in figure 3 (data from table 4) the curves shm the minimum price required for various yields so as not to lose money (break-even points)
Th~ TI)e~hod5 for deterin~riirig profits and break-even point~ are presented in the appendix Readers can estimate their own equations if their costs differ remarkably from those- presented here following the procedure in tbe appendix
ECONOMlcCS OF OTHER PRODUCING REGIONS
The costs of establishing a new greenhouse toma_to operation irt the Southeast are high and producers frequently are unable to recover these costs This situation appears to be nationwide
Dhillon and Kirschl_ing (~) expanded ~ 1969 survey_ of gro_wers in New Jersey to estil1ate cost and prof-it functions At that time the indu-strYwas very small in the State but has gr6wn considerab~y since The break-even price at that time for a plastic greenhouse with one crop permiddot year 13 pounds of tomatoes per plant and wages of $250 per hour was $48 per pound Product~on metnods have probably become mor~ efficient in the 8 years since this survey but costs of (tiel ~nd chemicals have nearly doubled so the break-even price has probably not decreased much if any
Ohio was the largest ~single greenhouse tomato grower in the United States with 57 percent of the tota-i greenhouse area in 1969 the date of the last agricultural census Growers have had successful operations there for 50 years A i972 survey of Ohio growers is reported by Duvick anltl
14
~
11
Short (4) where average costs and returns are also presented Extrapolating these data to the size of greenhouses in the Southeast and to 1977 costs shows production co_sts of $12000 for a glass greenhouse with two crops per year Average depreciation expenses in the report are $750 which would probably explain why Ohio growers are still prof-iting This is less thanone-third what one would expect and shows that in the survey many growers_ have already paid off their capital costs It is unclear as to how many Ohio gr-eenhouse operators would be in business today if 1hey we_re amortizing establishment costsmiddot at todays prices Ohio showeq a 33 percent decrease in the number of producers between 1959 and 1969 perhaps due in part to the high cost of neltl construction
The desert Southest is another area where greenhouse tomato produc~ion J1~s shm-m promise Capital costs are about the same as in other parts of the country but heating requirements are less On the other hand markets are distant so shipping costs are higher
FURTllER CONSIDERATIONS
This report presents the economics of greehnouse tomato production in the Southeast This form of agriculture is a very demanding and expensive operation A final consideratiol by anyone concerned with greenhouses whether growers extension personnel or policymakers should be the existence of sales 6~tlets Hith annual grower costs for Florida winter tomat~~s averaging between $14 and $19 per pound (1) and greenhouse tomatoes averaging over $40 per pound promoters and prospective operators should carefully evaluate the market before investing in the business ]j
Marketing the crop is the area in which most greenhouse operators fail A thorough understanding of the marketing channels available is a necessity when promoting any form of greenhouse operation Among the usual options are wholesalers retailers roadside or farm stands and doorshyto-door rou tes
Produce wholesalers complain that in order to handle abull product a steady supply must be available Individual
1 Figure 2 shows how timing of greenhouse toma to production and sales could help compensate for this cost differential
15
greenhollse tomato growers frequently cannot guarantee this thus wholesalers may not want to add the item to their inventories Therefore growers should visit several wholesalers before assllming any Itlholesaler will buy the crop
Small producers might well consider selling direct to retailers Surveying produce managers in local supermarkets is highly recommended for those choosing this option Marketing through local stores has the advantages of not requiring distant delivery and smaller quantities are usually preferred by the stor~
Direct selling to the public is a frequently chosen method In considering this method sales costs both in real terms and in lost opportunity time for other endeavors should be considered
A combination of sales outlets can also be employed ~fuichever is chosen the additional costs of selling [lust be considered These include transportation time and any storage required Liner and Banadyga (~) give a rough figure of 5 cents per pound to estimate the cost of getting the fruit from the grower to the buyer For an individual who sells his product at the farm and has little or no alternative use for his labor this estimate is probably high On the other hand it is low for someone who only operates a small business and delivers to his customers
In conclusion the intensity of greenhouse culture is unlike anything else in crop agriculture and requires great managerial skills patience and hard work from the farmer Opportunities do exist for someone willing to devote the time to establishing marketing channels and managing the many facets of the business
I
16
REFERENCES
1 Brooke Donald 1 Costs and Returns from Vegetable Crops in Florida Season 1975 76 with Comparisons Gainesville Fla Dept of Food and Resource Econ Univ of Fla 1977
2( Brooks William H GrmJing Greenhouse Tomatoes in middotOhio 9oop Ext Servo Publication SB-19middot Columbus Ohio Ohio State Univ 1973
3 Dhillon PS and PJ Kirschling Profitability of Tomato Production under Plastic Greenhouses AE 335 New Bniri~jviick NJ Dept Agr Econ and Mktg Rutgers Univ 1971
4 Duvick Richard D and wn Short Ohio Greenhouse Tomato Summary 1972 Crop Year Econ and Socia OccasioIl_al Paper No 215 Columbus Ohio Ohio State Univ 1974
5 Georgia Farm Bureau Federation Georgia Farm Bureau News vol 36 Macon Ga 1974
6 Liner II L and AA Banadyga Costs and Returns from Producing Greenhouse T6matoes in North Carolina Agr Ext~ Ser Cir 558 Raleigh NC NC State UniI 1974
7 Ringling Je Jr and Carl E Madewell A Comparison of Two Greenhouse Tomato Propuction Systems in the Tennessee Valley Muscle Shoals Ala unpublished TVA Management Intern Rpt Agr Resource Develop Br TVA 1973
8 Spivey CD et al Growing Tomatoes in a Protective Structure Coop Ext Ser Leaflet 184 Athens Ga Univ of Ca 1974
9 Tennessee Valley Authority unpublished survey of State experiment stat-ions regarding greenhouse acreages in the Tennessee Valley 1975
) 10 US Department of Agriculture Fresh Fruit and
Vegetable Unloads in Southern Cities FVUS-3(1976) Agr Mktg Serv 1977
17
11 Fresh Fruit and Vegetable ~fuolesale Narket Prices Agi Mktg Ser ~varlous -years
12 US Department of Cornm~rce Crops Nursery and Greenhouse Productsmiddot For~st ~roducts 1969 Census ofII
Agricultuie vol II chap 6 1973
18
APPENDIX
Derivation of Profit and Break-even Equations
JO derive a profit equation total costs (TC) were broken into three categories
(1) Fixed costs (Fe) include depreciation of the capitalgoods interest on capital investment taxes insurance and maintenance and repair Total fixed costs do not depend on the cropping schedule (For the plastiC greenhouse total annual fixed costs equal $3878)
(2) Crowing costs (Ge) include production expenses interest on production expenses and the value of the labor required to grow the crop If 760 labo-r hours are attributable to growing each crop total annual growing costs for the plastic greenhouse in terms of wage rates equa-shy
$4980 + 164 + 760w = $5144 + 760w (for the spring crop) and
$8572 + 297 + l520w $8869 + l520w (for two crops)
(3) Harvesting and packing costs (HPC) vary wtth the number of plants grown and the yield per plant They are the total of the harvest labor requirement (in hours) times the hourly wage rate plus the packing cost Harvest labor equals the hours required per pound picked times the number of plants times the yield per piant packing cost equals the cost per pound t-imes the number of plants times the yield per plant1
Assuming 2000 plants are grown per -c~op two hours are required to pick and pack 100 pounds (1) and containers cost $150 per 100 pounds of tomatoes the harvesting and packing cost per crop for each system is
(02) (2000)yw + (01) (2000)y = 20(2w+l)y
where w hourly wage rate in dollars and
y annual yield per space occupied by one plant (pounds)
19
Summing the three components gives the total cost (TC)
TC = FC + GC + HPC
which in terms)
the case of the plastic greenhouse gives (combining
TC $9022 + 760w + 20(2w+1)y (for the spring crop) or
$12747 + 1S2Ow + 20(2w+l)y two crops)
(for
Total revenue (rR) is equal to the amount of production in pounds times the average annual selling price This may be expressed in terms of variable yields and prices as
TR = 2000yp
where y = total annual in pounds as
yield per plant before and
p average annual selling price This function assumes only one grade of fruit
Entrepreneurial profits (IT) difference between total revenue
are and
defined as the total cost
n = TR - TC
or in simplified form plastic greenhouse-shy
for the data in the model and the
n = 20(100p-2w-l)y - 760w - $9022 (for the spring crop) or
20(100p-2w-l)y - 1S20w (for two crops)
- $12747
The break-even point is computed by setting the profit function equal to zero and solving for the desired variable For example the break-even price for the plastic greenhouse and one crop per year is $048 per pound and is based on the equation
1 p = y(J8w+4S1l) + 02w + 01
I bull
where y = yield per plant (13 lbs)
20
r
w =wage per hour ($250) and
p average annual price per pound
The same equation can be manipulated to show break-even yields andor wage rates However care must be exercised when interpreting results For example the break-even prices in figure 3 are the average annual prices which in the case of both a fall and spring crop would be the average of the fall price and the spring price weighted by the respective yields
21
UNITED STATES DEPARTMENT OF AGRICULTURE ~STAGDHED r~)WASHINGTON DC 20250 us DEPARTMENT OF AGRICULTURE _
AGAO ~ THIRD ClASS
I
i
I
r 1 lj
bull -
J- I ~
~- - ~--~-- middot _ ~- bull -_ -middot-middotmiddot---0shy
-- _---- - - --- --- _
BIBLIOGRAPHIC DATA K~pon No 3 Recipients Accession No[2SHEET PB 278 788 4 fide and Su-middot ~Ie S Report UaH
ECONomclt- OF GREENHOUSE TOMATO PRODUCTION IN TIlE SOUTIlEAST March 1978 6
7 Auchor(s) S Performing Organizarion Re~l Robert G -cElroy James E Pallas Jr and larr-enK Trot ter No ESCS-02
9 Pedorming Orlltanizatiun Name and Address 10 ProjectTaskUorl Unit ~~Q NatJonal Economic Analysis Division Economics Statistics and Cooperatives Service 11 ContractGrant No US Department of Agriculture Washington DC 20250
12 Sponsoring Organization Name and Address 13 Type o(Report amp Period Covered
Same Final--1969-77
15 Supplemeotary Notes
16 Abstracts
gtlt1 Greenhouse tomato acreage in the Southeast increased nearly 700 percent bet~een GJ1969 and 1974 An average operation consisted of 8000 square feet covered with
polyethylene Up to three crops can be grown yearly but two crops (spring and fall) give higher net returns Investment costs for four 2OOO-square-foot plastic greenshyhouses were approximately $28000 in 1977 Total annual costs for this size operashytion with two crops would be $18117 Using glass or fibergiass would increase the cost Recent taste tets show a- preference Eor greenhouse tomatoes over field-grown lodda tomatoes suggesting a higher market price could be connnanded
s- C -00 0 ~ ~SC5
17 Key-Uords and Document Analysis 17arDescrip~[ors ~Tomatoes Pro~ct dvelopment
Gr~nhOUses Cost eng-ineering ~ ~ ~ Fa buildings Cost 7~~ctiveness
Hortj~~lt(lre Eolyethyene veget~~s Glats_~
plastics~~~i~~aiYSiS Fierglassnfrced
Mar~eting Market res~arch ) rl jrl J Mpfket value 71 ( J-- $ L S V(
17b IdentlfiersOp-en~Enaed Terms ~f _~I lJ L2-
Greenhouse tomatoes ~ vr--l Fi~d-grown toma toes --------=----------------
22 Current NTIS prices are Florida Paper $450 Ga~dening Fiche $3pO Taste tests NTISPrices subject to change Contact_ Sou~heast for current price list Price codes
17c COSATI FirJGroup will be A03 for paper AOI for fiche02-B 02-D 06-H 18 vaibbiliy ~IPIItri( After init-ir l distribution copies 19 ~(urity CbssThi~ 21 ~u oi p~(~
Hcpord 26 wi11 be f0 r sale I +-1)--_+--------- shyon 1 y by Nat i 0nal Techn i ca1 Informa - =--LL~il~~middotrlfA~ill F- tion Service 5285 Port Royal Road Springfield Va 20OlaquouY CIUh 22Ielt
Page _See above22161-_________ llNr1lt F I F n
Us DEPARTMENT OF AGRICULTURE ESCS-02 ECONOMIcs STATISTICS and COOPER~TIVES SERVICE
WASHINGTONOC 20260
Jnoun l j 11 bull bullbullbull
ECONOMICS OF GREENHOUSE TOMATO PRODUCTION IN THE SOUTHEAST by Robert G McElroy James Ebull Pallas Jr and Warren K Trotter National Economic Analysis Division Economics Statistics and Cooperatives Service US Department of Agriculture NTIS Accession No PB 278 788 26 pp bull
This publication is now available only from the National Technical Inforshymtion Service (see address below)--Gurrent cost for this publication is $450 each paper copy and $300 each microfiche (NTIS prices sUbject to change after September 30 1978) Price codes wili be A03 for paper copy and AOI for microfiche Contact NTIS after date shown above for new price schedule
ABSTRACT
Greenhouse tomato acreage in the Southeast increased nearly 700 percent between 1969 and 1974bull An average operation consisted of 8000 square feet covered with polyethylene up to three crops can be grown yearly but two crops (spring and fall) give higher net returns Investment costs for four 2OOO-squareshyfoot plastic greenhouses were approximately $28000 in 1977 Total annual costs ior this siae operation with two crops wouZd be $181-17 Using glass or fiberglass would increase the cask Recent taste tests show a preference for greenhouse tomatoes over field-grown Florida tomatoes suggesting a higher market price couZd middotbecommanded
To order copies of Economics of Greenhouse Tomato Production in the Southeast fi 11 out the order form below and mail to NATIONAL TECINICAL INFORMATION SERVICE 5285 Port Royal Road Springfield Virginia 22161
- - - - - - - - - - - -- - - - - - - - - - - -National TechnicaZ Information Service 5285 Port Royal Road SpringfieZil Virginia 22161
Please send me paper copy(ies) and microfichecopy(ies) of ECONOMICS OF GREENHOUSE TOMATO PRODUCTION IN THE SOUTHEAST byRobert G McElroy James E Pallas Jr and Warren K middotTrotter Current paper copy price i~ $4 50 each (A03) and $300 each for0
fiche (AOI) NTIS prices sUbject to change after September 30 1978
[] Enclosed ismycheck for _________________
Address~____________________~_____ [] I enclose my purchase order formiddot _________
[] Charge to my NTIS acct no
ZIP [] Charge to my N1ERICAN EXPRESS CARD account number (below)
Signat ure _________________________-_ I I I 1 o
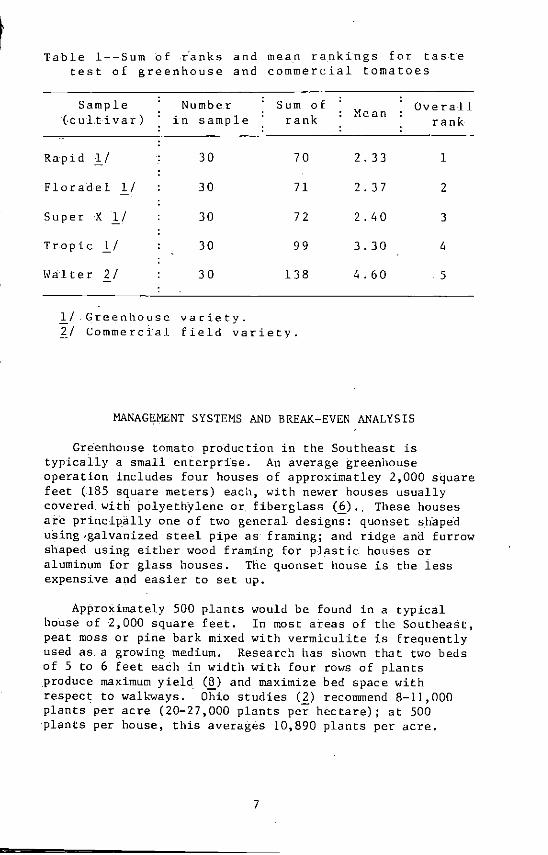
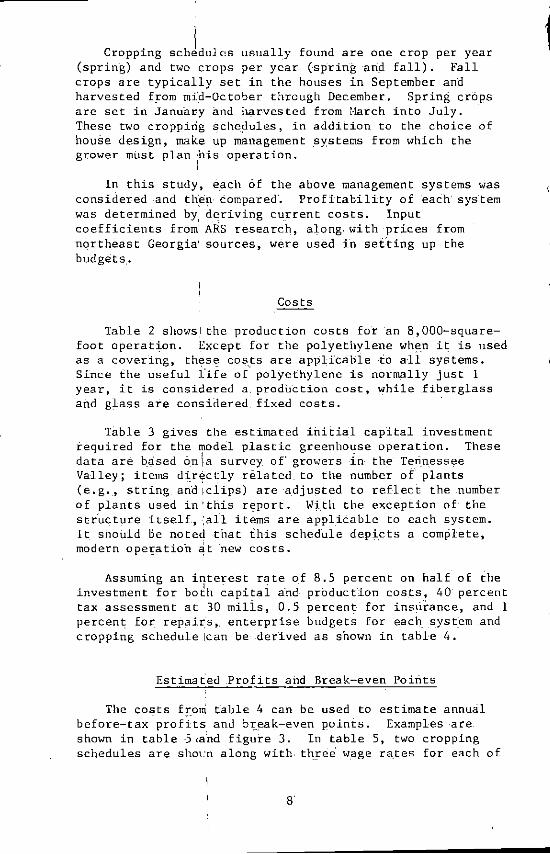
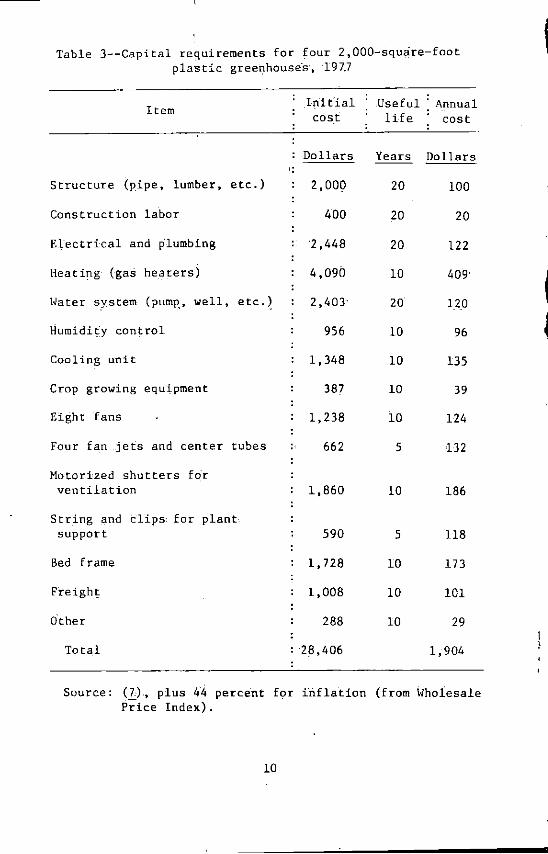
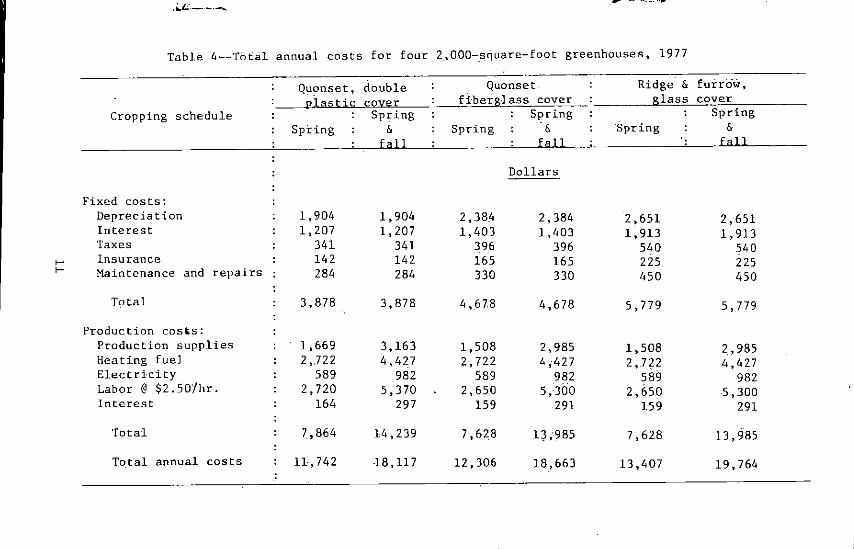

~
Price per
pound
40
45
50
55
60
65
40
45
50
55
60
65
40
45
50
55
60
65
Spring crop
Plastic
-1442 -142
1158 2458 3758 5058
-2082 -782
518 1818 3118 4418
-2722 -1422
-122 1178 2478 3778
Table 5--Estimated annual entrepreneurial profits (dollars)
only 13 1bs (59 kg)p1ant Spring and fall crops 21 1bs
Fiberglass Glass Plastic Fiberglass
Wage rate $200hr
-2076 -3177 -1087 -1703 -776 -1877 1013 397
524 -577 3113 2497 1824 723 5213 4597 3124 2023 7313 6697 4424 3323 9413 8797
Wage rate $250hr
-2716 -3817 -2267 -2883 -1416 -2517 -167 -783
-116 -1217 1933 1317 1184 83 4033 3417 2484 1383 6133 5517 3784 2683 8233 7617
vage rate $300hr
-3356 -4457 -3447 -4063 -2056 -3157 -1347 -1963
-756 -1857 753 137 544 -557 2853 2237
1844 743 4953 4337 3144 2043 7053 6437
-- bull
(95 kg) p1ant
Glass
-2804 -704
1396 3496 5596 7696
-3984 -1884
216 2316 4416 6516
-5164 -3064
-946 1136 3236 5336
Figure 3--Break-even prices and yields for greenhouse tomatoes wage rate = $250 per-hour in plastic house)
CENTSLB
75 r---------------------------------------------------------------------------~
50 2 CtopsYoar
gt-shyw
1 CropYear
25
a 10
USDA
12 14 16 LBPLANT SPACE
18 20 22 24
NEG ESCS 2837-78 III
the three- structures~ The profits are the retur_l_s exp_ected at each price For examplcent f~r one crop annually in the pl~st-ic house at a wage rate of $250 per hour and an averlge annual yield of 13 pounds per plant negative profits are shown at prices of $45 per pound and less while $50 per pound are required for positive profits (to the nearest $05) For two crops per year the yield per plant is the total weight for both crops (yield per space occupied by one plant) Tomato prices in the two-crop schedule1are average prices for both crops (each crops price weighted by that crops percentage of its average yield to total annual yield)
It may be 61 interest t9 d~tehnine a~ just whatmiddot price (or w~ge ate or yield) the operation will break even in figure 3 (data from table 4) the curves shm the minimum price required for various yields so as not to lose money (break-even points)
Th~ TI)e~hod5 for deterin~riirig profits and break-even point~ are presented in the appendix Readers can estimate their own equations if their costs differ remarkably from those- presented here following the procedure in tbe appendix
ECONOMlcCS OF OTHER PRODUCING REGIONS
The costs of establishing a new greenhouse toma_to operation irt the Southeast are high and producers frequently are unable to recover these costs This situation appears to be nationwide
Dhillon and Kirschl_ing (~) expanded ~ 1969 survey_ of gro_wers in New Jersey to estil1ate cost and prof-it functions At that time the indu-strYwas very small in the State but has gr6wn considerab~y since The break-even price at that time for a plastic greenhouse with one crop permiddot year 13 pounds of tomatoes per plant and wages of $250 per hour was $48 per pound Product~on metnods have probably become mor~ efficient in the 8 years since this survey but costs of (tiel ~nd chemicals have nearly doubled so the break-even price has probably not decreased much if any
Ohio was the largest ~single greenhouse tomato grower in the United States with 57 percent of the tota-i greenhouse area in 1969 the date of the last agricultural census Growers have had successful operations there for 50 years A i972 survey of Ohio growers is reported by Duvick anltl
14
~
11
Short (4) where average costs and returns are also presented Extrapolating these data to the size of greenhouses in the Southeast and to 1977 costs shows production co_sts of $12000 for a glass greenhouse with two crops per year Average depreciation expenses in the report are $750 which would probably explain why Ohio growers are still prof-iting This is less thanone-third what one would expect and shows that in the survey many growers_ have already paid off their capital costs It is unclear as to how many Ohio gr-eenhouse operators would be in business today if 1hey we_re amortizing establishment costsmiddot at todays prices Ohio showeq a 33 percent decrease in the number of producers between 1959 and 1969 perhaps due in part to the high cost of neltl construction
The desert Southest is another area where greenhouse tomato produc~ion J1~s shm-m promise Capital costs are about the same as in other parts of the country but heating requirements are less On the other hand markets are distant so shipping costs are higher
FURTllER CONSIDERATIONS
This report presents the economics of greehnouse tomato production in the Southeast This form of agriculture is a very demanding and expensive operation A final consideratiol by anyone concerned with greenhouses whether growers extension personnel or policymakers should be the existence of sales 6~tlets Hith annual grower costs for Florida winter tomat~~s averaging between $14 and $19 per pound (1) and greenhouse tomatoes averaging over $40 per pound promoters and prospective operators should carefully evaluate the market before investing in the business ]j
Marketing the crop is the area in which most greenhouse operators fail A thorough understanding of the marketing channels available is a necessity when promoting any form of greenhouse operation Among the usual options are wholesalers retailers roadside or farm stands and doorshyto-door rou tes
Produce wholesalers complain that in order to handle abull product a steady supply must be available Individual
1 Figure 2 shows how timing of greenhouse toma to production and sales could help compensate for this cost differential
15
greenhollse tomato growers frequently cannot guarantee this thus wholesalers may not want to add the item to their inventories Therefore growers should visit several wholesalers before assllming any Itlholesaler will buy the crop
Small producers might well consider selling direct to retailers Surveying produce managers in local supermarkets is highly recommended for those choosing this option Marketing through local stores has the advantages of not requiring distant delivery and smaller quantities are usually preferred by the stor~
Direct selling to the public is a frequently chosen method In considering this method sales costs both in real terms and in lost opportunity time for other endeavors should be considered
A combination of sales outlets can also be employed ~fuichever is chosen the additional costs of selling [lust be considered These include transportation time and any storage required Liner and Banadyga (~) give a rough figure of 5 cents per pound to estimate the cost of getting the fruit from the grower to the buyer For an individual who sells his product at the farm and has little or no alternative use for his labor this estimate is probably high On the other hand it is low for someone who only operates a small business and delivers to his customers
In conclusion the intensity of greenhouse culture is unlike anything else in crop agriculture and requires great managerial skills patience and hard work from the farmer Opportunities do exist for someone willing to devote the time to establishing marketing channels and managing the many facets of the business
I
16
REFERENCES
1 Brooke Donald 1 Costs and Returns from Vegetable Crops in Florida Season 1975 76 with Comparisons Gainesville Fla Dept of Food and Resource Econ Univ of Fla 1977
2( Brooks William H GrmJing Greenhouse Tomatoes in middotOhio 9oop Ext Servo Publication SB-19middot Columbus Ohio Ohio State Univ 1973
3 Dhillon PS and PJ Kirschling Profitability of Tomato Production under Plastic Greenhouses AE 335 New Bniri~jviick NJ Dept Agr Econ and Mktg Rutgers Univ 1971
4 Duvick Richard D and wn Short Ohio Greenhouse Tomato Summary 1972 Crop Year Econ and Socia OccasioIl_al Paper No 215 Columbus Ohio Ohio State Univ 1974
5 Georgia Farm Bureau Federation Georgia Farm Bureau News vol 36 Macon Ga 1974
6 Liner II L and AA Banadyga Costs and Returns from Producing Greenhouse T6matoes in North Carolina Agr Ext~ Ser Cir 558 Raleigh NC NC State UniI 1974
7 Ringling Je Jr and Carl E Madewell A Comparison of Two Greenhouse Tomato Propuction Systems in the Tennessee Valley Muscle Shoals Ala unpublished TVA Management Intern Rpt Agr Resource Develop Br TVA 1973
8 Spivey CD et al Growing Tomatoes in a Protective Structure Coop Ext Ser Leaflet 184 Athens Ga Univ of Ca 1974
9 Tennessee Valley Authority unpublished survey of State experiment stat-ions regarding greenhouse acreages in the Tennessee Valley 1975
) 10 US Department of Agriculture Fresh Fruit and
Vegetable Unloads in Southern Cities FVUS-3(1976) Agr Mktg Serv 1977
17
11 Fresh Fruit and Vegetable ~fuolesale Narket Prices Agi Mktg Ser ~varlous -years
12 US Department of Cornm~rce Crops Nursery and Greenhouse Productsmiddot For~st ~roducts 1969 Census ofII
Agricultuie vol II chap 6 1973
18
APPENDIX
Derivation of Profit and Break-even Equations
JO derive a profit equation total costs (TC) were broken into three categories
(1) Fixed costs (Fe) include depreciation of the capitalgoods interest on capital investment taxes insurance and maintenance and repair Total fixed costs do not depend on the cropping schedule (For the plastiC greenhouse total annual fixed costs equal $3878)
(2) Crowing costs (Ge) include production expenses interest on production expenses and the value of the labor required to grow the crop If 760 labo-r hours are attributable to growing each crop total annual growing costs for the plastic greenhouse in terms of wage rates equa-shy
$4980 + 164 + 760w = $5144 + 760w (for the spring crop) and
$8572 + 297 + l520w $8869 + l520w (for two crops)
(3) Harvesting and packing costs (HPC) vary wtth the number of plants grown and the yield per plant They are the total of the harvest labor requirement (in hours) times the hourly wage rate plus the packing cost Harvest labor equals the hours required per pound picked times the number of plants times the yield per piant packing cost equals the cost per pound t-imes the number of plants times the yield per plant1
Assuming 2000 plants are grown per -c~op two hours are required to pick and pack 100 pounds (1) and containers cost $150 per 100 pounds of tomatoes the harvesting and packing cost per crop for each system is
(02) (2000)yw + (01) (2000)y = 20(2w+l)y
where w hourly wage rate in dollars and
y annual yield per space occupied by one plant (pounds)
19
Summing the three components gives the total cost (TC)
TC = FC + GC + HPC
which in terms)
the case of the plastic greenhouse gives (combining
TC $9022 + 760w + 20(2w+1)y (for the spring crop) or
$12747 + 1S2Ow + 20(2w+l)y two crops)
(for
Total revenue (rR) is equal to the amount of production in pounds times the average annual selling price This may be expressed in terms of variable yields and prices as
TR = 2000yp
where y = total annual in pounds as
yield per plant before and
p average annual selling price This function assumes only one grade of fruit
Entrepreneurial profits (IT) difference between total revenue
are and
defined as the total cost
n = TR - TC
or in simplified form plastic greenhouse-shy
for the data in the model and the
n = 20(100p-2w-l)y - 760w - $9022 (for the spring crop) or
20(100p-2w-l)y - 1S20w (for two crops)
- $12747
The break-even point is computed by setting the profit function equal to zero and solving for the desired variable For example the break-even price for the plastic greenhouse and one crop per year is $048 per pound and is based on the equation
1 p = y(J8w+4S1l) + 02w + 01
I bull
where y = yield per plant (13 lbs)
20
r
w =wage per hour ($250) and
p average annual price per pound
The same equation can be manipulated to show break-even yields andor wage rates However care must be exercised when interpreting results For example the break-even prices in figure 3 are the average annual prices which in the case of both a fall and spring crop would be the average of the fall price and the spring price weighted by the respective yields
21
UNITED STATES DEPARTMENT OF AGRICULTURE ~STAGDHED r~)WASHINGTON DC 20250 us DEPARTMENT OF AGRICULTURE _
AGAO ~ THIRD ClASS
I
i
I
r 1 lj
bull -
J- I ~
~- - ~--~-- middot _ ~- bull -_ -middot-middotmiddot---0shy
-- _---- - - --- --- _
BIBLIOGRAPHIC DATA K~pon No 3 Recipients Accession No[2SHEET PB 278 788 4 fide and Su-middot ~Ie S Report UaH
ECONomclt- OF GREENHOUSE TOMATO PRODUCTION IN TIlE SOUTIlEAST March 1978 6
7 Auchor(s) S Performing Organizarion Re~l Robert G -cElroy James E Pallas Jr and larr-enK Trot ter No ESCS-02
9 Pedorming Orlltanizatiun Name and Address 10 ProjectTaskUorl Unit ~~Q NatJonal Economic Analysis Division Economics Statistics and Cooperatives Service 11 ContractGrant No US Department of Agriculture Washington DC 20250
12 Sponsoring Organization Name and Address 13 Type o(Report amp Period Covered
Same Final--1969-77
15 Supplemeotary Notes
16 Abstracts
gtlt1 Greenhouse tomato acreage in the Southeast increased nearly 700 percent bet~een GJ1969 and 1974 An average operation consisted of 8000 square feet covered with
polyethylene Up to three crops can be grown yearly but two crops (spring and fall) give higher net returns Investment costs for four 2OOO-square-foot plastic greenshyhouses were approximately $28000 in 1977 Total annual costs for this size operashytion with two crops would be $18117 Using glass or fibergiass would increase the cost Recent taste tets show a- preference Eor greenhouse tomatoes over field-grown lodda tomatoes suggesting a higher market price could be connnanded
s- C -00 0 ~ ~SC5
17 Key-Uords and Document Analysis 17arDescrip~[ors ~Tomatoes Pro~ct dvelopment
Gr~nhOUses Cost eng-ineering ~ ~ ~ Fa buildings Cost 7~~ctiveness
Hortj~~lt(lre Eolyethyene veget~~s Glats_~
plastics~~~i~~aiYSiS Fierglassnfrced
Mar~eting Market res~arch ) rl jrl J Mpfket value 71 ( J-- $ L S V(
17b IdentlfiersOp-en~Enaed Terms ~f _~I lJ L2-
Greenhouse tomatoes ~ vr--l Fi~d-grown toma toes --------=----------------
22 Current NTIS prices are Florida Paper $450 Ga~dening Fiche $3pO Taste tests NTISPrices subject to change Contact_ Sou~heast for current price list Price codes
17c COSATI FirJGroup will be A03 for paper AOI for fiche02-B 02-D 06-H 18 vaibbiliy ~IPIItri( After init-ir l distribution copies 19 ~(urity CbssThi~ 21 ~u oi p~(~
Hcpord 26 wi11 be f0 r sale I +-1)--_+--------- shyon 1 y by Nat i 0nal Techn i ca1 Informa - =--LL~il~~middotrlfA~ill F- tion Service 5285 Port Royal Road Springfield Va 20OlaquouY CIUh 22Ielt
Page _See above22161-_________ llNr1lt F I F n
Us DEPARTMENT OF AGRICULTURE ESCS-02 ECONOMIcs STATISTICS and COOPER~TIVES SERVICE
WASHINGTONOC 20260
Jnoun l j 11 bull bullbullbull
ECONOMICS OF GREENHOUSE TOMATO PRODUCTION IN THE SOUTHEAST by Robert G McElroy James Ebull Pallas Jr and Warren K Trotter National Economic Analysis Division Economics Statistics and Cooperatives Service US Department of Agriculture NTIS Accession No PB 278 788 26 pp bull
This publication is now available only from the National Technical Inforshymtion Service (see address below)--Gurrent cost for this publication is $450 each paper copy and $300 each microfiche (NTIS prices sUbject to change after September 30 1978) Price codes wili be A03 for paper copy and AOI for microfiche Contact NTIS after date shown above for new price schedule
ABSTRACT
Greenhouse tomato acreage in the Southeast increased nearly 700 percent between 1969 and 1974bull An average operation consisted of 8000 square feet covered with polyethylene up to three crops can be grown yearly but two crops (spring and fall) give higher net returns Investment costs for four 2OOO-squareshyfoot plastic greenhouses were approximately $28000 in 1977 Total annual costs ior this siae operation with two crops wouZd be $181-17 Using glass or fiberglass would increase the cask Recent taste tests show a preference for greenhouse tomatoes over field-grown Florida tomatoes suggesting a higher market price couZd middotbecommanded
To order copies of Economics of Greenhouse Tomato Production in the Southeast fi 11 out the order form below and mail to NATIONAL TECINICAL INFORMATION SERVICE 5285 Port Royal Road Springfield Virginia 22161
- - - - - - - - - - - -- - - - - - - - - - - -National TechnicaZ Information Service 5285 Port Royal Road SpringfieZil Virginia 22161
Please send me paper copy(ies) and microfichecopy(ies) of ECONOMICS OF GREENHOUSE TOMATO PRODUCTION IN THE SOUTHEAST byRobert G McElroy James E Pallas Jr and Warren K middotTrotter Current paper copy price i~ $4 50 each (A03) and $300 each for0
fiche (AOI) NTIS prices sUbject to change after September 30 1978
[] Enclosed ismycheck for _________________
Address~____________________~_____ [] I enclose my purchase order formiddot _________
[] Charge to my NTIS acct no
ZIP [] Charge to my N1ERICAN EXPRESS CARD account number (below)
Signat ure _________________________-_ I I I 1 o
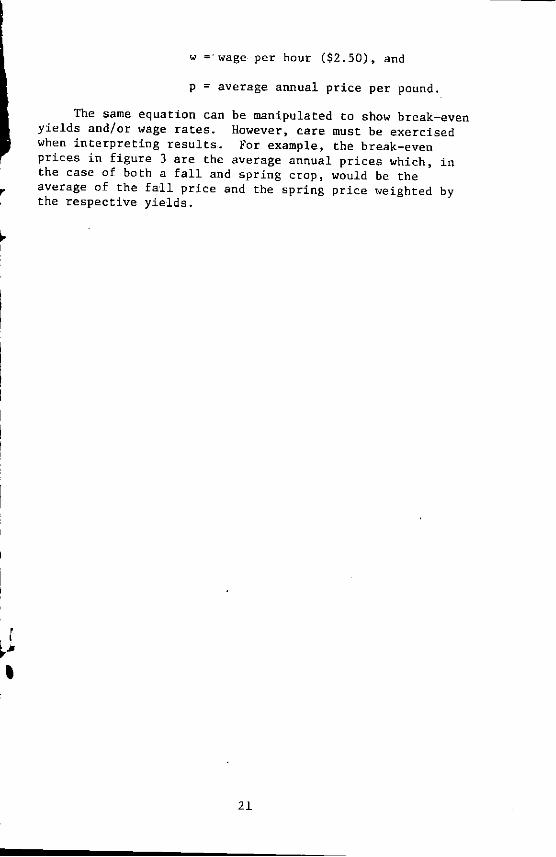
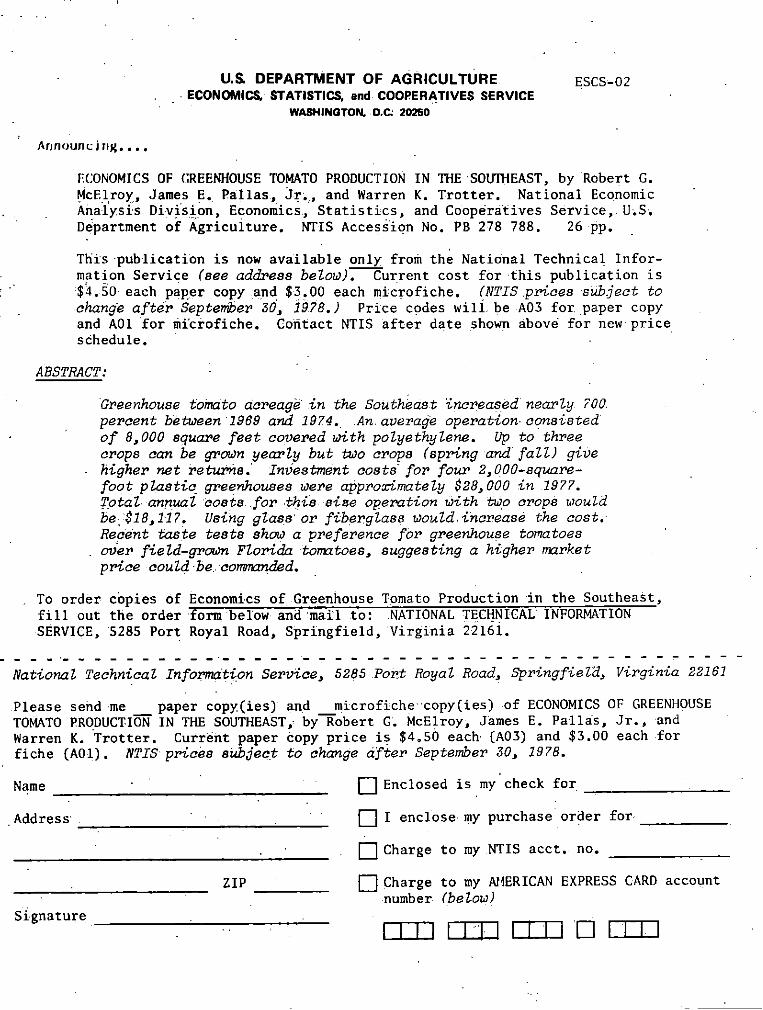