economics of non-communicable diseases in india
TRANSCRIPT
Economics of Non-Communicable Diseases in India
November 2014
A report by the World Economic Forum and the Harvard School of Public Health

2 Economics of Non-Communicable Diseases in India
The views expressed in this publication are those of the authors alone. They do not necessarily represent the decisions, policy or views of the World Economic Forum or the Harvard School of Public Health.
World Economic Forum91-93 route de la CapiteCH-1223 Cologny/GenevaSwitzerlandTel.: +41 (0)22 869 1212Fax: +41 (0)22 786 2744Email: [email protected]
© 2014 World Economic Forum
All rights reserved.
This material may be copied, photocopied, duplicated, and shared provided that it is clearly attributed to the World Economic Forum. This material may not be used for commercial purposes.
REF 131014
Suggested citation: Bloom, D.E., Cafiero-Fonseca E.T., Candeias V, Adashi E., Bloom L., Gurfein L., Jané-Llopis E., Lubet, A., Mitgang E, Carroll O’Brien J, Saxena A (2014). Economics of Non-Communicable Diseases in India: The Costs and Returns on Investment of Interventions to Promote Healthy Living and Prevent, Treat, and Manage NCDs. World Economic Forum, Harvard School of Public Health, 2014.
See http://www.weforum.org/issues/healthy-living

3Economics of Non-Communicable Diseases in India
Contents
4 Figures
4 Tables
4 Abbreviations and Acronyms
5 Executive Summary
6 The Voice of Leaders
8 Background
9 Impact of NCDs on Economic Growth
9 The Indian Response
10 NCDs – One Challenge among Many in India
11 Aims of this Report
12 Non-Communicable Diseases and Risk Factors in India
13 The NCD Burden in India
14 Prevalence of Risk Factors for NCDs
15 Effects of Globalization and Urbanization on Risk Factors and NCDs
16 NCDs in an Ageing India
20 The Economic Burden of Non-Communicable Diseases in India
21 The Macroeconomic Burden
23 NCD Concerns in India’s Business Community
26 Addressing Non-Communicable Diseases in India: Intervention Costs and Returns
27 Methodology for Selecting Interventions
28 Assessment Results: Category A Interventions
37 Methods to Calculate ROI
39 Results: Estimated Health Benefits Needed to Achieve a 15% ROI
40 Principles for Measuring Return on Investment and Collecting Data
41 Principles for Measuring the ROI of NCD Programmes
41 ROI Data Collection Checklist
42 Conclusions and Final Messages
44 References
50 Appendix A. Results from the Longitudinal Ageing Study in India
54 Appendix B. Intervention Framework Summary Table
55 Appendix C. Candidate Interventions
56 Appendix D. Category B Interventions
59 Appendix E. Return on Investment: Equations
60 Appendix F. Sensitivity Analyses
64 Report Preparation
4 Economics of Non-Communicable Diseases in India
FiguresFigure 1. Urban Growth in India, 1950-2050Figure 2. Growth in Share of Elderly Population in India, 1950-2050Figure 3. Prevalence of Diabetes, Heart Disease, and Chronic Respiratory Disease, by Age (LASI Pilot, 2011)Figure 4. Measured Hypertension among the 45+ Population in India (LASI Pilot, 2010)Figure 5. Rates of Selected NCDs and Risk Factors for Men and Women (LASI Pilot, 2011)Figure 6. Reported Payment Mechanisms for Adults 45+ (%) (LASI Pilot, 2011)Figure 7. Contribution (%) of Each Disease to Lost Economic Output for India, 2012-2030Figure 8. Selection Process for InterventionsFigure 9. Map of Category A Interventions
TablesTable 1. Prevalent NCDs in India, 2010Table 2. Prevalence of Selected NCDs and Risk Factors across Residence, Education and Income Groups (LASI Pilot: Karnataka, Kerala, Punjab and Rajasthan, 2011)Table 3. Economic Burden of NCDs in India, 2012–2030Table 4. Economic Burden of NCDs in India and China, 2012–2030Table 5. Perceptions of NCDs Seriously Impacting Business Table 6. Perceptions of NCDs at least Moderately Impacting BusinessTable 7. NCD Prevention and Support: Prevalence of Company Policies and Programmes, Already EstablishedTable 8. NCD Prevention and Support: Prevalence of Company Policies and Programmes, Already Established and Implemented Table 9. Health Benefit Needed to Achieve a 15% ROI over a 30-Year PeriodTable A1. NCD Prevalence in Adults 45+, by Demographic Categories and Location (%)Table A2. NCD Risk Factors in Adults 45+, by Demographic Categories and Location (%)Table A3. Healthcare Payment Mechanisms for Adults 45+, by Demographic Categories, Location and Disease Type (%)Table F1. Varying the Time HorizonTable F2. Varying the Value of DALYs AvertedTable F3. Varying the Desired ROITable F4. Varying the Discount Rate
Abbreviations and AcronymsANM ancillary nurse/midwifeBBH Bangalore Baptist HospitalBCVA best-corrected visual acuity BP blood pressureCI confidence intervalCKD chronic kidney disease
COPD chronic obstructive pulmonary diseaseCRD chronic renal diseaseCSC collaborative stepped careCVD cardiovascular disease DALY disability-adjusted life yearEMERALD Emerging mental health systems in low- and middle-income countriesEOS Executive Opinion Survey ESRD end-stage renal disease FCTC Framework Convention for Tobacco Control GDP gross domestic productHLM high-level meetingHPV human papillomavirusIDPP Indian Diabetes Prevention ProgrammeIDF International Diabetes FederationIHME Institute for Health Metrics and EvaluationIIPS International Institute for Population SciencesIMF International Monetary FundLASI Longitudinal Ageing Study of IndiaLMIC low- and middle-income countriesLSM lifestyle modificationM&E monitoring and evaluationMHA Mental Health ActMmHg millimetres of mercuryMYTRI Mobilizing Youth for Tobacco- Related InitiativesNCD non-communicable disease NEML national essential medicines listNFHS-3 National Family Health SurveyNPCDCS National Programme for Prevention and Control of Cancer, Diabetes, Cardiovascular Diseases and StrokeNPHCE National Programme for Health Care of the ElderlyNRHM National Rural Health Mission OOP out-of-pocketPATH Programme for Appropriate Technology in HealthPEN package of essential non- communicable diseases PRIME Programme for Improving Mental Health Care PSHW preventive and social health worker QALY quality-adjusted life yearRCT randomized controlled trialROI return on investmentSHARE South Asian Hub for Advocacy, Research and Education on Mental HealthTIPS The Indian Polycap StudyUNFPA United Nations Population FundUNGA United Nations General AssemblyVIA visual inspection with acetic acid VILI visual inspection with Lugol’s iodineWHA World Health AssemblyWHO World Health OrganizationWHO-CHOICE WHO-Choosing Interventions that are Cost-Effective

5Economics of Non-Communicable Diseases in India
Non-communicable diseases (NCDs) are a major threat to development, economic growth and human health. NCDs and mental health conditions could cost the world $47 trillion in lost economic output from 2010 to 2030 if urgent action is not taken to prevent and treat them.
India faces the human and economic threat posed by NCDs. Cardiovascular diseases, cancers, chronic respiratory diseases, diabetes, and other NCDs are estimated to account for 60% of all deaths in India, making them the leading cause of death – ahead of injuries and communicable, maternal, prenatal, and nutritional conditions. Furthermore, NCDs account for about 40% of all hospital stays and roughly 35% of all recorded outpatient visits.
NCDs not only affect health, but also productivity and economic growth. The probability of dying during the most productive years (ages 30-70) from one of the four main NCDs is a staggering 26%. Moreover, an ageing India, whose population is growing more susceptible to NCDs, is likely to put added economic stress on both private households and healthcare delivery systems.
This report provides an account of the economic impact of NCDs to the Indian economy, and an assessment of the return on investment (ROI) of specific interventions.
The evidence is compelling. India stands to lose $4.58 trillion before 2030 due to NCDs and mental health conditions. Cardiovascular diseases, accounting for $2.17 trillion, and mental health conditions ($1.03 trillion), will lead the way in economic loss.
India’s business community is concerned about NCDs. A substantial proportion of business leaders – ranging from 42% in 2010 to 33% in 2013 – reported somewhat serious to very serious concerns regarding the impact of NCDs. Their possible negative impact on output, revenue, profitability, business performance, and potential for economic growth can be substantial. Moreover, NCDs can impede workforce productivity by elevating rates of absenteeism, diminishing the energy and focus of workers, and depleting critical workplace skills. In addition, the business community is likely to be concerned with the impact of NCDs on the size and purchasing power of their current and prospective customer bases.
However, economic and social losses due to NCDs are not inevitable. Options exist for actions that policy-makers can take today, and businesses may contribute as well through workplace health programmes aimed at prevention, early detection, treatment, and care.
Executive Summary
Primary prevention of NCDs, built upon robust early screening and a strong healthcare infrastructure, is a promising area for reaping favourable returns on investment in the Indian context. Interventions that focus on screening (in the case of hypertension), vaccination (for human papillomavirus [HPV]), and prevention of tobacco use were assessed as promising in their feasibility of achieving a 15% ROI. Mental health care that leverages an existing healthcare infrastructure and employed lay health counsellors is also a potential approach for addressing common mental health conditions in India.
When thinking of how to direct India’s spending on health, the prevention and control of NCDs are promising ways to channel investments. A critical part will be collaboration among the public sector, private sector, and civil society to combat NCDs. The following additional features will be important for reducing their impact:
– Robust mechanisms for data collection, data sharing, and knowledge transfer
– Consistent monitoring and evaluation, targeting both health and economic outcomes
– Clearinghouses for people to share and learn about what works and what doesn’t in various contexts
– Enlightened leadership highlighting the importance of multi-stakeholder collaboration for healthy living
With this report, the World Economic Forum and the Harvard School of Public Health aim to bring key elements of the economic picture of NCDs in India to the business and policy-making debates. The report highlights activities as well as current gaps in action to address NCDs.
Importantly, the report aims to stimulate discussion on the extensive impact of NCDs on Indian families, businesses, and society. With its solid base of evidence, it seeks to provide a starting point to reorient the dialogue about investing in healthy living and NCD prevention in India, with the view of positioning healthy populations as important factors for sustainable economic growth. This is particularly important considering that India is Asia’s third-largest economy and one of the most populous countries in the world.

6 Economics of Non-Communicable Diseases in India
The Voice of Leaders
Collective action is essential to make the game-changing steps required for the optimal approach to the prevention and control of NCDs. A crucial aspect of this collective action is multisectoral and intersectoral cooperation. The sectors within government, as well as the sectors within the state, must be brought together.
Sir George Alleyne Director Emeritus, Pan American Health Organization, USA
We speak about healthcare, and most of the time we are talking about caring for sick people, not caring about health. At the end of the day, health is not something you ‘use’, it is something you keep. But we can only create and ‘keep’ health by working together to provide a broad health-promoting ecosystem with the individual at the centre.
Paul Bulcke Chief Executive Officer, Nestlé, Switzerland
Healthy living is about behaviour change at its most challenging. It will require a determined and coordinated effort across all sectors to deliver genuine change. The scene is set for companies and governments to drive this agenda forward in a way that is mutually beneficial to their core interests.
Orit Gadiesh Chairman, Bain & Company, USA

7Economics of Non-Communicable Diseases in India
The growing incidence of non-communicable diseases causes great individual hardship and places enormous burden on society, untenable in the long run for any country or economy. Many of these diseases can be substantially controlled and the pressure eased by adopting active, healthy lifestyles. To strive to remain healthy seems natural but most often remains a neglected solution. We must accelerate progress in this regard and galvanize action within our organizations and communities, promoting and evangelizing the benefits of health, as this is a grave challenge that concerns all of us.
Malvinder Singh Executive Chairman, Fortis Healthcare, India
Under the nearly universal pressures of population ageing, rapid urbanization and the globalization of unhealthy lifestyles, non-communicable diseases have overtaken infectious diseases as the biggest cause of sickness and death worldwide. The main risk factors for these diseases, namely tobacco use, unhealthy diets, lack of physical exercise and the harmful use of alcohol, lie outside the direct purview of the health sector. Broad-based, population-wide initiatives, uniting the public sector, businesses and civil society, are needed to tackle diseases that are closely associated with the environments in which people make their daily lifestyle choices. The fact that not one country has managed to turn back its obesity epidemic is indicative of the hard work that lies ahead in promoting healthy living.
Margaret Chan Director-General, World Health Organization, Geneva
Additional quotes from world leaders on multi-stakeholder collaboration for healthy living are available at: http://www.weforum.org/content/pages/voice-leaders.
Wellness and prevention represent a social opportunity for everyone. An opportunity for governments to reduce health service costs and educate citizens, for companies to be more creative and productive and for all citizens to improve their health and daily quality of life.
Nerio Alessandri President and Founder, Technogym, Italy
There will always be naysayers who say, ‘we can’t afford it’, but you can’t argue with evidence that a healthy population is key to long-term economic development. Consider the economic costs of falling backwards: If resources dry up, the cost of putting out the flares of resurgent epidemics will far exceed investment needed today.
Yvonne Ntombizodwa Chaka Chaka Mhinga Singer and President, Princess of Africa Foundation, South Africa

8 Economics of Non-Communicable Diseases in India
1. Background

9Economics of Non-Communicable Diseases in India
Accounting for 63% of the annual global death toll and for untold morbidity and disability, non-communicable diseases (NCDs) have become the dominant public health challenge of the 21st century (World Health Organization [WHO], 2011b). NCDs not only have a serious impact on human health, but also on economic growth. This report provides an overview of the current landscape for NCDs in India, including the economic burden NCDs could pose if left unattended; programmes and policies currently being implemented; and an assessment of the potential return on investment (ROI) of these policies.
a. Impact of NCDs on Economic Growth Empirical research has established a strong relationship between economic growth and health (Bloom et al. 2010). This relationship can run both ways: while the effect of economic growth on improved health has long been understood, recent research reflects the causality running from health to economic growth (Bloom, Canning & Sevilla, 2004; Bloom, Canning & Fink, 2014).
Ill health affects economic growth in several ways, among them:
– Increased expenditures on the part of the health system, individuals, and households
– Increased rates of early retirement (Dwyer & Mitchell, 1999)
– Negative expectations regarding employment (McGarry, 2004)
– Reduced productivity (Lopez-Casasnovas, Rivera & Currais, 2005)
– Less available labour and increased ratio of dependents to workers
NCDs may reduce the net availability of government resources by increasing public health expenditures in treatment, and by reducing the amount of taxable household income due to pushing ill people out of the workforce. As a result, governments may increase tax rates to meet rising health expenditures. Doing so depresses aggregate demand, further limiting the growth potential of the economy and reducing the public sector’s ability to invest in strategic areas, such as the development of physical capital and the workforce (i.e. the portion that arises from better education). In addition, treating NCDs and mental health conditions may require an ever-growing share of resources, increasing demand on the health system and thus reducing government’s ability to target other development goals, such as poverty reduction or improvements in education (Ryan & Wilden, 2011). Similar mechanisms occur at the individual or household level. Disease burden causes individuals or households to spend down their available income, thus diverting those resources away from investments in human capital development, such as education, to pay for non-productive healthcare.
The impact of NCDs has been reported in terms of avoidable deaths (Marrero, Bloom & Adashi, 2012); disability (Murray et al., 2012; Salomon et al., 2012); and economic impact (Bloom et al., 2011; Abegunde et al., 2007; Mahal et al., 2013; Kankeu et al., 2013). The Global Economic Burden of Non-communicable Diseases 2011 report by the World Economic Forum and Harvard School of Public Health estimated that leaving the four main NCDs and mental health conditions unaddressed could cost the world $47 trillion in output between 2011 and 2030 (Bloom et al., 2011). A companion report, focused exclusively on low- and middle-income countries (LMICs), concluded that the four main NCDs could cost LMICs more than $7 trillion in output from 2011 to 2025 (WHO & World Economic Forum, 2011).
b. The Indian Response
Despite their growing economic burden, the treatment and prevention of NCDs is largely underfunded and does not occupy a central place on the global development agenda (for more detail on the global policy background, see Appendix A). Recognizing the growing threat of NCDs, the United Nations General Assembly (UNGA) convened the 2011 High-Level Meeting (HLM) on the Prevention and Control of Non-Communicable Diseases in September of that year. During the HLM, India recognized NCDs as a development issue and announced two programmes to address this challenge: the National Programme for Prevention and Control of Cancer, Diabetes, Cardiovascular Diseases and Stroke (NPCDCS), and the National Programme for Health Care of the Elderly (NPHCE) (UN, 2011). Both were introduced as pilot programmes, and on World Health Day 2013, the Government of India announced plans to expand the NPCDCS to cover all districts as part of the 12th Five Year Plan (2012-2017) (Ministry of Health and Family Welfare, 2013).
Beyond focusing on the four main physical NCDs, India has played an essential role in including mental health in the definition of NCDs and in addressing mental health conditions at national and international levels (Dhar, 2012a; WHO, 2012b; Ministry of Health and Family Welfare, 2012b). In the lead-up to the 2011 HLM, India’s push to include mental health in the definition of NCDs at the First Global Ministerial Conference on Healthy Lifestyles and Noncommunicable Disease Control in Moscow in April 2011 resulted in the recognition that “other NCDs such as mental disorders also significantly contribute to the global disease burden” (WHO, 2011a). Further, India moved a resolution during the 65th World Health Assembly (WHA), calling on UN member states to develop an action plan on mental health (WHO, 2012d; WHO, 2012f). The plan was presented and adopted during the 66th WHA in May 2013 (WHO, 2013l; WHO, 2013f).
Domestically, India has made headway in reforming the legal framework that protects the rights of people with mental health conditions and in promoting mental health. In 2010, led by the Ministry of Health and Family Welfare

10 Economics of Non-Communicable Diseases in India
and in consultation with many civil society organizations, a collaborative process to draft a new mental health act was initiated to replace the 1987 Mental Health Act (MHA) (Kothari & Chatur, 2012). The Mental Health Care Bill 2012, in stark contrast to the MHA, takes a rights-based perspective of mental health conditions, and is regarded as a change in attitude and approach to mental health in India (Kothari & Chatur, 2012; for more details, see Appendix B).
c. NCDs – One Challenge among Many in India
Efforts to reduce the burden of NCDs have been unfolding in tandem with dramatic changes in India’s health system and policy environment. India’s 12th Five Year Plan kicked off in 2012 with health-focused objectives designed to achieve universal health coverage and increase public-sector health funding sharply, as well as consolidate welfare programmes under the National Rural Health Mission (NRHM) (Krishnan & Makkar, 2012; Planning Commission, 2013).
India’s triple burden of disease – in which rising NCDs threaten development, infectious diseases are still dominant, and violence and injuries remain a cause for concern – exists against the backdrop of other health and development challenges. Malnutrition persists, and almost half of India’s children are underweight and stunted (Save the Children Fund & World Vision International, 2012). Prime Minister of India Manmohan Singh (2004-2014) has called this a “national shame” (Bhalla, 2012; UNICEF, 2013). Hunger and malnutrition, while most prevalent among the poorest, are not restricted to any one segment of the population. The problem is widespread: more than 70% of India’s women and children have nutritional deficiencies, and even among the wealthiest 20% of India’s population, one-fifth of children are undernourished (Save the Children Fund & World Vision International, 2012).
Another pervasive challenge in India is violence against women and girls; at least one-third of women who have ever been married report experiencing physical or sexual violence (Kimuna et al., 2012; Yee, 2013). In May 2013, India co-organized a side event during the 66th WHA along with the delegations of Belgium, Mexico, the Netherlands, Norway, the United States, and Zambia. The event, called “Addressing violence against women: Health impacts and role of the health sector,” recognized the links between the violent treatment of women and their health and economic well-being (WHO, 2013k; WHO, 2013a).
As India moves to confront these issues alongside the rising burden of NCDs, concerns have been raised about the country’s ability to implement and enforce regulations to promote health, absorb increases in public health funding without major changes in systems and processes, and achieve national scale for the NPCDCS (Mukhopadhyay, 2012; Sengupta, 2013; Berman et al., 2010). In a global comparison of countries’ human capital ratings – i.e. the talent, skills, and capabilities of a nation’s people – India ranked 78th out of 122 countries assessed (World
Economic Forum, 2013). Alarmingly, India’s poorest performance came in the Health and Wellness category, where it ranked 112th. This suggests that massive structural changes will indeed be necessary for India as a whole to effectively deal with its growing NCD burden and ageing population.
The 2011 HLM and events since then have emphasized the message that, if left unattended, the public health toll of NCDs – sure to overwhelm extant health systems – could mean all but a curtailing of future economic development (WHO, 2009a). At the level of the individual, NCDs can lead to poverty, and poverty to NCDs (WHO, 2009a). In the absence of a comprehensive and widely available health insurance system (including catastrophic insurance) in LMICs, payment for healthcare services often entails unaffordable, poverty-driving out-of-pocket (OOP) spending (WHO, 2009a). India’s low medical insurance coverage is well documented, and OOP expenditures for healthcare are substantially higher than in other South Asian countries. Taken together with the results of Bloom et al. (2011), these observations suggest that NCDs – absent redress – stand to thwart the eradication of poverty, compromise the realization of the United Nation’s (UN) Millennium Development Goals and undercut economic growth in India and elsewhere.

11Economics of Non-Communicable Diseases in India
d. Aims of this Report
This report outlines the current landscape for NCDs in India, including the economic burden they could pose if left unattended, the programmes and policies currently being implemented, and an assessment of the potential ROI of these policies.
Focusing on data from India, the report contributes the following:
– A snapshot of the prevalence of NCDs and an outline of risk factors
– Estimates of lost economic output due to NCDs, focusing on their negative effects on labour supply and capital accumulation
– An overview of business community concerns regarding the impact of NCDs
– A select list of current programmes and policies being implemented in India to address NCDs and promote healthy living
– The cost of 12 interventions, and an analysis of what it would take for them to deliver above-average returns
– Guidance for programme managers in the form of a data collection checklist for ROI calculations
With this report, the World Economic Forum and the Harvard School of Public Health aim to inform policy- makers and business leaders about NCDs in India, painting the economic picture and highlighting current gaps in action to address NCDs. Importantly, the report seeks to stimulate further debate about the impact of NCDs on Indian society and reorient the dialogue about investing in healthy living – to view healthy populations as a powerful ingredient in sustainable socio-economic growth. This is particularly important considering that India is Asia’s third-largest economy and one of the most populous countries in the world.

12 Economics of Non-Communicable Diseases in India
2. Non-Communicable Diseases and Risk Factors in India

13Economics of Non-Communicable Diseases in India
Source: IHME (2013)
India’s high burden of communicable diseases and classic “diseases of poverty” often dominate the healthcare debate. Data show, however, that NCDs also pose considerable risk to its population’s health.
a. The NCD Burden in India In 2010, NCDs accounted for more disability-adjusted life years (DALYs) in India than communicable diseases – approximately 235 million versus 222 million DALYs, respectively (in the context of this report, a DALY represents one lost year of healthy life; economically, it is valued as equal to a country’s per-capita GDP) (Institute for Health Metrics and Evaluation [IHME], 2013). Data from 2004 indicate that NCDs accounted for 40% of all hospital stays and roughly 35% of all recorded outpatient visits (Engelgau, Karan & Mahal, 2012). The impact of NCDs is felt not just in reduced health, but also in lower productivity. One estimate is that India will have lost $237 billion (in 1998 constant international dollars) between 2006 and 2015 from premature deaths due to heart disease, stroke, and diabetes (WHO, 2005). Available data also indicate that premature deaths from NCDs in India contribute substantially to this loss of productivity; in fact, cardiovascular disease deaths alone give India the “highest loss in potentially productive years of life” of all countries in the world (Srinath Reddy et al., 2005).
Some of the most prevalent NCDs in India today are cardiovascular disease (CVD), chronic respiratory disease, cancer, and diabetes (Table 1). Diabetes is becoming a particular concern; between 1990 and 2010, the annual number of DALYs attributable to diabetes in India nearly doubled from about 4.1 million to nearly 8 million. Meanwhile, the annual number of deaths due to diabetes in the country increased more than twofold, from about 100,000 in 1990 to 223,999 in 2010 (IHME 2013). In 2012, India had more than 63 million people living with the most common form, type 2 diabetes, earning the country the title of “diabetes capital of the world”; furthermore, the International Diabetes Federation (IDF) estimates that 33% of adults with diabetes in India are undiagnosed, preventing proper management of the disease (2012). (While the contribution of diabetes to overall DALYs in Table 1 is substantially lower than those for CVD and respiratory diseases, most of the morbidity and mortality for people living with diabetes is ultimately due to CVD, so some of the DALYs attributable to diabetes may be captured in the CVD category.) Common factors contributing to the onset of type 2 diabetes include obesity, a sedentary lifestyle, and being overweight (IDF, 2013; Mayo Clinic, 2013d). However, recent research also suggests that factors in the ¬in utero environment – particularly poor maternal nutrition – can also lead to insulin resistance and, later, to type 2 diabetes (Shetty, 2012). Lifestyle improvements, such as a healthy diet and physical activity, are critical to controlling the disease (Mayo Clinic, 2013d).
Table 1: Prevalent NCDs in India, 2010
NCD DALYs % of total DALYs Deaths % of total
deaths
CVD (including coronary heart disease and stroke/ischemic heart disease) 48,793,600 9.4 2,095,930 21.1
Chronic respiratory disease (including asthma; chronic obstructive pulmonary disease [COPD]; and occupational lung diseases, such as chronic bronchitis or emphysema)
35,880,300 7.0 1,176,740 11.8
Cancer (including lung; lip/oral cavity and other pharynx-related cancers; and cervical, breast, and ovarian cancers)
19,094,000 3.7 663,032 6.7
Diabetes 7,968,930 1.5 223,999 2.2
14 Economics of Non-Communicable Diseases in India
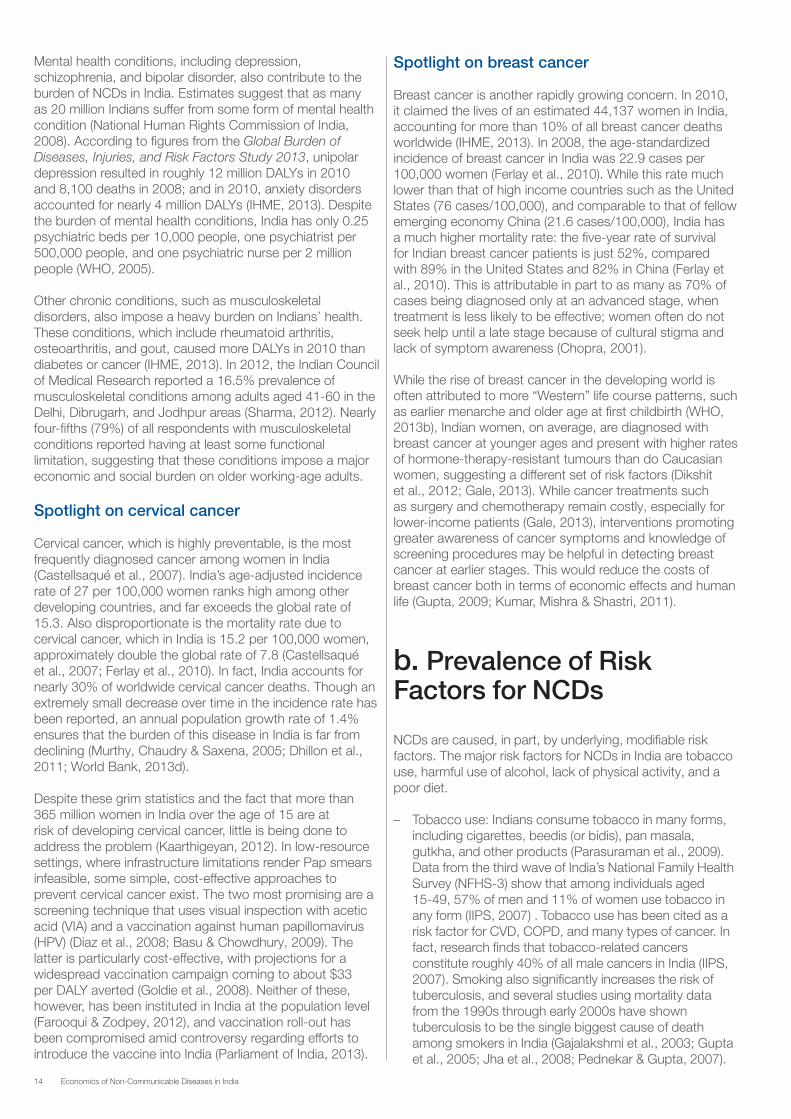
Mental health conditions, including depression, schizophrenia, and bipolar disorder, also contribute to the burden of NCDs in India. Estimates suggest that as many as 20 million Indians suffer from some form of mental health condition (National Human Rights Commission of India, 2008). According to figures from the Global Burden of Diseases, Injuries, and Risk Factors Study 2013, unipolar depression resulted in roughly 12 million DALYs in 2010 and 8,100 deaths in 2008; and in 2010, anxiety disorders accounted for nearly 4 million DALYs (IHME, 2013). Despite the burden of mental health conditions, India has only 0.25 psychiatric beds per 10,000 people, one psychiatrist per 500,000 people, and one psychiatric nurse per 2 million people (WHO, 2005).
Other chronic conditions, such as musculoskeletal disorders, also impose a heavy burden on Indians’ health. These conditions, which include rheumatoid arthritis, osteoarthritis, and gout, caused more DALYs in 2010 than diabetes or cancer (IHME, 2013). In 2012, the Indian Council of Medical Research reported a 16.5% prevalence of musculoskeletal conditions among adults aged 41-60 in the Delhi, Dibrugarh, and Jodhpur areas (Sharma, 2012). Nearly four-fifths (79%) of all respondents with musculoskeletal conditions reported having at least some functional limitation, suggesting that these conditions impose a major economic and social burden on older working-age adults. Spotlight on cervical cancer
Cervical cancer, which is highly preventable, is the most frequently diagnosed cancer among women in India (Castellsaqué et al., 2007). India’s age-adjusted incidence rate of 27 per 100,000 women ranks high among other developing countries, and far exceeds the global rate of 15.3. Also disproportionate is the mortality rate due to cervical cancer, which in India is 15.2 per 100,000 women, approximately double the global rate of 7.8 (Castellsaqué et al., 2007; Ferlay et al., 2010). In fact, India accounts for nearly 30% of worldwide cervical cancer deaths. Though an extremely small decrease over time in the incidence rate has been reported, an annual population growth rate of 1.4% ensures that the burden of this disease in India is far from declining (Murthy, Chaudry & Saxena, 2005; Dhillon et al., 2011; World Bank, 2013d).
Despite these grim statistics and the fact that more than 365 million women in India over the age of 15 are at risk of developing cervical cancer, little is being done to address the problem (Kaarthigeyan, 2012). In low-resource settings, where infrastructure limitations render Pap smears infeasible, some simple, cost-effective approaches to prevent cervical cancer exist. The two most promising are a screening technique that uses visual inspection with acetic acid (VIA) and a vaccination against human papillomavirus (HPV) (Diaz et al., 2008; Basu & Chowdhury, 2009). The latter is particularly cost-effective, with projections for a widespread vaccination campaign coming to about $33 per DALY averted (Goldie et al., 2008). Neither of these, however, has been instituted in India at the population level (Farooqui & Zodpey, 2012), and vaccination roll-out has been compromised amid controversy regarding efforts to introduce the vaccine into India (Parliament of India, 2013).
Spotlight on breast cancer Breast cancer is another rapidly growing concern. In 2010, it claimed the lives of an estimated 44,137 women in India, accounting for more than 10% of all breast cancer deaths worldwide (IHME, 2013). In 2008, the age-standardized incidence of breast cancer in India was 22.9 cases per 100,000 women (Ferlay et al., 2010). While this rate much lower than that of high income countries such as the United States (76 cases/100,000), and comparable to that of fellow emerging economy China (21.6 cases/100,000), India has a much higher mortality rate: the five-year rate of survival for Indian breast cancer patients is just 52%, compared with 89% in the United States and 82% in China (Ferlay et al., 2010). This is attributable in part to as many as 70% of cases being diagnosed only at an advanced stage, when treatment is less likely to be effective; women often do not seek help until a late stage because of cultural stigma and lack of symptom awareness (Chopra, 2001).
While the rise of breast cancer in the developing world is often attributed to more “Western” life course patterns, such as earlier menarche and older age at first childbirth (WHO, 2013b), Indian women, on average, are diagnosed with breast cancer at younger ages and present with higher rates of hormone-therapy-resistant tumours than do Caucasian women, suggesting a different set of risk factors (Dikshit et al., 2012; Gale, 2013). While cancer treatments such as surgery and chemotherapy remain costly, especially for lower-income patients (Gale, 2013), interventions promoting greater awareness of cancer symptoms and knowledge of screening procedures may be helpful in detecting breast cancer at earlier stages. This would reduce the costs of breast cancer both in terms of economic effects and human life (Gupta, 2009; Kumar, Mishra & Shastri, 2011).
b. Prevalence of Risk Factors for NCDs NCDs are caused, in part, by underlying, modifiable risk factors. The major risk factors for NCDs in India are tobacco use, harmful use of alcohol, lack of physical activity, and a poor diet.
– Tobacco use: Indians consume tobacco in many forms, including cigarettes, beedis (or bidis), pan masala, gutkha, and other products (Parasuraman et al., 2009). Data from the third wave of India’s National Family Health Survey (NFHS-3) show that among individuals aged 15-49, 57% of men and 11% of women use tobacco in any form (IIPS, 2007) . Tobacco use has been cited as a risk factor for CVD, COPD, and many types of cancer. In fact, research finds that tobacco-related cancers constitute roughly 40% of all male cancers in India (IIPS, 2007). Smoking also significantly increases the risk of tuberculosis, and several studies using mortality data from the 1990s through early 2000s have shown tuberculosis to be the single biggest cause of death among smokers in India (Gajalakshmi et al., 2003; Gupta et al., 2005; Jha et al., 2008; Pednekar & Gupta, 2007).

15Economics of Non-Communicable Diseases in India
– Harmful use of alcohol: The estimated number of alcohol drinkers in India in 2004 was 62.5 million; around 17% of those (10.6 million) were been considered dependent users (Ray, 2004). The harmful use of alcohol, as a risk factor, has been specifically linked to CVD, cancer, and diseases of the liver (WHO, 2008a). Researchers have also identified links between harmful use of alcohol and mental disorders (Moreno et al., 2012).
– Lack of physical activity and a poor diet (high caloric intake): These two factors can lead to obesity. Roughly 15% of females and 12% of males in India are classified as overweight or obese (IIPS, 2007). Obesity has been cited as a risk factor for CVD and diabetes, and can exacerbate symptoms of COPD (WHO, 2008a).
Research suggests that if Indians could adequately address these risk factors, NCD-related premature deaths would decline by 40-50% (Taylor, 2010).
c. Effects of Globalization and Urbanization on Risk Factors and NCDs
Globalization and urbanization are current and future drivers of NCDs (Popkin, Adair & Ng, 2012; Popkin, 1998; Popkin, 1999; Allender et al., 2010; Arokiasamy & Yadav, 2013). These developments, coupled with rapid economic growth, have stimulated the nutritional transition of the country, which is apparent at all levels of commercial food processing, preparation, and consumption.
More than ever, Indians have increased access to convenient, prepared foods offered by modern retailers at competitively low prices (Popkin, Adair & Ng, 2012; Popkin, 1998; Popkin, 1999; Reardon & Minten, 2011). Highlights of the changes in food availability include the following:
– Estimates suggest 49% annual growth from 2001 to 2010 in modern food retail.
– Approximately 80-85% of the Indian population consumes commercially processed food, and a marked shift has occurred in consumer preferences towards energy-dense processed foods and away from nutrient-rich foods (Reardon & Minten, 2011; Gupta et al., 2010; Misra et al., 2011).
– Between 1972 and 2006, the proportion of India’s food economy allocated to cereal consumption dropped 13 percentage points to roughly 23% (Reardon & Minten, 2011).
– A decreasing intake of coarse cereals, fruits, and vegetables has occurred alongside an increasing consumption of meats and salt (Misra et al., 2011).
– High-calorie foods are more available in urban than in rural areas, contributing to the greater burden of obesity and diabetes in cities (IIPS, 2007).
Further urban-rural discrepancies exist in physical activity, which appears to be declining more in India’s cities than in its rural regions. Rural India has a strong agricultural economy (USDA, 2009), while many urban jobs require less physical labour and energy expenditure (e.g. desk-based activities). The difference in physical activity is further exacerbated by the urban population’s reliance on public or private means of transportation rather than walking (World Bank, 2002), and by a rising scarcity of open spaces like parks or trails (Sudhakar, 2013), both consequences of rapid urban growth and limited urban planning. Other sedentary behaviours, such as watching television or playing video games, are more common in cities as well, where technological goods and services such as electricity are more accessible.
Data show that India is poised to experience significant urban growth over the next 35 years (Figure 1). This suggests that more individuals will encounter urban risk factors for NCDs, which could contribute to an increase in disease burden and related economic losses.
Source: UN (2012c))
Figure 1: Urban Growth in India, 1950-2050
0
200
400
600
800
1000
Five-year period beginning
Urb
an p
op
ulat
ion,
mill
ions

16 Economics of Non-Communicable Diseases in India
d. NCDs in an Ageing India
In addition to globalization and urbanization, demographic changes are also driving the rise in NCDs. Life expectancy in India is currently 66 years, but is expected to climb to 73 by 2050 (United Nations Population Division, 2012). As a result, the share of individuals aged 50 and older is projected to increase significantly over the next 35 years to 2050 (Figure 2), from about 16% of India’s population today (roughly 190 million) to more than 31%, or approximately 506 million
Source: United Nations Population Division (2012)
Figure 2: Growth in Share of Elderly Population in India, 1950-2050
Sha
re o
f p
op
ulat
ion
(%)
(United Nations Population Division, 2012). India’s segment aged 60 and older will grow from 8% to 18% of total population in that same time frame, and the relative size of the population aged 80 and older will also rise sharply, from 1% to 2.3% (United Nations Population Division, 2012). NCDs represent the main cause of mortality and morbidity among older people in both the developed and developing world, and in India in particular (Dey et al., 2012). Given the increase in the share of India’s elderly population, the burden of NCDs is also likely to increase.
Recent data from the Longitudinal Ageing Study in India (LASI) shed further light on the interplay between ageing and NCDs (Lee et al., 2012). A pilot survey, LASI was carried out in four Indian states – Punjab, Rajasthan, Karnataka, and Kerala – and included nearly 1,500 respondents aged 45 and older. A full-scale, nationally representative survey is
currently under development. Results from LASI reveal some important characteristics of this population segment: NCDs are a growing concern; NCD risk factors increase with age; and, overwhelmingly, Indians rely on family members to finance their healthcare.

17Economics of Non-Communicable Diseases in India
Burden of disease and risk factors among LASI respondents
Diabetes was the most commonly reported NCD, with a prevalence of 9% (137 individuals). Because diagnoses were self-reported, this percentage most likely underestimates the true prevalence of diabetes. As it is, the high prevalence is
Source: Harvard School of Public Health et al. (2011)
Source: Arokiasamy et al. (2014)
Figure 3: Prevalence of Diabetes, Heart Disease, and Chronic Respiratory Disease, by Age (LASI Pilot, 2011)
Figure 4: Measured Hypertension among the 45+ Population in India (LASI Pilot, 2011)
0
2
4
6
8
10
12
14
45 - 54 55 - 64 65 - 74 75+
% o
f re
spo
nden
ts
Diabetes Heart disease Chronic respiratory disease
High systolic BP High diastolic BP
% o
f re
spo
nden
ts
45-60 60-74 >75
Figure 4 shows the share of respondents with high measured systolic or diastolic blood pressure (BP).1
alarming, particularly among somewhat younger respondents (aged 45-64). Arthritis prevalence, at a rate of 8%, came closely after diabetes, and was followed by chronic respiratory disease (5%) and heart disease (4%) (Figure 3). Just over 100 survey respondents, or 7% of total, reported NCD co-morbidity (concurrent diagnosis of two or more conditions). For full results, see Appendix A.
0
2
4
6
8
10
12
14
45 - 54 55 - 64 65 - 74 75+
% o
f re
spo
nden
ts
Diabetes Heart disease Chronic respiratory disease
These data show that, among the population aged 45 and older, hypertension increases with age (Lee et al., 2012).
18 Economics of Non-Communicable Diseases in India
Rates of certain NCDs and associated risk factors: broken down along lines of education, income, and urban/rural residency
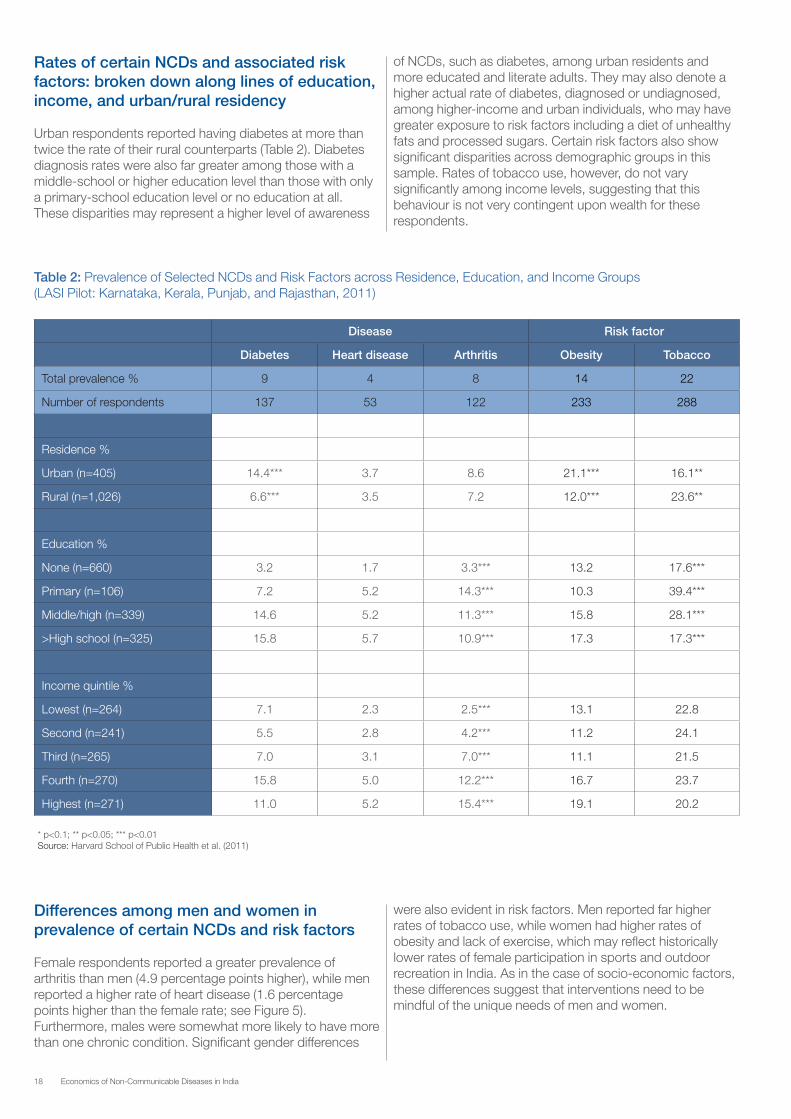
Urban respondents reported having diabetes at more than twice the rate of their rural counterparts (Table 2). Diabetes diagnosis rates were also far greater among those with a middle-school or higher education level than those with only a primary-school education level or no education at all. These disparities may represent a higher level of awareness
of NCDs, such as diabetes, among urban residents and more educated and literate adults. They may also denote a higher actual rate of diabetes, diagnosed or undiagnosed, among higher-income and urban individuals, who may have greater exposure to risk factors including a diet of unhealthy fats and processed sugars. Certain risk factors also show significant disparities across demographic groups in this sample. Rates of tobacco use, however, do not vary significantly among income levels, suggesting that this behaviour is not very contingent upon wealth for these respondents.
* p<0.1; ** p<0.05; *** p<0.01Source: Harvard School of Public Health et al. (2011)
Table 2: Prevalence of Selected NCDs and Risk Factors across Residence, Education, and Income Groups (LASI Pilot: Karnataka, Kerala, Punjab, and Rajasthan, 2011)
Disease Risk factor
Diabetes Heart disease Arthritis Obesity Tobacco
Total prevalence % 9 4 8 14 22
Number of respondents 137 53 122 233 288
Residence %
Urban (n=405) 14.4*** 3.7 8.6 21.1*** 16.1**
Rural (n=1,026) 6.6*** 3.5 7.2 12.0*** 23.6**
Education %
None (n=660) 3.2 1.7 3.3*** 13.2 17.6***
Primary (n=106) 7.2 5.2 14.3*** 10.3 39.4***
Middle/high (n=339) 14.6 5.2 11.3*** 15.8 28.1***
>High school (n=325) 15.8 5.7 10.9*** 17.3 17.3***
Income quintile %
Lowest (n=264) 7.1 2.3 2.5*** 13.1 22.8
Second (n=241) 5.5 2.8 4.2*** 11.2 24.1
Third (n=265) 7.0 3.1 7.0*** 11.1 21.5
Fourth (n=270) 15.8 5.0 12.2*** 16.7 23.7
Highest (n=271) 11.0 5.2 15.4*** 19.1 20.2
Differences among men and women in prevalence of certain NCDs and risk factors
Female respondents reported a greater prevalence of arthritis than men (4.9 percentage points higher), while men reported a higher rate of heart disease (1.6 percentage points higher than the female rate; see Figure 5). Furthermore, males were somewhat more likely to have more than one chronic condition. Significant gender differences
were also evident in risk factors. Men reported far higher rates of tobacco use, while women had higher rates of obesity and lack of exercise, which may reflect historically lower rates of female participation in sports and outdoor recreation in India. As in the case of socio-economic factors, these differences suggest that interventions need to be mindful of the unique needs of men and women.

19Economics of Non-Communicable Diseases in India
NCD>1 = respondents who indicated having more than one chronic conditionSource: Harvard School of Public Health et al. (2011)
Figure 5: Rates of Selected NCDs and Risk Factors for Men and Women (LASI Pilot, 2011)
Heart disease Arthritis NCD>1 Tobacco No exercise Obesity
Male Female
resp
ond
ents
Family members: the overwhelming source of healthcare financing among survey respondents
The vast majority of respondents reported getting money from family members to pay for medical treatment (Figure 6). This cuts across demographic groups and disease types. Because older adults in the pilot study were mostly dependent on kin groups to provide financial support for health expenditures, the ability to pay for treatment, for at least some individuals, was likely tenuous and highly dependent on personal and family circumstances at the time. An ageing India, whose population is growing more susceptible to NCDs, is likely to put added economic stress on both private households and healthcare delivery systems. Data from the first full wave of LASI, scheduled for 2014, could add additional information on the links between ageing and NCDs in India.
Source: Harvard School of Public Health et al. (2011)
Figure 6: Reported Payment Mechanisms for Adults 45+ (%) (LASI Pilot, 2011)
87%
7%
3% 2% 1%
Family
Free
Borrowing
Employer
Insurance

20 Economics of Non-Communicable Diseases in India
3. The Economic Burden of Non-Communicable Diseases in India

21Economics of Non-Communicable Diseases in India
a. The Macroeconomic Burden The global burden of NCDs is expected to increase, owing to two related demographic phenomena (Bloom et al., 2011): first, the rise in global population, and second, the growth of the older population. This is the case for many nations, including India; currently, 5.3% of its population is aged 65 or older, and this is expected to increase to 9.2% by 2035 (United Nations Population Division, 2012; Wolf et al., 2011). The increase in the older population has important implications for the burden of disease in India and elsewhere, because this age group is the most affected by illness (Dey et al., 2012; Bloom et al., 2012; Williams & Krakauer, 2011; National Sample Survey Organisation, 2006). Studies have highlighted the potential growth of chronic disease in developing and emerging nations, and its impact on population health (Kearney et al., 2005). In emerging economies like India, which rely on rapid economic transformation to reduce poverty and improve population welfare, it is particularly important to understand the potential threats to this transformation (e.g. ill health, and an increasing burden of NCDs).
This section presents the method for estimating the economic burden of NCDs (the EPIC model). This approach is applied to arrive at estimates of the economic burden of NCDs in India for 2012-2030; and, for comparative purposes, the results are placed in the context of other published estimates and new figures for projected economic losses to China – another rapidly emerging economic power and population leader – during the same time period.2
Brief background on the EPIC model
One way of estimating the magnitude of health’s effect on growth is to construct a macroeconomic model that incorporates health alongside conventional factors of production, including capital and labour (Solow, 1956).3 WHO’s EPIC model, first introduced by Abegunde and Stanciole (2006), is used to estimate the economic burden of NCDs. Estimates account for two channels through which health affects the level and growth rate of income per capita. The first concerns the diversion of savings from capital investment to healthcare consumption due to NCD treatment, while the second involves the reduction in available labour supply owing to NCD mortality. Technological progress is assumed to be 1% per year and invariant to NCDs, with starting values for each country’s technology parameter chosen to align its capital and labour inputs and its actual output. Abegunde and Stanciole (2006) and Bloom et al. (2011, 2013) explain the model in detail.
EPIC focuses directly on the effect of five NCDs (ischaemic heart disease, cerebrovascular disease, diabetes, COPD, and breast cancer) on the growth rate of income per capita. For purposes of the application presented herein, the results are inflated using information on DALYs from WHO (2008b) to reflect the losses associated with four larger categories of NCDs (cardiovascular diseases, cancers, chronic respiratory
diseases, and diabetes). This is done by calculating the proportion of DALYs in a particular domain (e.g. chronic respiratory diseases) that are accounted for by the relevant disease in EPIC (COPD in this instance). If COPD accounts for 50% of total DALYs lost to chronic respiratory diseases in a country, the scaling factor applied to the EPIC results for COPD to obtain a result for all chronic respiratory diseases for that country is 2. Similarly, the macroeconomic impact of mental health conditions is estimated by using WHO data on DALYs due to mental health conditions to create a mental health scaling factor. This factor is calculated by obtaining the ratio of DALYs accounted for by the four NCD domains to DALYs accounted for by mental health conditions.
Data sources
The EPIC model estimates are based on data from a variety of sources. Data on economic variables were obtained from Abegunde and Stanciole (2006), World Bank (2011b), International Monetary Fund (IMF) (2013) and Heston, Summers, and Aten (2006). Demographic and health variables were sourced from UN population data and WHO (2008b). Mortality projections were obtained from WHO, which also provided age-specific labour force participation rates (WHO, 2008b). Imputed rates of technological progress were constructed as part of the research described in Bloom et al. (2014).
Results: $4.58 trillion lost in India before 2030 due to NCDs and mental disorders
EPIC model results for India, and the scaled-up results for the time period 2012-2030, represent the cumulative lost economic output from five categories of illness in 2010 dollars, and provide a glimpse of the potential impact of NCDs on the Indian economy over this period.
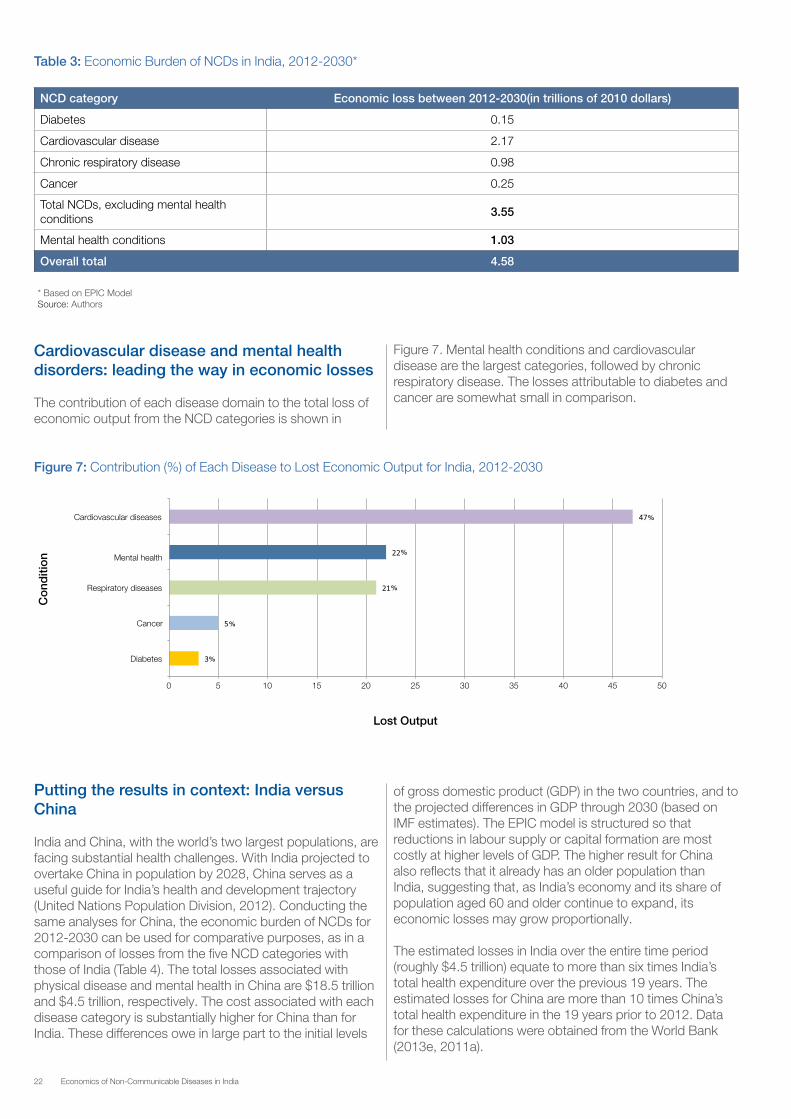
The results from scaling up each disease in the EPIC model to the five WHO categories of diabetes, cardiovascular disease, chronic respiratory disease, cancer, and mental health conditions are shown in Table 3. The scaling factors reflect India’s burden of disease according to WHO (2008b). The total losses associated with physical disease and mental health are $3.55 trillion and $1.03 trillion, respectively, or a staggering overall total of $4.58 trillion in lost economic output for the 18-year period.
22 Economics of Non-Communicable Diseases in India
* Based on EPIC ModelSource: Authors
Table 3: Economic Burden of NCDs in India, 2012-2030*
Figure 7: Contribution (%) of Each Disease to Lost Economic Output for India, 2012-2030
NCD category Economic loss between 2012-2030(in trillions of 2010 dollars)
Diabetes 0.15
Cardiovascular disease 2.17
Chronic respiratory disease 0.98
Cancer 0.25
Total NCDs, excluding mental health conditions
3.55
Mental health conditions 1.03
Overall total 4.58
Cardiovascular disease and mental health disorders: leading the way in economic losses
The contribution of each disease domain to the total loss of economic output from the NCD categories is shown in
0 5 10 15 20 25 30 35 40 45 50
�Diabetes
Cancer
Respiratory diseases
Mental health
Cardiovascular diseases
Lost Output
Co
nditi
on
%
%
%
%
%
Putting the results in context: India versus China
India and China, with the world’s two largest populations, are facing substantial health challenges. With India projected to overtake China in population by 2028, China serves as a useful guide for India’s health and development trajectory (United Nations Population Division, 2012). Conducting the same analyses for China, the economic burden of NCDs for 2012-2030 can be used for comparative purposes, as in a comparison of losses from the five NCD categories with those of India (Table 4). The total losses associated with physical disease and mental health in China are $18.5 trillion and $4.5 trillion, respectively. The cost associated with each disease category is substantially higher for China than for India. These differences owe in large part to the initial levels
of gross domestic product (GDP) in the two countries, and to the projected differences in GDP through 2030 (based on IMF estimates). The EPIC model is structured so that reductions in labour supply or capital formation are most costly at higher levels of GDP. The higher result for China also reflects that it already has an older population than India, suggesting that, as India’s economy and its share of population aged 60 and older continue to expand, its economic losses may grow proportionally.
The estimated losses in India over the entire time period (roughly $4.5 trillion) equate to more than six times India’s total health expenditure over the previous 19 years. The estimated losses for China are more than 10 times China’s total health expenditure in the 19 years prior to 2012. Data for these calculations were obtained from the World Bank (2013e, 2011a).
Figure 7. Mental health conditions and cardiovascular disease are the largest categories, followed by chronic respiratory disease. The losses attributable to diabetes and cancer are somewhat small in comparison.

23Economics of Non-Communicable Diseases in India
* Based on EPIC ModelSource: Authors
Table 4: Economic Burden of NCDs in India and China, 2012-2030*
NCD category Economic loss (in trillions of 2010 dollars)
India China
Diabetes 0.15 0.49
Cardiovascular disease 2.17 7.62
Chronic respiratory disease 0.98 4.79
Cancer 0.25 5.62
Total NCDs, excluding mental health conditions
3.55 18.52
Mental health conditions 1.03 4.51
Overall total 4.58 23.03
NCDs have and will continue to cost India dearly. The EPIC model predicts that in 2012-2030, NCDs will lead to as much as $4.58 trillion (2010 dollars) in lost output due to savings lost and reallocated for treatment, and foregone productivity of sick or dead workers.
Other studies have attempted to quantify NCDs’ burden to the Indian economy. For example, Thakur et al. (2011) report that the cost of NCDs is about 5-10% of GDP. Mahal, Karan, and Engelgau (2009) use a production function approach to estimate NCDs’ impact on India’s annual GDP. Their results – that India stands to incur a cost of 4-10% in annual economic output due to NCDs – assumed a scenario in which NCDs were completely eliminated, which is unlikely.
The EPIC model reflects the macroeconomic cost of NCDs, but it does not indicate who will be hardest hit by these losses. Engelgau, Karan, and Mahal (2012) looked at Indian household spending patterns, tracking the proportion of OOP spending attributable to NCDs in 1995-1996 and again in 2004. Their data suggested that the share of OOP health expenditure due to NCDs rose over time, from 32% in 1995–1996 to 47% in 2004. The share of these expenses dedicated to NCDs differed, with wealthier households allocating a larger portion of their spending to NCD care than poorer households. The authors posit that this is probably because of greater healthcare-seeking and preventive-care-seeking behaviour by wealthier households. Engelgau, Karan, and Mahal (2012) also demonstrate that hospitalization for NCDs was more likely to cause catastrophic health expenditure and put households at greater risk of falling into poverty than hospitalization for communicable diseases. The power of NCDs to impoverish households was also observed across different household income levels.
While the EPIC model provides an important macroeconomic picture of losses, further research is necessary to translate this loss into action steps for policy-makers. Both the model and research are needed to make a compelling case for NCD intervention in India. By putting a more precise number on the estimated cost, the EPIC model will hopefully kick-start discussions on how to recapture some of the $4.58 trillion in lost output.
b. NCD Concerns in India’s Business Community India’s business community has a natural concern with NCDs. Their potential negative impact on output, revenue, and profitability threatens business performance and economic growth. NCDs can impede workforce productivity by elevating rates of absenteeism, diminishing the energy and focus of workers and depleting critical workplace skills. Rising costs of both life and health insurance may also be a concern. In addition, the business community is likely to be concerned with NCDs’ impact on the size and purchasing power of their current and prospective customer bases.4 Businesses may be interested in mitigating negative impacts of NCDs through workplace health programmes aimed at prevention, early detection, treatment, and care.
To explore these issues, this section examines responses from the World Economic Forum’s annual Executive Opinion Survey (EOS), which generates much of the data used to construct the Global Competitiveness Index. Although not a representative sample of the business community, the Forum’s EOS is the first global business survey to include questions on NCDs and workplace responses to them. The survey focuses on business opinion (which may or may not match objectively verifiable fact), and allows comparisons of India with other countries and among Indian business leaders with different attitudes and economic concerns. While Bloom et al. (2011) took a first look at opinions of business executives around the globe regarding the potential impact of NCDs on their business’ bottom lines, this report provides the first look at the responses of business leaders specifically in India and China. This report also looks at four years of responses, from 2010 to 2013.5
Overall, the Forum’s EOS data suggest that Indian business executives are keenly aware of the risks that NCDs pose to their companies. The data also indicate that executives understand the old adage that “an ounce of prevention is worth a pound of cure”, as many are designing and implementing policies to prevent and control NCDs among their workforces. The results also show that interventions aimed at promoting physical activity and stress reduction have the largest potential for expansion.

24 Economics of Non-Communicable Diseases in India
In 2013, one-third of Indian and Chinese respondents reported that one or more NCDs would have a somewhat serious to serious impact on their companies in the next five years (Table 5).6 NCDs included in the annual EOS from 2010 to 2013 were heart disease and related cardiovascular problems, cancer, mental health conditions, and diabetes, while the EOS in 2012 and 2013 also included chronic respiratory disease. The results show quite sizeable expectations among Indian business leaders of a “somewhat serious to serious impact” of NCDs on their companies over the next five years (42% of business leaders in 2010, 52% in 2011, 50% in 2012 and 33% in 2013), with somewhat higher levels of concern among business leaders who believe their country’s health system is of low quality and not widely accessible.
Levels of concern are historically higher among Indian than among Chinese business executives; for China, the corresponding results were 26% (2010), 24% (2011), and 20% (2012), notwithstanding that NCDs accounted for a higher share of morbidity and mortality in China than in India. In 2013, the level of concern among Chinese respondents reached 33%, the same result as for Indian business executives. Indian respondents were mostly concerned about diabetes and heart disease, while levels of concern for cancer, mental health conditions, and chronic respiratory disease, as well as for HIV/AIDS, tuberculosis, and malaria, were significantly lower.
– = no data available. * Business executives reporting an expectation of a “somewhat serious to serious impact” on their companies in the next five years. Source: EOS, World Economic Forum
Table 5: Perceptions of NCDs Seriously Impacting Business*
India (% of respondents) China (% of respondents)
20107,8 20119 201210 201311 201012 201113 201214 201315
One or more NCDs 41.9 52.2 50.0 33.3 25.6 24.0 20.1 32.6
Heart disease 23.9 32.9 35.4 22.0 11.6 13.4 10.5 14.3
Cancer 20.0 21.9 15.5 14.6 14.1 12.8 9.7 15.7
Mental health conditions 12.8 16.3 15.7 6.1 15.8 12.5 9.7 12.1
Diabetes 25.3 35.5 31.8 24.7 8.1 9.6 7.8 11.8
Chronic respiratory disease – – 18.5 18.3 – – 4.6 16.0
HIV/AIDS 16.9 16.6 12.1 13.4 11.1 12.8 4.9 12.7
Tuberculosis 6.7 13.4 14.7 11.0 7.8 7.9 5.7 11.0
Malaria 4.5 16.1 18.8 13.4 7.2 6.6 2.5 9.1
Table 6 shows the proportion of Indian and Chinese respondents reporting that NCDs would have at least a “moderate impact” on their companies in the next five years.16 In relation to this threshold, the results indicate nearly universal concern among Indian business executives with the five-year impact of one or more NCDs: 97% in 2010, 96% (2011), 95% (2012), and 94% (2013), with the highest levels of concern continuing to be for heart disease and diabetes.17 Levels of concern were not as high among Chinese business executives: 78% in 2010, 82% (2011), 78% (2012) and 83% (2013).
The prevalence of workplace policies and programmes related to NCD prevention and support are shown by year for 2010-2012 (Table 7).18 The policies and programmes pertain to smoking, alcohol-free workplaces, exercise, mental health, and physical health. For all years, smoke-free workplace policies are highly prevalent among the Indian respondents’ companies, followed by policies for alcohol-free workplaces. Least prevalent are policies and programmes related to mental health and exercise.19
A notable gap exists between the nominal establishment and the implementation of all policies and programmes (shown for 2010 and 2011, Table 8). The gaps are largest for the prevention, screening and support of physical health problems; the prevention, screening for, and support of individuals with mental health problems; and incentives for exercise.20

25Economics of Non-Communicable Diseases in India
– = no data available. * Business executives reporting an expectation of at least a “moderate impact” on their companies in the next five years.Source: EOS, World Economic Forum
Source: EOS, World Economic Forum
Table 6: Perceptions of NCDs Seriously Impacting Business*
Table 7: NCD Prevention and Support: Prevalence of Company Policies and Programmes, Already Established
India (% of respondents) China (% of respondents)
2010 2011 2012 2013 2010 2011 2012 2013
One or more NCDs 96.5 95.6 95.4 93.8 77.8 82.2 77.8 82.9
Heart disease 83.7 87.8 82.3 87.8 67.6 75.7 59.5 70.5
Cancer 67.8 71.9 73.6 79.3 62.3 70.8 56.2 68.0
Mental health conditions 54.7 60.9 60.2 69.5 60.3 66.8 56.3 63.4
Diabetes 79.1 84.6 81.8 84.0 63.1 66.7 55.7 67.8
Chronic respiratory disease – – 73.1 85.4 – – 55.3 74.4
HIV/AIDS 53.9 61.0 50.5 63.4 38.9 48.4 40.1 52.3
Tuberculosis 52.8 61.6 57.8 64.6 43.2 54.9 43.2 57.0
Malaria 58.4 58.3 64.3 64.6 35.6 42.2 35.8 55.1
India (% of respondents) China (% of respondents)
Policy/
programme2010 2011 2012
Moderate or substantial compliance/uptake of programmes, 2012
2010 2011 2012
Moderate or substantial
compliance/uptake of programmes, 2012
Smoke-free 91.6 87.8 82.4 87.6 74.3 74.4 93.5 64.0
Alcohol-free 77.1 75.2 72.4 88.2 49.2 46.1 93.0 47.5
Incentives for exercise 38.3 39.4 46.7 63.3 87.4 83.5 98.4 61.4
Mental health: prevention, screening, and support
52.6 50.4 58.0 79.3 65.0 68.8 96.5 48.9
Physical health: prevention, screening, and support
73.7 65.1 63.7 81.5 84.3 81.2 97.0 64.7
Source: EOS, World Economic Forum
Table 8: NCD Prevention and Support: Prevalence of Company Policies and Programmes, Established and Implemented
India (% of respondents) China (% of respondents)
Policy/programme 2010 2011 2010 2011
Smoke-free 83.2 76.1 58.7 57.6
Alcohol-free 68.8 62.2 37.7 32.4
Incentives for exercise 18.1 16.8 64.5 63.2
Mental health: prevention, screening, and support
26.3 26.1 44.0 45.4
Physical health: prevention, screening, and support
43.2 43.2 66.9 65.0

26 Economics of Non-Communicable Diseases in India
4. Addressing Non-Communicable Diseases in India: Intervention Costs and Returns

27Economics of Non-Communicable Diseases in India
This section focuses on the costs and ROI of specific interventions implemented in India. It describes the methodology used for selecting relevant interventions and analysing what it would take for them to deliver an above-average ROI.
a. Methodology for Selecting Interventions The methodology for selecting interventions for analysis included identifying them, and developing and applying a screening process to determine specific ones to include in the study and this report (Figure 8).
Source: Authors
Figure 8: Selection Process for Interventions
Identification of 33 candidate interventions
for NCD management through literature search and expert consultation
Intervention
Feasibility
Assessment
Criteria: Addresses one or NCDs or risk factors Accessible data on costs and/or benefits Measured or modelled data
Interventions
A 12 interventions B
4 interventions
C 17 interventions
Identified 33 candidate interventions
Sought data on 33 interventions
Evaluated interventions against inclusion criteria
Categorized interventions based on data availability
Identification of interventions in India
The first step was to create a list of NCDs and healthy-living interventions in India. Given that no inventory of NCD programmes in India existed at the time the research for this report was conducted, information was gathered in three ways:
– Literature review
– Expert opinion
– Site visits in India to health establishments, hospitals, public health agencies, and research centres
– “NCD-related interventions” included those targeting:
– One of multiple key risk factors for NCDs, namely unhealthy diet, harmful use of alcohol, physical inactivity, and tobacco use
– Prevention, treatment, and care of one or multiple diseases, namely cardiovascular disease, cancer, diabetes, chronic respiratory disease and mental health conditions
– Risk factors or diseases across different stages of the life cycle

28 Economics of Non-Communicable Diseases in India
Interventions identified also included those deployed in schools, workplaces, and healthcare settings (Appendix D).
The initial assessment of the NCD landscape in India identified 33 interventions (Appendix C). This is not an exhaustive list, and the distribution of interventions across the different diseases, risk factors, life-course stages, and settings is uneven. Rather, this list represents a selection of promising approaches to address NCDs.
Screening and selection process for interventions to include in the study
The next step was to seek data on these interventions to evaluate the feasibility of conducting economic analyses, including information on target population for the intervention, delivery costs, benefits (in terms of health outcomes and others, such as productivity and financial risk protection), time frame of the costs and benefits, and monitoring and evaluation.
The following criteria had to be met for interventions to be included in the economic analyses:
– The intervention had to address one or more of the main NCDs or behavioural risk factors.
– Data on the costs or benefits of the intervention, or both, had to be available to the research team.
– Data on costs and benefits had to originate from either direct measurement of the intervention or from modelling the intervention’s projected costs or benefits.
The inclusion of interventions for analysis was heavily data-driven. Many interventions were fairly new and thus did not yet have data on effectiveness; others had only process indicators as data because they had not incorporated a strong monitoring and evaluation plan; and, others may have collected data, but those data were not available to the study team. Data on the costs and benefits of such interventions in India are rare.
Evaluating against these criteria, the research team categorized the interventions into one of three groups:
– Category A - Interventions with data: This category refers to interventions with data on at least one side of the equation (i.e. benefits or costs). For interventions with data on impact but not on costs, the research team sought to calculate the programme cost that would yield a favourable ROI (defined at 15%). Conversely, for interventions with data on cost but not on impact (e.g. an intervention in its early stages, or that lacks impact measurement), the research team sought to calculate the minimum health impact an intervention would have to achieve a 15% return on the initial investment. Twelve interventions fell in this category.
– Category B - Interventions without data on costs and
benefits, but with descriptive information: Although seen as promising approaches to healthy living in India, these interventions did not have data on costs or benefits due
to their early stage, their lack of monitoring and evaluation, or data inaccessibility. However, they did have robust information on operations, which could be helpful to programme planners. Thus, Appendix D describes these interventions in detail, but they are not included in the economic analyses.
– Category C - Interventions left out of this report: These
emergent interventions did not have enough information to describe or conduct economic analyses, and are thus left out of this report. (Appendix C has the full list of 33 interventions, including those in this category.)
b. Assessment Results: Category A InterventionsThis section covers the following list of Category A interventions in greater detail (Figure 9 is a map showing their locations):
1. NPCDCS: national plans and state-level experience in Karnataka
2. Dietary salt reduction
3. Health Systems Strengthening Project: state-level experience in Tamil Nadu
4. HPV vaccination: public policy for prevention of cervical cancer
5. Tobacco taxation: public policy response to prevent tobacco use
6. Tobacco regulation: enforcement of a complete smoking ban in public places
7. Mobilizing Youth for Tobacco-Related Initiatives (MYTRI): school-based programme in Delhi and Chennai to prevent use of tobacco
8. Kidney Help Trust of Chennai: community-based kidney care programme to address diabetes and hypertension, and prevent chronic kidney disease (CKD)
9. Indian Diabetes Prevention Programme (IDPP)
10. Stepped Care Intervention for Depressive and Anxiety Disorders (MANAS) in Goa
11. WHO best buys: combination drug therapy for CVD
12. Bangalore Baptist Hospital (BBH): community-level intervention for CVD prevention and management

29Economics of Non-Communicable Diseases in India
Source: Authors
Figure 9: Map of Category A Interventions
Results of assessment: details of category A interventions
In 2008, the Government of India announced the establishment of the NPCDCS, for implementation in seven states (one district per state; Hood, 2012). On 8 July 2010, the Cabinet Committee on Economic Affairs approved a pilot of the NPCDCS for implementation during the last two years of the 11th Five Year Plan (PIB, 2010).
The overarching goal of the pilot programme was to achieve “behaviour change in the community to adopt healthy lifestyles, resulting in overall reduction in the risk factors of common NCDs in the community” (PIB, 2010). The idea behind the NPCDCS is to supplement existing state and local efforts by offering both technical and financial support through one coordinated programme that addresses the main NCDs (Directorate General of Health Services, 2010). The programme, aimed at adults over 30 years of age, attempts to identify those with NCDs and risk factors, such as high blood pressure and high blood sugar, in order to delay the onset of complications.
1. NPCDCS: national plans and state-level experience in Karnataka
Health conditions:
– cancer– CVD– diabetes
Settings:
– community– health system– policy
The programme has several objectives:
– Prevent and control common NCDs through behaviour and lifestyle changes
– Provide early diagnosis and management of common NCDs
– Build capacity at various levels of healthcare for prevention, diagnosis, and treatment of NCDs
– Train human resources within the public health set-up – doctors, paramedics, and nursing staff – to cope with the increasing burden of NCDs
– Establish and develop capacity for palliative and rehabilitative care (Directorate General of Health Services, 2010)
The NPCDCS is intended to complement other national programmes, including the National Tobacco Control Programme, the NRHM, and NPHCE. During the pilot phase, the programme was targeted for implementation in 20,000 subcentres and 700 community health centres, across 100 districts in 21 states. The Government of India outlined a

30 Economics of Non-Communicable Diseases in India
package of NCD services that should be delivered in the health system at different levels of care: the subcentre, the community health centre, the district hospital, and the tertiary cancer centre. Screening camps are also a core part of the NPCDCS (Directorate General of Health Services, 2010). Results of the pilot screening efforts were reported by the Secretary of Health and Family Welfare in April 2013; they suggest that approximately 7% of the population aged 30 and older have diabetes, and approximately 6.5% have hypertension (PIB, 2013).
The launch and recently announced national plan to scale up the NPCDCS indicate the Government of India’s recognition of NCDs as a large problem meriting a national solution. By focusing on the risk factors for diabetes and hypertension, the programme aims to detect these conditions at the opportune time (i.e. before serious complications set in). The NPCDCS involves training of health personnel and, through this, aims to build the existing system’s capacity to recognize and treat NCDs and their risk factors. The programme relies heavily on the ancillary nurses/midwives (ANMs) to conduct screening and health education tasks – an approach to build capacity of front-line health workers and use the least expensive workers to carry out basic tasks, thus reserving the limited time of doctors and specialists for more complex cases.
The NPCDCS, as designed, is a necessary – but not sufficient – programme to reduce NCDs’ national burden. While screening and early diagnosis are important, efficient referral systems, seamless monitoring of patients across levels of care, well-funded treatment options, and a host of supportive services to prevent and manage NCDs and their risk factors are needed.
Intervention costs: nationalDuring the 11th Five Year Plan, the central government estimated the pilot at INR 1,231 crore (approximately $217 million), with an 80% central and 20% state share (PIB, 2010). The programme has continued under the 12th Five Year plan (2012-2017), with total funds amounting to INR 15,855 crore (about $2.95 billion) for the cancer part of the NPCDCS, and INR 5,880 crore (approximately $1.15 billion) for the diabetes, cardiovascular disease, and stroke components (Singh, 2013). The NPCDCS is expected to ramp up to all districts nationwide under the 12th Five Year Plan, as announced by the Government of India on World Health Day 2013 (PIB, 2013; Economic Times, 2013).
Implementation of the NPCDCS at the state level: the Karnataka experienceThe state of Karnataka has launched the NPCDCS in five of its 30 districts (Kolar, Shimoga, Tumkur, Udupi, and Chikmagalur) to cover 8,462,157 people, or approximately 26% of the state’s population. In those five districts, 1.5 million people over 30 years of age have been screened for diabetes and hypertension via screening camps (Government of Karnataka, 2013). Preliminary, unadjusted results indicate a diabetes prevalence rate hovering at around 10% of adults over 30 years old in those five districts. Under this programme, all five districts have formed NCD cells and NCD clinics, as outlined in the NPCDCS operational guidelines. Since March 2013, 111 staff
members have been involved in the programme in Karnataka state.
In addition to diabetes and hypertension screening efforts, Karnataka was the first state in India to launch a cancer screening camp. This effort, in collaboration with Kidwai Memorial Institute of Oncology, has trained health professionals in the Kolar district to screen and diagnose cancers, and then refer patients to city hospitals for further treatment (Singh, 2013).
Some capacity-building efforts for NCD screening and care have taken place in Karnataka; four specialists have been trained in geriatric care, and five general doctors have been trained in New Delhi as part of a “train the trainers” effort. The five doctors returned to their districts and, in turn, have trained 80 doctors in NCD screening and other elements of the programme. The 80 doctors are expected to train the paramedical staff to support the NPCDCS. Furthermore, all ANMs have received training in diabetes screening (Government of Karnataka, 2013).
Intervention costs: Karnataka Education and awareness of NCDs are main activities being carried out in the NPCDCS implementation in Karnataka. Actions include the distribution of pamphlets and handouts, communication campaigns, and social mobilization through women’s self-help groups, community leaders, and non-governmental organizations. In Karnataka, programme implementation costs about INR 2 crore annually per district, or roughly $372,000 in 2013 (the current programme running in five districts costs INR 10 crore). The plan is to scale up the programme by five districts each year until the entire state is covered.

31Economics of Non-Communicable Diseases in India
2. Dietary salt reduction Health conditions:
– hypertension – CVD
Settings:
– community– health system
Of all major NCDs, CVDs bear the highest burden of morbidity and mortality in India, accounting for nearly 10% of all DALYs and more than 20% of all deaths in 2010 (IHME, 2013). These figures rise dramatically with age; among Indian adults aged 50-69, CVDs accounted for more than 20% of all DALYs and 28% of all deaths in the same year (IHME, 2013). Several high income countries have implemented stronger regulations on salt content in food products, and have subsequently seen decreased rates of CVDs (Puska et al., 1998; Webster et al., 2011). No such restrictions are in place in India.
Benefits of dietary salt reductionUsing a mathematical simulation, Basu et al. (2012) predict that reducing salt intake by 3 grams a day over the next 30 years would lead to about a 5% annual decrease in myocardial infarctions, a 6.5% annual decrease in strokes, and an almost 5% annual decrease in deaths among Indian adults aged 40-69 in both rural and urban areas.
Possible costs of dietary salt reductionWHO lists “voluntary salt reduction” as a best buy for India, projecting educational and advertising costs at $33,400 per million people, per year (WHO & World Economic Forum, 2011).
3. Health Systems Strengthening Project: state-level experience in Tamil Nadu
Health conditions:
– cervical cancer– hypertension – CVD
Settings:
– community– health system
In 2007-2010, the Government of Tamil Nadu piloted two programmes aimed at prevention and control of cardiovascular diseases, and early detection and control of cervical cancer. These pilots were part of a larger health systems improvement project focused on increasing effectiveness of both public and private health services in Tamil Nadu, and were funded by the World Bank and implemented by the Health and Family Welfare Department of Tamil Nadu. The Health Systems Strengthening Project has four main parts: (1) increase access to health services by the poor, disadvantaged, and tribal groups; (2) develop and pilot test interventions to address health challenges, specifically NCDs; (3) improve health outcomes, access, and quality of service delivery through strengthened oversight of the public sector and engagement with the non-governmental sector; and (4) increase effectiveness of public-sector hospital services (World Bank, 2013c).
Cervical cancer pilotThe cervical cancer prevention pilot was aimed at 30-60-year-old women in two districts of the state: Theni and Thanjavur. These districts, with 3,646,465 people, represent 5% of Tamil Nadu’s population (Registrar General and Census Commissioner, 2011). The pilot’s objectives were to screen all women in the targeted age group in the two districts, identify and treat all cases of cancer, and increase awareness of cervical cancer (Tamil Nadu Health Systems Project, 2009; Ray & Varghese, 2010; Vijay, 2012). Additionally, the pilot experience was designed to provide a model for a later, larger-scale programme to be incorporated into Tamil Nadu’s government health system.
The programme combines community-based awareness activities with treatment in the health system.22 At the community level, village link volunteers create awareness of cervical cancer and screening among women, and encourage them to visit the screening centres. At the
centres, counsellors and assistants educate women and raise awareness of the importance of screening and early detection.
Screening occurs in health centres; all primary health centres and government hospitals in the two districts function as screening centres. Screening is done by visual inspection, an effective approach for cervical cancer screening particularly in low-resource environments, where the proper training and supervision for quality control can be implemented (WHO & PAHO, 2013; WHO, 2013m; Alliance for Cervical Cancer Prevention, 2011). The two techniques used in this pilot were VIA and visual inspection with Lugol’s iodine (VILI), both of which have been supported by studies carried out throughout India.
Positive screens are referred for colposcopy; four government hospitals are designated as screening centres and diagnostic colposcopy centres. Positive colposcopic exams are then referred for biopsy. Diagnosis of cervical cancer and grade is made based on the histopathological findings. Two medical colleges function as higher treatment centres.
CVD pilotThe same project also piloted a programme for prevention of hypertension and CVD. The pilot was carried out in two blocks of the districts of Sivagangai and Virudhunagar, which represent approximately 4.5% of Tamil Nadu’s population (Registrar General and Census Commissioner, 2011). Like the cervical cancer pilot, the hypertension/CVD pilot is rooted in raising awareness, and screening and preventing these health conditions among community members. This pilot was carried out in four settings: community, clinic, school, and workplace.
32 Economics of Non-Communicable Diseases in India
Community activities to raise awareness included village group meetings, exhibitions, and radio messages. Screenings were carried out in Government Health System clinics. In schools, education professionals were trained in the programme’s messages of healthy lifestyles, and students were invited to join the “Junior Heart Club”. Workplace awareness and educational activities encouraged workers to visit local clinics for CVD screening and treatment, and Heart Clubs as well as workplace programmes to improve diet were established. The project reports that 992,000 people have been screened for hypertension, and 23% of adults who screened positive for hypertension achieved blood pressure control within one year. Fifty schools and 10 workplaces have completed the programme activities.
Programme evaluation and scaling up Neither the cervical cancer nor the hypertension/CVD pilot allows for a true economic evaluation, as the programme benefits in terms of health outcomes (lives saved, disease cases averted or DALYS averted) were not measured. Furthermore, no baseline data are available to compare the effectiveness of this programme against other options. However, the evaluation data demonstrate that screening can be a low-cost option, and that the follow-up of patients is an important obstacle to overcome in any programme aimed at NCD screening and treatment.
After the pilot experience, additional funding was provided by the World Bank and the Government of Tamil Nadu for scaling up the programme throughout the state (World Bank, 2013c). With regard to the NCD-specific parts, the scaled-up programme focuses on four NCDs, namely CVD, diabetes, cervical cancer, and breast cancer (Selvam, 2013; Alvarez, 2010; World Bank, 2013a), and four settings: the community, the health system, schools, and workplaces. Screening activities have expanded to include all four diseases, with the aim of reaching Tamil Nadu’s entire population of 30-60-year-olds.
The programme is designed to be carried out in phases, starting with 16 districts in phase I (2012) and another 16
districts in phase II (2013). Thus far, the programme has screened for the four diseases in increasing numbers since October 2012. Consistent progress is being made, albeit the pace is slower than anticipated; the project is scheduled to end in September 2014 (World Bank, 2013a).
The state of Karnataka has also received World Bank funding for a health systems strengthening programme, which will include a non-communicable-disease component similar to the Tamil Nadu project (World Bank, 2012; World Bank, 2013b). The Karnataka programme will conduct a baseline survey of the population so that estimates of the programme’s effects may be possible (Abikar, 2013). A thorough costing study of the Tamil Nadu pilot projects was done. However, data on health outcomes have not been measured, thus prohibiting a true cost-benefit analysis.
Intervention costsA Public Health Foundation of India evaluation of the cervical cancer pilot project showed that nearly 500,000 women, or 85% of the target population, were screened at an average cost per screening of INR 102 (about $1.80). This result indicates that VIA is both an inexpensive approach to cervical cancer screening and, coupled with community-awareness activities, an effective way of reaching the Tamil Nadu population. The pilot faced some challenges, however. The evaluation cites low rates of follow-up treatment (only 13% of confirmed cases received any kind of treatment in this project),23 and high costs per treated case (INR 500,745 or roughly $8,856) (Ray & Varghese, 2010).
Similar to the cervical cancer project, evaluation of the CVD project shows that low treatment rates (35% of those with hypertension sought treatment) and poor follow-up of patients were major challenges (Ray & Varghese, 2010). The pilot programme cost INR 32 ($0.57) per person screened, representing a low-cost option for identifying adults with hypertension in Tamil Nadu. The cost per patient treated was INR 656 ($11.60), and INR 992 ($17.54) per patient achieving blood pressure control (the latter is the cost per year on an ongoing basis) (Ray & Varghese, 2010).
4. HPV vaccination: public policy for prevention of cervical cancer
Health conditions:
– cancer
Settings:
– health system– school– policy
A viable low-cost approach to cervical cancer prevention in India is vaccination for HPV, the leading cause of this cancer (Farooqui & Zodpey, 2012). Presently two vaccines are licensed in India: Cervarix and Gardasil. While both target HPV 16 and 18, the two HPV strains that cause 70% of cervical cancer, Gardasil additionally protects against HPV 6 and 11, which cause 75-90% of genital warts, and HPV type 16/18-related anal, vaginal, and vulvar precancers and cancers (Barnighausen et al., 2012). Each is administered in three doses: Gardasil at zero, two, and six months, and Cervarix at zero, one, and six months (Kaarthigeyan, 2012).
To provide vaccination before individuals become sexually active, girls aged 9-12 should be targeted (GAVI, 2013).
Females up to the age of 26 who have not been infected are also eligible for the vaccine. GAVI (the Vaccine Alliance) research shows that school-based interventions are the best strategy for achieving high coverage among the adolescent population. Complementary strategies for reaching girls who are out of school should also be considered (GAVI, 2013).
Currently, the public sector does not provide the vaccine, and the private-sector cost, at INR 7,500 or $126 for the series of three doses, is prohibitive for most women (Kannan, 2013). But this may soon change. As of May 2013, the two companies that make the HPV vaccine have pledged to cut the price for the world’s poorest countries to less than $5 per dose. Some experts say that this price is still too high, but
33Economics of Non-Communicable Diseases in India
over time and with greater volumes sold, the cost is expected to drop further (McNeil, 2013).
GAVI, an organization committed to increasing access to immunizations in poor countries, helped broker the price reduction with the pharmaceutical companies, and is set to offer support to interested countries in need of capacity and infrastructure development to efficiently and effectively deliver the vaccines (GAVI, 2013). India, however, has yet to apply. Some speculate that this might be a consequence of a previous HPV vaccine project – led by the Programme for Appropriate Technology in Health (PATH) (Castellsaqué et al., 2007) in collaboration with the government – that was abruptly shut down amid concerns over the ethics and efficaciousness of the vaccine (Kannan, 2013).
Intervention costsIf the Government of India capitalizes on the GAVI programme, big gains could be made towards cervical cancer prevention. Based on modelling studies, a scaled-up programme at the GAVI price of $5 per dose would cost $738 million, but would avert 13 deaths for every 1,000 girls vaccinated. Further, researchers expect that with 70% coverage, this programme would reduce lifetime risk of cervical cancer by an average of 44% (Goldie et al., 2008). But, as was the case with the PATH project, targeting adolescent girls for a vaccine that guards against a sexually transmitted disease poses sociocultural obstacles that would need to be addressed and overcome for any intervention to be sustainable.
5. Tobacco taxation: public policy response to prevent tobacco use
Health conditions:
– CVD– chronic renal disease
(CRD)– cancer
Settings:
– policy
Tobacco taxation is one recommended measure to help countries implement the Framework Convention for Tobacco Control (FCTC) and reduce demand for tobacco products (WHO, 2013i). While the evidence shows that taxes are an effective way to reduce tobacco use, particularly among youth, tobacco taxes vary by product in India and are low for some widely used products, particularly bidis (John et al., 2010). In India, taxes on bidis and cigarettes amount to about 7% and 46%, respectively, of the retail price (Jha et al., 2011; Jha et al., 2012). This is substantially lower than the figure in high-income countries, where taxes account for 63% of the price of cigarettes (WHO, 2009b), and well below the WHO recommendation that excise taxes make up at least 70% of the retail price of tobacco products (Mackay, Eriksen & Ross, 2012). In addition, tobacco taxes have not kept up with inflation (John et al., 2010; Jha et al., 2011), so that, over time, tobacco products in India have become somewhat more affordable to the populace. Some states within India have raised value-added taxes on cigarettes and/or bidis in recent years (Jha et al., 2011). However, the current structure of tobacco taxation in India is not the most favourable for affecting demand and reducing consumption of tobacco products.
Intervention costsA comprehensive and staged approach to revising the tax structure for bidis and cigarettes was proposed by Jha et al. in 2011. Their estimate of the potential health and financial impacts in India of the revised tobacco tax structure indicate that about 3.3 million current cigarette smokers, and roughly 11 million current bidi smokers, would quit if the proposed structure were implemented; additionally, more than 6.7 million Indians under the age of 15 would not start smoking cigarettes (and 21.4 million would not start with bidis; Jha et al., 2011). Furthermore, Jha et al. have estimated that raising taxes on cigarettes and bidis to 58.1% and 33.3% of the retail price, respectively, would lead to increased tax revenue, despite the reduced pool of smokers. Other research studies have used the methodology of WHO-CHOICE (WHO-Choosing Interventions that are Cost-Effective) to estimate the cost-effectiveness of interventions to address NCDs, including tobacco taxation (Patel et al., 2011a). Patel et al. (2011a) estimated that increasing taxation of both bidis and cigarettes was an extremely cost-effective measure to combat NCDs.
6.Tobacco regulation: enforcement of a complete smoking ban in public places
Health conditions:
– CVD– CRD– cancer
Settings:
– policy
In response to the ratification of the WHO FCTC in 2004, India passed a public smoking ban as outlined in Article 8 of the treaty (Goel et al., 2014; Donaldson et al., 2011). Enforcement of such a ban would help in reducing second-hand smoke, also known as environmental tobacco smoke, in the public setting. According to the 2009 Global Youth Tobacco Survey in India, more than one-third of those surveyed reported second-hand smoke exposure outside the home (Raute et al., 2012). Second-hand smoke is a preventable environmental health hazard that can be
combated through behavioural modification. A ban on public smoking improves air quality for non-smokers and concomitantly promotes tobacco cessation among smokers (Singh et al., 2011). In turn, this legislative intervention can reduce disease, such as cardiovascular disease, cancer, and stroke, and death in the population (Raute et al., 2012).
To date, India has only implemented a partial smoking ban due to the acceptance of the Cigarettes and Other Tobacco Products Act in 2004, which allows for exemptions in

34 Economics of Non-Communicable Diseases in India
restaurants, hotels, and airports that exceed a certain seating capacity (Goel et al., 2013; Donaldson et al., 2011). The benefits of the legislation for a partial ban have yet to be measured (e.g. to what extent people have quit smoking), and how much second-hand smoke it has averted is unclear. Early reports suggest that adherence to the ban is not widespread, and that officials have not enforced it at a high rate (Express News Service, 2009).
Intervention costs Recent literature suggests that a comprehensive ban on smoking in public places in the state of Gujarat would be a cost-saving intervention, rather than the partial ban that is on the books today. In terms of administration such as signage and enforcement, the ban costs less than $0.01 per person (Donaldson et al., 2011). A comprehensive estimate of a complete smoking ban, by Donaldson et al. (2011) using WHO-CHOICE data, projects that the public would incur an $0.0824 expense per person annually (Asaria et al., 2007).
7. Mobilizing Youth for Tobacco-Related Initiatives (MYTRI): school-based programme in Delhi and Chennai to prevent use of tobacco
Health conditions:
– CVD– CRD– cancer
Settings:
– school
MYTRI, a school-based programme to prevent the use of tobacco, was carried out in Delhi and Chennai in 2004-2006. It involved more than 14,000 students aged 10-16 in 32 schools in a group-randomized trial design (Perry et al., 2009; Brown et al., 2012). The programme was grounded in social cognitive theory and based on other school-centred tobacco-prevention programmes in other countries. MYTRI consisted of a behavioural component (i.e. classroom activities), school posters that aligned with the classroom activity themes, postcards sent home to parents throughout the school year and peer-led activism (e.g. student-led competitions).
While tobacco use increased in the control schools, use of tobacco in the intervention schools decreased over time. MYTRI was particularly successful in reducing cigarette and bidi smoking; the programme did not focus on preventing chewing tobacco use, and no decrease occurred in the use of chewing tobacco among students in the MYTRI schools. MYTRI successfully affected students’ intention to smoke; at
the end of the two-year intervention, the proportion of students reporting intention to smoke decreased in the intervention schools. Among intervention schools, outcomes were similar across those from high- and low-resource areas, lending credence to the MYTRI approach and the possibility of scaling up the programme throughout India.
Intervention costsMYRTI costs can be categorized under training or implementation. Training costs reflect project staff teaching faculty and students; these expenses include hourly wages, travel expenditures, location costs, and project materials. Training costs totalled $32,318 for 16 schools ($2,020 per school) over the two-year project period, and implementation costs for personnel involvement and project materials came to $144,282 for 16 schools ($9,018 per school) over the same period. Brown et al. (2012) report that the costs per life year added and per quality-adjusted life year (DALY) added due to averted smoking are $4,348 and $2,769, respectively.25
8. Kidney Help Trust of Chennai: community-based programme to address diabetes and hypertension, and prevent CKD
Health conditions:
– kidney disease– diabetes
Settings:
– community– health system
The kidneys are responsible for removing waste and excess fluid from the blood – a process crucial to regulating the body’s chemical balance. CKD is a condition in which the kidneys fail to function optimally, i.e. their ability to filter waste and toxins from the blood is compromised. Many conditions can increase the risk of CKD, including hypertension, diabetes, and chronic use of medications that are toxic to the kidneys. Once CKD progresses to end-stage renal disease (ESRD), the only treatment options are dialysis or a kidney transplant (American Kidney Fund, 2008).
Estimates of the cost of renal replacement therapy range from approximately $4,440 to $8,880 per year in India (Ballal, 2007), an unaffordable price for many Indians. No clear understanding of the problem’s magnitude exists in the country. Estimates of the proportion of the population living with some type of renal disease range from 0.78% to 17%
(Ballal, 2007; Singh et al., 2013; Agarwal et al., 2005; Varma et al., 2010). Even conservative estimates indicate many Indians require renal replacement therapy, an economic burden that neither individuals and families, nor the public health system, can bear.
Kidney Help Trust of Chennai: a community-level interventionAlthough renal disease is not one of the core diseases in WHO’s Global Action Plan for the Prevention and Control of Noncommunicable Diseases 2013-2020, it is recognized as an important co-morbidity and a costly consequence – in both human and economic terms – of poorly managed diabetes and hypertension. Because most Indians cannot afford renal replacement therapy, Kidney Help Trust of Chennai, under the direction of M.K. Mani, chief nephrologist at Apollo Hospitals, Chennai, launched a low-cost, community-level prevention programme in the surrounding

35Economics of Non-Communicable Diseases in India
villages. The programme serves a population of 25,000 in rural areas.
Some of the main contributing factors to CKD are late diagnosis of diabetes and hypertension, inadequate management of blood sugar and blood pressure, diabetic nephropathy, and hypertensive nephropathy (Singh et al., 2013; American Diabetes Association, 2013; CDC, 2012; NIH, 2008; Mani, 2003; Mani, 2005). The programme, therefore, focuses on the screening and treatment of diabetes, hypertension, and renal disease to prevent grave complications, and the progression of early-stage renal disease to ESRD.
The basis of the programme is home-based screening, in which trained preventive and social health workers (PSHWs) visit community members at their homes. During the visit, the PSHW conducts a basic screening, consisting of a questionnaire, collection of a urine sample and blood pressure measurement. The home visit is followed by a doctor’s visit to the community (or the home) to conduct a
full examination and blood test. Treatment with low-cost drugs is initiated; patients’ blood pressure is monitored weekly by PSHWs; and patients with diabetes are managed by doctors. The Apollo Hospital Laboratory provides laboratory testing free of charge, and the trust provides medications.
Intervention costsThis intervention revealed a high rate of undiagnosed chronic disease; only 30% of the community that tested positive for renal disease or risk factors were aware of their condition before the screening (Mani, 2003; Mani, 2010). Mani (2003) reports that, of those patients complying with treatment, 96% were able to bring their blood pressure under control, and 50% were able to control their diabetes (as defined by HbA1c ≤ 7%), at a cost of $0.25 per person. Preliminary results suggest that the community-focused approach is a low-cost, effective method for managing diabetes and hypertension, and for preventing the onset of renal failure (Mani, 2005).
9. Indian Diabetes Prevention Programme (IDPP)
Health conditions:
– diabetes
Settings:
– community– health system
9. Indian Diabetes Prevention Programme (IDPP)
Health conditions:
– diabetes
Settings:
– community– health system
10. Stepped Care Intervention for Depressive and Anxiety Disorders (MANAS) in Goa
Health conditions:
– mental health
Settings:
– health system
IDPP presents a model for reducing morbidity and mortality from diabetes in an Indian context. A randomized controlled trial (RCT) conducted over three years in Chennai, the IDPP identified more than 500 Indian adults aged 35-55 who had impaired glucose tolerance, a prediabetic state of hyperglycaemia (increased blood sugar). The four study arms were (1) a control arm, in which participants were given “standard healthcare advice”; (2) a lifestyle modification (LSM) arm, in which participants were advised on changes in exercise and diet based on their occupations and leisure activities, on an ongoing basis; (3) an arm in which participants were given metformin, a common anti-diabetes drug; and (4) an arm in which participants were given both LSM advice and metformin (Ramachandran et al., 2007). By the end of the study period, 55% of patients in the control arm had developed type 2 diabetes. Among the three intervention arms, the rate of diabetes development was
significantly lower: 39.3% for the LSM-only patients, 40.5% for the metformin-only patients and 39.5% for the LSM and metformin combination patients (Ramachandran et al., 2006).
Intervention costsIn the trial, all three treatment arms were shown to be cost-effective. Notable is that combining a programme of LSM and metformin treatment in this trial was no more cost-effective than either of these interventions alone (Ramachandran et al., 2006): in each of the three treatment arms, the total cost per participant was between $200 and $300 over the three-year trial.26 The cost per case of diabetes “prevented” was about $1,180 for the LSM arm, $1,230 for the metformin arm, and $1,527 for the combined approach (Ramachandran et al., 2007).
Despite the significant efficacy of somewhat simple treatments such as antidepressant medication and short-term psychological treatments (Patel et al., 2010), up to 90% of primary care attendees suffering from depressive and anxiety disorders in developing countries do not receive adequate care (Wang et al., 2007). This shortfall is in part due to a lack of human resources; primary care doctors often fail to screen for or recognize common mental disorders, and pharmaceutical and psychosocial treatments are inadequately used and under-supervised (Patel et al., 2010). Shifting some of these screening and treatment tasks
to trained lay health counsellors is one viable solution to these challenges (Patel et al., 2010; Patel et al., 2011b).
The MANAS TrialFrom 2007 to 2009, researchers carried out an RCT in 24 primary care facilities in Goa. Facilities in the treatment group used a collaborative stepped care (CSC) model of treatment, with trained lay health workers acting as case managers and overseeing all non-drug treatment in close collaboration with physicians (Patel et al., 2010). In control facilities, primary care physicians received patient screening results and

36 Economics of Non-Communicable Diseases in India
prescribed treatments of their choice under a regular primary care model (Patel et al., 2010). On average, CSC patients in public facilities experienced a reduction of 50% on Clinical Interview Schedule scores measuring depression and anxiety symptoms over 12 months, compared with an average 30% reduction in non-CSC public facility patients (Patel et al., 2011b). At the end of the study, CSC public facility patients also reported a significant reduction in days of work missed due to depression and anxiety symptoms (an average six days of missed or reduced work over the past 30 days compared with 11 days for control patients). In private facilities, no significant differences were evident between treatment and control group outcomes (Patel et al., 2011b).
Intervention costsIn public facilities, the average annual cost per patient was approximately the same for both CSC and non-CSC patients – $89 and $88, respectively, with CSC treatments costing
slightly more due to the increased human resources cost of employing lay health counsellors (Buttorff et al., 2012). However, due to the somewhat greater efficacy of CSC treatment, CSC patients experienced greater annual cost savings in terms of missed work and travel to and from medical facilities, with an average expenditure of $177 compared with $229 for non-CSC patients (Buttorff et al., 2012). CSC patients also gained an average of 0.02 more QALYs than did non-CSC patients, which translates into 7.3 additional days free of depression or anxiety per subject, per year (Buttorff et al., 2012). Because no significant differences were seen in health outcomes between control and treatment groups for patients attending private facilities, there were no associated cost savings. However, for caregivers and patients in more resource-constrained public healthcare facilities, a CSC intervention appears to save costs, and is cost-effective from both a health and societal standpoint.
11. WHO best buys: combination drug therapy for CVD Health conditions:
– CVD
Settings:
– health system
Before the UN’s 2011 High-Level Meeting on the Prevention and Control of Non-Communicable Diseases, WHO identified a set of best buy interventions that are considered highly cost-effective, feasible and appropriate for control of NCDs within the constraints of LMICs’ health systems (Stenberg & Chisolm, 2012). Though these best buys cover a range of NCDs, India should specifically consider adopting interventions that target CVD, given its growing, ageing population and an expected 4 million deaths attributable to CVD in 2030 (Patel et al., 2011a). The interventions include a multi-drug therapy recommended to treat people with medium-to-high risk of developing heart attacks and strokes, and treatment of heart attacks (acute myocardial infarction) with aspirin (World Economic Forum, 2011). These interventions were also recognized by The Lancet NCD Action Group and the NCD Alliance as exhibiting “substantial effect on health, strong evidence for cost-effectiveness, low costs of implementation, and political and financial feasibility for scale-up”, and were deemed a priority action for combatting NCDs (Beaglehole et al., 2011).
Multi-drug therapy includes a regimen of aspirin to reduce the risk of blood clots; angiotensin-converting-enzyme inhibitor and beta blockers to reduce hypertension; and statins to lower cholesterol (Lim et al., 2007). The treatment is tailored for high-risk individuals, defined as people aged 40-79 who have non-fatal cardiovascular disease or are at risk of having a cerebrovascular event, or have an absolute risk (15% or more) of dying from either in the next 10 years (Lim et al., 2007).
In India, another study tested the delivery of a combination drug therapy in the form of a polycap. This trial, known as The Indian Polycap Study (TIPS), assessed the feasibility of controlling vascular disease among at-risk subjects using a single pill intervention that contained blood-pressure-lowering agents, aspirin, and statins (TIPS, 2009). Results from these studies concluded that the polycap intervention was well tolerated among subjects, and could reduce cardiovascular risk by up to 60% (Yusuf et al., 2012). Long-term studies are suggested to further determine the drugs’ success.
Intervention costsThough a comprehensive intervention has yet to be implemented in India, some data on costs are available from the WHO-CHOICE project (Patel et al., 2011a; Lim et al., 2007; Cecchini et al., 2010). By screening patients who are already accessing healthcare – known as an opportunistic screening, using history of CVD or other easily measured factors like blood pressure and body mass index – and identifying high-risk individuals, a simple prevention programme can be delivered. It can then be scaled up through the established primary care system at a minimal cost (Lim et al., 2007). Reaching 50% of the high-risk population would cost less than $1 per person annually, and would avert 5.8 million deaths over a 10-year period (Lim et al., 2007).

37Economics of Non-Communicable Diseases in India
12. Bangalore Baptist Hospital (BBH): community-level intervention for CVD prevention and management
Health conditions:
– diabetes– hypertension– harmful use of alcohol
Settings:
– community– technology
The Community Health Department of BBH focuses on approximately 35,000 people living in 50 villages around Bangalore, with a combination of four broad categories of activity: promoting health and preventing disease, strengthening government services and programmes, improving access to primary care, and developing the community. To reach people with high-quality care, BBH, in conjunction with Mobiatrics LLC, piloted a model that combines community health workers with mobile technology to address diabetes and CVD in the community. BBH’s model challenges the status quo; instead of trying to bring the villagers into the clinic, it brings healthcare to villagers, where they live and work (Cafiero, 2013).
This community programme focuses on NCDs rather than infectious disease because, while infectious disease is treated in an acute care setting, NCDs require long-term follow-up and management. The idea is that locally recruited community health workers can be trained to help their fellow villagers manage living with chronic conditions at a lower cost yet with an equivalent quality of care, as opposed to purely mobile clinic or health centre-based models of care.
In this pilot, community health workers visit villagers, using a handheld device that holds a summary of key patient indicators and a collection of structured health information on diabetes and hypertension. The device is a practical tool for field workers, as it contains the demographic data and risk profile of individuals under their care. During the visit, the field worker can update measurements (e.g. blood pressure, blood sugar levels) and treatment details on the device. This data is automatically synchronized with a cloud-based system, which processes the current information and gives an updated risk profile and treatment compliance of individuals at regular intervals. This information is helpful to triage patients, by prioritizing villagers according to risk level so the health team knows who to see first. For example, if the villager needs to visit the mobile clinic or get an immediate hospital referral, the system will enable the community health team to prompt the health worker to act. Some villagers’ conditions can be managed by the community health worker, whereas others need care and so are elevated to the level of the clinic or a more complex hospital. The system is also helpful in identifying people who require more frequent follow-ups, additional motivational techniques and counselling.
The handheld devices, which can support local languages, have most normal phone features removed and are used exclusively with the healthcare programme. This customization minimizes their attractiveness for anything other than data collection for the health programme. The devices use a store-and-forward communication model so they can function in the villages even when communications are not available. All data transfer occurs via a secure, encrypted system.
Intervention costsThe villagers have a small co-payment (approximately $0.10 plus the cost of medication). The total cost of all the community healthcare programme’s activity categories (including the referrals and the technology) are estimated at about $100,000 per year. About 600 villagers will receive follow-up for hypertension, diabetes, and CVD, and an additional 2,000 for other risks over the next one to one-and-a-half years.
c. Methods to Calculate ROI Quantifying the value of any healthcare intervention is difficult and complex and has significant data requirements. This is particularly true of interventions involving NCDs, because benefits may be realized over the course of a lifetime rather than in the short term. With this in mind, the economics of NCD interventions were analysed in terms ROI: how will future benefits compare with initial “investments” in health, i.e. the current costs of prevention, screening, and treatment? Although this model requires many assumptions and represents a great simplification of the dynamic costs and benefits of any health intervention over time, it is nevertheless a useful tool and starting point from which to begin comparing different programmes and estimating future benefits.
In general terms, return on investment depends upon the costs and associated net benefits of an investment, with appropriate adjustments for the time frame within which costs are incurred and benefits realized. To compare benefits and costs of a health programme, health benefits must be translated in monetary terms. The WHO Commission on Macroeconomics and Health proposes valuing one DALY at one to three times the value of a given country’s per capita GDP (WHO, 2001); in order to keep our estimate conservative, we value one DALY at one times the value of India’s GDP (also keeping in mind that this value will likely increase in the future). Because these benefits will not be realized until far in the future, a discount rate of 3% has been applied to adjust them to their present value, accounting for the economic preference of a sum of money today over that same sum of money in the future.27
Data on current interventions are limited; for many, data are only available for costs and not for benefits. Therefore, the ROI equation was modified to calculate the health benefit that a programme must achieve to reap a favourable return on the initial investment. For the purposes of this report, a favourable return was defined as 15%, which is substantial but not unrealistic in an investment context. Twelve of the interventions from the initial list had data available on costs. Table 9 shows the number of DALYs that a programme must avert, or QALYs that a programme must gain, over the long-term time horizon of 30 years to attain this return. (For the full equations, see Appendix E.)

38 Economics of Non-Communicable Diseases in India
Assumptions and caveatsWhen examining ROI results for individual programmes, it is important to remember that the calculations are based on several broad assumptions. In addition to the assumed discount rate and time horizon, the model is vastly simplified by assuming that recipients of the programme benefits will not be subject to other health conditions not covered by the intervention in question.
Furthermore, the data underlying the analyses are often restricted to specific populations or geographies, and are not
necessarily representative nationally. In addition, the figures presented in Table 9 are based on programme implementation data to date, and do not make any assumptions about scaling up the programme over time. In reality, the costs of scaling up existing or pilot interventions could reduce the cost on a per-person basis (an economies-of-scale hypothesis). Alternatively, scaling-up costs could also rise on a per-person basis if the hard-to-reach populations require substantial investment to bring about the desired health effects.
Table 9: Health Benefit Needed to Achieve a 15% ROI over a 30-Year Period
Intervention Programme costs, thousands of 2013 dollars28
Required number of DALYs averted
1. NPCDCS29 4,100,000 7,685,027
NPCDCS: Karnataka only30 373 699
2. 15% voluntary dietary salt reduction31 33 63
3. Health Systems Strengthening Project, Tamil Nadu32
Cervical cancer screening 363 681
Hypertension screening 360 675
4. HPV vaccination33
70% coverage at $10/dose 17,390 32,595
70% coverage at $25/dose 144,912,502.50 271,624
70% coverage at $50/dose 365,179,506.30 684,491
5. Tobacco taxation: increased rate on cigarettes and bidis34 72,480.00 136
6. Tobacco regulation (Gujarat): public smoking ban35
Partial ban 64 120
Complete ban 4,391 8,230
7. MYTRI36
211 395
8. Kidney Help Trust of Chennai37
8
15
9. IDPP (cost for 100 patients over three years)38
LSM 25 47
Metformin 25 46
LSM + metformin 30 57
10. MANAS39 2 3
11. Best buys for CVD: Four-drug regimen for primary and secondary treatment40
Low-end estimate (confidence interval [CI] 95%): $15.29/patient 1,529 2,866
Average estimate (CI 95%): $56.74/patient 5,674 10,635
High-end estimate (CI 95%): $104.46/patient 10,446 19,580
12. BBH: community health41 100 187

39Economics of Non-Communicable Diseases in India
d. Results: Estimated Health Benefits Needed to Achieve a 15% ROIThe DALYs averted needed to produce a 15% ROI over 30 years for selected interventions are found in Table 9. The calculations used in the table value one DALY at India’s 2013 per-capita GDP ($1,489.20) (World Bank, 2013e) and account for a 3% discount rate.
What do these results indicate?
The results (Table 9) suggest that a favourable ROI is within reach for some interventions. Data from programme evaluations can indicate if the benefit needed to achieve a 15% return is reasonably within reach, given what is known about programme performance.
Mental healthcare, using a CSC model, stands out as an intervention that is likely to yield handsome returns. Programmes that target primary prevention also have the potential to deliver above-average returns.
From the interventions included in category A, the following seem to provide a high ROI (at least 15%):
Health Systems Strengthening Project, Tamil Nadu: hypertension screening. The programme successfully treated approximately 16,014 patients each year for hypertension (Ray & Varghese, 2010). WHO estimates that India has a prevalence of 35.2% for hypertension among adults aged 25 and older (WHO, 2013h). In 2010, India’s population aged 25 and older was an estimated 612,827,772 (United Nations Population Division, 2012), implying that about 215,715,376 individuals in this age group were living with hypertension. The IHME (2013) estimates that 23,804,500 DALYs were lost to high blood pressure among adults in this age group in India in 2010, averaging to about 0.11 DALY lost per case of hypertension, per year. Assuming that all 16,014 patients have successful blood pressure control due to the programme and thus avert illness caused by hypertension, this would result in a benefit of about 1,767 DALYs averted, which is well in excess of the threshold needed to achieve a 15% ROI.
HPV vaccination. Based on predictions of averted cervical cancer cases and cervical cancer deaths, as extrapolated from the IHME (2013), Goldie et al. (2008) estimate a total of 531,789 DALYs averted for their total proposed vaccine rollout scenario in India. This is well above the number called for in the model at $10/dose (32,595 DALYs averted for 15% ROI) and $25/dose (271,624), but below the threshold for $50/dose (684,491). The latest figures from GAVI state that the lowest public-sector price for HPV vaccines in developing countries was $13/dose, and that GAVI can deliver the vaccines for as low as $4.50/dose (GAVI, 2013). While GAVI currently does not offer HPV-vaccine support in India, and a large-scale vaccination campaign in the country may prove costly in terms of public education (due to the
recent controversy over PATH HPV vaccine trials), it still seems highly feasible to deliver vaccines at a cost low enough to fulfil a 15% ROI.
Tobacco taxation. Patel et al. (2011a) estimate that increased taxation on cigarettes would cost approximately $72,480 per million people per year,42 and would avert an additional 811 DALYs per million people, above and beyond the DALYs averted via the current taxation scenario. Similarly, they estimate that an increased rate of taxation for bidis would not incur any additional costs above current taxation rates, and would avert an additional 1,304 DALYs per million people per year. Both of these figures are well above the 136 DALYs needed to yield a 15% ROI, suggesting that increased rates of tobacco taxation may be a feasible and cost-effective strategy for averting DALYs, especially because increasing rates would incur no marginal costs above currently existing taxation practices.
MYTRI. Based on progression models for uptake of tobacco usage among Indian youth, Brown et al. (2012) predict that the programme (one cohort, one session) will prevent about 12 students (95% CI 10.97-13.12) from becoming established smokers by age 26. They also predict a conservative 4.52 DALYs averted per averted smoker for a total of 54.24 DALYs averted per cohort1. This is far less than the 395 DALYs averted per cohort the model requires for a 15% ROI. However, these results are very context-specific and speculative. Because the programme is targeted to secondary school students, expanding it to many populations of at-risk youth who are no longer in school is not possible. This is especially true in rural areas, where school enrolment rates are lower, but rates of tobacco use are higher.
MANAS. Buttorff et al. (2012) estimate that patients in public facilities averted an average of about 0.02 DALYs per year, over and above those gained by patients in “baseline” programmes, through alleviation of depression and anxiety symptoms2. This benefit, multiplied by 823 patients in public facilities, results in 16 DALYs averted per year, which is well above the three called for in the analysis to achieve a 15% ROI. As with the other interventions, these results are context-specific and, importantly, necessitate some pre-existing mental health delivery structure that can be improved upon, which does not exist in all populations.
1 In their original report, the authors calculate benefits in quality-adjusted life years (QALYs) gained, an alternative measure to DALYs averted which measure health benefits in terms of years of healthy life. For the purposes of our analysis, we value one QALY gained as equivalent to one DALY averted (a country’s per capita GDP value).2 The original paper also uses QALYs gained rather than DALYs averted.
40 Economics of Non-Communicable Diseases in India
5. Principles for Measuring Return on Investment and Collecting Data

41Economics of Non-Communicable Diseases in India
A clear outcome of the research underlying this report is that few data are available for properly evaluating and measuring the health and economic impact of interventions that address NCDs in India. Without knowing if a programme is delivering benefits that exceed the investment made in it, programme managers will have a difficult time making the case for continued investment in and scaling up of their programme. The following covers (a) general principles for measuring the return of NCD programmes, and (b) a data collection checklist.
a. Principles for Measuring the ROI of NCD Programmes Many potential interventions for addressing NCDs exist, and they can have many health and economic impacts. A precise methodology for each and every intervention is beyond the scope of this report. However, to guide programme managers in collecting data that will allow subsequent ROI analysis, several general principles should be considered:
1. Measure an intervention’s economic costs. Programme costs can typically be categorized as cost of materials, human resources, infrastructure, and fixed costs such as rent or overheads. This can be fairly straightforward, as most programme managers work within strict budgetary requirements. Managers are responsible for financial reporting of programme expenditures, particularly regarding grant or aid funds.
2. Measure an intervention’s benefits. The benefits represent the change in health status, healthcare costs and productivity resulting from a programme. Typically, the targeted change is a reduction in healthcare costs, but the possibility exists that, over the long term, costs will rise as people survive into old age and require intense long-term or end-of-life care. Productivity benefits can accrue to the individual, in terms of individual income and workforce activity, or to the family in the form of reduced caretaking costs and reduced impact on household income.
3. Set the time frame required to realize benefits. NCDs can take decades to develop, so it is crucial to understand the time frame for benefits to accrue.
4. Establish a way to collect data for the specific programme. Directly measured costs and benefits are the ideal, and randomizing individuals or groups to intervention and control groups is an excellent, though not always feasible method for getting a clear picture of the benefits attributable to the intervention (and not to general trends in the community, state, or country). If this is not possible, then a clear measurement of the health status of those receiving the intervention, pre- and post-intervention, is necessary.
5. Be careful about generalizing. The data will represent an ROI related to the specific intervention. Particularities of different communities will drive a programme’s costs and benefits. In some cases, expansion will drive down an intervention’s costs (economies of scale); in others, expansion will drive up costs (e.g. hard-to-reach populations). Good analyses will pay attention to uncertainties, quality of data, durability of the effects of the intervention and multiple outcomes.
b. ROI Data Collection Checklist
This checklist can be used as an aid in designing and implementing NCD and healthy-living programmes. Not a comprehensive list, its main purpose is to trigger the planning around costs and benefits, as well as potential calculations of an intervention’s ROI.
ROI Data Collection Checklist
1. Identify the intervention’s economic costs:a. Cost of materialsb. Cost of personnelc. Value of time of patients participating in the
intervention d. Other overhead
2. Identify the intervention’s intended outcomes and benefits. Divide these into different categories that can be converted into a monetary benefit: a. Health gains (e.g. cases of a disease, death rates,
life expectancy, DALYs averted)b. Medical care savings (costs of diagnosis,
treatment and care) c. Productivity savings (lost wages due to missed
work)
3. Establish the time frame needed to achieve/see these outcomes.
4. Identify other indicators to measure along the way to the desired outcome (e.g. hypertension, prediabetes, cervical lesions), and the activities needed to achieve them (e.g. screening, education, distribution of testing strips). This will help in crafting programme activities that will lead to the desired outcome.
5. Identify a control group. If this is not possible, conduct a before-after study in the same group.
6. Collect baseline data to measure outcomes, pre-intervention.
7. Collect outcome data to measure those benefits attributable to the programme.
8. Exercise caution in generalizing results.

42 Economics of Non-Communicable Diseases in India
6. Conclusions and Final Messages

43Economics of Non-Communicable Diseases in India
NCDs are a large and growing challenge for India’s future economic growth and its population’s well-being. Business leaders and the government feel the threat of NCDs, and the country has already moved to address it via public policy initiatives (e.g. NPCDCS). As India moves to increase public health spending, more information is needed to guide decisions on resource allocation. This report has sought to provide information on NCDs and related interventions, highlight areas for improvement, and identify where India gets a favourable ROI in healthy living.
The areas for investment are the prevention of NCDs, built upon a strong healthcare foundation and early screening. Interventions that focus on screening (in the case of hypertension), vaccination (in the case of HPV), and prevention of tobacco use were assessed as promising, with a feasibility of achieving a 15% ROI. This is in line with other studies that have found these interventions to be cost-effective. The MANAS trial, which leveraged an existing healthcare infrastructure and employed lay health counsellors to deliver care, is also an encouraging approach for addressing common mental health conditions in India. However, this trial was delivered in an area with a strong health infrastructure (Goa); similar results might not be possible in other areas without substantial investment in building a strong health system platform. Because data show that returns can be particularly high for prevention programmes (whose benefits are seen in the long run), elected officials must take a concerted long-term view so that the socio-economic benefits can be seized in the future.
While school-based interventions have serious potential, India must consider other settings to deliver NCD and healthy-living interventions. Although schools are an entry point to many Indian children and their families, nearly 1.4 million children of primary school age are not in school, and more than 16 million children of lower-secondary school age do not attend it (UNESCO Institute for Statistics, 2013). Expanding the focus to the community, through interventions such as those delivered by Kidney Help Trust of Chennai and BBH, is necessary to reach Indians where they live and work.
Finding information on evidence-based approaches to NCDs, and on mental healthcare being implemented in India, is difficult. In addition, a lack of data exists on what works (and what doesn’t) when preventing NCDs and improving well-being in the country. In some cases, data on interventions were not collected, while in others, data were not shared. One clear recommendation for moving forward and accelerating action on NCDs is to develop a database of NCD and healthy-living interventions, so that best practices can be shared and practitioners can learn from one another.
Another striking conclusion is that few interventions have information of the right type and quality for economic analyses. For example, the NPCDCS’s monitoring and evaluation (M&E) plan is structured so that reports are submitted on a monthly basis; however, the reports’ content predominantly focuses on process indicators such as the number of glucose strips used and number of people screened (Directorate General of Health Services, 2010). The M&E plan does not articulate any target health outcomes for the actions undertaken in the NPCDCS. A strong M&E
framework should be considered crucial to the success of the NPCDCS (Krishnan et al., 2011). Failure to capture baseline data and to monitor changes in health status is a missed opportunity, and should be reconsidered as the programme expands nationally. Given the programme’s early stage and the monitoring framework’s current design, the only data available are on programme costs. Using these data, an analysis can give a sense of the health-outcome results needed for the programme to be a cost-beneficial effort. Programme managers should build in data collection to the programme design and management process. Goal setting, and monitoring and evaluating programmes, are crucial steps as India ramps up public spending on health. To this end, a basic checklist for programme managers is available in Section 5.
Furthermore, as to those interventions with data, making comparisons across them is difficult. Different metrics are used to assess the effects of interventions, and not all programmes report data on costs.
In conclusion, India is a heterogeneous country, and solutions to the challenge of NCDs must be tailored to local contexts. A comprehensive set of solutions must be deployed by multiple stakeholders to put India on the path to further preventing and controlling these diseases.

44 Economics of Non-Communicable Diseases in India
References
Abegunde, D. O., et al. (2007). The burden and costs of chronic diseases in low-income and middle-income countries. The Lancet, 370(9603), 1929–1938.
Abegunde, D., & Stanciole, A. (2006). An estimation of the economic impact of chronic non-communicable diseases in selected countries. WHO Working Paper. Geneva: World Health Organization. Accessed 20 August 2014, from http://www.who.int/chp/working_paper_growth%20model29may.pdf.
Abikar, A. (2013). Karnataka health systems project. Personal communication.
Agarwal, S. K., Dash, S. C., Irshad, M., Raju, S., Singh, R., & Pandy, R. (2005). Prevalence of chronic renal failure in adults in Delhi, India. Nephrology Dialysis Transplant, 2005(29), 1638–1642.
Allender, S., et al. (2010). Level of urbanization and non-communicable disease risk factors in Tamil Nadu, India. Bulletin of the World Health Organization, 88(ISSUE), 297–304.
Alliance for Cervical Cancer Prevention. (2011). Recent evidence on cervical cancer screening in low-resource settings. Accessed 20 August 2014, from http://screening.iarc.fr/doc/ACCP_cxca_screening_2011.pdf.
Alvarez, J. C. (2010). Financing agreement for credit 4756-IN conformed. Washington, DC: World Bank.
American Diabetes Association. (2013). Living with diabetes. Accessed 20 August 2014, from http://www.diabetes.org/living-with-diabetes/complications/kidney-disease-nephropathy.html.
American Kidney Fund. (2008). End stage renal disease (ESRD). Accessed 20 August 2014, from http://www.kidneyfund.org/kidney-health/kidney-failure/end-stage-renal-disease.html.
Arokiasamy, P., et al. (2014). Longitudinal aging study in India: biomarker data documentation. RAND Working Paper WR-1043. Accessed 20 August 2014, from http://www.rand.org/content/dam/rand/pubs/working_papers/WR1000/WR1043/RAND_WR1043.pdf.
Arokiasamy, P., & Yadav, S. (2013). Changing age patterns of morbidity vis-a-vis mortality in India. Journal of Biosocial Science, 46(4), 462-479.
Arora, M., et al. (2012). Impact of tobacco advertisements on tobacco use among urban adolescents in India: results from a longitudinal study. Tobacco Control, 21(3), 318–324.
Asaria, P., et al. (2007). Chronic disease prevention: health effects and financial costs of strategies to reduce salt intake and control tobacco use. The Lancet, 370(9604), 2044–2053.
Bajaj, V. (2012). India weighs providing free drugs at state-run hospitals. 5 July 2012. International New York Times. Accessed 20 August 2014, from http://www.nytimes.com/2012/07/06/business/india-may-provide-free-drugs-at-state-run-hospitals.html?_r=0.
Ballal, H. S. (2007). The burden of chronic kidney disease in a developing country, India. Quest: Davita’s Clinical Journal for Nephrologists, July 2007(9), 12–19.
Bansal, D. & Purohit, V. (2013). Accessibility and use of essential medicines in healthcare: current progress and challenges in India. Journal of Pharmacology and Pharmacotherapeutics, 4(1), 13–18.
Barnighausen, T., Bloom, D. E., Cafiero, E. T., & O’Brien, J. C. (2012). Economic evaluation of vaccination: capturing the full benefits, with an application to human papillomavirus. Clinical Microbiology and Infection, 8(Suppl. 5), 70–76.
Basu, P., & Chowdhury, D. (2009). Cervical cancer screening and HPV vaccination: a comprehensive approach to cervical cancer control. Indian Journal of Medical Research, 130(3), 241–246.
Basu, S., et al. (2012). Dietary salt reduction and cardiovascular disease rates in India: a mathematical model. PLoS One, 7(9), 1–7.
Beaglehole, R., et al. (2011). Priority actions for the non-communicable disease crisis. The Lancet, 377(9775), 1438–1447.
Berman, P., et al. (2010). Government health financing in India: challenges in achieving ambitious goals. Health, Nutrition, and Population (HNP) Discussion Paper. Washington, DC: The International Bank for Reconstruction and Development & The World Bank.
Bhalla, N. (2012). Child malnutrition in India a “national shame” – Manmohan Singh. 11 January 2012. Reuters.
Bloom, D. E., Canning, D., & Fink, G. (2014). Disease and development revisited. Journal of Political Economy, (forthcoming).
Bloom, D. E., Canning, D., & Sevilla, J. (2004). The effect of health on economic growth: a production function approach. World Development, 32(1), 1–13.
Bloom, D. E., et al. (2010). The contribution of population health and demographic change to economic growth in China and India. Journal of Comparative Economics, 38(1), 17–33.
Bloom, D.E., et al. (2011). The global economic burden of non-communicable diseases. Geneva: World Economic Forum and Harvard School of Public Health.
Bloom, D. E., et al. (2012). The global economic burden of non-communicable diseases. Boston: Program on the Global Demography of Aging, Harvard School of Public Health.
Bloom, D. E., et al. (2013). The economic impact of non-communicable disease in China and India: estimates, projections, and comparisons. NBER Working Paper No. 19335. Cambridge, MA: National Bureau of Economic Research.
Brown, H. S., et al. (2012). The cost-effectiveness of a school-based smoking prevention program in India. Health Promotion International, 28(2), 178–186.
Buttorff, C., et al. (2012). Economic evaluation of a task-shifting intervention for common mental disorders in India. Bulletin of the World Health Organization, 90(11), 813–821.
Cafiero, E. (2013). Personal communication with Jay Warrior. Bangalore.
Castellsaqué, X., et al. (2007). HPV and cervical cancer in the world. Barcelona: WHO/ICO Information Centre on HPV and Cervical Cancer (HPV Information Centre).
Cecchini, M., et al. (2010). Tackling of unhealthy diets, physical inactivity, and obesity: health effects and cost-effectiveness. The Lancet, 376(9754), 1775–1784.
Centers for Disease Control (CDC). 2012. Diabetes health and concerns. Accessed 20 August 2014, from http://www.cdc.gov/diabetes/consumer/problems.htm#6.
Chaudhury, R., Parameswar, R., Gupta, U., Sharma, S., Tekur, U., & Bapna, J. S. (2005). Quality medicines for the poor: experience of the Delhi programme on rational use of drugs. Health Policy and Planning, 20(2), 124–136.
Chopra, R. (2001). The Indian scene. Journal of Clinical Oncology, 19(18 Suppl), 106S–111S.
Clark, H. (2013). UN progress on the global development agenda, post 2015 and NCDs. Keynote address at launch of The Lancet’s non-communicable disease series. London: London School of Hygiene and Tropical Medicine & United Nations Development Program.

45Economics of Non-Communicable Diseases in India
Dey, S., et al. (2012). Health of the elderly in India: challenges of access and affordability. In Aging in Asia: findings from new and emerging data initiatives. Panel on policy research and data needs to meet the challenge of aging in Asia, J. P. Smith & M. Majmundar, Eds. Washington, DC: The National Academies Press, 371–386.
Dhar, A. (2012a). India’s resolution on mental health adopted at World Health Assembly. 30 May 2012. The Hindu. Accessed 20 August 2014, from http://www.thehindu.com/todays-paper/tp-national/indias-resolution-on-mental-health-adopted-at-world-health-assembly/article3471046.ece.
Dhar, A. (2012b). Research centre on mental health. 13 September 2012. The Hindu. Accessed 20 August 2014, from http://www.thehindu.com/news/cities/Delhi/research-centre-on-mental-health/article3885589.ece.
Dhillon, P. K., Yeole, B. B., Dikshit, R., Kurkure, A. P., & Bray, F. (2011). Trends in breast, ovarian, and cervical cancer incidence in Mumbai, India over 30-year period, 1976-2005: an age-period-cohort analysis. British Journal of Cancer, 105(5), 723–730.
Diaz, M., Kim, J. J., de Sanjose, S., Clifford, G., Bosch, F. X., & Goldie, S. J. (2008). Health and economic impact of HPV 16 and 18 vaccination and cervical cancer screening in India. British Journal of Cancer, 99(2), 230–238.
Dikshit, R., et al. (2012). Increase in breast cancer incidence among older women in Mumbai: 30-year trends and predictions to 2025. Cancer Epidemiology, 36(4), e215–220.
Directorate General of Health Services. (2010). National programme for prevention and control of cancer, diabetes, cardiovascular diseases, and stroke (NPCDCS): Operational guidelines. New Delhi: Ministry of Health and Family Welfare, Government of India.
Donaldson, E. A., et al. (2011). A cost-effectiveness analysis of India’s 2008 prohibition of smoking in public places in Gujarat. International Journal of Environmental Research and Public Health, 8(5), 1271–1286.
Dwyer, D. S., & Mitchell, O. S. (1999). Health problems as determinants of retirement: are self-rated measures endogenous? Journal of Health Economics, 18(2), 173–193.
Economic Times. (2013). India plans to expand NPCDCS to all districts. 4 April 2013. Accessed 20 August 2014, from http://articles.economictimes.indiatimes.com/2013-04-04/news/38278433_1_world-health-day-100-districts-high-blood-pressure.
Engelgau, M., Karan, A., & Mahal, A. (2012). The economic impact of non-communicable diseases on households in India. Globalization and Health, 8(1), 9.
Express News Service. (2009). Ban on public smoking up in smoke in Gujarat. 26 May 2009. The Indian Express. Accessed 20 August 2014, from http://archive.indianexpress.com/news/-ban-on-public-smoking-up-in-smoke-in-gujarat-/465845/.
Farooqui, H. H., & Zodpey, S. (2012). Cervical cancer control in India: taking evidence to action. Journal of Public Health Policy, 33(2), 165–172.
Ferlay, J., et al. (2010). GLOBOCAN 2008 v2.0, cancer incidence and mortality worldwide: IARC CancerBase No. 10. Accessed 20 August 2014, from http://globocan.iarc.fr.
Foy, H. (2012). India to give free generic drugs to hundreds of millions. 5 July 2012. Reuters. Accessed 20 August 2014, from http://www.reuters.com/article/2012/07/05/us-india-drugs-idUSBRE8630PW20120705.
Gajalakshmi, V., et al. (2003). “Smoking and mortality from tuberculosis and other diseases in India: retrospective study of 43,000 adult male deaths and 35,000 controls. The Lancet, 362(9383), 507–515.
Gale, J. (2013). India breast cancer surge hinders private exams for women.” 29 October 2013. Bloomberg. Accessed 20 August 2014, from http://www.bloomberg.com/news/2013-10-29/india-breast-cancer-surge-hinders-private-exams-for-women.html.
GAVI Alliance (GAVI). (2013). Human papillomavirus vaccine support. Accessed 20 August 2014, from http://www.gavialliance.org/support/nvs/human-papillomavirus-vaccine-support/.
Goel, S., Ravindra, K., Singh, R. J., & Sharma, D. (2014). Effective smoke-free policies in achieving a high level of compliance with smoke-free law: experiences from a district of North India. Tobacco Control, 23(4), 291-294.
Goldie, S. J., O’Shea, M., Gastineau Campos, N., Diaz, M., Sweet, S., & Kim, S. Y. (2008). Health and economic outcomes of HPV 16,18 vaccination in 72 GAVI-elligible countries. Vaccine 24, 26(32), 4080–4093.
Government of Karnataka. (2013). National programme for prevention and control of cancer, diabetes, CVD, and Stroke (NPCDCS). Bangalore: Directorate of Health & Family Welfare Services, Government of Karnataka.
Gupta, N., et al. (2010). Imbalanced dietary profile, anthropometry, and lipids in urban Asian Indian adolescents and young adults. Journal of the American College of Nutrition, 29(2), 81–91.
Gupta, P., et al. (2005). Tobacco associated mortality in Mumbai (Bombay) India. Results of the Bombay cohort study. International Journal of Epidemiology, 34(6), 1395–1402.
Gupta, S. (2009). Impact of a health education intervention program regarding breast self-examination by women in a semi-urban area of Madhya Pradesh, India. Asian Pacific Journal of Cancer Prevention, 10(6), 1113–1117.
Harvard School of Public Health, International Institute of Population Sciences Mumbai, & RAND Corporation. (2011). Longitudinal aging study in India, pilot wave. Accessed 20 August 2014, from http://g2aging.org/.
Heston A., Summers, R., & Aten, B. (2006). Penn World Table Version 6.2, Center for International Comparisons of Production, Income and Prices. University of Pennsylvania. Accessed 20 August 2014, from https://pwt.sas.upenn.edu/php_site/pwt_index.php.
Hood, G. (2012). National program for prevention and control of cancer, diabetes, cardiovascular diseases and stroke. Seminar. Sewagram: Mahatma Gandhi Institute of Medical Sciences.
Indian Polycap Study. (2009). Effects of a polypill (Polycap) on risk factors in middle-aged individuals without cardiovascular disease (TIPS): a phase II, double-blind, randomised trial. The Lancet, 373(9672), 1341–1351.
Institute for Health Metrics and Evaluation (IHME). (2013). Global burden of disease study 2010: India global burden of disease study 2010 (GBD 2010) results 1990-2010. Seattle.
International Diabetes Federation (IDF). (2012). Diabetes atlas, fifth edition. Brussels: International Diabetes Federation.
International Diabetes Federation (IDF). (2013). Types of diabetes. Accessed 20 August 2014, from http://www.idf.org/about-diabetes.
International Institute for Population Sciences (IIPS). (2007). National Family Health Survey (NFHS-3), 2005-06. Mumbai: International Institute for Population Sciences.
International Monetary Fund (IMF). (2013). International Monetary Fund World Economic Outlook Database. Accessed 20 August 2014, from http://www.imf.org/external/pubs/ft/weo/2014/01/weodata/index.aspx.
Jha, P., et al. (2008). A nationally representative case-control study of smoking and death in India. New England Journal of Medicine, 358(11), 1137–1147.
Jha, P., et al. (2011). A rational taxation system of bidis and cigarettes to reduce smoking deaths in India. Economic & Political Weekly, XLVI(42), 44–51.
Jha, P., et al. (2012). Tobacco taxes: a win–win measure for fiscal space and health. Mandaluyong City, Philippines: Asian Development Bank.
John, R. M., et al. (2010). The economics of tobacco and tobacco taxation in India. Paris: International Union against Tuberculosis and Lung Disease.
Kaarthigeyan, K. (2012). Cervical cancer in India and HPV vaccination. Indian Journal of Paediatric Oncology, 33(1), 7–12.

46 Economics of Non-Communicable Diseases in India
Kankeu, H. T., et al. (2013). The financial burden from non-communicable diseases in low- and middle-income countries: a literature review. Health Research Policy and System, 11, 31.
Kannan, R. (2013). At lower price, cervical cancer vaccine set to reach more women. 16 May 2013. The Hindu. Accessed 20 August 2014, from http://www.thehindu.com/news/national/tamil-nadu/at-lower-price-cervical-cancer-vaccine-set-to-reach-more-women/article4721477.ece.
Kearney, P. M., et al. (2005). Global burden of hypertension: analysis of worldwide data. The Lancet, 365(9455), 217–223.
Khanna, T., & Bijlani, T. (2012). Narayana Hrudayalaya Heart Hospital: cardiac care for the poor (B). Harvard Business School Case Study 9-712-402, rev. May 2012. Boston: Harvard Business School Publishing.
Khanna, T., Rangan, V. K., & Manocaran, M. (2011). Narayana Hrudayalaya Heart Hospital: cardiac care for the poor (A). Harvard Business School Case Study 9-505-078, rev. August 2011. Boston: Harvard Business School Publishing.
Kimuna, S. R., et al. (2012). Domestic violence in India: insights from the 2005-2006 National Family Health Survey. Journal of Interpersonal Violence, 28(4), 773–807.
Kothari, J., & Chatur, D. (2012). Moving towards autonomy and equality: an analysis of the new mental health care bill 2012. CLPR Working Paper 1. Bangalore: Center for Law & Policy Research.
Krishnan, V., & Makkar, S. (2012). Government to triple spending on health in 12th five-year plan. 29 February 2012. Live Mint & The Wall Street Journal. Accessed 20 August 2014, from http://www.livemint.com/Politics/tTbKJzwAsMYGmNvEvFKbvO/Government-to-triple-spending-on-health-in-12th-FiveYear-Pl.html.
Krishnan, A., et al. (2011). How to effectively monitor and evaluate NCD programmes in India. Indian Journal of Community Medicine, 36(Suppl 1), S57–S62.
Kulkarni, K. (2012). Braving crowds, waiting for hours for free medicine in India. 22 July 2012. Chicago Tribune. Accessed 20 August 2014, from http://articles.chicagotribune.com/2012-07-22/lifestyle/sns-rt-us-india-drugsbre86l0lq-20120722_1_free-medicine-free-insulin-free-program.
Kumar, A. K. S., et al. (2011). Financing health care for all: challenges and opportunities. The Lancet, 377(9766), 668–679.
Kumar, Y., Mishra, G., & Shastri, S. (2011). Level of cancer awareness among women of low socioeconomic status in Mumbai slums. Asian Pacific Journal of Cancer Prevention, 12(5), 1295–1298.
Lee, J., et al. (2012). Markers and drivers: cardiovascular health of middle-aged and older Indians. In Aging in Asia: findings from new and emerging data initiatives. Panel on policy research and data needs to meet the challenge of aging in Asia, J.P. Smith & M. Majmundar, Eds. Washington, DC: The National Academies Press, 387–414.
Lim, S., Gaziano, T., Gakidou, E., Reddy, K. S., Farzadfar, F., Lozano, R., & Rodgers, A. (2007). Prevention of cardiovascular disease in high-risk individuals in low-income and middle-income countries: health effects and costs. The Lancet, 370(9604), 2054–2062.
Lopez-Casasnovas, G., Rivera, B., & Currais, L. (2005). Health and economic growth: Findings and policy implications. Cambridge, MA: MIT Press.
Lovering, A. (2013). Sandeep Kishore, Chair, Advisory Council, Young Professionals Chronic Disease Network. 24 April 2013. Research Media Ltd. Accessed 20 August 2014, from http://www.research-europe.com/index.php/2013/04/sandeep-kishore-chair-advisory-council-young-professionals-chronic-disease-network/.
Lund, C., et al. (2012). PRIME: a programme to reduce the treatment gap for mental disorders in five low- and middle-income countries. PLoS Med, 9(12), e1001359.
Mackay, J. L., Eriksen, M., & Ross, H. (2012). The Tobacco Atlas, Fourth Ed. Atlanta, New York: American Cancer Society & World Lung Foundation.
Mahal, A., Karan, A., & Engelgau, M. (2009). The economic implications of non-communicable disease for India. In The International Bank for Reconstruction and Development. Washington, DC: World Bank.
Mahal, A., et al. (2013). The economic burden of cancers on Indian households. PLoS One, 8(8), e71853.
Mani, M. K. (2003). Prevention of chronic renal failure at the community level. Kidney International, 63(83), 86–89.
Mani, M. K. (2005). Experience with a program for prevention of chronic renal failure in India. Kidney International, 67(Suppl), 75–78.
Mani, M. K. (2010). Letter from Chennai: a glimmer of hope for prevention. The National Medical Journal of India, 23(2), 109–110.
Manikandan, S. G. B. (2012). National list of essential medicines of India: the way forward. Journal of Postgraduate Medicine, 2012(58), 68–72.
Marrero, S. L., Bloom, D. E., & Adashi, E. Y. (2012). Non-communicable diseases: a global health crisis in a new world order. JAMA: The Journal of the American Medical Association, 307(19), 2037–2038.
Mayo Clinic. (2012). Dry macular degeneration: tests and diagnosis. Accessed 20 August 2014, from http://www.mayoclinic.com/health/macular-degeneration/DS00284/DSECTION=tests-and-diagnosis.
Mayo Clinic. (2013a). Cataracts: risk factors. Accessed 20 August 2014, from http://www.mayoclinic.org/diseases-conditions/cataracts/basics/risk-factors/con-20015113.
Mayo Clinic. (2013b). Cataracts: tests and diagnosis. Accessed 20 August 2014, from http://www.mayoclinic.org/diseases-conditions/cataracts/basics/tests-diagnosis/con-20015113.
Mayo Clinic. (2013c). Glaucoma: tests and diagnosis. Accessed August 20, 2013 from http://www.mayoclinic.org/diseases-conditions/glaucoma/basics/tests-diagnosis/con-20024042.
Mayo Clinic. (2013d). Type 2 diabetes. Accessed 20 August 2014, from http://www.mayoclinic.com/health/type-2-diabetes/DS00585/DSECTION=causes.
McGarry, K. (2004). Health and retirement: do changes in health affect retirement expectations? Journal of Human Resources, 39(3), 624.
McNeil, D. (2013). Cancer vaccines get a price cut in poor nations. 9 May 2013. The New York Times. Accessed 20 August 2014, from http://www.nytimes.com/2013/05/10/health/prices-cut-for-hpv-cervical-cancer-vaccines-for-neediest.html.
Ministry of Health and Family Welfare. (2011). Mental health care bill 2011 (draft). New Delhi: Government of India. Accessed 20 August 2014, from http://mohfw.nic.in/WriteReadData/l892s/6420662643DRAFT%20THE%20MENTAL%20HEALTH%20CARE%20BILL.pdf.
Ministry of Health and Family Welfare. (2012a). Initiatives for free supply of essential medicines in public health facilities in the country. Government of India. Accessed 20 August 2014, from http://mohfw.nic.in/showfile.php?lid=1332.
Ministry of Health and Family Welfare. (2012b). The sixty-fifth World Health Assembly adopts resolution moved by India on mental health. 23 May 2012. Press release. Government of India. Accessed 20 August 2014, from http://pib.nic.in/newsite/erelease.aspx?relid=84420.
Ministry of Health and Family Welfare. (2013). India calls for major scaling up of response to non-communicable diseases: World Health Day focuses attention on high blood pressure. 4 April 2013. Press release. Government of India. Accessed 20 August 2014, from http://pib.nic.in/newsite/erelease.aspx?relid=94480.
Misra, A., et al. (2011). Nutrition transition in India: secular trends in dietary intake and their relationship to diet-related non-communicable diseases. Journal of Diabetes, 3(4), 278–292.
Moreno, C., et al. (2012). Depression in bipolar disorder versus major depressive disorder: results from the National Epidemiologic Survey on Alcohol and Related Conditions. Bipolar Disorders, 14(3), 271–282.

47Economics of Non-Communicable Diseases in India
Mukhopadhyay, I. (2012). Health system strengthening and the importance of public investment: a study of National Rural Health Mission in Bihar. 2nd National Conference on Bringing Evidence into Public Health Policy (EPHP 2012). Bangalore: BMC Proceedings.
Murray, C. J. L., et al. (2012). GBD 2010: design, definitions, and metrics. The Lancet, 380(9859), 2063–2066.
Murthy, N. S., Chaudry, K., & Saxena, S. (2005). Trends in cervical cancer incidence – Indian scenario. European Journal of Cancer Prevention, 14(6), 513–518.
Murthy, P. B., & Sankaran, L. (2005). The workplace alcohol prevention and activity: the KSRTC audit. Project report. Accessed 20 August 2014, from http://www.nimhans.kar.nic.in/deaddiction/CAM/workplace_intervention.pdf.
Nagler, E. M., et al. (2013). Designing in the social context: using the social contextual model of health behavior change to develop a tobacco control intervention for teachers in India. Health Education Research, 28(1), 113–129.
Narayan, C. L., Narayan, M., & Shikha, D. (2011). The ongoing process of amendments in MHA-87 and PWD Act-95 and their implications on mental health care. Indian Journal of Psychiatry, 53(4), 343–350.
Narayana Health. (2013). About us. Narayana Hrudayalaya Private Limited. Accessed 20 August 2014, from http://www.narayanahealth.org/about-us.
National Human Rights Commission of India. (2008). Mental health care and human rights. New Delhi.
National Institute of Health (NIH). (2008). “Kidney disease of diabetes,” available from http://kidney.niddk.nih.gov/kudiseases/pubs/kdd/.
National Sample Survey Organisation. (2006). Morbidity, health care, and the condition of the aged. National sample survey, 60th round, Report no. 507 (60/25.0/1). New Delhi: Ministry of Statistics and Programme Implementation, Government of India.
NCD Alliance. (2013). Global coordinating mechanism for NCDs. Accessed 20 August 2014, from http://www.ncdalliance.org/global-coordinating-mechanism-ncds.
Nugent, R., & Feigl, A. B. (2010). Where have all the donors gone? Scarce donor funding for non-communicable disease. Washington, DC: Center for Global Development.
Parasuraman, S., et al. (2009). A profile of youth in India. National Family Health Survey (NFHS-3), India, 2005-06. Mumbai: International Institute for Population Sciences.
Parliament of India. (2013). Seventy-second report on alleged irregularities in the conduct of studies using human papillomavirus (HPV) vaccine by PATH in India. New Delhi: Rajya Sabha Secretariat, Parliamentary Standing Committee on Health and Family Welfare, 43.
Pascolini, D., & Mariotti, S. P. (2012). Global estimates of visual impairment: 2010. British Journal of Ophthalmology, 96(5), 614–618.
Patel, V. et al. (2010). Effectiveness of an intervention led by lay health counsellors for depressive and anxiety disorders in primary care in Goa, India (MANAS): a cluster randomised controlled trial. The Lancet, 376(9758), 2086–2095.
Patel, V., et al. (2011a). Chronic diseases and injuries in India. The Lancet, 377(9763), 413–428.
Patel, V., et al. (2011b). The effectiveness of a lay health worker led collaborative stepped care intervention for depressive and anxiety disorders on clinical, suicide and disability outcomes over 12 months: the Manas cluster randomized controlled trial from Goa, India. British Journal of Psychiatry, 199, 459–466.
Pednekar, M. S., & Gupta, P. (2007). Prospective study of smoking and tuberculosis in India. Preventive Medicine, 44(6), 496–498.
Perry, C. L., et al. (2009). Preventing tobacco use among young people in India: project MYTRI. American Journal of Public Health, 99(5), 899–906.
Planning Commission, Government of India. (2013). Twelfth Five-Year Plan 2012-17. New Delhi, India: SAGE Publications.
Popkin, B. M. (1998). The nutrition transition and its health implication in lower-income countries. Public Health Nutrition, 1(1), 5–21.
Popkin, B. M. (1999). Urbanization, lifestyle changes, and the nutrition transition. World Development, 27(11), 1905–1916.
Popkin, B. M., Adair, L. S., & Ng, S. W. (2012). Global nutrition transition and the pandemic of obesity in developing countries. Nutrition Reviews, 70(1), 3–21.
Press Information Bureau (PIB). (2010). National programme for prevention and control of cancer, diabetes, cardiovascular diseases, and stroke (NPCDCS) approved. Government of India. Accessed 20 August 2014, from http://www.pib.nic.in/newsite/erelease.aspx?relid=63087.
Press Information Bureau (PIB). (2013). India calls for major scaling up of response to non-communicable diseases: World Health Day focuses attention on high blood pressure. 4 April 2013. Government of India. Accessed 20 August 2014, from http://pib.nic.in/newsite/erelease.aspx?relid=94480.
Puska, P., et al. (1998). Changes in premature deaths in Finland: successful long-term prevention of cardiovascular diseases. Bulletin of the World Health Organization, 76(4), 419–425.
Ramachandran, A., et al. (2006). The Indian Diabetes Prevention Programme shows that lifestyle modification and metformin prevent type 2 diabetes in Asian Indian subjects with impaired glucose tolerance (IDPP-1). Diabetologia, 49(2), 289–297.
Ramachandran, A., et al. (2007). Cost-effectiveness of the interventions in the primary prevention of diabetes among Asian Indians: within-trial results of the Indian Diabetes Prevention Programme (IDPP). Diabetes Care, 30(10), 2548–2552.
Raute, L., et al. (2012). Determinants of exposure to second-hand smoke at home and outside the home among students aged 11-17 years: results from the Mumbai Student Tobacco Survey 2010. Indian Journal of Cancer, 49(4), 419–424.
Ray, R. (2004). National survey on extent, pattern, and trends of drug abuse in India. New Delhi: Ministry of Social Justice and Empowerment, Government of India.
Ray, S., & Varghese, B. (2010). Economic evaluation of non communicable disease pilot projects: prevention and treatment of cancer cervix and cardiovascular diseases in 4 districts of Tamil Nadu – a cost analysis. Final report. New Delhi: Public Health Foundation of India.
Reardon, T., & Minten, B. (2011). The quiet revolution in India’s food supply chains. IFPRI Discussion Paper Number 01115. International Food Policy Research Institute. Accessed 20 August 2014, from http://www.ifpri.org/sites/default/files/publications/ifpridp01115.pdf.
Registrar General & Census Commissioner. (2011).Census of India: provisional population totals paper 1 of 2011: Tamilnadu. New Delhi: Ministry of Home Affairs, Government of India.
Ryan, D., & Wilden, J. (2011). Modern medical education: meeting the demands of an aging population. In Global Population Ageing: Peril or Promise? Geneva: World Economic Forum.
Salomon, J. A., et al. (2012). Healthy life expectancy for 187 countries, 1990–2010: a systematic analysis for the Global Burden Disease Study 2010. The Lancet, 380(9859), 2144–2162.
Save the Children Fund & World Vision International. (2012). The nutrition barometer: gauging national responses to undernutrition. England & Wales: Save the Children Fund & World Vision International.
Sengupta, A. (2013). Universal health care in India: making it public, making it a reality. In Occasional Paper No. 19 – May 2013, D. A. McDonald & G. Ruiters, Eds. Canada: Municipal Services Project.
Sengupta, A., Joseph, R., Modi, S., & Syam, N. (2008). Economic constraints to access to essential medicines in India. New Delhi: Centre for Technology and Development & Society for Economic and Social Studies. Accessed 20 August 2014, from http://www.healthpolicy.cn/rdfx/jbywzd/gjjy2/yd/yjwx/201002/P020100227571385215688.pdf.
Selvam, J. M. (2013). Study on NCDs in India. Personal communication. Chennai.

48 Economics of Non-Communicable Diseases in India
Sharma, R., Ed. (2012). Epidemiology of musculoskeletal conditions in India. New Delhi: Indian Council of Medical Research.
Sherris, J., Wittet, S., Kleine, A., Sellors, J., Luciani, S., Sankaranarayanan, R., & Barone, M. A. (2009). Evidence-based, alternative cervical cancer screening approaches in low-resource settings. International Perspectives on Sexual and Reproductive Health, 35(3), 147–152.
Shetty, P. (2012). India’s diabetes time bomb. Nature, 485(7398), S14–S16.
Singh, A. K., et al. (2013). Epidemiology and risk factors of chronic kidney disease in India – results from the SEEK (screening and early evaluation of kidney disease) study. BMC Nephrology, 14(114), 1-10.
Singh, D. (2013). Background: national programme for prevention and control of cancer, diabetes, cardiovascular diseases (NPCDCS). Personal communication.
Singh, K., Reddy, K. S., & Prabhakaran, D. (2011). What are the evidence based public health interventions for prevention and control of NCDs in relation to India? Indian Journal of Community Medicine, 36(Suppl 1), S23.
Sinha, K. (2012). Government to bring essential medicine under price control. 28 September 2012. The Times of India. Accessed 20 August 2014, from http://timesofindia.indiatimes.com/india/Govt-to-bring-essential-medicines-under-price-control/articleshow/16581261.cms.
Solow, R. M. (1956). A contribution to the theory of economic growth. The Quarterly Journal of Economics, 70(1), 65–94.
Sorensen, G., et al. (2012). Promoting life skills and preventing tobacco use among low-income Mumbai youth: effects of Salaam Bombay Foundation intervention. PLoS ONE, 7(4), e34982.
Sorensen, G., et al. (2013). Effects of a tobacco control intervention for teachers in India: results of the Bihar school teachers study. American Journal of Public Health, 103(11), 2035–2040.
Srinath Reddy, K., et al. (2005). Responding to the threat of chronic diseases in India. The Lancet, 366(9498), 1744–1749.
Stenberg, K., & Chisholm, D. (2012). Resource needs for addressing non-communicable disease in low- and middle-income countries: current and future developments. Global Heart, 7(1), 53–60.
Sudhakar, P. (2013). Urban expansion vs. green cover /parks. Eco News, 19(1), 5-7.
Tamil Nadu Health Systems Project. (2009). Prevention and care for women: cervical cancer screening pilot program. Accessed 20 August 2014, from http://www.tnhsp.org/files/Cervical%20Cancer.pdf.
Taylor, D. W. (2010). The burden of non-communicable diseases in India. Hamilton, ON: Cameron Institute.
Taylor, L. (2012). India pledges “free drugs for all” from October. 27 June 2012. PharmaTimes Online. Accessed 20 August 2014, from http://www.pharmatimes.com/article/12-06-27/India_pledges_free_drugs_for_all_from_October.aspx.
Thakur, J., et al. (2011). Social and economic implications of non-communicable diseases in India. Indian Journal of Community Medicine, 36(Suppl 1), S13–S22.
UNESCO Institute for Statistics. (2013). Measures of children out of school.
UNICEF. (2013). Goal 1: eradicate extreme poverty and hunger. Accessed 20 August 2014, from http://www.unicef.org/india/overview_3702.htm.
United Nations (UN). (2011). Statement by Mr Ghulam Nabi Azad, Minister of Health of Family Welfare. 19 September 2011. New York: Nations General Assembly on the Prevention and Control of Non-Communicable Diseases.
United Nations (UN). (2012a). Health in the post-2015 UN development agenda: thematic think piece. UN System Task Team on the post-2015 UN Development Agenda, UNAIDS, UNICEF, UNFPA, & WHO. Accessed 20 August 2014, from http://www.un.org/millenniumgoals/pdf/Think%20Pieces/8_health.pdf.
United Nations (UN). (2012b). Realizing the future we want for all. UN System Task Team on the post-2015 UN Development Agenda. Accessed 20 August 2014, from http://www.un.org/millenniumgoals/pdf/Post_2015_UNTTreport.pdf.
United Nations (UN). (2012c). World urbanization prospects: the 2011 revision. New York.
United Nations General Assembly (UNGA). (2011a). Non-communicable diseases deemed development challenge of “epidemic proportions” in political declaration adopted during landmark General Assembly summit. 19 September 2011. Accessed 20 August 2014, from http://www.un.org/News/Press/docs/2011/ga11138.doc.htm.
United Nations General Assembly (UNGA). (2011b). Political declaration of the high-level meeting of the general assembly on the prevention and control of non-communicable diseases. 24 January 2011. Accessed 20 August 2014, from http://www.who.int/nmh/events/un_ncd_summit2011/political_declaration_en.pdf.
United Nations Population Division. (2012). World population prospects: the 2012 revision. New York: Department of Economic and Social Affairs, United Nations.
United States Department of Agriculture (USDA). (2009). India: agricultural economy and policy report. Washington, DC.
Uraguchi, C., Sen, S., & Ueyama, M. (2009). Exploring gaps in the existing healthcare system in rural Tamil Nadu. Center for Technologies in Public Health. Accessed 20 August 2014, from http://www.ictph.org.in/gip-2009/paper-6-introduction.html.
Varma, P., et al. (2010). Prevalence of early stages of chronic kidney disease in apparently healthy central government employees in India. Nephrology Dialysis Transplantation, 25(9), 3011–3017.
Vijay, V. S. (2012). Demand No. 19. Policy Note 2012-2013. Tamil Nadu: Government of Tamil Nadu.
Viswanath, K., et al. (2010). Movies and TV influence tobacco use in India: findings from a national survey. PLoS ONE, 5(6), e11365.
Wang, P. S., et al. (2007). Use of mental health services for anxiety, mood, and substance disorders in 17 countries in the WHO world mental health surveys. The Lancet, 370(9590), 841–850.
Webster, J., et al. (2011). Salt reduction initiatives around the world. Journal of Hypertension, 29(6), 1043–1050.
Williams, R., & Krakauer, R. (2011). The challenge of non-communicable diseases and geriatric conditions. In Global Population Ageing: Peril or Promise? Geneva: World Economic Forum.
Wolf, C., et al. (2011). China and India, 2025: a comparative assessment. Santa Monica, CA: RAND Corporation.
World Bank. (2002). India’s transport sector: the challenges ahead. In The World Bank. Washington, DC: World Bank.
World Bank. (2011a). Migration and remittances factbook 2011. Washington, DC: World Bank.
World Bank. (2011b). World Development Indicators online (WDI) database. Washington DC: World Bank.
World Bank. (2012). Project signing: government of India and World Bank sign $70 million agreement for Karnataka health system development and reform project. Press Release No: 012/XXX/SAR. Washington, DC: World Bank.
World Bank. (2013a). Implementation status and results. India: Tamil Nadu health systems project (PO75058). Report Number ISR9624. Washington, DC: World Bank.
World Bank. (2013b). India: Karnataka health systems additional financing. Accessed 20 August 2014, from http://www.worldbank.org/projects/P130395/india-karnataka-health-systems-additional-financing?lang=en.
World Bank. (2013c). India: Tamil Nadu health systems project. Accessed 20 August 2014, from http://www.worldbank.org/projects/P075058/tamil-nadu-health-systems-project?lang=en.
World Bank. (2013d). Population growth (annual %). Washington, DC: World Bank.

49Economics of Non-Communicable Diseases in India
World Bank. (2013e). World development indicators. Accessed 20 August 2014, from http://data.worldbank.org/data-catalog/world-development-indicators.
World Economic Forum & World Health Organization. (2011). From burden to “best buys”: reducing the economic impact of non-communicable diseases in low- and middle-income countries. Geneva: World Economic Forum.
World Economic Forum. (2013). The human capital report. Geneva: World Economic Forum.
World Health Organization (WHO). (2001). Macroeconomics and health: investing in health for economic development. Geneva: Report of the Commission on Macroeconomics and Health, World Health Organization.
World Health Organization (WHO). (2005). Preventing chronic diseases: a vital investment. Geneva: World Health Organization.
World Health Organization (WHO). (2007). Vision 2020: the right to sight. Global initiative for the elimination of avoidable blindness: Action Plan 2006-2011. Geneva: World Health Organization.
World Health Organization (WHO). (2008a). Prevention and control of non-communicable diseases: implementation of the global strategy. Geneva: World Health Organization.
World Health Organization (WHO). (2008b). The global burden of disease: 2004 update. Geneva: World Health Organization.
World Health Organization (WHO). (2009a). Non-communicable diseases, poverty, and the development agenda. Geneva: ECOSOC High-Level Segment, World Health Organization.
World Health Organization (WHO). (2009b). WHO report on the global tobacco epidemic, 2009: implementing smoke-free environments. Accessed 20 August 2014, from http://whqlibdoc.who.int/publications/2009/9789241563918_eng_full.pdf.
World Health Organization (WHO). (2010). Global data on visual impairments 2010. Geneva: World Health Organization.
World Health Organization (WHO). (2011a). First global ministerial conference on healthy lifestyles and noncommunicable disease control, Moscow, 28-29 April 2011, Moscow Declaration. Moscow: World Health Organization.
World Health Organization (WHO). (2012a). Millennium development goals (MGDs). Geneva: World Health Organization.
World Health Organization (WHO). (2012b). Provisional summary of the third meeting: sixty-fifth World Health Assembly committee A. Geneva: World Health Organization.
World Health Organization (WHO). (2012c). Rio political declaration on social determinants of health. In World Conference on Social Determinants of Health. Geneva: World Health Organization.
World Health Organization (WHO). (2012d). “Sixty-fifth World Health Assembly closes with new global health measures” Accessed 20 August 2014, from http://www.who.int/mediacentre/news/releases/2012/wha65_closes_20120526/en/index.html.
World Health Organization (WHO). (2012e). Sixty-fifth World Health Assembly decisions and list of resolutions. WHA65(8). Geneva: World Health Organization.
World Health Organization (WHO). (2012f). The global burden of mental disorders and the need for a comprehensive, coordinated response from health and social sectors at the country level. A 65/10 in Sixty-Fifth World Health Assembly. Geneva: World Health Organization.
World Health Organization (WHO). (2013a). Addressing violence against women: health impacts and the role of the health sector. Side event at the 66th World Health Assembly. Accessed 20 August 2014, from http://www.who.int/violence_injury_prevention/violence/wha_outcome_statement.pdf.
World Health Organization (WHO). (2013b). Breast cancer: prevention and control. Accessed 20 August 2014, from http://www.who.int/cancer/detection/breastcancer/en/index2.html.
World Health Organization (WHO). (2013c). Disability. A66/12 Report by the Secretariat. Geneva: World Health Organization.
World Health Organization (WHO). (2013d.) Draft action plan for the prevention and control of non-communicable diseases 2013–2020. A66/9 Report by the Secretariat. Geneva: World Health Organization.
World Health Organization (WHO). (2013e). Draft action plan for the prevention of avoidable blindness and visual impairment 2014–2019. Towards universal eye health: a global action plan 2014–2019. A66/11 Report by the Secretariat. Geneva: World Health Organization.
World Health Organization (WHO). (2013f). Draft comprehensive mental health action plan 2013–2020. A66/10 Rev.1 Report by the Secretariat. Geneva: World Health Organization.
World Health Organization (WHO). (2013g). First WHO discussion paper: draft terms of reference for a global coordination mechanism for the prevention and control of noncommunicable diseases. Geneva: World Health Organization.
World Health Organization (WHO). (2013h). Global health observatory: blood pressure. Accessed 20 August 2014, from http://www.who.int/gho/ncd/risk_factors/blood_pressure_prevalence/en/index.html.
World Health Organization (WHO). (2013i). MPOWER brochures and other resources. Accessed 20 August 2014, from http://www.who.int/tobacco/mpower/publications/en/index.html.
World Health Organization (WHO). (2013j). Resolution A66/A/CONF./1Rev.1 Follow-up to the political declaration of the high-level meeting of the general assembly on the prevention and control of non-communicable diseases. Sixty-sixth world health assembly. Geneva: World Health Organization.
World Health Organization (WHO). (2013k). Seven governments adopt statement on violence against women and girls at 66th World Health Assembly. Accessed 20 August 2014, from http://www.who.int/violence_injury_prevention/media/news/2013/21_05/en/index.html.
World Health Organization (WHO). (2013l). “Sixty-sixth World Health Assembly: daily notes on proceedings” [cited 28 May 2013]; available from http://www.who.int/mediacentre/events/2013/wha66/journal/en/index3.html.
World Health Organization (WHO). (2013m). WHO guidance note: comprehensive cervical cancer prevention and control: a healthier future for girls and women. Geneva: World Health Organization.
World Health Organization (WHO) & Pan American Health Organization (PAHO). (2013). Monitoring national cervical cancer prevention and control programmes: quality control and quality assurance for visual inspection with acetic acid (VIA)-based programmes. Geneva: World Health Organization.
Yee, A. (2013). Reforms urged to tackle violence against women in India. The Lancet, 381(9876), 1445–1446.
Yusuf, S., et al. (2012). Comparison of risk factor reduction and tolerability of a full-dose polypill (with potassium) versus low-dose polypill (polycap) in individuals at high risk of cardiovascular diseases. Circulation: Cardiovascular Quality and Outcomes, 5(4), 463–471.
Zarete, V. (2007). DALYs and QALYs in developing countries. Health Affairs, 26(4), 1197–1198.

50 Economics of Non-Communicable Diseases in India
Appendix A. Results from the Longitudinal Ageing Study in India
This section provides more detailed data on the Longitudinal Ageing Study in India (LASI) pilot results.
LASI Pilot: Prevalence of NCDs by Demographic Groups
The LASI pilot collected data on several NCDs. The prevalence of self-reported diabetes mellitus; chronic respiratory disease; heart disease (heart attack, angina, coronary heart disease and congestive heart failure); stroke; and musculoskeletal conditions (e.g. arthritis) covering four Indian states is reported in Table A1. Prevalence of diabetes and chronic respiratory disease increases rapidly from 5% and 2%, respectively, in the 45-54 age group, to 12% and 5% in those aged 55-64. In contrast, stroke and heart disease display fairly gradual increases over age groups, rising from 0.7% and 1.7%, respectively, in the 45-54 age group to 1.2% and 7.3% among those aged 65-74. Among
study participants aged 75 and older, the prevalence of diabetes and heart disease is lower than among younger age groups, whereas prevalence of stroke and chronic respiratory increases sharply. Arthritis also increases in prevalence with age, doubling from 5.3% among the 45-54 age group to 11.4% in those aged 75 and older.
Location and type of residence are also associated with the prevalence of the chronic conditions among respondents. Those in urban areas have a higher prevalence of all NCDs except stroke, for which the prevalence in rural adults is more than three times that of urban adults (1.1% and 0.3%, respectively). Across states, Kerala leads the four states for diabetes (20.2%), heart disease (8.7%), stroke (1.8%), chronic respiratory disease (8.4%), and arthritis (22.6%). It is followed by Karnataka and Punjab, except for chronic respiratory disease, where it is followed by Rajasthan and Karnataka.

51Economics of Non-Communicable Diseases in India
Source: Arokiasamy et al. (2014)
Table A1: NCD Prevalence in Adults 45+, by Demographic Categories and Location (%)43
Diabetes Heart disease
Stroke Chronic respiratory
disease
Cancer Psychiatric Arthritis NCD>1 Poor near vision
Total prevalence 9% 4% 1% 5% 0% 2% 8% 7% 57%
Number of respondents
137 53 13 68 5 22 122 101 814
Age
45-54 (n=628) 4.9*** 1.7*** 0.7 1.8*** 0.2 1.8 5.3*** 5.5* 57.5
55-64 (n=410) 12.4*** 4.2*** 0.3 5.2*** 0.4 2.3 7.0*** 6.7* 57.4
65-74 (n=251) 13.3*** 7.3*** 1.2 8.9*** 0.6 1.1 12.5*** 10.3* 55.8
75+ (n=140) 6.9*** 3.8*** 2.7 10.7*** 0.0 1.1 11.4*** 9.2* 51.2
Total (n=1,429) 8.7*** 3.6*** 0.9 4.9*** 0.3 1.7 7.6*** 7.1* 56.5
Gender
Male (n=694) 7.9 4.4* 1.1 5.7 0.3 2.2 5.1*** 8.7*** 54.0*
Female (n=737) 9.5 2.8* 0.7 4.1 0.3 1.3 10.0*** 5.4*** 58.9*
Residence
Urban (n=405) 14.4*** 3.7 0.3 5.3 0.7 1.4 8.6 7.6 53.5
Rural (n=1,026) 6.6*** 3.5 1.1 4.7 0.2 1.9 7.2 6.9 57.6
Education
None (n=660) 3.2*** 1.7*** 0.8 3.6 0.1 1.3 3.3*** 5.3 54.1
Primary school (n=106)
7.2*** 5.2*** 0.8 7.6 0.0 2.8 14.3*** 7.6 67.0
Middle/high school (n=339)
14.6*** 5.2*** 0.9 6.1 0.5 2.9 11.3*** 8.6 58.7
>High school (n=325) 15.8*** 5.7*** 1.0 5.4 0.8 1.2 10.9*** 8.9 55.7
Marital status
Never married (n=25) 3.5 0.0 0.0 3.5 0.0 5.6 0.0** 0.0 48.3
Married (n=1,120) 8.8 3.8 0.9 4.5 0.3 1.6 6.5** 7.3 56.7
Separated/divorced (n=17)
9.1 10.1 0.0 7.1 0.0 5.2 5.2** 7.1 44.4
Widowed (n=269) 9.0 2.7 1.0 6.5 0.5 1.6 12.9** 6.6 57.2
Religion
Hindu (n=981) 7.8*** 3.5*** 1.0 5.2 0.3 2.1 7.8** 7.2* 57.2*
Muslim (n=97) 9.0*** 2.4*** 0.0 4.6 0.0 0.8 5.9** 5.1* 49.8*
Christian (n=106) 23.4*** 10*** 0.9 6.2 0.9 0.7 14.2** 12.9* 65.6*
Sikh (n=211) 7.6*** 0.5*** 1.0 0.9 0.0 0.5 2.8** 3.2* 51.0*
Income quintile
Lowest (n=264) 7.1 2.3 0.0 3.1 0.0 0.7 2.5 7.5 56.3
Second (n=241) 5.5 2.8 0.5 5.0 0.2 1.4 4.2 10.4 55.7
Third (n=265) 7.0 3.1 1.5 4.6 0.0 1.6 7.0 4.7 62.4
Fourth (n=270) 15.8 5.0 1.0 6.9 0.7 2.9 12.2 7.7 52.4
Highest (n=271) 11.0 5.2 0.9 4.9 0.6 2.0 15.4 5.5 52.8
State
Punjab (n=361) 6.1*** 1.1*** 0.6 1.4*** 0.3 0.8*** 2.2*** 3.3** 52.8***
Rajasthan (n=353) 3.5*** 1.1*** 0.3 5.6*** 0.0 0.3*** 2.0*** 4.7** 48.4***
Kerala (n=405) 20.2*** 8.7*** 1.8 8.4*** 0.7 1.5*** 22.6*** 12.0** 61.2***
Karnataka (n=312) 6.5*** 3.2*** 1.0 2.9*** 0.3 3.8*** 4.2*** 7.3** 62.8***

52 Economics of Non-Communicable Diseases in India
LASI Pilot: Risk Factor Prevalence
Like the prevalence of NCDs among reåspondents, the prevalence of disease risk factors including hypertension, high cholesterol, tobacco use, lack of physical activity and obesity also varies between different demographic and socio-economic groups (Table A2). As noted in the main text, the frequency of hypertension among respondents increases with age. Similarly, the frequency of those reporting high cholesterol and lack of exercise consistently increases with
age. Consumption of tobacco is highest in the 65-74 age group, while obesity is highest among those aged 55-64.
Risk factor prevalence also varies by marital status. Separated/divorced and widowed respondents had a higher prevalence of hypertension, lack of exercise, and obesity (also due to reduced functional ability at higher ages), while separated/divorced respondents had a slightly higher prevalence of tobacco use compared to those married.
Source: Arokiasamy et al. (2014)
Table A2: NCD Risk Factors in Adults 45+, by Demographic Categories and Location (%)44
Measured high BP
Self-reported high BP
Self-reported high cholesterol
Tobacco45 No exercise Obesity
Total prevalence 40% 17% 3% 22% 69% 14%Number of respondents 542 274 55 288 453 233
Age 45-54 (n=580) 33.8*** 11.1*** 2.3 19.2 62.0*** 12.355-64 (n=367) 42.6*** 19.5*** 4.1 22.5 66.8*** 16.965-74 (n=233) 49.7*** 25.0*** 3.3 25.7 80.2*** 15.275+ (n=127) 48.3*** 21.7*** 5.5 22.6 88.2*** 15.5Total (n=1,307) 40.4*** 17.0*** 3.3 21.6 69.1*** 14.4
GenderMale (n=628) 40.4 14.1** 2.9 37.0** 58.3* 11.4**Female (n=681) 40.4 19.6** 3.7 7.0** 79.3* 17.4**
ResidenceUrban (n=362) 44.2 21.1** 3.1 16.1** 73.9* 21.1***Rural (n=947) 39.0 15.4** 3.4 23.6** 67.3* 12.0***
EducationNone (n=598) 38.1 7.8*** 0.4*** 17.6*** 70.9 13.2Primary school (n=97) 42.8 25.9*** 2.1*** 39.4*** 67.7 10.3Middle/high school (n=312) 47.1 23.8*** 5.1*** 28.1*** 68.9 15.8>High school (n=301) 38.0 26.7*** 8.4*** 17.3*** 66.1 17.3
Marital statusNever married (n=22) 29.9* 10.6** 3.5 9.9* 57.5*** 27.3Married (n=1,019) 38.4* 15.2** 3.1 23.3* 66.3*** 13.3Separated/divorced (n=17) 38.4* 26.8** 0.0 23.6* 73.4*** 16.2Widowed (n=251) 49.6* 24.1** 4.2 15.7* 81.5*** 17.8
ReligionHindu (n=900) 37.7*** 14.7*** 2.3*** 23.1*** 67.3 12.6Muslim (n=82) 50.4*** 13.9*** 3.1*** 27.1*** 79.2 22.5Christian (n=104) 42.9*** 39.4*** 17.9*** 24.4*** 71.9 13.3Sikh (n=192) 52.7*** 22.5*** 0.5*** 1.1*** 72.6 24.4
Income quintilesLowest (n=241) 39.8 14.0** 1.5*** 22.8 71.6 13.1Second (n=226) 41.7 11.6** 1.2*** 24.1 67.2 11.2Third (n=247) 45.4 13.8** 2.2*** 21.5 71.1 11.1Fourth (n=254) 40.5 22.1** 5.0*** 23.7 65.2 16.7Highest (n=238) 32.4 25.7** 7.9*** 20.2 71.6 19.1
StatePunjab (n=319) 52.3** 20.0*** 0.3*** 4.4*** 68.8 23.8**Rajasthan (n=322) 44.6** 5.7*** 0.5*** 18.9*** 68.6 13.2**Kerala (n=383) 34.6** 33.3*** 12.6*** 31.1*** 66.7 14.3**Karnataka (n=285) 35.6** 14.7*** 0.3*** 24.6*** 71.5 11.8**

53Economics of Non-Communicable Diseases in India
LASI Pilot: Healthcare Payment Mechanisms
LASI data indicate that most respondents rely on savings or family and friends to pay for their medical care (Table A3). Reliance on family tends to increase with age, perhaps due to loss in stable sources of income from employment. Females also tend to rely more on family than males, albeit the figures for both genders are high. Contrary to expectations, rural
Source: Arokiasamy et al. (2014)
Table A3: Healthcare Payment Mechanisms for Adults 45+, by Demographic Categories, Location, and Disease Type (%)46
respondents use significantly more insurance than elderly urban respondents, although the use of insurance in either group is less than 1%. Rural residents and respondents with no education also rely on borrowing from other sources (3.7% and 4.8%, respectively), indicating that in some cases, even the safety net provided by government and family may not be sufficient to pay for the medical expenses.
Free Family Employer Insurance Borrowing
Total using payment mechanism 8% 80% 2% 1% 3%
Number of survey respondents 103 1,221 30 9 43
Age 45-54 (n=638) 8.8 77.4 1.8 0.6 2.555-64 (n=413) 9.5 78.6 2.2 0.9 3.565-74 (n=256) 8.6 82.3 3.3 0.3 2.475+ (n=144) 2.6 87.5 0.7 0.7 3.2Total (n=1,451) 8.4 79.6 2.1 0.7 2.8
GenderMale (n=706) 8.2 77.5* 2.3 0.8 3.8Female (n=747) 8.6 81.6* 1.9 0.5 2.0
ResidenceUrban (n=411) 7.3 75.6 2.6 0.3 0.7**Rural (n=1,042) 8.8 81.1 1.9 0.8 3.7**
EducationNone (n=668) 6.5* 78.1 2.4 0.4 4.8Primary school (n=109) 18.1* 90.4 0.8 0.0 0.4Middle/high school (n=345) 8.1* 81.3 1.5 0.0 1.6>High school (n=329) 9.4* 77.1 2.6 2.1 0.7
Marital statusNever married (n=25) 22.2 69.6 5.5 5.5 5.5Married (n=1,137) 7.7 79.3 2.3 0.7 3.0Separated/divorced (n=17) 10.4 78.3 0.0 0.0 0.0Widowed (n=274) 10.0 81.7 1.1 0.0 2.2
ReligionHindu (n=997) 10.0 77.3 1.7 0.4 2.9Muslim (n=97) 4.8 71.0 5.7 2.4 4.7Christian (n=110) 3.3 93.0 0.0 1.8 0.0Sikh (n=213) 1.8 96.8 3.7 0.5 3.2
Income quintilesLowest (n=269) 8.9 77.7 3.9 0.2 3.8Second (n=248) 8.0 75.7 1.2 0.9 2.5Third (n=269) 10.3 83.5 0.5 0.0 4.0Fourth (n=274) 5.1 85.2 3.1 0.4 2.3Highest (n=272) 7.0 80.1 1.5 1.1 1.4
StatePunjab (n=366) 2.2 97.3 3.0 0.3 4.3Rajasthan (n=358) 0.5 78.9 3.0 0.5 5.6Kerala (n=414) 8.3 93.6 0.5 1.0 1.2Karnataka (n=315) 19.3 61.9 1.9 0.6 0.6
Disease type
Diabetes (n=137) 9.2 87.0 3.6 0.7 0.7Heart (n=53) 11.7 86.5 0.0 1.7 1.7Stroke (n=13) 7.1 81.8 0.0 0.0 7.1Chronic respiratory disease (n=68) 9.5 89.2 0.0 0.0 2.6Cancer (n=5) 0.0 100.0 0.0 0.0 0.0Psychiatric (n=22) 48.7 32.8 0.0 0.0 0.0Arthritis (n=122) 12.6 89.6 2.6 0.8 1.9Co-morbidity (NCD>1) (n=101) 11.7 81.8 2.9 2.1 1.8

54 Economics of Non-Communicable Diseases in India
Appendix B. Intervention Framework Summary Table
* NA = not applicable.
Intervention
Framework
WHO best buys
WHO PEN47 Settings
Life-course stage
Risk factor*
Health outcome
NPCDCS2 √community
health system policy
adult NA
cancer CVD
diabetes stroke
Dietary salt reduction √community
health systemall stages diet
hypertension
CVD
Health system strengthening project (World Bank)
community health system
adult diet
cervical cancer hypertension
CVD
HPV vaccination √health system
school policy
adolescent adult
HPV infection
cancer
Tobacco taxation √ policy all stages tobaccoCVD CRD
cancer
Tobacco regulation: smoking ban in public places
√
policy
community
worksite
all stages tobacco CVD CRD
cancer
MYTRI school adolescent tobaccoCVD CRD
cancer
Kidney Help Trust of Chennai: community-based kidney care programme
community health system
adult NAkidney disease
diabetes
IDPPcommunity
health systemadult NA diabetes
MANAS health system adult NAanxiety
depression
Combination drug therapy for CVD √ health system adult NACVD
diabetes
BBH: community-level intervention √community
technologyadult NA
diabetes
CVD
harmful use of alcohol

55Economics of Non-Communicable Diseases in India
Appendix C. Candidate Interventions
1. Mobilizing Youth for Tobacco-Related Initiatives (MYTRI): a school-based programme in Delhi and Chennai to prevent use of tobacco (Jha et al., 2011; Perry et al., 2009).
2. Dietary salt reduction
3. Tobacco taxation: a public policy response to prevent tobacco use (John et al., 2010)
4. Tobacco regulation: enforcement of a complete smoking ban in public places
5. Kidney Help Trust of Chennai: a community-based kidney care programme to address diabetes and hypertension, and prevent chronic kidney disease (Ballal, 2007; Mani, 2003; Mani, 2005; Mani, 2010)
6. WHO best buys: combination drug therapy (Lim et al., 2007)
7. Stepped Care Intervention for Depressive and Anxiety Disorders (MANAS) (Patel et al., 2010; Patel et al., 2011b)
8. National Programme for Prevention and Control of Cancer, Diabetes, Cardiovascular Diseases and Stroke (NPCDCS): state-level experience in Karnataka (Directorate General of Health Services, 2010)
9. Health Systems Strengthening Project (World Bank): state-level experience in Tamil Nadu;
10. HPV vaccination
11. Bangalore Baptist Hospital (BBH): community-level intervention for CVD prevention and management
12. Essential medicines: state-level experience in Tamil Nadu
13. Tobacco-free teachers, tobacco-free society
14. Narayana Hrudayalaya Hospitals
15. Vision care intervention
16. National Programme for Health Care of the Elderly (NPHCE)
17. Enforcement of a complete smoking ban in public places (Donaldson et al., 2011)
18. Childhood obesity prevention demonstration project (as part of the World Economic Forum’s Health Living initiative)
19. Screening and treatment for cervical cancer, using VILI or VIA (Sherris et al., 2009)
20. Promoting exclusive breastfeeding up to the age of six months
21. Developing guidelines for prevention and treatment of NCDs and risk factors
22. Indian Diabetes Prevention Programme (IDPP) trial
23. The Indian Polycap Study (TIPS) trial (TIPS, 2009)
24. Universal healthcare
25. Worksite-based tobacco cessation programme
26. Regulation of tobacco advertising in Indian films and television (Arora et al., 2012; Viswanath et al., 2010)
27. Karnataka Road Transport Organisation: Workplace Alcohol Prevention Programme and Activity (Murthy & Sankaran, 2005)
28. Reduction of indoor air pollution by replacing the source of fuel or using improved cookstoves
29. Salaam Bombay Foundation: promoting life skills and preventing tobacco use among low-income Mumbai youth (Sorensen et al., 2012)
30. Programme for Improving Mental Health Care (PRIME) (Lund et al., 2012)
31. South Asian Hub for Advocacy, Research and Education on Mental Health (SHARE): programme of research and capacity building
32. Emerging mental health systems in low- and middle-income countries (EMERALD): improving mental health outcomes by enhancing health system performance
33. Vidarbha Stress and Health Programme: community-based programme to promote mental health and manage mental health disorders

56 Economics of Non-Communicable Diseases in India
Appendix D. Category B Interventions
This appendix features interventions not included in the economic analyses because of insufficient data, but that nevertheless are promising and have enough detail to provide the following descriptions. The hope is that as these
Essential medicines: state-level experience in Tamil Nadu
Health conditions:
– cancer– CVD– diabetes
Settings:
– health system– policy
In 1974, the Government of India formed the Committee on Drugs and Pharmaceuticals Industry, setting a precedent for other developing countries and leading to the landmark Drug Policy of 1978, which sought to provide a leadership role to the public sector; promote the domestic sector; ensure that drugs were available to meet health needs; offer special incentives to firms engaged in research and development; and channel the activity of foreign companies in accordance with national policies and objectives.
Based on recommendations from this committee, the Drug Price Control Order was implemented in 1979. This new graded system of price control ensured that essential medicines remained inexpensive. Though this had an obvious public health benefit, these early drug bills were considered closer to industrial policy than health policy (Chaudhury et al., 2005).
India’s drug manufacturing industry continued to grow steadily in subsequent years until it experienced a boom with the enactment of the 1986 Drug Policy, which deregulated price, imports, and production. This free-market ethos was further promoted with the implementation of the 1994 Policy on Drugs and Pharmaceuticals (Sengupta et al., 2008), and coincided with the liberalization of national economic policies. These policies eliminated a substantial number of price controls, relying instead on competition to keep drug prices low. But private companies capitalized on the new measures; prices rose 40% in the decade following this policy (Sinha, 2012) and, as a result, though access to healthcare is free or at low cost, drug prices are still unaffordable for the 480 million people that live on less than $1.25 a day (Bansal & Purohit, 2013).
Access to essential medicines: state-level experience During the 1990s, national drug policy remained mostly stagnant, but this was not the case at the state level. Two states in particular – Tamil Nadu and Delhi – took the lead in developing more progressive policies and programmes to improve the accessibility and affordability of high-quality essential medicines.
In 1994, Tamil Nadu developed India’s first essential medicines list. In the following year, the state started the Tamil Nadu Medical Services Corporation Limited, a government-owned company that centralizes procurement, storage, and distribution of drugs, in turn keeping costs low and allowing the state’s government to provide 270 essential medicines and an additional 174 specialty drugs for free at public hospitals and clinics (Kulkarni, 2012). While the impact of the programme has yet to be evaluated, Tamil Nadu is recognized as having some of the best health indicators in the country (Uraguchi et al., 2009), though this has not been directly linked to access to essential medicines.
At the same time, Delhi became the first state to pass a comprehensive drug policy, which set out to make safe, effective and affordable essential drugs available at all health facilities; promote rational use of drugs; promote use of generics; and strengthen health education and research specifically related to use of medicine. As a result, Delhi state healthcare institutions have documented improved access to drugs for the poor; ensured procurement of safe, effective medicines; and kept drug costs down through managed procurement processes (Chaudhury et al., 2005).
Recent efforts to expand access to essential medicines nationallyIn 1996, following the success in these two states and recognizing the importance of a list of essential medicines, the Government of India prepared the first national essential medicines list (NEML) (Bansal & Purohit, 2013), now in its third edition after revisions in 2003 and 2011. Though the NEML is regarded as a positive step for public health in India, especially because the latest version incorporates medicines for non-communicable diseases (Lovering, 2013), it has also received criticism for omitting a complementary list and a list for children, both of which are key parts of WHO’s model list (Kulkarni, 2012; Manikandan, 2012).
The Indian government has recently taken major steps towards increasing access to medicines on the WHO list. In 2012, the Drug Price Control Order 2013 was introduced, which will institute a price ceiling for all 348 drugs on the NEML starting in 2014 (Sinha, 2012). At the same time, the
programmes are developed, introduced, and rolled out in India, adequate data will be collected to conduct subsequent ROI analysis

57Economics of Non-Communicable Diseases in India
government announced that as part of its goal to increase healthcare spending from 1.4% to 2.5% of GDP, it will provide all drugs from the NEML for free to government-run hospitals and clinics (Bajaj, 2012). The government will finance 75% of this $5 billion, five-year plan, while states will finance the remaining 25%. Mirroring the Tamil Nadu
Founded by Devi Prasad Shetty in 2001, Narayana Hrudayalaya Heart Hospital in Karnataka, Bangalore, operates on a model of high-quality healthcare at low cost. Shetty, an Indian heart surgeon and former surgeon to Mother Teresa, was inspired by the work of the famous humanitarian. The hospital uses a hybrid pricing strategy, attracting paying patients by virtue of its reputation, and using these fees to subsidize procedures at or below cost for patients who cannot afford to pay. Non-paying patients make up about 40% of the hospital’s clientele (Khanna et al., 2011). Narayana Hrudayalaya uses various strategies to lower its cost per medical procedure, including: performing a high volume of surgeries – an average of 120 major surgeries per day (Narayana Health, 2013); allowing surgeons to specialize in particular types of procedures; minimizing administrative costs and negotiating special rates with supply and equipment companies (Khanna et al., 2011).
While Narayana Hrudayalaya started as a single 600-bed facility, it has since expanded to become a massive healthcare company, with 6,000 beds across 17 hospitals in 13 different Indian locations (Narayana Health, 2013). The original Bangalore hospital has become a “health city”, with units for cancer, trauma, orthopaedics, eye surgery, and other specialties (Khanna & Bijlani, 2012). Shetty has also spearheaded large-scale programmes in telemedicine,
approach, this programme, which aims to reduce OOP healthcare expenses, will be enabled by a new central procurement agency (Taylor, 2012) and will rely largely on supply from generic drug manufacturers (Ministry of Health and Family Welfare, 2012a). The policy will be rolled out nationwide by 2014 (Foy, 2012).
Tobacco-free teachers/tobacco-free society Health conditions:
– CVD– CRD– cancer
Settings:
– school
Narayana Hrudayalaya Hospitals Health conditions:
– CVD
Settings:
– health system
An initiative to prevent the use of tobacco was implemented and evaluated in Bihar. The programme, “tobacco-free teachers/tobacco-free society,” was carried out in the school setting and focused on preventing tobacco use or achieving tobacco cessation among school teachers (Nagler et al., 2013; Sorensen et al., 2013). Based on behaviour change theory and grounded in formative research, the randomized controlled trial aimed to create an environment conducive to not using tobacco. Emphasizing teachers as role models and incorporating elements of health education, the programme operated for the academic year and consisted of activities designed to guide schools in developing a tobacco policy, producing support materials and providing support for tobacco cessation.
A formal evaluation was conducted on the tobacco-free teachers/tobacco-free society intervention. Two sets of post-intervention surveys were administered – one immediately following the intervention, and the other nine months after it. Cessation rates among teachers in the intervention schools were double those of teachers in the control schools. The difference in the six-month quit rate (measured at nine months post-intervention) between the intervention and control groups was more than double, although this difference was statistically only borderline significant. While the intervention produced promising results, little is known about its costs.
mobile health clinics, and health insurance for the rural poor (Khanna et al., 2011).
Narayana Hrudayalaya’s operations have proven highly cost-effective. In India as a whole, the average cost for open-heart surgery, including stay in a private hospital, is about $5,000; in comparison, the average cost per procedure at Narayana Hrudayalaya is about $1,800 (Khanna & Bijlani, 2012). Its safety and quality standards are also comparable with those of high income countries; in 2004, Narayana Hrudayalaya had a 1.27% mortality rate and 1% infection rate in coronary artery bypass graft procedures, compared with rates of 1.2% and 1%, respectively, for the same procedure in the United States (Khanna et al., 2011). The success of Narayana Hrudayalaya’s financial and healthcare delivery models make the hospital system a promising prospect for the treatment of cardiothoracic conditions and other NCDs, in India and many other developing and high income countries.

58 Economics of Non-Communicable Diseases in India
Vision care intervention: a proposal to improve visual acuity in an ageing India
Health conditions:
– visual impairment
Settings:
– community
WHO reports that 60 million people in India suffer from impaired vision (Pascolini & Mariotti, 2012; WHO, 2010). In addition to the negative health impacts imposed by poor vision, including increased risk of falls and accidents, and feelings of social isolation and depression, visual impairment can also pose a hefty economic burden, in the form of lost productivity due to disability and time costs for caretaking. The Global Burden of Disease Study 2010 calculates that glaucoma, cataracts, macular degeneration, refraction disorders, and other vision loss together accounted for nearly 5 million DALYs in India (IHME, 2013). These problems will only grow more pronounced as India’s population continues to age; the LASI described in Section 2 of this report found that in four states, nearly 30% of adults aged 45 and older had reduced distance visual acuity.
Existing solutionsRefractive errors, responsible for an estimated 20% of blindness in elderly Indians, can be corrected with eyeglasses, contact lenses or LASIK (a type of laser) surgery. A simple diagnosis of refractive errors can be performed using a basic visual acuity test; however, a best-corrected visual acuity (BCVA) test is necessary to determine eyeglass prescription strength, and requires heavy and expensive
equipment that is cumbersome and difficult to transport. Special equipment and ophthalmological training are required to diagnose, and surgery to correct, other eye conditions such as cataracts, glaucoma and macular degeneration (Mayo Clinic, 2013b; Mayo Clinic, 2013c; Mayo Clinic, 2012). Diabetes is linked to diabetic retinopathy as well as to a greater risk of both glaucoma and cataracts (Mayo Clinic, 2013a; WHO, 2007), so reducing the prevalence of diabetes is another strategy for preventing eye conditions.
Potential solutionsScope exists for new interventions to tackle the unaddressed burden of vision problems in India, particularly in the use of mobile technologies. New smartphone apps, such as EyeNetra and PlenOptika, provide the prospect of diagnosing refractive errors outside of medical facilities more easily and conveniently than through traditional BCVA tests, so that eyeglass prescriptions can be provided more easily. Other smartphone-based systems, such as Peek (portable eye examination kit), can be used for eye imaging in the field; these images can then be sent to physicians, who can use them to diagnose conditions other than refractive errors and recommend treatment.

59Economics of Non-Communicable Diseases in India
Appendix E. Return on Investment: Equations
We calculate return on investment (ROI) as equal to the present value of benefits assumed to be realized in the future (BPV) minus initital costs (C), divided by initial costs. The benefits are assumed to result from the initial costs, and we assume no other additional benefits:
To find the present value of benefits, the future value of the benefits is calculated first. This is done by multiplying the number of DALYs averted (D) by per-capita GDP (GDPPC). Then, a chosen discount rate (r) is applied by dividing this value by (1+ r) raised to t, where t equals the number of time periods over which these benefits will accrue (in this case, 30 years). Cost is not discounted in this case because the assumption is that the money is spent today, all at once. This is a conservative estimate of the present value of the future benefits. It is assumed that all benefits will appear at the end of the 30th year after intervention, not during the 30-year period after intervention or beyond:
To find the number of DALYs that will achieve a specific ROI, we solved for D:
Inserting the values used in Table 9 (a desired ROI of 15%, a 3% discount rate and a GDP per capita of $1,489.20):
!"# = !!" − !
!
!!" = ! ∗ !"#!"(1 + !)!
!"# =
! ∗ !"#!"(1 + !)! − !
!
! =!"# ∗ ! + ! 1 + ! !
!"#!"
! =0.15 ∗ ! + ! 1 + 0.03 30
$1,489.20
!"# = !!" − !
!
!!" = ! ∗ !"#!"(1 + !)!
!"# =
! ∗ !"#!"(1 + !)! − !
!
! =!"# ∗ ! + ! 1 + ! !
!"#!"
! =0.15 ∗ ! + ! 1 + 0.03 30
$1,489.20
!"# = !!" − !
!
!!" = ! ∗ !"#!"(1 + !)!
!"# =
! ∗ !"#!"(1 + !)! − !
!
! =!"# ∗ ! + ! 1 + ! !
!"#!"
! =0.15 ∗ ! + ! 1 + 0.03 30
$1,489.20
!"# = !!" − !
!
!!" = ! ∗ !"#!"(1 + !)!
!"# =
! ∗ !"#!"(1 + !)! − !
!
! =!"# ∗ ! + ! 1 + ! !
!"#!"
! =0.15 ∗ ! + ! 1 + 0.03 30
$1,489.20

60 Economics of Non-Communicable Diseases in India
Appendix F. Sensitivity Analyses
Table F1: Varying the Time Horizon
Programme costs, in 2013 dollars Discount rate Desired
ROI
No. of DALYs averted/
QALYs gained, required: 15 years
No. of DALYs averted/
QALYs gained, required: 30 years
No. of DALYs averted/
QALYs gained, required: 45 years
NPCDCS 4,100,000,000.00 0.03 0.15 4,932,727 7,685,027 11,973,022
NPCDCS – Karnataka only 372,737.00 0.03 0.15 448 699 1,088
15% voluntary dietary salt reduction 33,400.00 0.03 0.15 30 47 74
Health Systems Strengthening Project, Tamil Nadu
Cervical cancer screening 363,051.00 0.03 0.15 437 681 1,060
Hypertension screening 359,980.00 0.03 0.15 433 675 1,051
HPV vaccination
70% coverage at $10/dose 17,389,500.30 0.03 0.15 20,921 32,595 50,782
70% coverage at $25/dose 144,912,502.50 0.03 0.15 174,345 271,624 423,181
70% coverage at $50/dose 365,179,506.30 0.03 0.15 439,349 684,491 1,066,415
Tobacco taxation: increased rate on cigarettes and bidis 72,480.00 0.03 0.15 87 136 212
Tobacco regulation (Gujarat): public smoking ban
Partial ban 64,038.00 0.03 0.15 77 120 187
Complete ban 4,390,733.00 0.03 0.15 5,283 8,230 12,822
MYTRI 210,878.00 0.03 0.15 254 395 616
Kidney Help Trust of Chennai 7,836.00 0.03 0.15 9 15 23
IDPP
LSM 25,300.00 0.03 0.15 30 47 74
Metformin 24,700.00 0.03 0.15 30 46 72
LSM + metformin 30,300.00 0.03 0.15 36 57 88
MANAS 1,796.00 0.03 0.15 2 3 5
Best buys for CVD: four-drug regimen for primary and secondary treatment
Low-end estimate (CI 95%): $15.29/patient 1,529,000.00 0.03 0.15 1,840 2,866 4,465
Average estimate (CI 95%): $56.74/patient 5,674,000.00 0.03 0.15 6,826 10,635 16,569
High-end estimate (CI 95%): $104.46/patient 10,446,000.00 0.03 0.15 12,568 19,580 30,505
BBH: community health 100,000.00 0.03 0.15 120 187 292

61Economics of Non-Communicable Diseases in India
Table F2: Varying the Value of DALYs Averted
Programme costs, in 2013 dollars
Discount rate
Time period, in years
Desired ROI
No. of DALYs averted or
QALYs required, 1 DALY/QALY = 1 x per-capita
GDP
No. of DALYs averted or
QALYs required, 1 DALY/QALY = 2 x per-capita
GDP
No. of DALYs averted or
QALYs required, 1 DALY/QALY = 3 x per-capita
GDP
NPCDCS 4,100,000,000.00 0.03 30 0.15 7,685,027 3,842,514 2,561,676
NPCDCS – Karnataka only 372,737.00 0.03 30 0.15 699 349 233
15% voluntary dietary salt reduction 33,400.00 0.03 30 0.15 63 31 21
Health Systems Strengthening Project, Tamil Nadu
Cervical cancer screening 363,051.00 0.03 30 0.15 681 340 227
Hypertension screening 359,980.00 0.03 30 0.15 675 337 225
HPV vaccination
70% coverage at $10/dose 17,389,500.30 0.03 30 0.15 32,595 16,297 10,865
70% coverage at $25/dose 144,912,502.50 0.03 30 0.15 271,624 135,812 90,541
70% coverage at $50/dose 365,179,506.30 0.03 30 0.15 684,491 342,246 228,164
Tobacco taxation: increased rate on cigarettes and bidis 72,480.00 0.03 30 0.15 136 68 45
Tobacco regulation (Gujarat): public smoking ban
Partial ban64,038.00 0.03 30 0.15 120 40 60
Complete ban4,390,733.00 0.03 30 0.15 8,230 4,115 2,743
MYTRI 210,878.00 0.03 30 0.15 395 198 132
Kidney Help Trust of Chennai 7,836.00 0.03 30 0.15 15 7 5
IDPP
LSM 25,300.00 0.03 30 0.15 47 24 16
Metformin 24,700.00 0.03 30 0.15 46 23 15
LSM + metformin 30,300.00 0.03 30 0.15 57 28 19
MANAS 1,796.00 0.03 30 0.15 3 2 1
Best buys for CVD: four-drug regimen for primary and secondary treatment
Low-end estimate (CI 95%): $15.29/patient 1,529,000.00 0.03 30 0.15 2,866 1,433 955
Average estimate (CI 95%): $56.74/patient 5,674,000.00 0.03 30 0.15 10,635 5,318 3,545
High-end estimate (CI 95%): $104.46/patient 10,446,000.00 0.03 30 0.15 19,580 9,790 6,527
BBH: community health 100,000.00 0.03 30 0.15 187 94 62

62 Economics of Non-Communicable Diseases in India
Table F3: Varying the Desired ROI
Programme costs, in 2013 dollars
2013 India per-capita
GDP, at 2012
exchange rate
Discount rate
Time period, in years
No. of DALYs averted, required
for 0.15 ROI
No. of DALYs averted, required
for 0.20 ROI
No. of DALYs averted, required
for 0.25 ROI
NPCDCS 4,100,000,000.00 1,489.20 0.03 30 7,685,027 8,019,159 8,353,290
NPCDCS – Karnataka only 372,737.00 1,489.20 0.03 30 699 729 759
15% voluntary dietary salt reduction 33,400.00 1,489.20 0.03 30 63 65 68
Health Systems Strengthening Project, Tamil Nadu
Cervical cancer screening 363,051.00 1,489.20 0.03 30 681 710 740
Hypertension screening 359,980.00 1,489.20 0.03 30 675 704 733
HPV vaccination
70% coverage at $10/dose 17,389,500.30 1,489.20 0.03 30 32,595 34,012 35,429
70% coverage at $25/dose 144,912,502.50 1,489.20 0.03 30 271,624 283,433 295,243
70% coverage at $50/dose 365,179,506.30 1,489.20 0.03 30 684,491 714,252 744,012
Tobacco taxation: increased rate on cigarettes and bidis 72,480.00 1,489.20 0.03 30 136 142 148
Tobacco regulation (Gujarat): public smoking ban
Partial ban64,038.00 1,489.20 0.03 30 120 125 130
Complete ban4,390,733.00 1,489.20 0.03 30 8,230 8,588 8,946
MYTRI 210,878.00 1,489.20 0.03 30 395 412 430
Kidney Help Trust of Chennai 7,836.00 1,489.20 0.03 30 15 15 16
IDPP
LSM 25,300.00 1,489.20 0.03 30 47 49 52
Metformin 24,700.00 1,489.20 0.03 30 46 58 50
LSM + metformin 30,300.00 1,489.20 0.03 30 57 59 62
MANAS 1,796.00 1,489.20 0.03 30 3 4 4
Best buys for CVD: four-drug regimen for primary and secondary treatment
Low-end estimate (CI 95%): $15.29/patient 1,529,000.00 1,489.20 0.03 30 2,866 2,991 3,115
Average estimate (CI 95%): $56.74/patient 5,674,000.00 1,489.20 0.03 30 10,635 11,098 11,560
High-end estimate (CI 95%): $104.46/patient 10,446,000.00 1,489.20 0.03 30 19,580 20,431 21,283
BBH: community health 100,000.00 1,489.20 0.03 30 187 196 204

63Economics of Non-Communicable Diseases in India
Table F4: Varying the Discount Rate
Programme costs, in 2013 dollars
2013 India per-capita
GDP, at 2012
exchange rate
Time period, in years
Desired ROI
No. of DALYs averted required, at 0.01 discount
rate
No. of DALYs averted required, at 0.03 discount
rate
No. of DALYs averted required, at 0.05 discount
rate
NPCDCS 4,100,000,000.00 1,489.20 30 0.15 4,267,464 7,685,027 13,683,829
NPCDCS – Karnataka only 372,737.00 1,489.20 30 0.15 388 699 1,244
15% voluntary dietary salt reduction 33,400.00 1,489.20 30 0.15 35 63 111
Health Systems Strengthening Project, Tamil Nadu
Cervical cancer screening 363,051.00 1,489.20 30 0.15 378 681 1,212
Hypertension screening 359,980.00 1,489.20 30 0.15 375 675 1,201
HPV vaccination
70% coverage at $10/dose 17,389,500.30 1,489.20 30 0.15 18,100 32,595 58,038
70% coverage at $25/dose 144,912,502.50 1,489.20 30 0.15 150,831 271,624 483,648
70% coverage at $50/dose 365,179,506.30 1,489.20 30 0.15 380,095 684,491 1,218,794
Tobacco taxation: increased rate on cigarettes and bidis 72,480.00 1,489.20 30 0.15 75 136 242
Tobacco regulation (Gujarat): public smoking ban
Partial ban64,038.00 1,489.20 30 0.15 67 120 214
Complete ban4,390,733.00 1,489.20 30 0.15 4,570 8,230 14,654
MYTRI 210,878.00 1,489.20 30 0.15 219 395 704
Kidney Help Trust of Chennai 7,836.00 1,489.20 30 0.15 8 15 26
IDPP
LSM 25,300.00 1,489.20 30 0.15 26 47 84
Metformin 24,700.00 1,489.20 30 0.15 26 46 82
LSM + metformin 30,300.00 1,489.20 30 0.15 32 57 101
MANAS 1,796.00 1,489.20 30 0.15 2 3 6
Best buys for CVD: four-drug regimen for primary and secondary treatment
Low-end estimate (CI 95%): $15.29/patient 1,529,000.00 1,489.20 30 0.15 1,591 2,866 5,103
Average estimate (CI 95%): $56.74/patient 5,674,000.00 1,489.20 30 0.15 5,906 10,635 18,937
High-end estimate (CI 95%): $104.46/patient 10,446,000.00 1,489.20 30 0.15 10,873 19,580 34,864
BBH: community health 100,000.00 1,489.20 30 0.15 104 187 334

64 Economics of Non-Communicable Diseases in India
Report Preparation
This report’s preparation was led by:
David E. Bloom, Clarence James Gamble Professor of Economics and Demography, Harvard School of Public HealthElizabeth T. Cafiero-Fonseca, Global Health Research Analyst, Department of Global Health and Population, Harvard School of Public Health Vanessa Candeias, Associate Director, Healthy Living, World Economic Forum Eva Jané-Llopis, Head, Chronic Disease and Well-being, World Economic Forum
The study team included:
Eli Adashi, Professor of Medical Science, Former Dean of Medicine and Biological Sciences, The Warren Alpert School of Medicine, Brown UniversityLakshmi Reddy Bloom, Founder and Director, Data for DecisionsLauren Gurfein, Candidate, PhD in Social Welfare, University of PennsylvaniaAlyssa E. Shiraishi Lubet, Research Assistant, Harvard School of Public Health Elizabeth Mitgang, Research Assistant, Harvard School of Public HealthJennifer C. O’Brien, LASI Project Manager (fmr) Harvard School of Public Health Akshar Saxena, Candidate, SD in Global Health and Population, Harvard School of Public Health
The study team thanks the following individuals and organizations for their contribution:
Asha Abikar, Karnataka State Health DepartmentMonika Arora, Public Health Foundation of IndiaSudarshan Ballal, Manipal HospitalsNayanjeet Chaudhury, Population Services InternationalStéphanie Cristin, World Economic ForumR.S. Deshpande, Institute for Social and Economic Change A.B. Dey, All India Institute of Medical Sciences Andrea Feigl-Ding, Harvard School of Public HealthAtreyi Ganguli, India Country Office, World Health OrganizationRenu Garg, World Health Organization-South-East Asia Regional OfficeK. Gayithri, Institute for Social and Economic ChangeK.S. James, Institute for Social and Economic Change Pradeep Joshi, India Country Office, World Health Organization
Amrita Kansal, India Country Office, World Health Organization Theadora Swift Koller, India Country Office, World Health Organization Anand Krishnan, Centre for Community Medicine, All India Institute of Medical SciencesB.N. Dhanya Kumar, Director, Karnataka State Health DepartmentKishori Mahat, World Health Organization-South-East Asia Regional OfficeNandu Madhava, mDhil Health Info ServicesPritpal Marjara, Population Services International M. Naggeswara Rao, Institute for Social and Economic ChangeNeha Raykar, Public Health Foundation of India K. Srinath Reddy, Public Health Foundation of IndiaK.M. Sathyanarayana, United Nations Population Fund Benjamin Seligman, Stanford University School of Medicine Manasi Sharma, Centre for Mental Health, Population Health Foundation of IndiaMona Sharma Rana, Centre for Mental Health, Population Health Foundation of IndiaDevi Shetty, Narayana HrudayalayaAnika Singh, India Country Office, World Health OrganizationHarsimran Singh, Fortis HealthcareDhirendra Sinha, World Health Organization-South-East Asia Regional Office Glorian Sorensen, Dana-Farber Cancer InstituteK. Srinivasan, Institute for Social and Economic Change Sukumar Vellakkal, Public Health Foundation of IndiaR.T. Venkatesh, Karnataka State Health Department
Institute for Social and Economic ChangeKarnataka State Health Department Narayana HrudayalayaPopulation Services International (India)Public Health Foundation of India/Centre for Mental HealthUnited Nations Population Fund
The study team thanks the Harvard-based advisory group for providing expertise:
Peter Berman, Professor of the Practice of Global Health Systems and Economics, Harvard School of Public HealthAmitabh Chandra, Professor of Public Policy, Harvard Kennedy SchoolGoodarz Danaei, Assistant Professor of Global Health, Harvard School of Public HealthTarun Khanna, Director, Harvard South Asia Initiative; Jorge

65Economics of Non-Communicable Diseases in India
Paulo Lemann Professor, Harvard Business SchoolJennifer Leaning, Director, FXB Center for Health and Human Rights, Harvard School of Public HealthRamnath Subbaraman, Research Fellow, Massachusetts General HospitalS.V.Subramanian, Professor of Population Health and Geography, Harvard School of Public Health
The study team thanks the following advisory group convened by the World Economic Forum for their numerous contributions to the project, including reviewing the manuscript, attending meetings, and providing data and references:
Raquel Cabo, Manager, Global Health Economics, GE Healthcare Dan Chisholm, Health systems adviser, Department of Mental Health and Substance Abuse, World Health Organization Sarah Delea, Director, External Affairs – Health & Wellness, Mondelez International Andreas Fibig, President and Chairman of the Board of Management, BayerManoj Gopalakrishna, Becton, Dickinson and Company Anne Heughan, Director, External Affairs, UnileverAjit Jha, Director, Corporate Affairs and Communication, SABMiller IndiaDenise Kruzikas, Director, Health Economics, Healthymagination, GE Healthcare Ramanan Laxminarayan, Vice-President, Research and Policy, Public Health Foundation of IndiaJeff May, Vice-President, Global Public Policy, MerckRachel Nugent, Department of Global Health, University of Washington Daljit Singh, President, Fortis Healthcare Katia Skarbek, Faculty of Health Sciences, Department of Health Economics and Social Security, Jagiellonian UniversityKristin Wolfe, Vice-President, Global Industry Affairs, SABMiller
The views expressed in this publication are those of the authors alone. These views do not necessarily represent the decisions, policy or views of the World Economic Forum or the Harvard School of Public Health.
66 Economics of Non-Communicable Diseases in India
Endnotes
1 High systolic BP is classified as 140 millimetres of mercury (mmHg) or above, while high diastolic BP is defined as 90 mmHg or above. The American Heart Association calls systolic blood pressure “a major risk factor for cardiovascular disease for people over 50 years old”. 2 The material in this section draws heavily from Bloom et al. 2013 (see for further detail). 3 For more information on alternative approaches, including cost of illness and value of a statistical life, see Bloom et al., 2011. 4 Some businesses – especially those in the health sector – may perceive profit-making opportunities in NCDs, from the sale of pharmaceuticals and medical devices to increasing occupancy rates in hospitals and long-term care facilities. Some businesses may also find ways to sharpen their image by identifying with concerns over NCDs in the communities where they operate.5 The surveys generated responses from the following number of Indian business executives, by year: 103 (2010), 250 (2011), 122 (2012) and 85 (2013). For comparison, the number of Chinese business executives responding to the surveys were: 362 (2010), 372 (2011), 371 (2012) and 364 (2013). Some Indian and Chinese respondents did not answer all survey questions.6 “Somewhat serious to serious” impact included responses of 1 or 2 on a scale ranging from 1 (= a serious impact) to 7 (= no impact at all). 7 Table percentages based on the non-missing responses to each question only; sample sizes referred to in the subsequent endnotes reflect the entire sample of respondents in India and China. 8 n=103. 9 n=250.10 n=122.11 n=85.12 n=362.13 n=372.14 n=371.15 n=364.16 “Moderate” includes responses of 1 through 5 on a scale ranging from 1 (= a serious impact) to 7 (= no impact at all). 17 The percentages in Tables 5 and 6 are not appreciably different when companies whose main activity is “pharmaceuticals, biotechnology and medical devices” or “health services” are excluded from the calculations. 18 The policy/programme questions changed between the 2010 and 2011 EOS and for the 2012 EOS. Nevertheless, the 2012 EOS data for India suggest that company health policies and programmes are met with a high level of employee engagement, participation and compliance. 19 In China, by contrast, policies and programmes that provide incentives for exercise and that involve prevention, screening and support for physical health problems are the most prevalent, followed by smoke-free workplaces and policies that focus on mental health and deter the use of alcohol. 20 Similarly for China, the largest gaps between establishment and implementation are for policies related to exercise and mental health.20 Figure as of March 2013. 21 A more complete description of this project can be found at: http://www.tnhsp.org/files/Cervical%20Cancer.pdf.22 Patients may have sought treatment outside of the project. 23 In 2008 dollars.24 Brown et al. (2012) demonstrate in further cost-effectiveness calculations that by excluding student time costs, the projected figures stand to improve. The cost per QALY added due to smoking aversion would be $2,492, and the cost per life year added due to smoking aversion would be $3,912. 25 Values in 2013 dollars, adjusted for inflation from dollar amounts in original paper.26 See Appendix F for sensitivity analyses using alternative DALY valuations, discount rates, desired ROI and time frames.
27 All programme costs converted from Indian rupees or US dollars from year of programme documentation to 2013 dollars. Historical currency exchange rates obtained through OANDA’s historical exchange rates (http://www.oanda.com/currency/historical-rates/, accessed November 2013). Pre-2013 dollars adjusted for inflation using the CPI inflation calculator of the US Department of Labor’s Bureau of Labor Statistics (http://www.bls.gov/data/inflation_calculator.htm, accessed November 2013).28 Anticipated costs for the 12th Five Year Plan (2012-2017) for scaling up the programme on a national level over a five-year period. Source: PIB (2010). 29 Costs for one year; introduction of programme to five districts in Karnataka state. Personal communication from R.T. Venkatesh, State Nodal Officer for NCDs, Directorate of Health and Family Welfare Services. 30 WHO (2011b). Cost is for 1 million people for one year and assumes 95% coverage. Costs reported in 2005 rupees, converted to 2013 dollars.31 Ray & Varghese (2010). All programme costs, both recurring and nonrecurring (e.g. start-up), in 2008 rupees converted to 2013 dollars. 32 Goldie et al. (2008). Total estimated cumulative costs for a seven-year vaccine roll-out programme, beginning with about 17% coverage of eligible girls and peaking at a rate of 70% coverage. Costs reported in 2008 dollars, converted to 2013 dollars.33 Though Jha et al. (2011) assume that tax implementation will have negative net costs because it will increase revenue, estimates from Patel et al. (2011) are used for purposes of this analysis. Costs refer to the estimated annual cost per 1 million people; DALYs refer to the benefit per 1 million people. 34 Donaldson et al. (2011).35 Brown et al. (2012).36 Mani (2005). Costs in 2006 dollars based on programme costs of $0.25/participant per year, multiplied by 46,500 participants and converted to 2013 dollars.37 Ramachandran et al. (2007), reported in 2007 dollars on a per-patient basis and converted to 2013 dollars. Per-patient costs multiplied by 100 in order to scale costs and the required DALYs to a level comparable with other interventions.38 Data from Buttorff et al. (2012), reported in 2009 dollars and converted to 2013 dollars. Costs represent those that are additional, over and above existing “regular” care in public facilities (costs and patient numbers for private facilities not included in calculations because researchers found no statistically significant effect between programme and existing services). 39 Lim et al. (2007); 2005 dollars converted to 2013 dollars. Cost estimations based on microsimulation model of 100,000 hypothetical individuals. Figures are for “high risk” patients aged 40-79 who have non-fatal coronary heart disease or are at risk of having a cerebrovascular event. Cost range based on data from 23 low- and middle-income countries.40 Cafiero (2013). This is also the estimated cost for current rates of taxation, so no additional cost is incurred in this model. 41 * p<0.1; ** p<0.05; *** p<0.01.42 * p<0.1; ** p<0.05; *** p<0.01.43 The questionnaire asked: “Do you currently smoke, chew or sniff tobacco, or have you quit?”44 * p<0.1; ** p<0.05; *** p<0.01.45 WHO PEN refers to the “package of essential noncommunicable (PEN) disease interventions for primary healthcare in low-resource settings”. For more information on PEN, see: http://www.who.int/cardiovascular_diseases/publications/pen2010/en/. 46 The operational guidelines indicate that health promotion should be a major activity; however, information on promotion activities carried out is not available. 47 Or QALYs gained.


World Economic Forum91–93 route de la CapiteCH-1223 Cologny/GenevaSwitzerland
Tel.: +41 (0) 22 869 1212Fax: +41 (0) 22 786 2744
The World Economic Forum is an international institution committed to improving the state of the world through public-private cooperation in the spirit of global citizenship. It engages with business, political, academic and other leaders of society to shape global, regional and industry agendas. Incorporated as a not-for-profit foundation in 1971 and headquartered in Geneva, Switzerland, the Forum is independent, impartial and not tied to any interests. It cooperates closely with all leading international organizations.