economics of pollution prevention: how waste reduction …infohouse.p2ric.org/ref/27/26808.pdf ·...
TRANSCRIPT

Economics of Pollution Prevention= How Wmte Reduction Pays
Charles Rooney
Although most people usually think of waste as a problematic environmen- tal Lssue, tfviewed in a positive light, waste is the biggest opportunity manufacturers have to increase profits. Eliminat- fng waste can improve product quality and the envlronment, but that is secondary to the money a company can save. This article shows how to measure thefinancial damage waste causes and explores methods that companies can use tofind and eliminate the causes of manufacturing waste.
EVERYONE THINKS OF waste aa an environmental issue. That’s natural, but mistaken. Everyone also thinks it is a problem. That too is a natural mistake. Waste is a huge economic issue. It is also the biggest opportunity North American manufacturers have ever had to in- crease their profits. By eliminating waste, any company will improve the quality of its products and the environment, but that is secondary to the enormous amount of money the company will make.
The top industrial managers are beginning to recognize this. On June 11, 1991, The Wall Street Journal ran a front page article, “Chemical Firms Find that it Pays to Reduce Pollution at Source.”The article discusses the savings that DOW, Du Pont, and Monsanto have made by cutting waste.
The Du Pont case makes the critical points. To quote: “Du Pont engineers argued that reducing the pollution would be too expensive. But when they took a second look last year, they found just the opposite was true. By adjusting the production process to use less of one raw material, they were able to slash the plant’s waste by two- thirds. Yields went up and costs went down. The savings: $1 million a year . . . . Edgar Woolard, Du Pont’s chairman and chief executive officer, says the company now even sees waste reduction as a way to achieve a competitive advantage.”
This article shows how to apply the lesson these managers have learned: Waste reduction pays. It demonstrates first that waste is a huge cost in most businesses. Then it presents good evidence that waste is not an inevitable cost of doing business. Any company can increase profits quickly and permanently by cutting waste. Third, it introduces a simple methodology for measuring the economic damage waste causes. Finally, the article deals with ways to find and elimi- nate the causes of waste in manufacturing processes.
- The Cost of Waste
industrial company. All one has to do is add up four elements: It is simple, in principle, to calculate how much waste costs an
Dr. Charles Riwney is president of Orr & Boss, a manufacturing consulting firm located in Plymouth, Michigan, that has specialized for twenty-five years in helping companies increase profits by implementing effective pollution prevention and con- tinuous improvement programs.
Pollution Prevention Review /Summer 1993 261
Charles Rooneu ~~
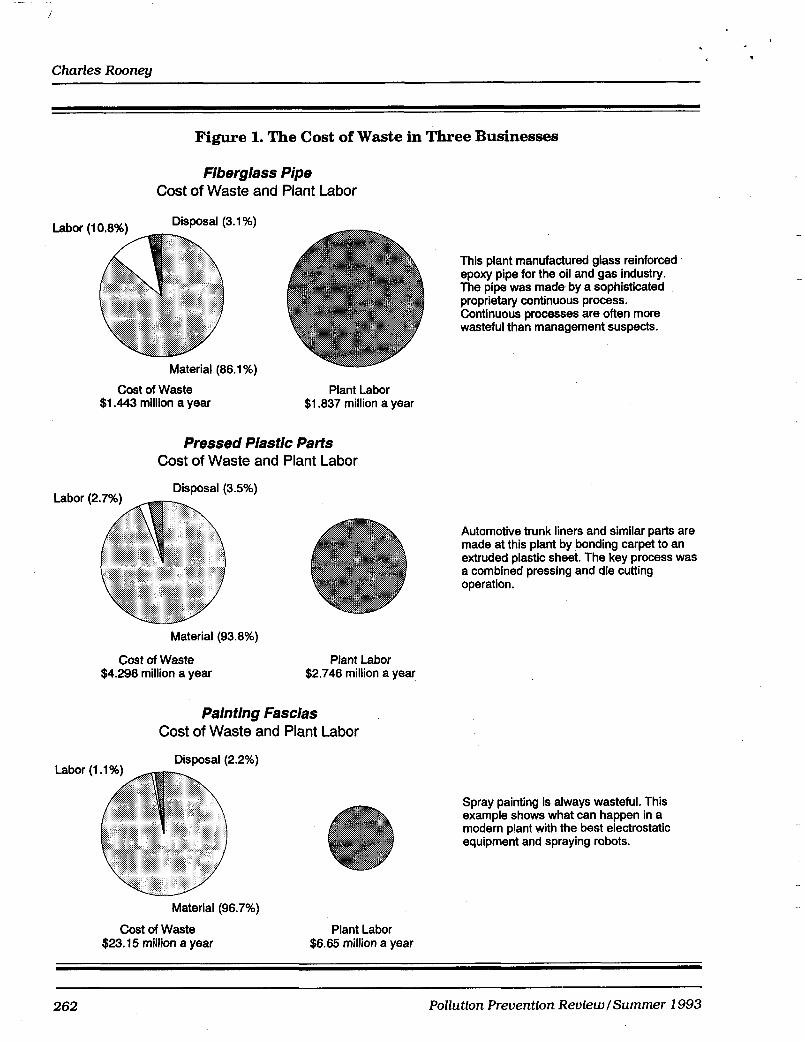
Figure 1. The Cost of Waste in Three Businesses
Fiberglass Pipe Cost of Waste and Plant Labor
Cost of Waste $1.443 million a year
Plant Labor $1.837 million a year
Pressed Plastic Parts Cost of Waste and Plant Labor
Material (93.8%)
Cost of Waste $4.296 million a year
This plant manufactured glass reinforced epoxy pipe for the oil and gas industry. The pipe was made by a sophisticated proprietary continuous process. Continuous processes are often more wasteful than management suspects.
Automotive trunk liners and similar parts are made at this plant by bonding carpet to an extruded plastic sheet. The key process was a combined pressing and die cutting operation.
Plant Labor $2.746 million a year
Painting Fascias Cost of Waste and Plant Labor
Spray painting is always wasteful. This example shows what can happen in a modern plant with the best electrostatic equipment and spraying robots.
Material (96.7%)
Cost of Waste Plant Labor $23.15 million a year $6.65 million a year
~ ~~ ~
262 Pollution Prevention Review/ Summer 1993
Economics of Pollution Prevention: How Waste Reduction Pays
Nobody buys material just to throw It away. By the time it becomes waste, the facto y will have worked on it. Thus, all waste contains labor. The value of that labor is also Isst, as is the labor used to rework unsalable product.
Raw material First, there is the cost of the raw material in the waste. Manufac-
turers buy the raw material in every piece of scrap or gallon of effluent. They intend to use it to make salable product. When the raw material becomes waste, the manufacturer loses the material's value.
Labor Nobody buys material just to throw it away. By the time it becomes
waste, the factory will have worked on it. Thus, all waste contains labor. The value of that labor is also lost, as is the labor used to rework unsalable product.
Disposal Disposal charges are clearly an expense that springs from waste.
In most companies they are the only element of waste-related expense that is recognized explicitly. As landfills close, garbage disposal costs mount. When the waste is legally hazardous, the disposal charges are exorbitant.
Waste handling This figure has two elements. First, the plant will use labor to
collect and store its rubbish. It may also process its garbage, for example, by compacting solids, or distilling liquids. The expense of running these operations is a result of making waste. Secondly, disposal is tightly regulated. It imposes a costly administrative burden. This is particularly true when hazardous chemicals are involved,
Figure 1 shows the result of combining these four elements into a cost of waste (analogous to the cost of quality) for three different businesses. Disposal and internal waste-handling charges are com- bined in all three cases.
Figure 1 leads inevitably to two conclusions. First, waste is expensive. It costs more than direct labor in most manufacturing operations. The excess expense caused by waste is very seldom less than half the direct labor cost. It is often several times as large. That means that if waste can be reduced (i.e., if it is not an inevitable cost of doing business), it is the biggest opportunity to increase profits in most North American plants.
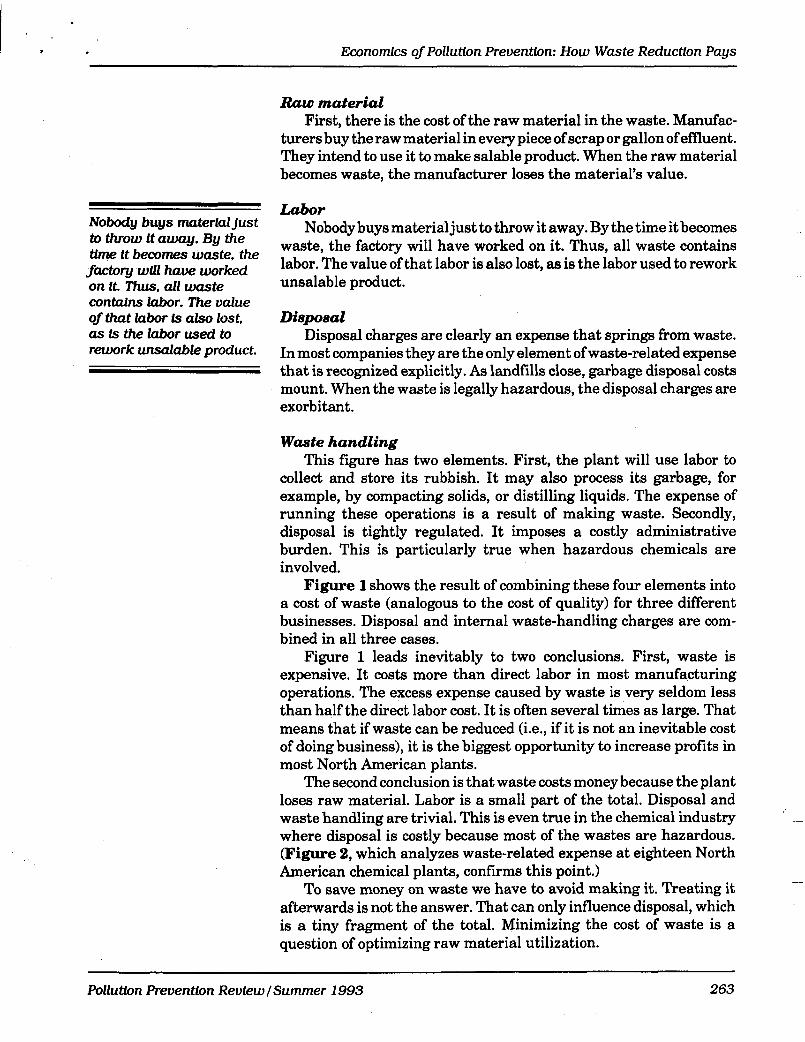
The second conclusion is that waste costs money because the plant loses raw material. Labor is a small part of the total. Disposal and waste handling are trivial. This is even true in the chemical industry where disposal is costly because most of the wastes are hazardous. (Figure 2, which analyzes waste-related expense at eighteen North American chemical plants, confirms this point.)
To save money on waste we have to avoid making it. Treating it afterwards is not the answer. That can only influence disposal, which is a tiny fragment of the total. Minimizing the cost of waste is a question of optimizing raw material utilization.
Pollution Prevention Reuiew /Summer 1993 263
Charles Rooney
Figure 2. Analysis of Waste-Related Expenses at 18 Chemical Plants
Material
That lesson is also important for the environment. There are no good ways of disposing of waste, only bad or worse ones. The slogan “Reduce, Reuse, Recycle” recognizes that environmental truth. To recognize the economic truth, the slogan should be “Reduce, Reduce, Reduce.”
Competing through Pollution Prevention In the past, many managers regarded waste as a cost of doing
business. They felt it was inevitable, or uncontrollable. Sometimes, like the Du Pont engineers, they argued that reducing the pollution would be too expensive.
The truth is exactly the opposite. The right process changes reduce material losses quickly and permanently. These changes are not normally expensive. They do not usually require significant capital investment. What they require is a change in attitude. That change is a return to looking at the facts of the business on the factory floor.
The North American automotive OEM coatings industry provides striking quantitative support for this argument. It is a good example because the industry is so homogeneous. The main players are three major chemical companies: Du Pont, PPG, and BASF. Each of the three has several plants. All the plants use essentially the same production processes and equipment. They buy from the same suppli- ers and sell to the same customers. Yet Figure 3 shows there is a startling difference in waste costs among plants. The lowest-waste
264 Pollution Prevention Review 1 Summer 1 993

Economics of Pollution Prevention: How Waste Reduction Pays
Figure 3. Automotive OEM Coatings- Cost of Waste in Dollars Per Gallon of Good Production
2.80
2.40
2.00
1.60
1.20
0.80
0.40
0.00
BEST IN INDUSTRY HIGHEST CLASS AVERAGE FIGURE
plant spends $1.60 less on waste per gallon of product sold than the worst plant. This difference is within a few cents of the industry average for labor cost per gallon. That must be considered a signifi- cant competitive cost advantage.
Calculating What Waste Costs Table lshows the way most accounting systems divide up the cost
of waste: (1) the value of the raw material in the waste, (2) the labor loss, (3) disposal charges, and (4) internal cost of waste handling. Our aim is to provide a quick way of calculating what waste actually costs a company. The methodology uses figures available from nearly all standard costing systems to calculate an overall cost of waste. This cost of waste is analogous to the cost of quality defined by Armand Feigenbaum, but simpler. It is designed to be a sober, conservative measure of the hard costs of wasting material. It is possible to determine the cost of waste in a typical plant in two or three days.
Valuing explicit and implied losses The only part of the calculation that poses any difficulty is deriv-
ing the value of the part of the raw material losses that is built into the standard costs of the products. It is critical to get that number right, because it usually represents the largest component of the cost of waste. Nearly all the other figures-the variances, write-offs,
Pollution Prevention Review I Summer 1993 265

Charles Rooney
Table 1. Cost of Waste
Components of Cost of Waste Form in Standard Costing System
Material losses Material loss allowances in standards, explicit and implied
Material usage variances
Scrap, obsolescence, rework, and other special loss accounts in the central ledger
Labor losses Labor in scrapped, reworked, or otherwise discarded product
Disposal charges Payments to outside disposal contractors from GL
Waste handling expense Normally must be estimated from the number of staff em- ployed in waste handling and reporting, using conservative wage and salary rates
labor, and disposal charges-are available directly from the cost accounting department. Thus, this article deals only with ways of valuing explicit and implied standard loss factors.
Virtually every costing system builds material loss allowances into product costs. (During twenty-five years of pollution prevention practice in eleven countries, we have only encountered one that did not.) These allowances are designed to reflect the historical level of material waste generated by manufacturing the company’s products. Budgets and prices should be based on standards that include these allowances in order to reflect current reality. The fact that the losses are built into the standard, however, does not mean they are inevi- table. If accountingbudgets to use six pounds of raw material to make five pounds of product, the plant is budgeting to waste one pound. That pound is waste whether it is built into the standards or reported as a variance. Unfortunately, if it is built into the standard, it will become invisible to management, as though it cost nothing.
Most costing systems use explicit and implied cost allowances. loss allowances are stated directly on product cost sheets.
ames like manufacturing loss allowance, process loss, factor, or scrap factor. For the most part, they are ex-
pressed as a percentage of the raw material actually used to make the product. When a product goes through several manufacturing steps (e.g., molding, trimming, painting, and finishing), the standard cost will often introduce explicit loss allowances at each step.
loss allowances are not stated the form of a standard cost that
the product has more parts in it or weighs more than it
Pollution Preoention Reoiewl Summer 1993

Economics of Pollution Preuentlon: How Waste Reduction Pays
Table 2. Illustration of Explicit and Implied Standard Losses
ExtFact f k m Standard Cost ofXXXXRear Panel Showing Explicit Loss Factor
Input plastic blank weight Manufacturing loss allowance (2%) Total standard plastic usage Parts per blank Standard plastic usage per part Explicit standard loss allowance per part
Comparison with Actual Weight of Part at Dimensional Standud
calctclation of Implied Loss Allowance
4.86 lbs 0.10 lb 4.96 lbs 2
2.48 lbs 0.05 lb
. Actual weight of plastic in a part at standard thickness, width and length Total difference between standard usage and actual part weight - total standard loss allowance Part stated explicitly on cost sheet - the explicit allowance The remainder - the implied loss allowance Percentage implied loss for this particular part
1.15 lbs
1.33 lbs 0.05 lb 1.28 lbs 51.6 %
t actuially does. Implied losses can only be determined by weighing or
us (e.g., costing three bolts into an be more difficult to detect. For
on, the standard costings allowed 2.1 pounds of material per piece. The finished castings, after being ground to standard size, weighed just under one pound. The addi- tional waste built into the standard was sent to a landfill as grinding dust or reject parts.
Table 2 shows how the costing system at the automotive trunk liner plant, mentioned in Figure 1, applies explicit and implied loss allowances. Following this example, it becomes apparent how much the cost of waste is hidden by current accounting practices.
The top half of Table 2 shows how the accountants arrive at a standard usage of 2.48 pounds per plastic part. They have done so by weighing the blanks fed into the press and allowing a 2 percent, or .05 pound explicit loss allowance per part for defects or damage. As shown in the bottom half of the table, however, the actual weight of the
mparing reality with the costing.
Pollution Preuentlon Reuiew /Summer 1993 267

Charles Rooney
Table 3. Elements of the Cost of Waste in the Trunk Liner Plant
Element $OOO/Year $OOO/Year
Material Losses built into standards 4,026
Material content of scrap 198 Inventory loss 261
Material usage variance (gain) (455)
Total material losses
Labor Labor in scrap
Total labor
Waste Handlinv and Disposal Internal waste handling labor Disposal
Total waste handling and disposal
Total Cost of Waste
4,030
117 117
43 106
149
4,296
plastic in the part is only 1.15 pounds. The rest of the plastic, 1.28 pounds per part (51.6 percent of the material input) is lost as edge trim or offal. This implied loss is built into the standard cost and will not show up in any financial reports. Thus, in most companies, the accountants themselves will be unaware of these losses.
To calculate the total value of the material losses built into the standards, it is necessary to multiply the total value of raw material throughput by the weighted average standard loss allowance percent- ages. In the trunk liner factory, all the parts had a 2 percent explicit loss allowance. Implied loss varied from part to part: The highest was 63.6 percent and the lowest was 28 percent. On average the standards contained an implied loss allowance of 43.7 percent. Thus, the total standard loss allowance for an average part was 45.7 percent of the material input. Put another way, by performing at that standard, the plant was wasting 45.7 percent of material input.
Table 3 shows the total cost of waste for the trunk liner plant. Material losses built into standard costs account for 93.7 percent of the total cost of waste, or $4.026 million out of a total of $4.296 million ayear. This standard loss does not appear in routine financial reports on plant performance. Thus, normal accounting reports underesti- mate the opportunity to increase profits through pollution prevention by a factor of fifteen.
-
-
268 Pollutfon Preuentfon RevfewlSummer 1993
Economfcs of Pollution Preventfon: How Waste Reductfon Pays
00000000000000
Figure 4. Physical Material Losses
I t OUTPUTS
EVAPORATION
STACK LOSSES
I1 UNDER I d , OVER DELIVERY 0 0 0 0 00 0 0 WEIGHT
t A I t t *
OVER SPECIFICATION t + HANDLING +
LOSSES CLEANING PROCESS SCRAP, REJECT LOSSES LOSSES AND SAMPLES
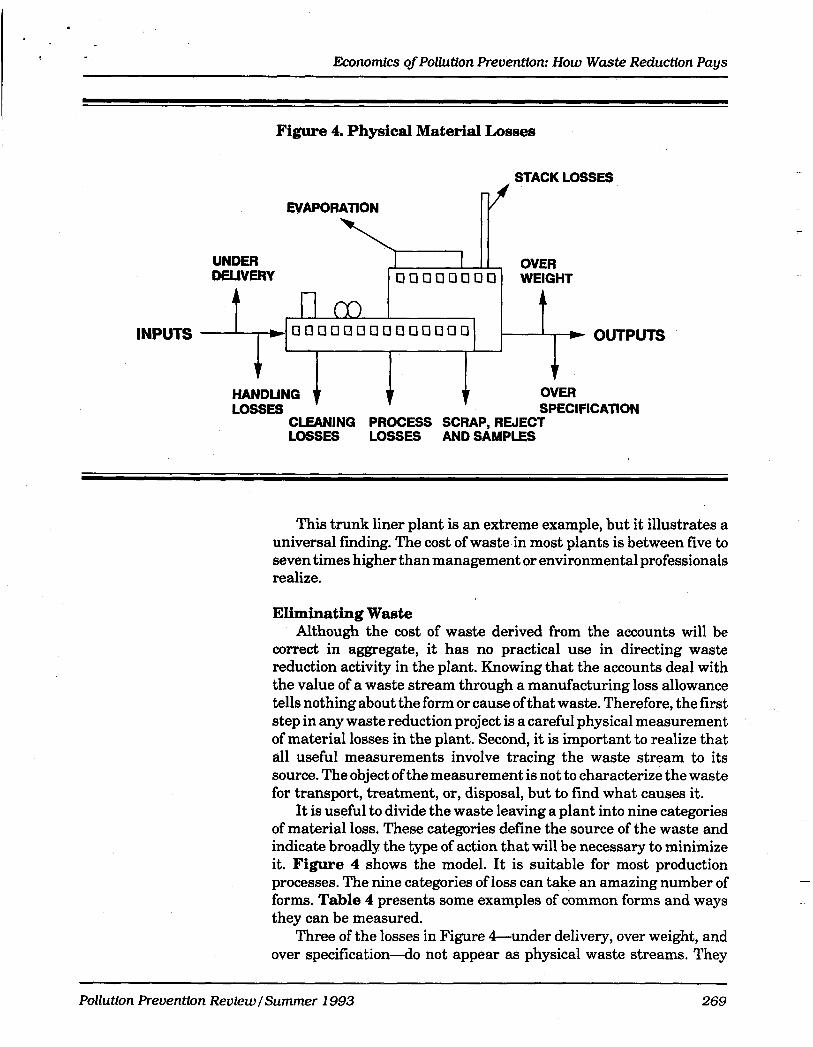
This trunk liner plant is an extreme example, but it illustrates a universal finding. The cost of waste in most plants is between five to seven times higher than management or environmental professionals realize.
Eliminating Waste Although the cost of waste derived from the accounts will be
correct in aggregate, it has no practical use in directing waste reduction activity in the plant. Knowing that the accounts deal with the value of a waste stream through a manufacturing loss allowance tells nothing about the form or cause ofthat waste. Therefore, the first step in any waste reduction project is a careful physical measurement of material losses in the plant. Second, it is important to realize that all useful measurements involve tracing the waste stream to its source. The object of the measurement is not to characterize the waste for transport, treatment, or, disposal, but to find what causes it.
It is useful to divide the waste leaving a plant into nine categories of material loss. These categories define the source of the waste and indicate broadly the type of action that will be necessary to minimize it. Figure 4 shows the model. It is suitable for most production processes. The nine categories of loss can take an amazing number of forms. Table 4 presents some examples of common forms and ways they can be measured.
Three of the losses in Figure A u n d e r delivery, over weight, and over specification-do not appear as physical waste streams. They
~ ~ ~~ ~~~
Pollutfon Preuentlon Review /Summer 1993 269

Table 4. Nine Categories of Material Loss
Category of Loss Examples of Loss Examples of Measurement
Under Delivery Short weight in containers, tankers, or rail cars
Weigh samples of high usage value materials.
Weigh tank trucks in and out of plant using certified scale, close to the plant, under plant supervision.
Inspect rail cars to see if they are completely empty.
Higher than standard water or solvent content in solutions or emulsions
Take samples and have solids content measured.
For milk or other food ingredients measure fat content as this is oRen the expensive component of the mixture.
Handling Losses Burst or cut bags
Material left in bags or drums
Timed inspection of raw material storage to determine rate at which containers are damaged.
Shake, scrape, or wash out containers emptied in production. Weigh the empty containers to find the loss by difference.
Damaged product Set up temporary quarantine areas and segregate any product damaged badly enough to require repair or to be scrapped.
Observe the start of production and collect or measure the start up loss. Process Losses Set up pieces
Chips machined off parts Weigh blanks, raw castings or forgings, then weigh the finished parts. Find the loss by difference.
Sanding dust Weigh the dust from a known number of parts or time of production.
off cuts, edge trim, offal
Product left in mixing vessels, mills, tanks
Weigh blanks, or sheets or rolls of raw material input. Then weigh the parts, and if possible offal as a check.
Scrape or wash out the equipment. Calculate the loss from the weight of product left after each use, and the number of uses a year.
It is unusual to find good records of process losses. They must usually be observed on the fadory floor. These observations may sometimes be cross checked in process industries against yield records, or hazardous waste reports.
Cleaning Losses Solvent, resin or detergents used to clean equipment aRer production
It is unusual to find good records of cleaning losses. They must usually be observed on the factory floor. These observations may sometimes be cross checked in chemi- cal plants using hazardous waste reports.
I I

Customer returns
Rework
seconds
Obsolescence
Samples
The accountiDg or plant production records for the five loeeea usually give fairly accurate quantities. They will not normally give good idormation on the cause of the loss. That may be available by correlating QG/QA records with produc- tion records for the same period.
Sampling loss can be estimated from the size and frequency of QC/QA sampling. Often there is only verbal evidence of this.
Evaporation Unexplained solvent loss Evaporation is hard to measure and much smaller than usually thought. The great majority of unexplained solvent loss is unauthorized use for cleaning. True evapora- tion can be found by mass balance or by vapor content and air velocity measure- ments. The mass balance is more reliable.
-~ ~
Stack Losses Dust in bag houses Weigh the dust collected over a sufficiently long period ( several weeks ), express as a percentage of production passing through the affected pieces of equipment.
Over Weight Excess weight in packets Weigh containers, packets, parts, candy bars, or other product in the finished, @ warehouse. Weighing in the packing or filling area will change the operators’ behavior and invalidate the results.
Excess volume in containers
Individual pieces weigh more than standard Analyze SPC charta or other product weight records.
Over Specification Excess of expensive component in product This is a difficult loss to measure. It is always product specific. It can only be estimated by physical or chemical andpis of actual production.
Weigh centers entering ember and weigh completed bars. Calculate ratio and cost difference from standard center and chocolate cost.
Candy bar with higher than standard chocolate to center ratio
Paint with higher than formula pigment content
Compare standard and actual solids content or specific gravity.
Excess vinyl thickness on wallmering stock
Weigh reels before and after coating.
I 1

Charles Rooney
Thejlrst question for every waste stream must be “How can this source of waste be reduced or eliminated?”
are, however, included in the definition of waste for two reasons. First, they are losses of material value from the process. They cost money, even if they do not end up in a landfill. In addition, because they are losses of value, they are automatically included in any calculation of the cost of waste. It is useful to be able to reconcile the waste measurements from the plant with the accounting figures. That reconciliation provides a check on the accuracy of both figures.
Once the causes of a waste steam are known, the next stage is to ask five questions about it:
1.
2.
3.
4. 5.
How can the production process be changed to reduce the amount of the waste that it generates? How can the waste be reused in the same product without loss of value? How can this waste stream be reprocessed internally into another product? Can another company use or recycle the waste? How will the plant control the generation of this waste in future?
The paragraphs below illustrate each of the questions with actual examples.
Reduce The first question for every waste stream must be “How can this
source of waste be reduced or eliminated?” Reducing waste saves the most money because the company never loses the material value of the waste stream; it remains in the product. The plant never has to expend labor to handle the waste. Finally, reducing waste increases capacity.
For example, in the fiberglass pipe plant (see Figure l), machine start-up caused half of the scrap. To address this problem, a series of process changes were made. They included heating the curing ovens before start-up; double crewing and starting half the machines at a time; and following a specific, detailed start-up procedure. These changes cut start-up scrap from 700 feet per machine to 25 feet. The time to reach full output dropped from 8 hours to 2 hours.
This exercise in source reduction also reduced labor cost per foot of good product, increased output, and saved $450,000 a year in scrap. There was no capital investment.
Reuse Sometimes it is impractical to reduce the volume or value of a
waste stream. Then the question becomes “How can this waste be reused as raw material in the product that created it?” This is less desirable than reducing the waste generated, only because reuse will involve double handling.
A very good illustration of reuse comes from automotive OEM
2 72 Pollution Prevention ReviewISummer 1993
d
Economics of Pollution Prevention: How Waste Reduction Pays
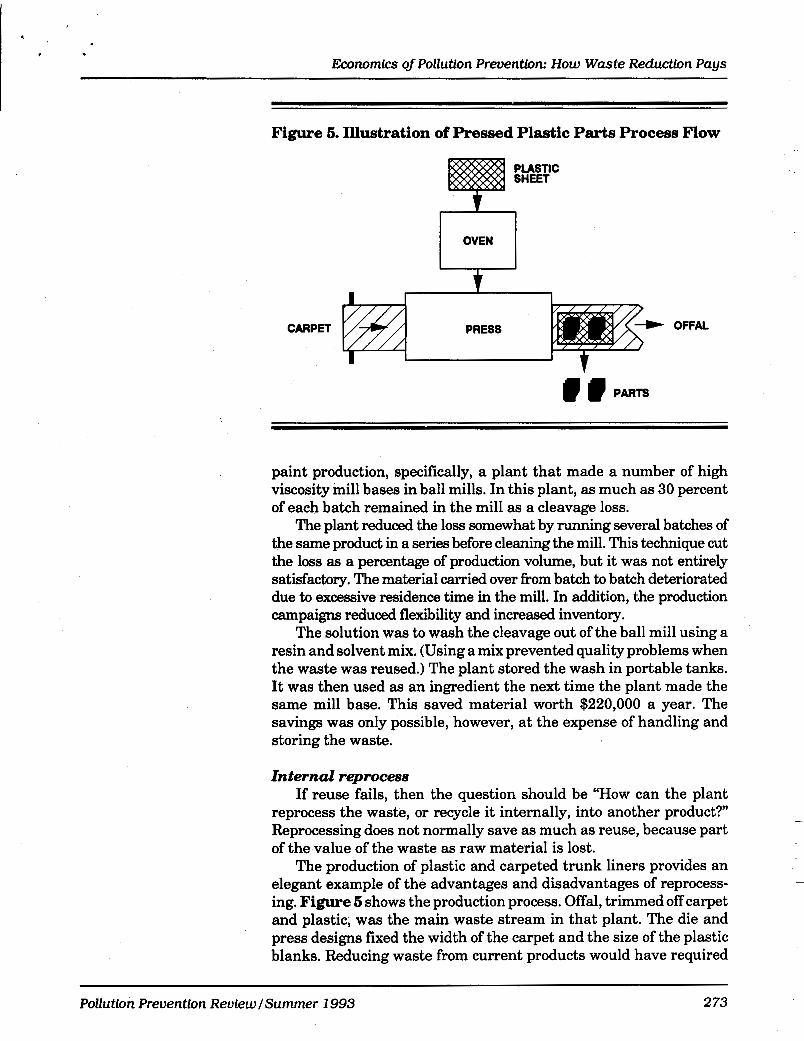
Figure 6. Illustration of Pressed Plastic Parts Process Flow
PLASTIC SHEET
CARPET PRESS OFFAL
I I t I
I I
paint production, specifically, a plant that made a number of high viscosity mill bases in ball mills. In this plant, as much as 30 percent of each batch remained in the mill as a cleavage loss.
The plant reduced the loss somewhat by running several batches of the same product in a series before cleaning the mill. This technique cut the loss as a percentage of production volume, but it was not entirely satisfactory. The material carried over from batch to batch deteriorated due to excessive residence time in the mill. In addition, the production campaigns reduced flexibility and increased inventory.
The solution was to wash the cleavage out of the ball mill using a resin and solvent mix. (Using a mix prevented quality problems when the waste was reused.) The plant stored the wash in portable tanks. It was then used as an ingredient the next time the plant made the same mill base. This saved material worth $220,000 a year. The savings was only possible, however, at the expense of handling and storing the waste.
Internal reprocess If reuse fails, then the question should be “HOW can the plant
reprocess the waste, or recycle it internally, into another product?” Reprocessing does not normally save as much as reuse, because part of the value of the waste as raw material is lost.
The production of plastic and carpeted trunk liners provides an elegant example of the advantages and disadvantages of reprocess- ing. Figure 6 shows the production process. Offal, trimmed off carpet and plastic, was the main waste stream in that plant. The die and press designs fixed the width of the carpet and the size of the plastic blanks. Reducing waste from current products would have required
Pollution Prevention Review /Summer 1993 2 73
Charles Rooney
prohibitive capital investment, Similarly, there was no way to reuse odd-sized off cuts.
The solution was to regrind the offal. This produced raw material for new plastic blanks. This recovered the value of the plastic, but the carpet was lost. It also required investment in grinders and a regrind handling system. The net saving was approximately $1.1 million a year out of a waste stream valued at $3.85 million a year. Clearly, reprocessing was better than throwing the offal away, but fell far short of the savings available from avoiding the waste.
Many industries reprocess their waste. The classic examples come from candy and paint. Coffee Crisp and Mars Chocolate bars both incorporate reworked product in their centers. Paint makers produce primers that contain scrap topcoat, still bottom sludge, or dirty wash water. In every case, the reprocessed material goes into a cheaper product or component of a product.
External recycle When the waste cannot be reprocessed in the plant, selling or true
recycling are the only options. This may involve paying another firm to convert the waste to a form that your plant can use. It may mean selling or even giving the waste to another company that can use it. Typically, recycling recovers only a small fraction of the value of the raw material in the waste.
Redistilling waste cleaning solvent is a good example of recycling. Chemical and coating companies generate dirty solvent when clean- ing production equipment. In an industrial coatings company, this mix of solvent and paint will have a material value close to $2.20 a gallon. Typically, solvent reclamation will recover mixed solvent with a yield of 70 percent. The recovered solvent can be used for cleaning and will replace solvent costing $1.25 a gallon. Thus, each gallon of waste will generate solvent worth $0.88. Distillation charges, freight, and disposal of the still bottoms will cost between $0.80 and $1.03 a gallon of waste processed. Thus, the value of the recovered solvent comes close to netting out with the cost of recycling. That is better than paying to have the solvent burnt in a cement kiln, which typically costs between $0.28 and $0.57 a gallon. It falls far short, however, of the possible savings from reduction or reuse.
Control The last step of the waste The last step of the waste reduction process is to introduce
controls. Without simple, timely control reports, waste soon returns to its original level.
The cost of waste has three defects as a control measure. First, it is a financial figure. Operators and supervisors find physical figures
reductfonprocess is to fntroduce controls. Wfthout sfmple. tfmely control reports, waste soon r e h m to orlalml leuel.
I
relating to the pounds, gallons, or pieces they handle more meaning- ful. Second, it is not timely. It can be estimated each month, but the figure is only accurate just after physical inventory. Factory floor waste control needs daily and weekly numbers. Finally, it is not
2 74 Pollutfon Preuentfon Revfewl Summer 1993
Economics of Pollution Prevention: How Waste Reduction Pays
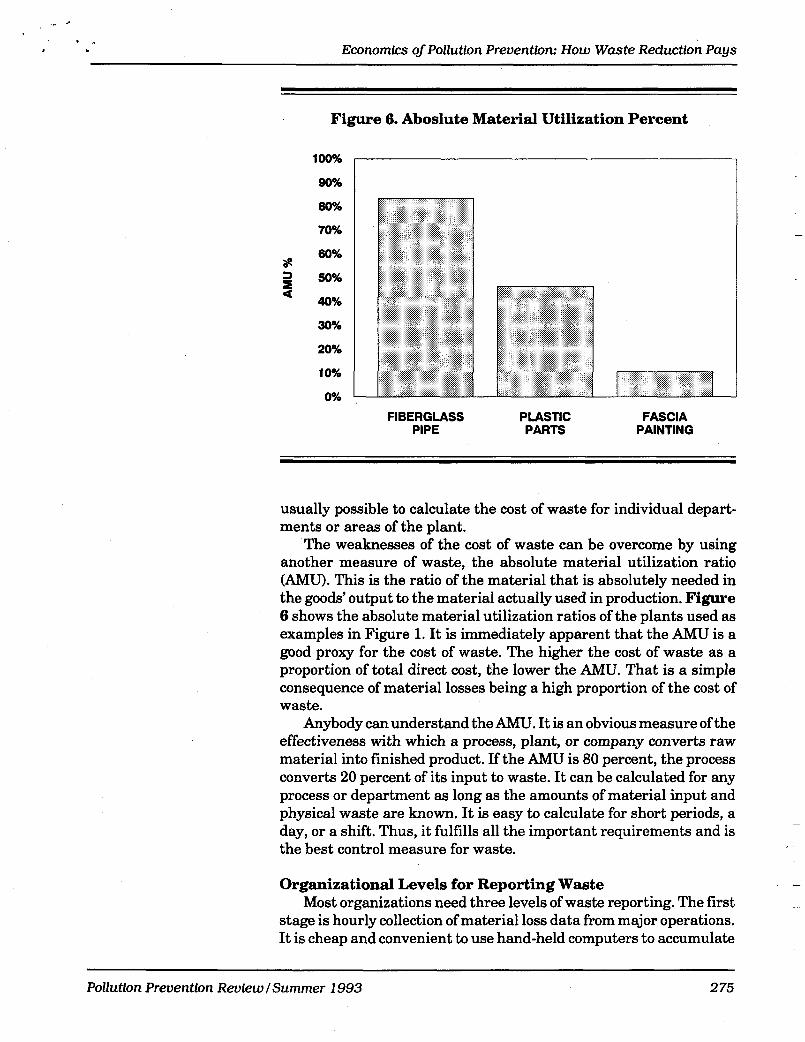
Figure 6. Aboslute Material Utilization Percent
100%
90%
80%
70%
60% 8 a 50% s a 40%
30%
20%
10%
0%
FIBERGLASS PLASTIC FASCIA PIPE PARTS PAINTING
usually possible to calculate the cost of waste for individual depart- ments or areas of the plant.
The weaknesses of the cost of waste can be overcome by using another measure of waste, the absolute material utilization ratio (AMU). This is the ratio of the material that is absolutely needed in the goods’ output to the material actually used in production. Figure 6 shows the absolute material utilization ratios of the plants used as examples in Figure 1. It is immediately apparent that the AMU is a good proxy for the cost of waste. The higher the cost of waste as a proportion of total direct cost, the lower the AMU. That is a simple consequence of material losses being a high proportion of the cost of waste.
Anybody can understand the AMU. It is an obvious measure of the effectiveness with which a process, plant, or company converts raw material into finished product. If the AMU is 80 percent, the process converts 20 percent of its input to waste. It can be calculated for any process or department as long as the amounts of material input and physical waste are known. It is easy to calculate for short periods, a day, or a shift. Thus, it fulfills all the important requirements and is the best control measure for waste.
Organizational Levels for Reporting Waste Most organizations need three levels of waste reporting. The first
stage is hourly collection of material loss data from major operations. It is cheap and convenient to use hand-held computers to accumulate
Pollution Prevention Review /Summer 1993 2 75

Charles Rooney r 7 , 4 , .
the data and produce the reports. The first line of control is plotting waste levels or yields on statistical process control charts. The purpose of the charts is to trigger immediate investigation and corrective action. They are used primarily by line operators.
The second level is daily yield and quality reporting by depart- ment or production process. These reports will also contain weekly or monthly figures. They are aimed at departmental management and supervisors who use them to identify targets for improvement.
The third level of reporting is a series of monthly summaries of the lower-level reports by department, consolidated to a plant-level report. These should be reconciled quarterly with the actual waste shipments leaving the plant and the waste levels implied by the accounts. This level of reporting helps manufacturing management to track progress, and decide on the level of resources to allocate for pollution prevention.
Following the six steps-reduce, reuse, internal recycle and repro- cess, external recycle, control, and reporting-starting with the largest waste streams, should allow companies to cut the cost ofwaste by 30 percent within a year. Continuing for another two years will save another 20 percent of the original figure. With the right controls and attitudes, waste will continue to decrease in subsequent years.
The Economic Impact of Pollution Prevention North America leads the world in per capita production of gar-
bage. The continental cost of waste has never been measured, but it is possible to estimate its order of magnitude. Waste costs more than labor in most manufacturing operations. National statistics show that U.S. manufacturing has 18.2 million hourly paid employees. Their average hourly wage is over $12. Simple multiplication sug- gests a cost of waste in the $400 billion a year range. Active pollution prevention can halve that, saving every North American $800 a year, and at the same time, improve the environment.
The first step in cutting North America’s continental cost of waste is absorbing three concepts stressed in this article. First, waste destroys profits. This is true for any manufacturer in any industry. Second, it can be reduced cheaply, quickly, and permanently. It is not an inevitable cost of doing business. Third, to save money on waste, we have to avoid making it. Treatingit is not the answer, economically or environmentally. Minimizing the cost of waste is a question of optimizing raw material utilization.
Eliminating industrial pollution will be slow. It will have to be tackled process by process and plant by plant. One of the best ways for any manufacturer to start is to devote a few days to measuring the cost of waste in one plant. The result will be a surprisingly large opportunity to improve profits. The next step is physical waste measurement. Then the hard work starts. Take each waste stream, study its source, and “Reduce, Reduce, Reduce.” 4
Mfnfmizfng the cost of waste Is a questfon of optfmfzfng raw materfal utflfzatfon.
276 Pollution Preuentfon Review I Summer 1993