economics of production and value addition … · economics of production and value addition to...
TRANSCRIPT

ECONOMICS OF PRODUCTION AND VALUE ADDITION TO VETIVER IN COASTAL KARNATAKA
Thesis submitted to the University of Agricultural Sciences, Dharwad
in partial fulfillment of the requirements for the Degree of
MASTER OF SCIENCE (AGRICULTURE)
In
AGRICULTURAL ECONOMICS
By
SUNIL H. R.
DEPARTMENT OF AGRICULTURAL ECONOMICS COLLEGE OF AGRICULTURE, DHARWAD
UNIVERSITY OF AGRICULTURAL SCIENCES, DHARWAD – 580 005
JUNE, 2010

ADVISORY COMMITTEE
DHARWAD (M.G. KERUTAGI) JUNE, 2010 MAJOR ADVISOR Approved by : Chairman : __________________________ (M.G. KERUTAGI) Members : 1.________________________ (H. BASAVARAJ) 2. _______________________ (K.N. KATTIMANI) 3. _______________________ (M.T. DODAMANI) 4. _______________________ (K.V. ASHALATHA)

CONTENTS
Sl. No. Chapter Particulars
CERTIFICATE
ACKNOWLEDGEMENT
LIST OF TABLES
LIST OF FIGURES
LIST OF PLATES
1. INTRODUCTION
2. REVIEW OF LITERATURE
2.1 Cost and returns in medicinal and aromatic crops
2.2 The resource use efficiency in medicinal and aromatic crops
2.3 Cost and returns in the value addition of medicinal and aromatic crops
2.4 Constraints in production and processing of medicinal and aromatic crops
3. METHODOLOGY
3.1 Description of the study area
3.2 Description of the vetiver crop
3.3 Sampling design
3.4 Analytical tools and techniques
3.5 Definition of terms and concepts used
4. RESULTS
4.1 Socio-economic characteristics of the farmers
4.2 Cost and returns in vetiver roots production
4.3 Resource use efficiency in vetiver root production
4.4 Cost and returns structure of vetiver roots processing units
4.5 Constraints faced by of vetiver growers and processors
5. DISCUSSION
5.1 Socio-economic characteristics of the farmers
5.2 Costs and returns structure in vetiver roots production
5.3 Resource use efficiency in vetiver roots production
5.4 Cost and returns structure of vetiver roots processing units
5.5 Constraints faced by vetiver growers and processors
6. SUMMARY AND POLICY IMPLICATIONS
REFERENCES

LIST OF TABLES
Table No.
Title
3.1 Demographic profile of study area
3.2 Land use pattern in selected taluk and district
3.3 Area and production of vetiver roots in different districts of Karnataka in 2004-2005
3.4 Distribution of sample farmers
4.1 General characteristics of the sample farmers
4.2 Land holding pattern of respondents in the study area
4.3 Per acre pattern of employment in vetiver roots production
4.4 Per acre inputs utilization pattern in vetiver roots production
4.5 Per acre cost structure in vetiver roots production
4.6 Per acre returns structure in vetiver roots production
4.7 Cobb- Douglas production function estimates in vetiver roots production
4.8 Allocative efficiency of vetiver roots production
4.9 Investment pattern in medium scale vetiver root processing unit
4.10 Cash flow analysis in medium scale vetiver roots processing unit (Rs. in Lakhs)
4.11 Cost structure in vetiver roots processing unit (Medium scale)
4.12 Returns structure of vetiver roots processing unit (Medium scale)
4.13 Financial feasibility of investment in vetiver roots processing unit (medium scale)
4.14 Investment pattern in small scale vetiver roots processing units
4.15 Cash flow analysis in small scale vetiver roots processing units
4.16 Cost structure of vetiver roots processing units (small scale)
4.17 Returns structure of vetiver roots processing units (small scale)
4.18 Financial feasibility of investment in vetiver roots processing units (small scale)
4.19 Constraints faced by the farmers in production of vetiver roots
4.20 Constraints faced by the farmers in marketing of vetiver roots
4.21 Constraints faced by the processors

LIST OF FIGURES
Figure No.
Title
1. Map of karnataka showing showing the study district and taluk
2. Per acre cost structure in vetiver roots production
3. Per acre returns structure in vetiver roots production
4. Cost structure in vetiver roots processing unit (Medium scale)
5. Returns structure of vetiver roots processing unit (Medium scale)
6. Cost structure of vetiver roots processing units (small scale)
7. Returns structure of vetiver roots processing units (small scale)

LIST OF PLATES
Plate No.
Title
1. Vetiver crop stand
2. Economic part of crop
3. Medium scale vetiver processing unit
4. Small scale vetiver processing unit
1. INTRODUCTION
Aromatic plants are the plants which contain essential oil in them. These essential oils are volatile oils as they are often found in different species of plants which are known to be very complex in their chemical nature. The characteristic flavour and aroma that they impart are basically advantageous in attracting insects and other animals which play a key role in pollination or disperse of seeds and fruits. However, the aroma in these essential oils is being exploited largely in perfumery, cosmetic and pharmaceutical industries. India has a perfumery tradition that dates back to over 5000 years to Indus valley civilization. In the excavations of Harappa and Mohanjodaro, a “water distillation still” and “receiver” have been recorded whose shape resemble the “deg” and “bhaka” currently used by “attars”(traditional perfumers) of Kannauj in India.
Bucchbauer Gerhard (1990) has recorded examples of several aromatic plants presently in use for medication which have come to us from our ancestors inhabiting different countries. Thus, aniseoil, citronella, vetiver, eucalyptus, spruce oil and aroma chemicals like camphor, menthol, cineol thymol and guacacol are still act as both aromatic and additives. In addition to the aromatic oils, the finer perfumes contain fixative substances which are less volatile than the oils which delay evaporation. There are several aromatic species which are utilized for this purpose. Vetiver is one among them.
In India, most of the medicinal and aromatic plants including crude drugs (roots, stems, leaves, flowers, seeds, fruit, whole plants etc.) are handled by the traditional herbal crude drugs dealers commonly known as "Pansaris" in the North and "Pachamarunna Kado" in the south, who sell crude drugs under Ayurvedic, Unani or local names. Aromatic chemicals and oils are widely used in food, flavour, perfumery and cosmetic industries. In the past few years, there has been a tremendous increase in the number of drugs derived from various sources mainly because of the due recognition of medicinal and aromatic plants the world over, coupled with the basic realization that drugs and essential oils derived from plants are much safer to use and are easily available at a price affordable by common man with least side effects as compared to synthetics.
India is endowed with a unique wealth of biota which includes a large number of medicinal and aromatic plants. Many of these plants are rare, endemic and found only in wild sources. The population explosion coupled with improved standard of living lead to ruthless exploitation, resulting in the imminent danger of extinction of these plants. Most of these wild medicinal and aromatic plants are highly habitual specific, found only in forests and occupying highly specialized ecological niche with restricted distribution.
Medicinal and aromatic plants constitute the basis of primary health care for a majority of population and are a critical source of income for many rural people particularly for nearby forest areas. This is more true in case of developing countries, as people are dependent on traditional systems of medicine which are culturally appropriate, technologically simple, economically affordable and generally effective systems with little or no side effects. WTO driven trade policies and immense muscle power enjoyed by the multinational drug companies and are driving the modern medicines beyond the reach of a large segment of population. There are about seven lakh registered and trained practioners of the traditional systems of medicine which accounts for about seven doctors per every 10,000 population-almost the same as that of the modern system in India.
Vetiver [Vetiveria zizanoides (Linn.)] Nash reported that vetiver is having several vernacular names such as Usirah, Vira and Sugandhaimulah in Sanskrit, Khus-khus in Hindi,vetiveru and lavancha in Kannada, Vettiveru in Telugu, Illamichamber in Tamil and vetiver in English
Vetiver is indigenous to India, Pakistan, Bangladesh, Sri Lanka and Malaysia. Major vetiver producing countries are Haiti, Indonesia, India, China, Guatemala and Brazil. World production of vetiver essential oil is around 250-300 tonnes/annum. Haiti and Indonesia account for 80 per cent of total vetiver oil production in the world.
Vetiver is a major aromatic plant grown exclusively for extraction of aromatic oil from the roots. Root is the most economical part of plant. Vetiver roots contain fragrant oil

considered as one of the finest aromatic oil. Aroma chemicals such as vetiverol, vetivorone and vettiveryl acetate are prepared from this volatile oil.
Vetiver oil is extracted through hydro or steam distillation. Vetiver oil is a light to dark brown, olive, or amber viscous oil and is having a deep smoky, earthy- woody odour with a sweet persistent undertone. Vetiver oil has a powerful smell but is very pleasant when diluted. It is high grade fixative and blends well with sandal wood, lavender, patchouli and rose oil. It is high-priced oil and is used extensively in fine perfumery and cosmetic products. In dilute state, it smells like sandalwood oil. It is used exclusively in the preparation of compound perfumes in which the oil on account of its low volatility is normally used as a base to fix other high-value volatile oil like rose, lavender and jasmine oil.
Vetiver oil has been utilized as a major raw material in various fragrant products (cosmetics, perfumes, deodorants, lotions and soaps). It is used to flavor sherbet and as food preservatives. In addition, vetiver oil plays an important role in aromatherapy. The main action of vetiver oil is on the nervous system and has both sedating and strengthening effect. It is excellent in the treatment of depression, nervous tension, debility, insomnia and many stress-related diseases, and also acts as an aphrodisiac where there is a clear connection between impotence or frigidity and stress.
It stimulates the circulatory system and makes useful massage oil for elderly or debilitated people with poor circulation. It helps to stimulate the production of red blood cells and is thus beneficial for anemia. It makes a useful warming and pain-relieving rubbing oil, suitable for deep massage of muscular aches and pains, sprains, stiffness, rheumatism and arthritis. It may be massaged into muscles before and after sports. Vetiver root is also having effects like cooling, bitter, alextive, stomachic, calmative astringent and stimulates immune system.
Vetiver oil is helpful during emotional stressful times and has been used as tonic for women suffering post-menstruation syndrome and also used in snake bite, cancer and microbial infections. Vetiver roots is one of the main ingredients of an ayurvedic medicine successfully redress childlessness of women due to disorders of the uterus (Sastry, 1998).
Vetiver oil is known to have repelling effect on insects. People in India and elsewhere place vetiver roots among their clothes to keep insects away. It also repels flies and cockroaches thus make a useful ingredient in insect repellents and highly effective repellent against termite. It decreases termite tunneling activity and used as a novel termicide with reduced environmental impact.
Plant has fibrous roots and is useful in both soil and water conservation. It helps in maintaining soil moisture, absorbs toxic substances in chemical fertilizer/pesticides and improves physical characteristics of soil. Dry roots are used for making mats, screens, pillows, baskets, incense sticks and sachet bags. Roots after extraction are used as raw material for making cardboard, paper etc. Young leaves are used as fodder and dry leaves are used for thatching as well as for making brooms. Leaves made into pulp are suitable for making straw boards. Above ground portion is used in various ways such as making paper, mats, ropes, hats and baskets. Vetiver is the most efficient barrier to reduce soil erosion and protects loss of organic matter and water.
In India, the commercial cultivation of vetiver is in the states of Rajasthan, Uttar Pradesh, Karnataka, Tamilnadu, Kerala and Andhra Pradesh. It is also grown as wild crop in Punjab, Uttar Pradesh and Assam. About 20-25 tonnes oil is produced in India annually which is much below it’s demand. Uttar Pradesh produces the highest quantity of oil mainly from wild plants. Vetiver oil produced from Northern India is the best and costliest in the world.
Though, the major global demand is met by Indonesia and Haiti, the quality of oil produced is inferior due to iron contamination besides poor and crude extraction and processing ability. On the contrary, most of the distilled oil in India is processed in quality stainless steel vessel which makes the oil superior and high coloured. The opinion of perfumers worldwide substantiate that the Indian vetiver oil has an excellent odour profile and free from iron contamination making it acceptable even for fine fragrance manufacturing. In the new era of globalization and quality competitiveness, India has an edge over others for vetiver oil market with focused programmes for promoting cultivation of this plant.

Importance of the study
Commercial cultivation of vetiver is recent origin in the states of Karnataka, Kerala, Tamilnadu, Andhra Pradesh, Utter Pradesh and Rajasthan. Commercial cultivation of vetiver has been increasing in Karnataka. Again in coastal Karnataka the area is spreading faster than ever before. Udupi district has major area under vetiver crop in Karnataka. Presently, out of 93 ha of vetiver area in Karnataka, Udupi district accounts for 88 ha of vetiver with the production of 250 tons of vetiver roots. Coastal Karnataka is blessed with diverse agro-climatic conditions that provides optimum growing condition for vetiver. Warm and humid places with heavy rain fall are preferred.
Herbal sector is identified as one of the five identified areas for having huge potential to make India as super power. Domestic herbal market is estimated at Rs. 400 crores and global market size is estimated at US $ 60 billion and is projected to reach US $ 5 trillion by 2050. India’s share in the world export of essential oils and perfumery materials merely accounts for 0.40 per cent. Even if one per cent share is increase, the magnitude of global export market prospectus would grow from the present Rs.9.7 billion to Rs.24 billion. In addition domestic market has been growing at seven per cent/annum.
India produces 20 to 25 tonnes oil annually but there is huge demand for vetiver oil. Inspite of farmers’ enthusiasm to cultivate vetiver, there is scarcity of genuine planting material at reasonable price. Lack of market information and inability to increase the yield potentiality due to lack of advanced technology are a few major constraints to mention. Therefore there is a need to reorient the production and value addition of vetiver roots into oil. And also not much research has been done on economic aspects of vetiver roots production and processing. Hence, a comprehensive study on production and value addition of vetiver has become imperative. Therefore, the study was undertaken with the following specific objectives.
1. To estimate the cost and returns in vetiver roots production in study area.
2. To study the resource use efficiency in vetiver roots production.
3. To examine cost and returns structure in the value addition of vetiver roots into oil, and
4. To identify the constraints in production and processing of vetiver.
Hypotheses
1. Vetiver production and processing is profitable.
2. Resources in vetiver cultivation are optimally used.
3. Many problems are faced in production and value addition of vetiver.
Limitations of study
The area, production and value addition of vetiver not been documented by any institutions/government. Thus, the data on production and estimated requirement do suffer from lack of authentic statistical information. Since, the data was collected by survey method, the inherent lacunae associated with this type of enquiry have crept into the study, even though the estimates were provided by the memory recall on account of the non-maintenance and reliable information. As for as possible by cross questioning the degree of discrepancy if any, would be negligible as the estimates presented are in averages. It may however, be recognized that the findings of the study need not be generalized beyond the boundaries of the area under investigation and applicable to such other areas having similar agro- climatic and socio- economic conditions.
Presentation of the study
The entire study has been presented in six chapters. In the initial introductory chapter, described the importance of vetiver and its contribution the objectives of the study have been defined. Chapter II that deals with the review of relevant research efforts based on the objectives of the present study. Chapter III describes the main features of the study area, the sampling design, the source of data, the method of collection of data, description of crop

and statistical tools and techniques adopted. Chapter IV is devoted to the presentation of results through a variety of tables and graphs into which relevant data have been compressed. Major findings of the study have been presented. Chapter V concentrates on the discussion of results of the study. The study has been summarized and presented along with their policy implications in chapter VI.

2. REVIEW OF LITERATURE
This chapter reviews the research work done in the fields related to the objectives of study. There are hardly few comprehensive studies made on economics of production and processing of vetiver. Since vetiver is an aromatic crop to have better understanding about new crop and to maintain the tempo of production and value addition of vetiver roots into oil in the long run. A few studies conducted on production and processing medicinal and aromatic crops and some horticulture crops, in general aromatic crops in particular have been reviewed and presented under the fallowing sub-heads.
2.1. Cost and returns in medicinal and aromatic crops
2.2 Resource use efficiency in medicinal and aromatic crops
2.3. Cost and returns in the value addition of medicinal and aromatic crops
2.4. Constraints in production and processing of medicinal and aromatic crops.
2.1 Cost and returns in medicinal and aromatic crops
Ravishankar (1993) estimated the average cost of cultivation & net returns of Davana (Artemisia pallens) was Rs 8,145 & Rs 6,090 per acre respectively. The net returns per rupee of total cost were found to be Rs 0.74 while the same per rupee of variable cost Rs1.07.
Farooqi and Vasundhara (1997) studied the cost of cultivation of medicinal plants like ashwagandha, coleus, long pepper (as inter crop in coconut garden) and periwinkle. They found that the cost of cultivation and the net returns per acre for ashwagandha were Rs. 2,267 and Rs. 9,878 respectively followed by coleus (Rs. 2,631 and Rs. 29,757), long pepper (Rs. 36,599 and Rs. 86,477) and periwinkle (Rs. 3,846 and Rs 16,396).
Suneetha (1998) studied the cost of cultivation of medicinal crops in Kerala. The cost of cultivation of plumbago, kaempferia, aloe, ocimum and long pepper as inter crops in coconut garden were estimated using partial budgeting technique. These medicinal crops provided additional returns of Rs. 30,340 per acre per annum. The additional cost involved in cultivation was Rs. 25,091 per acre for all the above mentioned crops.
Jarial (1999) estimated the total expenditure in the cultivation of safed musli was Rs. 2,95,000 and total income was Rs. 6,30,000 per acre. He also estimated that the total cost of cultivation per acre of senna was Rs. 3,700 and income from the sale of leaves was Rs. 15,000.Net income observed during the first year was Rs. 11,300 and it was Rs. 13,300 during the subsequent years.
Vasudeva (1999) observed that the total cost of cultivation of periwinkle per hectare was Rs. 15,000 and the returns from leaves stem and root were Rs. 30,000, Rs. 3000 and Rs. 30,000 respectively. The net profit was Rs. 54,000.
Farooqi et al. (2000) worked out the economics of rosemary cultivation at Bangalore and found that cost of establishments was Rs. 64,400 and the average cost of maintenances was Rs. 19,400 per ha per year. The study revealed that expenditure on planting material was (Rs. 50,000 per ha) and expenditure on distillation (Rs. 4000 per ha), fertilizer (Rs. 4000 per ha), plant protection (Rs. 3000 per ha) and harvesting (Rs. 2000 per ha) were the main items in the maintenance cost of rosemary cultivation.
Rajeswara Rao (2000) observed that the total cost of cultivation of geranium per ha per year was Rs. 25,000 and gross returns per ha per year were Rs. 80,000 and net returns per year per ha were Rs. 55,000.
Goswami (2000) observed that the cost of establishment of citronella was Rs. 2317.84 per acre and average cost of maintenance per ha was Rs. 8249.06, Rs. 7372.58, Rs. 8913.22 and Rs. 6285.29 in 1
st, 2
nd, 3
rd and 4
th years respectively. It was revealed from that
study that expenditure on human labour was the single largest item ((Rs. 4648.98, Rs. 5894.11, Rs. 5480.25 and Rs. 4820 for 1
st, 2
nd, 3
rd and 4
th year).Gross returns per ha in 1
st,
2nd
, 3rd
and 4th
year were Rs. 20,152.55, Rs. 33,759.58, Rs. 33,454.52 and Rs. 24,090.6 respectively

Farooqi et al. (2001) they had worked out the economics of palmarosa cultivation at Bangalore and found that the cost of establishment was Rs. 15,355 per ha and maintenance cost was Rs. 14,900 per ha per year. From this study, land preparation (Rs. 4000) was the main cost of the establishment, distillation and fertilizers were the main cost in maintenance cost of palmarosa cultivation. They also worked out the economics of geranium cultivation in Bangalore and found that the cost of establishment Rs. 87,000 per ha and average cost of maintenance was Rs. 16,500 per ha per year. They found that the average net returns were Rs. 83,500. It was revealed from the study that the cost of planting material (Rs. 75,000), harvesting (Rs. 2000) and distillation cost were the important items of expenditure. They worked out economics patchouli cultivation in Bangalore. They found that the establishment cost was Rs. 65,800 per ha and the average net returns was Rs. 78,800 per year. From their study, it was revealed that cost of planting material (Rs. 50,000) was the single major important cost in the establishment of the crop.
Jadhav et al. (2001) studied per acre cost of cultivation of isabgoal and patchouli was Rs. 3994.46 and Rs. 32,707.16 and per acre returns were Rs. 5172 and Rs. 1,01,211.40 respectively. The per acre returns of Patchouli was more than isabgoal. The benefits cost ratio was 1.26 and 2.00 for isabgoal and patchouli respectively.
Subrahmanyam and Gajanan (2001) reported that the growers of lemongross in Idukki district of Kerala realized Rs. 5,996 net returns per acre after meeting Rs. 24,017.50 towards the cost of cultivation including distillation.
Farooqi and Vasundhara (2001) estimated the cost of cultivation of ashwagandha per acre and found that the cost on FYM was Rs. 400 (2 tones) and cost on seeds was about Rs. 1000 (5.0 kgs). Net returns obtained per acre of ashwagandha were Rs. 9878 after meeting the cost of production (Rs. 2267).
Benerjee (2002) worked out the costs and returns of senna leaves in Tamil Nadu. The cost of cultivation per acre of senna leaves was Rs. 8000 and Rs. 6000 in irrigated and un irrigated area respectively and gross returns per acre were Rs. 12,080 and Rs. 9970 for irrigated and un irrigated area respectively. He was also estimated net returns per acre were Rs. 4080 and Rs. 3970 for irrigated and un irrigated area respectively.
Patra et al. (2003) worked out cost of cultivation of menthol mint per ha was Rs. 29,700 and Rs. 21,700 for sucker plants and transplanted menthal mint including cost of distillation Rs. 6000 for sucker planted and Rs. 4500 for transplanted. The study was revealed that cost of manures and fertilizer was highest for both sucker planted (Rs. 62,000) and transplanted (5500) and gross returns per ha of oil produced were Rs. 60,000 and Rs. 45,000 for suckers planted and transplanted respectively and net returns per ha were Rs. 30,300 and Rs. 23,240 for suckers planted and transplanted respectively.
Sundar and Kambai (2004) studied the economics of production of Gloriosa superb in Tamil Nadu with a sample size of 100 farmers. Cost of establishment was Rs. 63,423.134 and the average cost of maintenance was Rs. 17,956.64 per ha per year. Expenditure on manures and fertilizers (Rs. 7034.19) was the single largest items and total cost of cultivation per ha was Rs. 38,138.35 and gross returns and net returns per ha were Rs. 1,46,556.51 and Rs. 1,08,418 respectively.
Patra et al. (2004 a) worked out economics of vetiver cultivation. They found that cost of cultivation of vetiver per ha was Rs. 57,000 including distillation cost (Rs. 5000).The study revealed that preparation of land and planting was the largest item (Rs. 30,000). Gross returns and net returns were Rs. 1,13,000 and Rs. 56,000 respectively from vetiver oil production.
Patra et al. (2004 b) worked out economics of aswagandha. They found that cost of cultivation per ha was Rs. 5000. The study revealed that cost of preparation of land (Rs. 1200) and root digging and grading were the major items of cost of production.Gross returns and net returns were Rs. 27,500 and Rs. 22,500 respectively.
Patra et al. (2004 c) worked out cost of cultivation of kalmegh per ha was Rs. 10,900. Cost of seeds (Rs. 2500) and manures and fertilizer application (Rs. 2000) were the two major cost incurred in cultivation of kalmegh. Gross returns and net returns obtained were Rs. 36,000 and Rs. 25,100 respectively.

Patra et al. (2005) worked out economics of cultivation of palmorasa and they found that cost of cultivation for 1
st, 2
nd, 3
rd, 4
th and 5
th years were Rs. 36,700, Rs. 32,000, Rs.
34,000, Rs. 31,000 and Rs. 28,500 including cost of distillation and net returns per ha for 1st,
2nd
, 3rd
, 4th and 5
th years Rs. 38,300, Rs. 68,000, Rs. 91,000, Rs. 81,000 and Rs. 71,500
respectively.
Muniram et al. (2005) observed that cost of cultivation of java citronella per ha was Rs. 30,000 and gross returns and net returns were Rs. 75,000 and Rs. 45,000 respectively
Vinayak (2005) studied the economics of contract farming in ashwagandha cultivation in Northern Karnataka and found that the total cost of ashwagandha production per acre was Rs. 6896 and total income was Rs. 14,820. Cost of human labour found to be maximum (Rs. 1429) fallowed by cost on FYM transportation and application (Rs. 832), cost on seed (Rs. 484) and plant protection chemicals (Rs. 40).
Raghu (2006) studied the economics of production and marketing of patchouli in Northern Karnataka. He found that cost of establishment was Rs. 73,656.06 per ha, the average maintenance cost was Rs. 73,121.955 per ha per year. Gross returns and net returns were Rs. 61,720.81 and Rs. 15,939.17 respectively.
Mittal and Singh (2007) worked out economics of some important aromatic plants such as lemongross, citronella and patchouli. They found that average total cost of herbage cultivation per ha per year at 2003-2006 price were Rs. 40,400, Rs. 39,287 and Rs. 32,919 for lemongross, citronella and patchouli respectively and average total cost of oil production per ha per year were Rs. 57,230, Rs. 56,408, and Rs. 36,101 for lemongross, citronella and patchouli and average net returns per ha per year for herbage cultivation and oil production for lemongross, citronella and patchouli were Rs. 17,320 and Rs. 48,974, Rs. 608 and Rs. 45699, and Rs. 7296 and Rs. 25,821 respectively
Aijan et al. (2008) studied the economic analysis of cultivation and marketing of gloriosa in Tamil Nadu. They worked out cost of cultivation of gloriosa per ha per year was Rs. 2.38 lakhs. Gross returns and net returns per ha per year were Rs. 4 lakhs and Rs. 1.612 lakhs respectively. The study revealed that cost of cultivation in first year was very high (Rs. 6.68 lakhs) and was very low in fifth year (Rs. 0.72 lakh) and gross returns in first year were high (Rs. 6.69 lakhs) and last year was very low (Rs. 0.72 lakh) but net returns in first year were negative (Rs. - 0.69 lakh) and high on 2
nd year (Rs. 3.90 lakhs).
Dhiman Mukerjee (2008) they worked out cost of production of Swetia chirayita per ha was Rs. 34,290. Cost of seedling/planting (Rs. 5000) and cost of land rent were two major costs in production. Gross returns and net returns were Rs. 1,25,000 and Rs. 90,710 respectively with a B-C ratio of 3.64.
Powar and Hange (2008) studied the economics of production and marketing of selected medicinal and aromatic plants in western Maharashtra. They worked out cost of cultivation of safeda musli, pudina and citronella per ha was Rs. 2,28,634.32, Rs. 1,03,567.19 and Rs. 55,879.30 respectively. Further it was observed that cost of seed material was the single largest item of expenditure in safeda musli (Rs. 1,05,260) where as for pudina, it was on human labour (Rs. 30,288.54) and for citronella it was on amortization cost (Rs. 17,122.26). The net returns per ha of safeda musli, pudina and citronella were Rs. 35,013, Rs. 5349 and Rs. 6723 respectively. They also worked out the B-C ratio for safeda musli, pudina and citronella which were 1.15,1.05 and 1.12 respectively.
Deshpande et al. (2008) estimated economics of selected medicinal and aromatic crops in Karnataka, Madhya Pradesh, West Bengal, Uttarnchal and Kerala. Total cost of cultivation and gross returns of sweet flag per acre were Rs. 44,876.58 and Rs. 77,184 respectively and net returns over variable and total cost per acre were Rs. 37,026.2 and Rs. 32,308.4 respectively. Patchouli cost of cultivation and gross returns per acre were Rs 48,417.88 and Rs. 48,680 respectively and net returns over variable and total cost per acre was Rs. 3180.7 and Rs. 262.12 respectively. Isabgol cost of cultivation and gross returns per acre were Rs. 5975.8 and Rs. 10,688.26 respectively and net returns over variable and total cost per acre was Rs. 6510.64 and Rs. 4712.46 respectively. Total cost of cultivation and gross returns for ashwagandha per acre were Rs. 26,396.75 and Rs. 84,000 respectively and net returns over variable and total cost per acre were Rs. 60,495 and Rs. 57,603.3 respectively. Total cost of cultivation and gross returns for chandramuli per acre were Rs.

26,217 and Rs. 70,500 respectively and net returns over variable and total cost per acre were Rs. 47,343 and Rs. 45,093 respectively. Average total cost of cultivation and gross returns for jumbo faran per acre per year were Rs. 13,605 and Rs. 44,344 respectively and net returns over variable and total cost per acre per year were Rs. 30,738.4 and Rs. 30,738.4 respectively. Total cost of cultivation and gross returns for leadwort per acre were Rs. 1,55,350.13 and Rs. 4,61,700 respectively and net returns over variable and total cost per acre were Rs. 3,15,864.88 and Rs. 3,06,349.9 respectively. Total cost of cultivation and gross returns from lemon grass per acre were Rs. 14,412 and Rs. 11,149.8 respectively and net returns over variable and total cost per acre were Rs. -832.57 and Rs. -3262.93. This showed lemon grass cultivation in study area was not profitable.
Puran mal et al. (2009) studied the economic analysis of cultivation of safeda musli in Haryana and found that total cost of cultivation per acre of safeda musli was Rs. 1,82,152.30 of which total variable cost and fixed cost were Rs. 1,40,793.60 and Rs. 41,354.71 respectively. Cost on planting material was maximum (Rs. 1,01,101.30) fallowed by harvesting of crop (Rs. 15,236.84), inter-culture and hoeing (Rs. 7473) and chemical fertilizer (Rs. 6442.10). Gross returns and net returns per acre were Rs. 2,47,052 and Rs. 64,900 respectively. B: C ratio was 1.36.
Prodyut Bijoy Gogoi (2009) worked out cost of establishment of patchouli was Rs. 41,179.00 per ha, the average operation cost was Rs. 28,447.76 per ha per year and total cost per year per ha was Rs. 45,500.75. The average gross returns and net returns per ha per year were Rs. 1,23,421.33 and Rs. 77,920.58 respectively.
2.2 The resource use efficiency in medicinal and aromatic crops
Ravishankar (1993) studied the economics of production and processing of Davana in eastern zone of Karnataka. The regression co-efficients for FYM, Bullock labour and PPC were positive and statistically significant indicating significant influence on the yield. MVP: MFC ratio was found more than unity in land, seed, FYM, human labour, bullock labour and PPC implying wide scope for increasing the use of these variables. MVP: MFC ratio was negative for fertilizers these indicate that excessive usage.
Chandran et al. (2001) studied the resource use efficiency in pepper cultivation, the regression coefficient for human labour, manures and fertilizer, age of plants and value of plant protection chemicals were found to be statistically significant indicating significant influence on the yield. MVP/MFC ratio was found to be more than unity for variable human labour, manure and fertilizers, PPC implying wide scope for increasing the use of human labour, manure and fertilizers, PPC.
Verma (2002) employed Cobb-Douglas production function for evaluating resource use efficiency in onion. The marginal value product of seed, manures and fertilizer, human labour and machine power were (Rs. 0.15, Rs. 1.51, Rs. 0.69 Rs. 0.28) found to be positive on small farms while it had negative value on bullock labour, plant protection and irrigation (Rs. - 0.13, Rs. - 0.49, Rs. - 0.47) respectively. This implies that in case of small farms, seed, manures, and fertilizers, human labour and machine power were underutilized and bullock labour, plant protection and irrigation were excessively on farms. In case of large farms the marginal value product of seed, manures and fertilizer, human labour, bullock labour, and plant protection were (Rs. 0.80, Rs. 0.34, Rs. 0.18, Rs. 0.01, Rs. 0.15.) be positive while it had negative value for machine power and irrigation respectively arrived at Rs. - 0.16 and Rs. - 0.01 implying that on large farms seed, manures and fertilizers, human labour, bullock labour and plant protection chemicals were underutilized while machine power and irrigation were excessively used indicating there is need to reduce their use up to the optimum level.
Verma (2004) analyzed economics of production resource use efficiency, marketing and constraints of Garlic production and marketing in Indoor district of Madhya Pradesh and found that variables included in regression analysis explained 86.69 per cent of variation in gross returns, the elasticity of production with respect to seed and bullock labour were 0.503 and 0.1633 respectively. The regression coefficient of manures and fertilizers and plant protection were 0.4795 and 0.39 respectively, these variables were found positive and significant. The average marginal product of seed, manures and fertilizers, bullock labour and plant protection were Rs. 0.06, Rs. 0.67, Rs. 0.27 and Rs. 0.60 respectively were positive and considerably lower than unity. This indicted that seed, manures and fertilizer, bullock labour

and plant protection were underutilized. In case of expenditure on human labour, machine power and irrigation were Rs. -0.78, Rs. -0.24 and Rs. -0.17 respectively shows negative value this indicate that these variables are excessively used there is need to reduce its application to the recommended level.
Vinayak (2005) studied the economics of contract farming in ashwagandha cultivation in Northern Karnataka and found that the regression co-efficient for expenditure on human labour, machine labour and FYM were statistically significant and charges on seed, bullock labour and other were positive but non- significant. MVP: MFC ratio was found more than unity in seeds, human labour, bullock labour and machine labour except for others (PPC and interest on working capital).
Deebasouaghanayaki and Sundaravaradarjan (2007) studied the economic analysis of aloe vera cultivation in Tamil Nadu. In group1, the regression coefficient for land and labour were positively significant. It could be conclude that these variable positively influenced on the yield levels. In group 2, the regression coefficient for land, labour and manures were positively significant. It could be inferred that these variable positively influence on yield level of alo vera. In group 3, the regression coefficient suckers and labour were found positively significant so it could be concluding that these variables were positively influenced on yield levels.
Smitha et al. (2008) studied resource use efficiency in Anthorium cultivation in Coorg district they found that the expenditure on PPC was significant in organized sector. The expenditure on fertilizers, labour and irrigation was statistically non significant in organized sector. In the unorganized sector the expenditure on fertilizers appeared to significant whereas expenditure on PPC exerted significant but a negative influence on growth rate. The expenditure on irrigation is positive in organized sector but statistically non significant. An MVP and MFC ratio was negative values in case of expenditure on fertilizer, labour and irrigation in organized sectors and expenditure on labour and PPC in unorganized sectors. These show that resource in production has been over utilized. MVP and MFC ratios more than one in case of PPC in organized sector and fertilizer and irrigation in un organized sectors shows that underutilized resource
Pawar and Pawar (2008) studied resource productivity, resource use efficiency and optimum resource allocation in jasmine flower production in Maharashtra and found that coefficient of determination was 0.86 which indicated 86.10 per cent of variation in jasmine flower production due to variation in six explanatory variables in estimating cobb-Douglas production function. If use of area of jasmine garden, human labour, nitrogen, phosphorus and manure were increased by 1 per cent each, that will lead to increase in jasmine flower production by 0.313, 0.288, 0.022, 0.040 and 0.90 per cent, respectively. The existing size of jasmine garden was 0.369 hectare while optimum size of it was found to be 0.73 hectare. When other resource remained constants, the optimum use of human labour, nitrogen, phosphorus and manure were 287.27 man days, 107.60 kg, 106.43 kg and 74.63 quintal respectively. Production elasticity of potash input was found to be positive but non significant.
Puran mal et al. (2009) studied the economic analysis of cultivation of safeda musli in Haryana and found that the regression co-efficient for land preparation, planting material, manures and fertilizer inter-culture and hoeing respectively were positive and significant indicating significant influence on the gross returns. MVP and MFC ratios was more than unity in land preparation, manures and fertilizer, inter-culture and hoeing and irrigation charges were more than unit implying that wide scope for increasing the use of these variables. MVP and MFC ratio was less than unity in planting material indicating that over utilization of this resource.
2.3 Cost and returns in the value addition of medicinal and aromatic crops
Ravishankar (1993) studied the economics of production and processing of davana is eastern zone of Karnataka. He worked out total cost of processing at Rs. 8,47,175.00 of which Rs. 64,975 was fixed cost and the variable cost was Rs. 7,82,700, Cost of raw material was found to be maximum (Rs. 7,20,000), followed by labour cost for drying and distillation (Rs. 36,000), depreciation on equipments (Rs. 30,000), repairs and maintenance (Rs. 24,000), fuel wood (Rs. 14,400).The gross returns and net returns were Rs. 12,37,500 and

Rs. 3,90,325 respectively and also worked out NPV, IRR and B:C ratio for processing units were Rs. 12,77,574, 55.57 per cent and 3.19
Raghunatha Reddy (1996) studied the economics of production and processing of lemongross in Narasimharajapura taluk of Chikkamangalore district, Karnataka. He worked out the cost of setting of distillation unit was Rs. 2120 which includes labour cost (Rs. 500) and material cost (Rs. 1620). The average maintenance cost of distillation was Rs. 1531.75. The average gross returns and net returns per year were Rs. 7138.2 and Rs. 2466.32 respectively from distillation units.
Srinivas et al. (1996) in their study on the economics of processing of cashew nut in Andhra Pradesh, indicated that the processors have to bear the processing cost of Rs. 124.22 per 80 kg of raw nuts. Out of the total cost, Rs. 50.77 was raw material cost which formed 40.89 per cent and labour cost was Rs. 72.81 which accounted for Rs. 58.61 per cent of total processing cost.
Subrahmanyam and Gajanana (2001) studied economics of lemon gross cultivation and production of oil in Kerala. They worked out cost of distillation for own distillation units and hired distillation units were Rs. 10,892 and Rs. 11,212.50. The study revealed that cost of fuel was major cost and same in both cases of Rs. 7762. The net average returns were Rs. 5924.8 per acre. They also worked out net cost per kg of oil was Rs. 271.54 and net returns per kg of oil was Rs. 167.46 per kg.
Gawas (2002) worked out per quintal cost of processing of dried kokum rind and was observed to be Rs. 2143.91 of which Rs. 1232.50 incurred on the procurement of fresh kokum fruits. The other important items of processing cost were labour charges (Rs. 362.60), interest on capital (Rs. 359.21), container (Rs. 65.5) and other charges (Rs. 70.42). While the processing unit of kokum fruits worked out to Rs. 2031.51 per 100 bottles (each bottle 650 ml capacity). Expenditure on raw material was maximum (Rs. 384.73), followed by labour charge was (Rs. 216.78). Gross added value estimated in dried kokum rind was Rs. 9111.4 and Rs. 1277.68 in kokum syrup per quintal of fresh kokum fruits.Net added value was Rs. 1206.09 in dried kokum rind and Rs. 968.32 in kokum syrup processing.
Pawar (2005) studied the kokum processing units and revealed that the processing units were more profitable but they do not get sufficient raw material from the area, as the kokum plantation was scattered throughout the region, home scale and cottage scale units were best suited for the kokun region because they provide more employment opportunity to small entrepreneurs.
Rajesh (2006) studied the economics evaluation of vanilla cultivation in Uttar Kannada district of Karnataka. He worked out total cost incurred in processing of vanilla bean was Rs. 6775.94 per quintal. The study was revealed that labour cost was Rs. 4680 (69.07%), packing material was Rs. 50 (0.73%) and fuel was Rs. 60 (0.88 per cent). Gross returns and net returns obtained from 20 kg of processed bean were Rs. 30,000 and Rs. 23,224.06 respectively.
Deorukhakar et al. (2007) conducted a study in Sindhudurg district of Maharashtra, India, to study cost and returns structure in kokum (Garcinia indica) processing units and to estimate value addition as well as employment potential in kokum processing units. The data from 30 kokum processing units was collected with the help of specially-designed schedules. The data pertained to the year 2003-04 production season. The study revealed that the total cost of processing of one-quintal fruits into kokum syrup was Rs. 2440.88 that for kokum agal was Rs. 867.90 and that for kokum rind was Rs. 1102.18. The gross returns obtained after processing one-quintal kokum fruits into kokum syrup was Rs. 3780.52 whereas gross returns per quintal from kokum agal and kokum rind were Rs. 1344.24 and Rs. 1707.10, respectively. Net returns per quintal obtained were Rs. 1339.63, Rs. 476.33 and Rs. 604.91 from kokum syrup, kokum agal and kokum rind respectively.
Mallar Mathi and Pandey (2007) studied economic evaluation of guava processing units in Allahabad district of Uttar Pradesh. They worked out the total cost of processing and total returns in home scale, cottage scale, small scale and large scale were Rs. 34,360.36, Rs. 65,011.25, Rs. 2,77,661.6 and Rs. 1,59,33,795 respectively and total returns in home scale, cottage scale, small scale and large scale were Rs. 1,64,000, Rs. 2,41,120, Rs. 8,26,110 and Rs. 3,42,50,000 respectively and net returns in home scale, cottage scale, small

scale and large scale were Rs. 1,29,639.64, Rs. 1,76,108.75, Rs. 5,48,448.4 and Rs. 1,83,16,205 respectively. The study revealed that cost per quintal and net return per quintal processed in home scale, cottage scale, small scale and large scale were Rs. 2290.6 and Rs. 8642.64, Rs. 2955.05 and Rs. 8004.94, Rs. 4627.69 and Rs. 9140.80 and Rs. 6373.51 and Rs. 7326.48 respectively.
Sheikh Abdul Kadar and Ashwini Chairbha (2010) studied economic appraisal of citronella oil extraction plant in Ballapura District. The study reveled that returns per rupee of investment was 1.38 indicated that production of citronella oil was profitable.
2.4 Constraints in production and processing of medicinal and aromatic crops
Farooqui et al. (2000) reported that in efficient organization, lack of research, unplanned exploitation of natural resource, failure to grow on large scale, inferior method of production, mal practices and adulteration are the major constraints in the production and marketing of aromatic crops.
Kamla Singh et al. (2000) identified problems associated with the cultivation of aromatic crops in south India and they were old genetic stock used for commercial cultivation, underdeveloped marketing network, no minimum support price, substandard oil particularly oil derived from wild sources, communication gap and lack of coordination among growers and user industries, financial resource constraints for small farmers, lack of processing network, predominance of incumbent weather in coastal areas, inadequate research and development works and absence of matching technology in respect of crop/region.
Oudhia (2001) identified the problems in cultivation of safeda musli in Chattisgarh region. He found that high cost of available seeding material, lack of technical guidance for cultivation, lack of market information, increasing infestation of insects and diseases, lack of information regarding post harvest technologies.
Benerjee (2002) found that non availability of quality seeds, non involvement of organized institutions, lack of finance, fluctuation in price, buyers quality specifications are not known, unknown extraction technique, inadequate of awareness among entrepreneurs and lack of financial assistance to set up entire unit are the major problems in the production and processing of senna leaves.
Dhanakumar and Nendran (2003) identified problems in production of medicinal and aromatic plants within industrial utilization perspective were poor agriculture practices, poor harvest and post harvest treatment practices, lack of research on development of high yielding varieties and domestication, inefficient processing techniques leading to low yield and poor quality, high energy losses during processing, lack of research and development on product and process development, difficulties in marketing, lack of trained personnel and equipment, lack of facilities to lubricate equipment locally and lack of access to latest technological and market information.
Sundar and kambai Raju (2004) studied the economics of production of gloriosa superb in Tamil Nadu. They reported that high price fluctuations, shortage of labour, require more skill to growing this crop, require more care, large investment in panthal erection and seed material and wastage of tubers in planting.
Venugopal et al. (2004) studied on potential and problems on patchouli cultivation in North Karnataka found that non availability of genuine planting material, sail fertility status decreases over the years, poor post –harvest handling, lack of market information and frequent irrigation were the major problems.
Verma (2004) identified problems in production and marketing of garlic in Indoor district of Madhya Pradesh found that high price of seed, high price of fertilizers, pesticides and fungicide and wage rate of labour, non availability of good quality of seed, non availability of funds from institutional sources, ignorance of severe infestation of insect pest and diseases were major production problems. Higher market charges, price fluctuation lack of market charges non availability of adequate storage facilities were major marketing problems.
Raghu et al. (2006) studied economics of production and marketing of patchouli in North Karnataka. Problems identified them were water logging in rainy seasons, frequent

irrigation, nematode attack, lack of proper package of practice, non availability of method/ instrument to assess the quality of patchouli herbage at farm level.
Rajesh (2006) studied the economic evaluation of vanilla cultivation in Uttar Kannada district of Karnataka. He identified problems in production, processing and marketing of vanilla. Non availability of genuine planting material, non availability of organic manures, incidence.of pest and diseases, non availability of credit facility were major production problems. Lack of knowledge to process the bean, non availability skilled labour for processing, occurrence of pest and diseases after processing, low price for poor quality processed bean were major processing problems. Price fluctuation and lack of marketing facilities were major problems in marketing.
Deebasouaghanayaki and Sundaravaradarjan (2007) studied the economic analysis of aloe vera cultivation in Tamil Nadu and found that lack of technical guidance, lack of knowledge about cultivation, poor quality and timely non availability of suckers, high cost of suckers, absence of high yielding suckers, poor drainage facilities and non availability of required quantity of organic manures.
Rashi Mittal and Singh (2007) identified problems in production and processing of aromatic plants. They found that high initial cost of production, poor quality of inputs and delay in their supply, lack of awareness about loan facility, incentives and procedural delays in obtaining loan, price fluctuations, inadequate market information, lack of trained labour for cultivation, high rate of interest, lack of training programs on cultivation methods and their awareness to farmer and prevalence of pests and diseases were major production problems. Other problems were lack of basic infrastructure and organized marketing system, lack of processing facilities, high processing cost. improper handling of herbage and longer distances between farms and distillation units.
Aijan, et al. (2008) studied the economics analysis of cultivation and marketing of Gloriosa superba in Tamil Nadu. They identified problems such as labour problem, high cost of cultivation, pest and diseases problem and weed problem with respect to production and fluctuation in price, no market information and selling only in registered contractors were the market problems.
Powar and Hange (2008) studied the economics of production and marketing of selected medicinal and aromatic plants in Western Maharashtra. The general problems identified by them were unawareness of agro-techniques, high price for seed material, non availability of sufficient irrigation water, lack of sufficient loan in time, lack of market intelligence and market information and low demand in local market. Lack of information in storage of produce resulted in discolorations, lack of near markets place major problems in safeda musli. Unawareness of processing for value addition and high incidence of disease and wilt and anthracnose were major problems in pudina. Lack of guidance for increasing oil content, cheating from agent for price variation were major problems in citronella.

3. METHODOLOGY This chapter explains the characteristics of the study area, the sampling procedure,
nature and sources of data, the statistical tools and techniques employed for analyzing the data. These are presented under the following sub headings.
3.1 Description of the study area
3.2 Description of the crop
3.3 Sampling design
3.4 Analytical tools and techniques
3.5 Definition of terms and concepts
3.1 Description of the study area
Karnataka is the eighth largest state in India covering an area of 1,91,791 sq. kilometers, occupying 7.75 per cent of the total geographical area of the Country, bound by Andhra Pradesh in the east, Maharashtra and Goa in the west coast and Tamil Nadu and Kerala in the south and Arabian Sea in the west. Karnataka state is situated between 11
031'
and 18048' North Latitudes and 74
012' and 78
040' East Longitudes and lies in the West-
Central part of the Deccan Peninsular India. Its length from North to South is 700 km and from East to West is 400 km.
The mean temperature of the state ranges from 21.50C to 31.7
0C. The average
temperature in the state is about 240C. In general, the climatic condition is favorable for crop
cultivation. The normal rainfall of the state ranges from as low as 569 mm to as high as 4029 mm. Average annual rainfall of the state is 1354 mm. The major part of the rainfall of the state is received from the southwest monsoon, which commences in the first week of June and continues till the end of September. Karnataka is one of the progressive states with excellent potential for horticulture development.
As per the 2001 census, Karnataka total population was about 5.27 crores. The population density of the state was 275 persons per sq. kilometer. The state has 30 districts with 175 taluks and 29,404 villages (Fig.1).
The geographical area of Karnataka State is 190.50 lakh ha, of which an area of 121.82 ha, comes under the cultivable area, constituting 64 per cent of the geographical area. Out of the cultivable, 15.30 lakh ha is covered under horticulture. Horticultural area in the state accounts for about 8 per cent of the total geographical area, forming about 13 per cent of the total cultivable area. Out of 15.30 lakh ha of horticultural area, 6.26 lakh ha is under garden/plantation crops, 3.77 lakh ha is under vegetables, 2.61 lakh is under fruits, 2.45 lakh ha is under spice and 0.21 lakh ha is under commercial flowers.
Coastal Karnataka is characterized by heavy rainfall. It consists of entire Udupi, Dakshina Kannada and parts of Uttara Kannada districts. It receives a heavy rain which varies from 3000-4700 mm. The soils are red lateritic and coastal alluvial. Paddy, ground nut, pulses, tuber crops, sugarcane and plantation are the major crops grown in this zone. Udupi district in coastal Karnataka was chosen for the study purposively due to higher concentration of area under vetiver crop.
The geographical, social and economic features of the Udupi district is presented in the following sub heads,
3.1.1 Description of the study district
The Udupi district of Karnataka falls along the west coast of peninsular India and is separated from the rest of peninsula by towering high Western Ghats. The district lies between 13
o 04’ and 13
o59’ North latitude and 74
o 35’ and 75
o12’ East longitude covering
an area of 3575 sq km. It is about 88 km in length and about 80 km in width and is bounded
by Uttara Kannada district in the North, by Shimoga and Chikamagalur districts in the East
and by Dakshina Kannada district in the South. The district is carved out of South Canara
District during 1991.

Fig. 1: Map of Karnataka showing study district and taluk
KUNDAPUR
UDUPI
KARKAL
N
S

3.1.2 Agro climatic situation in the district
The district comprises of three distinct physiographic units viz., (i) Narrow stretch of coastal tract (ii) Up land area and (iii) The hilly terrain. The coastal areas exhibit coastal beach, spits and creeks and backwater swamps with the surface features of sandy strips and linear troughs. The area adjoining the coastal stretch exhibits forested high hilly topography with deep valleys. Most part of the district is rugged terrain and demarcates areas with slopes of less than 2 per cent, 2 to 5 per cent and more than 5 per cent. About 50.68 per cent of the district falls under 2 to 5 per cent slope and remaining fall under more than 5 per cent slope. Most part of Lateritic capped pediplains have an elevation ranging from 40 to 60 mamsl which is an important physiographic feature. Upland pediplain area intercepted with low hills between Western Ghats and the coast, which is moderately cultivated. Western Ghats and forested area located on the eastern part of the district.
The area experiences a typical maritime climate and is characterized by excessive humidity during the longer part of the year. Average rain fall per year 4209 mm, of the total rainfall, 80 per cent of the rainfall is received during June to August. The temperature ranges from 21
0C in December to 36
0 C in April.
The district is covered with three types of soils i) sandy soil covering the beaches and the adjoining stretches ii) Yellow loamy soils are found mostly along riverbanks and lower reaches of valleys. iii) Red lateritic soil is the most dominant soil type in the area
3.1.3 Demographic profile of study area
The demographic profile of the district can be viewed from Table 3.1. The geographical area of Udupi district is 3, 56,446 hectares consisting of nine hoblies and 248 inhabited villages. The population of the district is 11.12 lakhs and density of population of the district is 311 per sq.km and growth rate of population is 7.14 and average rainfall is 4209 mm per year and average numbers of rainy days are 124.
Table 3.1: Demographic profile of study area
Taluk District Sl. No.
Particulars Units
Kundhapura Udupi
1. Geographical area Ha 156062 356446
2. Hoblies Numbers 3 9
3. Villages Numbers 99 238
4. Population Numbers 377420 1112243
5. Density of population per square kilometre 242 311
6. Growth rate of population Percentage 7.32 7.14
7. Average rainfall Percentage 3497 3983
8. Numbers of rainy days Average per year 119 124
Source : Udupi District at a Glance 2007-08, District Statistical Office, Udupi

Geographical area of Kundhapura taluk is 1,56,062 hectares consisting of nine hoblies and 99 inhabited villages .The population of the taluk is 3,77,420 and density of population of the taluk is 242 per sq.km and growth rate of population is 7.32.Average rainfall is 4043 mm per year and average numbers of rainy days are 119.
3.1.4 Land utilization pattern
Land utilization pattern of study area has been depicted in Table 3.2.The total geographical area of Udupi district is 3, 56,446 hectares out of which the net cultivable area is 99,138 hectares and not available for cultivation is 50,431 hectares. The total irrigated area is 32,397 hectares, fallow land is 19,903 hectares and 1, and 1,00,102 hectares area is under forests.
Land utilization pattern in Kundhapura taluk has been depicted in Table 3.2. The total geographical area of kundhapura taluk is 1, 56,062 hectares out of which the net cultivable area is 40,641 hectares and not available for cultivation is 22,491 hectares. The total irrigated area is 12,436 hectares, fallow land is 3348 hectares and 62,605 hectares area is under forests.
Table 3.2: Land use pattern in selected taluk and district (Area in ha)
Taluk District Sl. No. Particulars
Kundhapura Udupi
1. Geographical area 156062 356446
2. Forest area 62605 100102
3. Land not available for cultivation 22,491 50431
4. Fallow land 3348 12594
5. Net cultivable area 40641 99138
6. Irrigated area 12436 32397
Source : Udupi District at a Glance 2007-08, District Statistical Office, Udupi
3.2 Description of the vetiver crop
Vetiver (Vetiver Zizaniides) is a densely tufted perennial important aromatic plant belonging to family gramineae. It is very hardy, erect and found growing wild in almost all parts of the country. In commercial cultivated vetiver crop comes to harvest after 12 month. Vetiver prefer warm humid, tropical and sub tropical climate and it is grows in areas with annual rainfall of 600-2000 mm with moderately humid climate up to an attitude of 1000 m with a temperature range of 21
0 to 44
0C. It is mainly cultivated as a rain fed crop in hill
slopes.
Vetiver indigenous to India, Pakistan, Bangladesh, Srilanka and Malaysia. In India, it is cultivated mainly regular crop in the states of Rajastan, Uttar Pradesh, Karnataka, Tamil Nadu and Andhra Pradesh. In Karnataka it is grown in an area of 94 hectares with 250 tons of vetiver roots (Table.3.3). Major area under vetiver in Karnataka is mainly Udupi district as it accounts 93 per cent of the area and small area is in parts of Dakshina Kannada and Uttara Kannada districts.

3.3 Sampling design
Sampling is the procedure of drawing representative samples from the population for the study. Whatever inference is obtained that can be used for inductive reasoning of population. Samples should always represent the population and the size of sample must be adequate to draw meaningful inference about the population.
3.3.1 Selection of the district
Udupi district was selected purposively for the study since this district is having the highest area under vetiver crop in Karnataka and also in the Coastal Karnataka. vetiver growing area is dominated in Udupi district only.
3.3.1.1 Selection of taluks and villages
In Udupi district, kundhapura taluk was selected purposively for the study since this taluk is the major vetiver growing taluk in Udupi district. In kundhapura taluk, eight villages were selected namely Jadkal, Yaljith, Mudhur, Kollur, Kodiyalkeri, Goliholle, Baindoor and Shelkodu. The sample farmers were selected based on the number of growers and larger area under vetiver in the selected villages. Thus, from Jadkal, Yaljith, Mudhur and Kollur villages 40 farmers were selected randomly (ten farmers from each of these villages).Remaining 20 farmers were selected from the villages namely Kodiyalkeri, Goliholle, Baindoor and Shelkodu (five farmers from each of these villages) because vetiver growing area and number of farmers growing vetiver in these villages were less compare to the above mentioned other villages. Farmers were selected randomly from each of these villages Thus, the total size of the sample selected for the study was 60 (Table 3.4).
3.3.3 Selection of the processing units
In the study area 20 small scale processing units are located in the Kundhapura taluk as reported by Assistant Director of Horticulture, Kundhapura. Out of these ten small scale processing units located near by the production area were selected. One medium scale processing unit is working in kundhapura town which was also taken for the detail study and analysis was done for this unit separately.
Table 3.3: Area and production of vetiver roots in different districts of Karnataka in
2004-2005
Sl. No. Particulars Area (ha) Production in (tons)
1 Bijapur 2 2
2. Uttar Kannada 1 3
3. Chikkamagalore 3 2
4. Udupi 88 252
Total 94 259
Source: Horticulture Crop Statistics of Karnataka state at a Glance, 2005-2006.

3.3.4 Nature and sources of data
The present study is mainly based on the primary data obtained from sample farmers through survey method. The sample farmers and processing units owners were interviewed personally using a pre-tested structured schedule specifically designed for the study. The information pertaining to socio economic aspects of farmers such as family size and composition, education level, land holdings, cropping pattern etc. were elicited. The details pertaining to vetiver cultivation such as, area under vetiver, land preparation operations, inputs used and output obtained were collected. Operations related to processing, distillation of vetiver roots into oil and inputs use and output produced in small scale farmer’s distillation units located at farm level were collected. In case of medium scale processing unit, currently existing one unit located in kundhapura town was also collected to study the investment pattern, inputs used and output produced, number of days worked etc, were considered.
The constraints in production, marketing of vetiver roots and the problems of processing units were also collected with the help of pre-tested schedule through opinion survey method. The survey was under taken during December 2009 of the crop year 2008-09.
Table 3.4: Distribution of sample farmers
District Taluk Villages No. of
farmers
Jadkal 10
Yaljith 10
Mudhur 10
Kollur 10
Kodiyalkeri 05
Baindoor 05
Goliholle 05
Shelkodu 05
Udupi kundhapura
Total 60
3.4 Analytical tools and techniques
The following are the major analytical tools and techniques used in the analysis of the data are presented here under the fallowing sub heads.
3.4.1 Tabular presentation.
3.4.2 Production function analysis.
3.4.3 Financial analysis
3.4.1 Tabular presentation
The data was summarized in the form of appropriate tables. The technique of tabular presentation was used to assess the cost and returns from vetiver roots production and processing of vetiver roots into oil and also for problems in production, marketing and processing. The percentages and averages were computed and compared to draw meaningful inference.

3.4.2 Production function analysis
The Cobb-Douglas (CD) production function was used to study the resource use efficiency and influence of inputs on vetiver yield in coastal Karnataka. The production function of the following type was specified in the present study.
Y = a X1b1
X2b2
X3b3
……………….Xnbn
+ eu
. The above function was converted into the linear form through logarithmic transformation of all variables and is written as
Log Y = log a + b1log X1 + b2log X2 + b3log X3 + ……………. +bnlogXn +u
Where,
Y : Gross income from vetiver (Rs/ac)
X1 : Expenditure on Slips (Rs/ac)
X2 : Expenditure on labour (Rs/ac)
X3 : Expenditure on Manures and Fertilizers (Rs/ac)
X5 : Expenditure on PPC (Rs/ac)
X6 : Expenditure on irrigation charge (Rs/ac)
a : Constant
∑bi : Elasticity of production
u : Error term
The Marginal Value Product for each input was calculated at the geometric mean levels of the respective resources by using formula.
Y Marginal value product of Xi =bi
Xi
Where,
Y : Geometric mean of gross income
Xi : Geometric mean of ith
resource
bi : Production elasticity of ith
resource
3.4.3 Financial analysis
The techniques used for the financial analysis were:
1. Net Present Value (NPV)
2. Internal Rate of Return (IRR) and
3. Benefit-Cost Ratio (B: C Ratio)
4. Pay Back Period (PBP)
3.4.3.1 Net Present Value (NPV)
It is believed to be a more meaningful measure of the long-term investment proposal and useful in comparing the other investment proposals. Net present value represents the discounted value of the net cash inflows to the project. In the present study, a discount factor of 13 per cent was used to discount the net cash inflows representing the opportunity cost of capital. It can be represented by.

Where,
Yi : Refers to the net cash inflows in the year n
r : Refers to the discount rate
I : Initial investment
i : Years of life period 1, 2. . . . . . . n.
In order to consider the investment worthiness, the net present value should be positive and of higher magnitude before alternative opportunities considered.
3.4.3.2 Internal Rate of Return (IRR)
It is the rate of return which equates the present worth of benefits to present worth of costs, which means the net present worth is zero. This represents the average earning capacity of an investment from the projects. The mathematical form of IRR is;
IRR = Σ = 0
Where
Bn : Cash inflows during nth year
Cn : Cash outflows during nth year
D : Discount rate
The internal rate of return is arrived at by interpolation technique by using different discount rates so as to see that the net present worth is equated to zero. The interpolation formula employed in this study is as follows.
The net cash inflows are discounted to determine the present worth following the interpolation technique.
The method of interpolation followed is as under:
3.4.3.3 Benefit Cost Ratio
It is the ratio between the discounted cash inflows and initial investment and ratio must be equal to or more than unity for an investment to be considered worthwhile. It is worked out by using the following formula
Discounted net cash flows B: C ratio =
Initial investment
3.4.3.4 Pay Back Period (PBP)
Pay back period represents the length of time required for the stream of cash proceeds produced by the investment to be equal to the original cash outlay i.e. the time required for the project to pay for itself. In the present study, payback period was calculated by successively deducting the initial investment from the net returns until the initial investment is fully recovered.
Present worth of cash flows
at lower discount rate
Absolute difference between present
worth of cash flows stream at the two
discount rates
Difference between
IRR = Lower discount rate + the two discount rates
(1 + d)n
n
t=1
Bn – Cn

3.5 Definition of terms and concepts used
The terms and concepts used in the study and the procedure used to calculate the cost of different items are given below:
1. Human labour
The human labour is measured in terms of man days for different farm operations of Vetiver cultivation. The women days were converted into adult man days of eight hours per day on the basis of wage difference between man and women labour. For instance, in the present study the wage rate of man day is Rs. 150 and that for women day is Rs. 100, the adult man day is 100/150 = 0.66 man day.
2. Machine labour
The cost of machine labour both hired and owned is calculated for differential rates for deferent types of operations prevailed in study area.
3. Material costs
The planting material used (slips) was valued at the current market rate. Remaining material costs covered in this are expenditure on fertilizers, plant protection chemicals and farmyard manures.
4. Other expenses
includes packing materials (gunny bags/jutes/ropes) used while purchasing seedlings and sticks. These costs were computed based on the actual prices paid by the growers
5. Fixed cost
Includes the land revenue, rental value of owned land, interest rate on fixed capital and depreciation on farm implements and machinery.
6. Interest on fixed capital
Interest on fixed capital was calculated at the rate of 13 per cent on fixed capital at which the banks charge for the long-term loan for processing unit.
7. Interest on working capital
Interest on working capital was charged at the rate of 7 per cent per annum. It is the rate at which the farmers used to get short-term loans which was given at subsided rate of 1.5 to 2 percent of short term loan (8.5 percent).
8. Land revenue
Land revenue paid by the farmers during the current year is considered for this study.
9. Land value and rental value of land
Rental value of land was imputed at the prevailing land rent per acre per annum in the study area.
10. Establishment cost
It is the cost incurred on the establishment of Vetiver distillation unit. The cost incurred under this comprises value of land, construction of building and distillation unit and electric installation
11. Planting material
Slips are defined as a stem, root, twig etc… cut or broken off a plant and used for planting or grafting.
Slips purchased for rising nursery at the rate prevailing in the study area are treated as planting material cost.
12. Farm Yard Manure (FYM)
Farm yard manure is charged as per the prevailing market rates during the period of study in the study area

13. Fertilizers
The fertilizer cost is calculated at the actual price paid by farmers.
14. Irrigation charges
The charges for electricity or fuel paid towards lifting well water were allocated to the rising vetiver nursery in proportion to the area under each crop.
15. Gross income/ Gross returns
It is the value of total quantity of Vetiver Produced at the prices where the product is sold.
16. Net returns
Net returns were calculated by deducting total cost from gross returns.
17. Cost of production per kg
This can be worked out by dividing total variable cost (TVC) by yield.
Cost of production per kg = TVC / Yield
18. Net return per kg
Derived by dividing net returns over total cost by total yield
Net return per kg =
19. Small scale processing unit
Classification based on the capacity of unit in terms of monetary value and size of its operation. For present study less than 10 lakhs as considered as a small scale unit.
20. Medium scale processing unit
For medium scale, the value ranges from 10 lakhs to 25 lakhs as considered as a medium scale unit.
Net return
Yield

4. RESULTS The findings of the research of study are presented in the following headings in
consonance with the objectives of study.
4.1 Socio-economic characteristics of the farmers
4.2 Cost and returns structure in vetiver roots production
4.3 Resource use efficiency in vetiver roots production
4.4 Cost and returns structure of vetiver roots processing units
4.5 Constraints faced by vetiver growers and processors
4.1 Socio-economic characteristics of the farmers
The results in respect of socio-economic characteristics of the sample farmers are presented here under the fallowing sub heads.
4.1.1 General features of sample farmers
The average family size of vetiver farmer was around 4.63 with respect to education level was concerned hardly about 6.66 per cent of the farmers were illiterate and remaining were literate which are presented in Table 4.1. About 63.33, 25.00 and 5.00 per cent of the farmers were studied up to primary, high school and college level respectively. The average age of the respondents was 40.80 years and agriculture was the main occupation which accounts 95 per cent of the farmers and remaining five per cent of farmers were having agriculture as a subsidiary occupation.
4.1.2 Pattern of land holding of respondents
Pattern of land holding of vetiver growing farmers is given in Table 4.2. The average land holding size of sample farmers was 6.48 acres, of which rainfed land was 5.60 acres and irrigated land was 0.88 acres, which worked out to 86.41 per cent and 13.58 per cent of the land holdings respectively. The average area under vetiver cultivation accounted for about 4.4 acres accounting for 68 per cent of total land holding.
4.2 Cost and returns in vetiver roots production
The results in respect of cost and returns in vetiver roots production are presented here under fallowing sub heads.
4.2.1 Pattern of employment in vetiver root production
The results of the labour employed in vetiver root production per acre are presented in Table 4.3. In vetiver nursery preparation, about two man days of human labour used for land preparation. For FYM transportation and application 0.50 manday was employed, about 3.40 mandays employed for planting of slips in nursery and about 0.66 mandays for weeding. About five mandays were used for irrigation of nursery. For uprooting of clumps and separation of slips 5.5 mandays were employed. Total of 16.50 mandays were employed for different activities in nursery preparation.
In main field preparation, about six man days of human labour used for land preparation. For FYM transportation and application three mandays were employed, about 18.20 mandays employed for planting of slips in main field and 24 mandays were used for weeding. For earthing up eight mandays were employed, about two mandays were employed in spraying of PPC and about 78 mandays were employed for harvesting. Total of 143.2 mandays were employed for different activities in main field preparation. Total 159.7 man days were employed for different activities in vetiver root production. Only about 5.5 and 14 man days of family member were employed for different activities of nursery and main field respectively, as most of the farmers in the study area educated, involvement of family member in vetiver root production is less. Total of 89.5 and 117 man days and women days were employed in different activities of vetiver root production respectively.

Table 4.1: General characteristics of the sample farmers
(n=60)
Sl. No
Particulars Unit Average Percentage (%)
1 Age of the farmers Years 40.80 -
2 Size of the family Numbers 4.63 -
3 Education level - - -
I. Illiterate Numbers 4.00 6.66
II. literate 56.00 93.33
a. Primary Numbers 38.00 63.33
b. High school Numbers 15.00 25.00
c. College and above Numbers 3.00 5.00
Total 60.00 100.00
4. Occupation
a. Agriculture as Main occupation Numbers 57.00 95.00
b. Agriculture as Subsidiary occupation Numbers 3.00 5.00
Total 60.00 100
Table 4.2: Land holding pattern of respondents in the study area
(n=60)
Sl. No. Particulars Area (Acres) Percentage (%)
1. Dry land 5.60 86..41
2. Irrigated land 0.88 13.58
Total land 6.48 100.00
3. Area under Vetiver 4.40 67.90

Table 4.3: Per acre pattern of employment in vetiver roots production
Family Hired
Sl. No
Type of operation Men
(man-day
Women
(women-day)
Men (man-day
Women
(women-day)
Total men
(man-day)
Total women
(women-day)
Total human
labour
(man-day)
a) Nursery preparation
1. Land preparation 1 - 1 2 - 2.00
2. FYM/compost (transportations & application) 0.5 - 0.5 0.50
3. Planting/sowing 1 - 4 1 4 3.40
4. Weeding - - - 1 1 0.66
5. Irrigation 2 - 3 - 5 - 5.00
6. Uprooting clumbs and separation of slips 1 - 1 5 2 5 5.30
Sub total 5.50 - 5.00 10.00 10.50 10.00 16.50
b) Main field preparation
1. Land preparation 1 - 5 - 6 6.00
2. FYM/compost (transportations & application ) 1 - 2 - 3 - 3.00
3. Fertilizer (transportations & application ) 2 - 2 - 4 - 4.00
3. Planting/sowing 1 - 4 22 5 22 18.20
4. Weeding 3 - - 35 3 35 24.00
5. Earthing up 2 - 6 - 8 - 8.00
6. PPC Spraying 1 - 1 2 - 2.00
7. Harvesting 3 - 45 50 48 50 78.00
Sub total 14 - 65 107 79 107 143.20
Total 19.50 70.00 117.00 89.50 117.00 159.70

Table 4.4: Per acre inputs utilization pattern in vetiver roots production
Sl. No. Particulars Units Quantity
a) Slips Numbers 3000.00
b) Farmyard manures (FYM) Ton 3.00
c) Chemical fertilizers
i. Nitrogen Kg 119.70
ii. Phosphorous Kg 123.90
iii. Potash Kg 103.00
d) Labour
i. Human labour Man day 159.70
iii. Machine hour Hour 10.50
e) Plant protection chemicals Ml 400.00
f) Fuel (Diesel) liter 30.00
4.2.2 Inputs utilization pattern in vetiver roots production
The results in respect of the average quantities of inputs used per acre of vetiver roots production are presented in Table 4.4.
In vetiver roots production, on an average farmers used 3000 slips for rising nursery for one acre. The FYM used at the rate of three tons per acre and fertilizer in terms of nutrients, nitrogen (N), phosphorus (P) and potash (K) were 119.70 kg, 123.90 kg and 103.00 kg respectively. On an average the farmers had used 400 ml of plant protection chemicals. Around 159.7 man days of human labour and 10.50 machine hours were utilized per acre by the respondents. For irrigating nursery field 30 liters diesel used.
4.2.3 Cost structure in vetiver roots production
The costs incurred per acre of vetiver roots production are presented in Table 4.5 and Fig. 2.
Among the variable cost, expenditure on labour was Rs. 31,830 which accounts for 61.73 per cent of total cost and it was the major cost in vetiver roots production of which cost on human labour was Rs. 23,955 (46.46% of the total cost), cost on machine hour was Rs. 7875 (15.27%), Cost on FYM was Rs. 1500 which accounts for 2.90 per cent of the total cost. The amount spent on slips for rising nursery was Rs. 4500 which accounted 8.72 per cent of the total cost. Cost on chemical fertilizers was Rs. 4292 (8.32%) and cost incurred on PPC and fuel in irrigating nursery was Rs. 900 and Rs. 1080 respectively.
The total cost of vetiver root production was Rs. 51,556 per acre of which variable cost was Rs. 47,262 accounting 91.67 per cent of total cost and fixed cost was Rs. 4294 accounting 8.32 per cent of the total cost. Rental value of land was major chunk of the fixed cost which was Rs. 3200 (6.20 per cent of the total cost) and depreciation amounted to Rs. 600.
4.2.4 Returns structure in vetiver roots production
The details of returns structure are presented in Table 4.6 and Fig. 3 the average gross returns realized per acre were Rs. 1,05,500 and the average net returns per acre of vetiver root production were Rs. 53,444. Cost of production of roots per kg of roots was Rs. 31.50. Net returns per kg of roots were Rs. 35.62 and returns per rupee of expenditure was Rs. 2.03

Variable cost
Labour
67%
Interest on working capital @(7%)
7%
Fuel (Diesel) @ Rs. 36/liter
2%
Plant protection chemicals @ Rs.
450/200 ml
2%
Farmyard manures @ Rs. 500/Ton
3%Slips @ Rs. 1.5/ Slip
10%
Chemical fertilizers
9%
Fig. 2a: Per acre cost structure in vetiver roots production
Fixed cost
Rental value
75%
Depreciation
14%Interest on fixed cost (@13%)
11%
Fig. 2b: Per acre cost structure in vetiver roots production
Fig. 2: Per acre cost structure in vetiver roots production

Table 4.6: Per acre returns structure in vetiver roots production
Sl. No. Particulars Amount (Rs)
1) Gross returns (Fresh roots 1500 kg @Rs. 70/kg) 1,05,000
2) Total cost 51,556
3) Net returns 53,444
4) Cost of production per kg 31.50
5) Net returns per kg of roots 35.62
6) Returns per rupee of expenditure 2.03
0
20000
40000
60000
80000
100000
120000
Va
lue
(Rs.
)
Gross returns Total cost Net returns
Fig. 3: Per acre returns structure in vetiver roots production
Fig. 3: Per acre returns structure in vetiver roots production

Plate 1: Vetiver Crop stand
Plate 2: Economic part of crop
4.3 Resource use efficiency in vetiver root production
The Cobb- Douglass production function was estimated to analyze relationship between resource and productivity of vetiver using survey data from sample farmers. The gross income in rupees realized from vetiver output sold was taken as dependent variable, while expenditure made on slips (Rs), labour (Rs), fertilizers and manures (Rs), plant protection chemicals (Rs) and irrigation charge (fuel) (Rs) were taken as independent variables. The estimated production functions are presented in Table 4.7. The inputs included in model explained 90 per cent of variation in vetiver output as revealed by the coefficient of multiple determinations (R
2). The summation of regression coefficients indicated decreasing
returns to scale i.e. for each incremental use of all inputs simultaneously farmers would get less than one unit of output.
Regression co-efficient for slips and labour were positively significant at one per cent of probability level and plant protection chemicals and irrigation charges were positively significant at five per cent probability level indicating that for every one per cent increase in slips would result in increase the gross returns by 0.2892 per cent, for every one per cent increase in labour would result in an increase of gross income by 0.5497 per cent. for every one per cent increase in PPC would result in increase the gross returns by 0.003 per cent and for every one per cent increase in irrigation charges would result in an increase of gross income by 0.03 per cent. Regression co-efficient for manures and fertilizer observed to be positive but non-significant.

Table 4.7: Cobb-Douglas production function estimates in vetiver roots production
Sl. No. Items Regression coefficients
1 Intercept 2.846711
(0.7721)
2 Expenditure on slips (Rs) 0.2892**
(0.0518)
3 Expenditure on labour (Rs) 0.5497**
(0.1063)
4 Expenditure on manures and fertilizers (Rs) 0.0010
(0.0013)
5 Expenditure on plant protection chemicals (Rs) 0.0073*
(0.0037)
6 Expenditure on irrigation (Rs) 0.0738*
(0.0357)
7 R2
(coefficient of multiple determination) 0.90
8 Adjusted R2 0.89
9 ‘F’ value 98.89
10 Returns to scale 0.92
Note: Figures in parentheses indicate standard error * Significant at 5 per cent ** Significant at 1 per cent
4.3.1 Allocative efficiency in vetiver roots production
The Cobb-Douglas function estimates and geometric mean levels of inputs were used to estimate the marginal value product. The knowledge of the marginal value products of resources facilitates comparison of marginal value product with marginal factor cost of the resources to arrive at optimal use of resources.
It was evident from Table 4.8 that the ratio of marginal value product and marginal factor cost were positive and more than unity for slips (6.74),labour(1.76),plant protection chemicals(1.35) and irrigation charges (7.79) indicating that the resources were underutilized and there is scope for getting higher returns by increasing the use of these resources. The ratio of marginal value product and marginal factor cost was less than unity and positive for manures and fertilizers indicating that these resources were in excessive use i.e. decrease in the use of these inputs would enhance the returns.

Table 4.8: Allocative efficiency of vetiver roots production
(Per acre)
Sl. No.
Particulars Geometric
mean Reg.
Co-efficient MFC MVP
MVP/ MFC
1 Gross returns (Rs) 106225.7
2 Expenditure on slips (Rs) 4554.093 0.2892** 1 6.74 6.74
3 Expenditure on labour (Rs) 33006.06 0.5497** 1 1.76 1.76
4 Expenditure on manures and fertilizer (Rs)
5017.152 0.0019 1 0.040 0.040
5 Expenditure on plant protection chemicals (Rs)
572.6411 0.0073* 1 1.354 1.354
6 Expenditure on irrigation (Rs) 1005.264 0.0738* 1 7.79 7.79
4.4 Cost and returns structure of vetiver roots processing units
Cost and returns structure of vetiver roots processing units both small and medium scales are presented here under the fallowing sub heads.
4.4.1 Cost and returns structure of vetiver roots processing unit (medium scale)
Total investment required for establishment of vetiver roots processing unit is given in Table 4.9. Investment of Rs. 19,00,000 required to set up a processing unit of medium scale. Among the various investment items, the investment on machinery was maximum (Rs. 15,00,000) fallowed by the investment on land (Rs. 2,00,000 lakh) and building (Rs. 2,00,000 lakh).
The cash outflows and cash inflows in vetiver processing unit (medium scale) are presented in the Table 4.10. The initial investment i.e. cash out flows during zero year was Rs. 19 lakhs. The vetiver processing unit under study is of eight years old. During first year of its operation the cost incurred was Rs. 11.00 lakhs and it increased to Rs. 32.4 lakhs during eighth year as the processing unit starts utilizing its full installed capacity to produce vetiver oil. From eighth year on wards and up to 30
th year’s cash out flows assumed to be increased
by Rs. 2.75 lakhs every year.
The cash inflow in vetiver processing unit (medium scale) during first year was Rs. 16.07 lakhs and it increased to 57.64 lakhs during eighth year, as the processing unit started utilizing its full installed capacity to produce vetiver oil. The vetiver roots production in the processing unit assumed to use its fullest capacity from eighth year onwards to 30
th year. The
cash inflows during these years i.e. from eighth year to 30th years are estimated by multiplying
the quantity of vetiver oil and wasted roots are sold (produced) with the expected price during each year.
Thus, the cash inflows in vetiver root processing unit during this period increased from Rs. 57 lakhs in eighth year to Rs. 205.45 lakhs in the 30
th year.

Table 4.9: Investment pattern in medium scale vetiver root processing unit
Sl. No. Particulars Amount (Rs )
1. Land 2,00,000
2. Building 2,00,000
3. Machinery 15,00,000
Total 19,00,000
Table 4.10: Cash flow analysis in medium scale vetiver roots processing unit (Rs. in
Lakhs)
Year Cash outflow Cash inflow Net cash
flow DF @ 13%
Discounted net cash flows
- 19.00 (19.00) (19.00)
1 11.00 16.07 5.07 0.88 4.48
2 18.00 28.20 10.20 0.78 7.98
3 21.13 32.47 11.34 0.69 7.85
4 23.80 39.33 15.53 0.61 9.51
5 26.25 46.12 19.87 0.54 10.76
6 28.00 49.12 21.12 0.48 10.14
7 29.75 50.06 20.31 0.43 8.63
8 32.40 57.64 25.24 0.38 9.49
9 35.15 63.20 28.05 0.33 9.31
10 38.00 68.56 30.56 0.29 8.99
11 40.95 74.08 33.13 0.26 8.61
12 42.90 79.73 36.83 0.23 8.47
13 46.00 85.52 39.52 0.20 8.06
14 48.00 91.45 43.45 0.18 7.82
15 51.25 97.51 46.26 0.16 7.36
16 53.30 103.80 50.50 0.14 7.12
17 55.35 110.14 54.79 0.13 6.85
18 58.80 116.71 57.91 0.11 6.37
19 60.90 123.33 62.43 0.10 6.12
20 63.00 130.08 67.08 0.09 5.77
21 66.65 136.98 70.33 0.08 5.34
22 68.80 144.11 75.31 0.07 5.05
23 70.95 151.29 80.34 0.06 4.82
24 74.80 158.59 83.79 0.05 4.44
25 77.00 166.04 89.04 0.05 4.18
26 79.20 173.74 94.54 0.04 3.88
27 83.25 181.47 98.22 0.04 3.54
28 85.50 189.33 103.83 0.03 3.32
29 87.75 197.32 109.57 0.03 3.07
30 100.00 205.46 105.46 0.03 2.64
Total 181.06

The cost incurred in processing of vetiver roots into vetiver oil per year were worked out and presented in Table 4.11 and Fig. 4. The total cost of processing vetiver roots per year was Rs. 35,26,451.66 of which variable cost accounted for Rs. 30,67,295 (86.97% of the total cost) and fixed cost was Rs. 4,59,156.66 (13.02% of the total cost). Cost on raw material was the major cost amounted to Rs. 24, 50,000 (69.41%) fallowed by interest on working capital Rs. 2, 40,295 (6.81%), salaries to permanent employees was Rs. 2, 88,000 (8.16%). Other items were fuel charge Rs. 1, 75,000 (4.96%), sales tax Rs. 1, 00,000 (2.83%) and apportioned establishment cost Rs. 63,333.33 (1.79%).
Cost of production per kg of vetiver oil was Rs 5877.41 of which Rs. 5112.12 was towards variable cost and Rs. 765.26 towards fixed cost. Cost on raw material (Rs. 4083.33) was the major cost fallowed by salaries to permanent employees (Rs. 480), interest on working capital (Rs. 400), fuel wood charge (Rs. 291.66), sales tax (Rs. 166.66) and apportioned establishment cost (Rs. 105.55).
As indicated in Table 4.12 and Fig. 5, the processing unit (medium scale) processed 35 tons of vetiver roots per year and turned out 600 kg of oil and 28,000 kg of waste roots. The returns worked out to Rs 48, 00,000 per year from vetiver oil and Rs. 1, 12,000 per year from waste roots, considering average market price of Rs 8000 per kg of oil and Rs 4 per kg of waste roots. Hence, the total gross returns per year amounted to Rs. 49, 12,000 and net returns per year amounted to Rs. 13, 85,549. In other words a gross returns per kg oil were Rs. 8186 and a net returns per kg of oil was Rs 2309.22 and gross returns per ton of vetiver roots processed were Rs. 1,40,342.85 and net returns per ton of vetiver roots were Rs. 39,587.11.
4.4.1.1 Financial feasibility of investment in vetiver processing unit (medium scale)
To analyze the financial feasibility of investment in vetiver roots processing unit, the criteria such as net present value, benefit cost ratio, internal rate of return and payback period were used. The results are presented in the Table 4.13
The annual net cash inflows were discounted at 13 per cent to obtain the present value of net benefit in vetiver processing unit. The initial investment made in vetiver processing unit was deducted from the present value of the net benefits. It may be seen from the Table 4.13 that the net present value (NPV) in vetiver processing unit was Rs. 181.02 lakhs. Internal rate of return (IRR) measures the rate of returns that could be earned by investing in vetiver processing unit. It also considers the reinvestment opportunities which are absent in other techniques. The internal rate of return was about 58.10 per cent. Benefit- cost (B: C) ratio indicates the returns per rupee invested in vetiver processing unit which was 1.92. Payback period (PBP) is explained the time required to recover the initial investments made on processing unit. It is seen that the payback period was 2.33 years in medium scale processing unit.
4.4.2 Cost and returns structure in vetiver roots processing units (small scale)
Total investment required for establishment of vetiver roots processing unit (small scale) is given in Table 4.14. Investment of Rs. 4, 00,000 required to set up a processing unit. Among the various investment items, the investment on machinery was maximum (Rs. 3, 00,000) fallowed by the investment on land (Rs. 50, 000) and building (Rs. 50,000).
The cash out flows and cash inflows in vetiver processing units (small scale) are presented in the Table 4.15. The initial investment i.e. cash out flows during zero year was Rs. 4 lakhs. The vetiver processing units under study is of 4
th years old. During first year of its
operation the cost incurred was Rs. 9.5 lakhs and it increased to Rs. 11.07 lakhs during fourth year, as the processing units started utilizing its full installed capacity to produce vetiver oil. From 4
th year on wards and up to 8
th years cash out flows assumed to be increase by Rs.
0.60 lakh every year.
The cash inflow in vetiver processing units (small scale) during first year was Rs. 11.61 lakhs and it increased to Rs. 15.44 lakhs during fourth year, as the processing units started utilizing its full installed capacity to produce vetiver oil.

Table 4.11: Cost structure in vetiver roots processing unit (Medium scale)
(Per year)
Sl. No.
Particulars Amount (Rs/year)
Amount (Rs/kg of oil)
Percentage (%)
A. Variable cost
1 Cost of raw material (35 tons) purchased @Rs. 70,000
24,50,000 4083.33 69.41
2 Cost of packing material 8000 13.33 0.22
3 Power charges 60,000 100 1.70
4 Fuel wood charge@1750/ton 1,75,000 291.66 4.96
5 Wages for casual labour 25,000 41.66 0.70
6 Office maintenance 5000 8.33 0.14
7 Telephone charges 4000 6.66 0.11
9 Sales tax 1,00,000 166.66 2.83
10 Interest on working [email protected] % 240295 400.49 6.81
Total variable cost(A) 30,67,295 5112.12 86.97
B Fixed cost
1 Salaries to permanent labour 2,88,000 480 8.16
2 Depreciation 50,000 83.33 1.41
3 insurance 5000 8.33 0.14
4 Apportioned establishment cost 63,333.33 105.55 1.79
5 Interest on fixed capital@13% 52,823.33 88.03 1.49
Total fixed cost (B) 4,59,156.66 765.26 13.02
Total cost (A+B) 35,26,451.66 5877.41 100

Variable cost
Power charges
2%
Cost of raw material (35 tons) purchased
@Rs. 70,000
80%
Cost of packing material
0%Wages for casual labour
1%
Office maintenance
0%Telephone charges
0%
Interest on working [email protected] %
8%
Sales tax
3%
Fuel wood charge@1750/ton
6%
Fig. 4a: Cost structure in vetiver roots processing unit (Medium scale)
Fixed cost
Salaries to permanent labour
63%
Interest on fixed capital@13%
11%
Apportioned establishment cost
14%
insurance
1%
Depreciation
11%
Fig. 4b: Cost structure in vetiver roots processing unit (Medium scale)
Fig. 4: Cost structure in vetiver roots processing unit (Medium scale)

Table 4.12: Returns structure of vetiver roots processing unit (Medium scale)
(Per year)
Sl. No. Particulars Value (Rs)
1 Output
a) Main product : Vetiver oil 600 kg @ Rs. 8000/kg 48,000,00
b) By product : Waste vetiver roots 28,000 kg @ Rs. 4/kg 1,12,000
2 Gross returns 49,12,000
3 Gross returns per ton of vetiver roots processed (Rs) 1,40,342.85
4 Gross returns per kg of vetiver oil processed 8186.66
5 Total cost of processing (Per/year) 35,26,451.66
6 Total cost of processing (Per/kg oil) 5877.41
7 Total cost of processing (Per/ton) 1,00,755.74
8 Net returns (Per/year) 13,85,549
9 Net returns per kg of vetiver oil processed 2309.24
10 Net returns per ton of vetiver roots processed (Rs) 39,587.11
0
500000
1000000
1500000
2000000
2500000
3000000
3500000
4000000
4500000
5000000
Va
lue
(Rs.
)
Gross returns Total cost of processing (Per/year) Net returns (Per/year)
Fig. 5: Returns structure of vetiver roots processing unit (Medium scale)
Fig. 5: Returns structure of vetiver roots processing unit (Medium scale)

Table 4.13: Financial feasibility of investment in vetiver roots processing unit (medium
scale)
Sl. No. Particulars Unit Value
1 Net Present Value (@13%) Rs in lakhs 181.06
2 Internal Rate of Return Per cent 58.10
3 Benefit - Cost Ratio (@13%) 1.92
4 Pay Back Period Years 2.33
Plate 3: Medium scale vetiver processing unit

Table 4.14: Investment pattern in small scale vetiver roots processing units
(Per unit)
Sl. No. Particulars Amount (Rs)
1. Land 50,000
2. Building 50,000
3. Machinery 3,00,000
Total 4,00,000
Table 4.15: Cash flow analysis in small scale vetiver roots processing units
(Rs. in Lakhs)
Year Cash
outflow Cash inflow
Net cash flow
DF @ 13% Discounted net
cash flows
0 -4.00 -4.00
1 9.50 11.61 2.11 0.88 1.86
2 10.50 13.52 3.02 0.78 2.36
3 11.00 14.45 3.45 0.69 2.39
4 11.07 15.44 4.36 0.61 2.67
5 11.60 16.43 4.83 0.54 2.61
6 12.20 17.42 5.22 0.48 2.50
7 12.80 18.41 5.61 0.42 2.38
8 13.40 19.40 6.00 0.37 2.25
Total 15.06

The vetiver roots production in the processing units assumed to be its fullest capacity from 4
th year onwards to 8
th year as was in the eight year of its operation. The cash inflows
during these years i.e. from 4th year to 8
th year are estimated by multiplying the quantity of
vetiver oil and waste roots sold (produced) with the expected price during each year.
Thus the cash inflows in vetiver root processing units during this period increased from Rs. 11.61 lakhs in fourth year to Rs. 19.4 lakhs the 8
th year.
The cost incurred in processing of vetiver roots into vetiver oil per year were worked out and are presented in Table 4.16 and Fig. 6. The total cost of processing vetiver roots per year was Rs. 10,66,500 of which variable cost amounted to Rs. 9,87,350 (92.58% of the total cost) and fixed cost was Rs. 79,150 (7.42% of the total cost). Cost on raw material was the major item amounted to Rs. 7, 50,000 (70.32%) fallowed by labour charge was Rs. 80,000 (7.50%), fuel charge was Rs. 80,000 (7.50%), interest on working capital was Rs. 77,350 (7.25%) and apportioned establishment cost was Rs. 50,000 (4.69%).
Cost of production per kg of vetiver oil was Rs. 5,672.87 of which Rs. 5251.86 was towards variable cost and Rs. 421.01 was towards fixed cost. Cost on raw material (Rs. 3989.36) was the major item fallowed by labour charge for distillation (Rs. 425.53), fuel charge (Rs. 425.53), interest on working capital (Rs. 411.44) and apportioned establishment cost (Rs. 265.95). About 12.5 tons of vetiver roots processed per year in these units.
As indicated in Table 4.17 and Fig. 7, the small scale processing unit processed 12.5 tons of vetiver roots per year and turned out 188 kg of oil and 10,000 kg of waste roots were produced per year in these processing units. The gross returns worked out to Rs. 15,04,000 per year from vetiver oil and Rs. 40, 000 per year from waste roots, considering average market price of Rs 8000 per kg of vetiver oil and Rs 4 per kg of waste roots. Hence, the total gross returns per year amounted to Rs. 15, 44,000 and net returns per year amounted to Rs. 4,77,500. In other words gross returns per kg oil were Rs. 8212.76 and net returns per kg of oil were Rs. 2539.89 and gross returns per ton of vetiver roots processed were Rs. 1, 23,520 and net returns per ton of vetiver roots were Rs. 38,200
4.4.2.1 Financial feasibility of investment in vetiver roots processing units (small scale)
To analyze the financial feasibility of investment in vetiver roots processing units (small scale), the criteria such as net present value, benefit cost ratio, internal rate of return and payback period were used. The results are presented in the Table 4.18.
The annual net cash inflows were discounted at 13 per cent to obtain the present value of net benefit in vetiver processing units. The initial investment made in vetiver processing units was deducted from the present value of the net benefits. It may be seen from the Table 4.18 that the net present value (NPV) in vetiver processing unit was Rs. 15.06 lakhs. Internal Rate of Return (IRR) measures the rate of returns that could be earned by investing in vetiver processing unit. It also considers the reinvestment opportunities which are absent in other techniques. The internal rate of return was 72 per cent. Benefit – cost ratio (B: C) indicates the returns per rupee invested in vetiver processing unit which was 1.45. Payback period (PBP) is the time required to recover the initial investments made on vetiver processing unit. It is seen that the payback period was 1.66 years.
4.5 Constraints faced by vetiver growers and processors
The constraints faced by vetiver growers in production and marketing of vetiver roots and problems faced by the processors in processing of vetiver roots are presented under the fallowing sub heads.
4.5.1 Constraints faced by the farmers in production of vetiver roots
The constraints faced by vetiver growing farmers in production of vetiver roots in the study area are presented in Table 4.19. The major problems were high cost of production (95%), high labour cost (93.33%), low yield of vetiver roots (91.66%), shortage of labour (83.33%), decrease in soil fertility (83.33%), non availability of genuine planting material (75%), lack of extension education (58.33%), prevalence of pest and disease (41.66%) and lack of support from the government (33.33%).
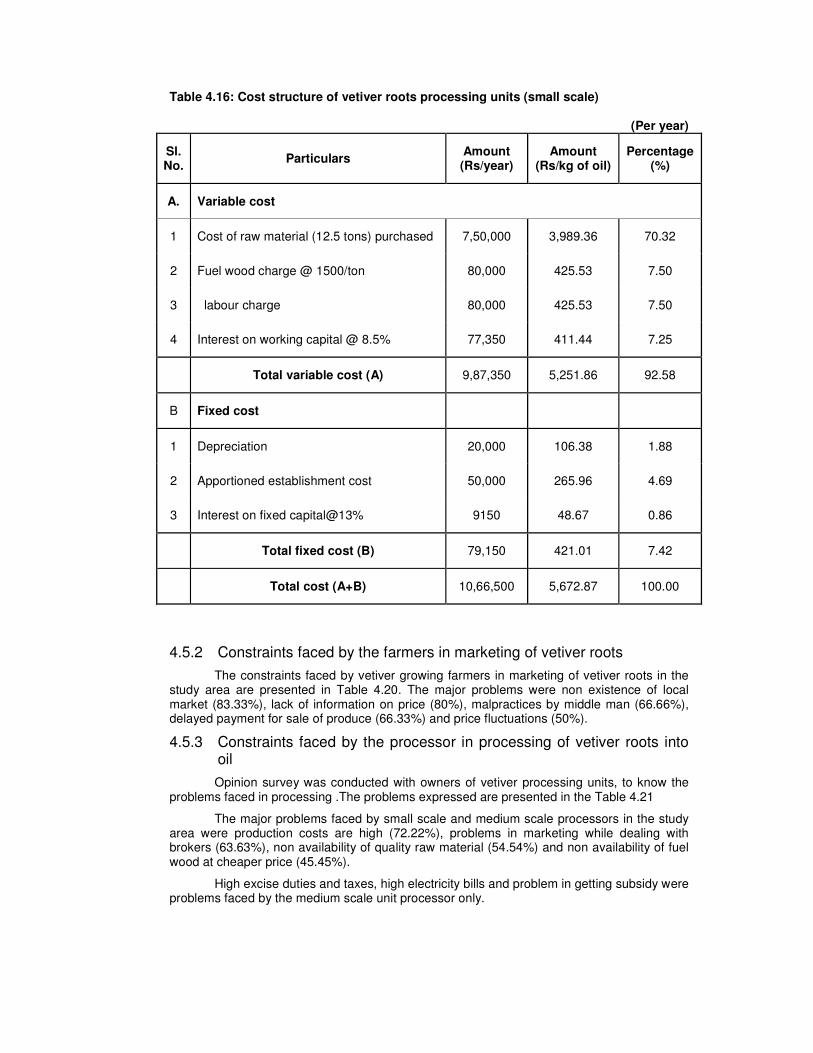
Table 4.16: Cost structure of vetiver roots processing units (small scale)
(Per year)
Sl. No.
Particulars Amount (Rs/year)
Amount (Rs/kg of oil)
Percentage (%)
A. Variable cost
1 Cost of raw material (12.5 tons) purchased 7,50,000 3,989.36 70.32
2 Fuel wood charge @ 1500/ton 80,000 425.53 7.50
3 labour charge 80,000 425.53 7.50
4 Interest on working capital @ 8.5% 77,350 411.44 7.25
Total variable cost (A) 9,87,350 5,251.86 92.58
B Fixed cost
1 Depreciation 20,000 106.38 1.88
2 Apportioned establishment cost 50,000 265.96 4.69
3 Interest on fixed capital@13% 9150 48.67 0.86
Total fixed cost (B) 79,150 421.01 7.42
Total cost (A+B) 10,66,500 5,672.87 100.00
4.5.2 Constraints faced by the farmers in marketing of vetiver roots
The constraints faced by vetiver growing farmers in marketing of vetiver roots in the study area are presented in Table 4.20. The major problems were non existence of local market (83.33%), lack of information on price (80%), malpractices by middle man (66.66%), delayed payment for sale of produce (66.33%) and price fluctuations (50%).
4.5.3 Constraints faced by the processor in processing of vetiver roots into oil
Opinion survey was conducted with owners of vetiver processing units, to know the problems faced in processing .The problems expressed are presented in the Table 4.21
The major problems faced by small scale and medium scale processors in the study area were production costs are high (72.22%), problems in marketing while dealing with brokers (63.63%), non availability of quality raw material (54.54%) and non availability of fuel wood at cheaper price (45.45%).
High excise duties and taxes, high electricity bills and problem in getting subsidy were problems faced by the medium scale unit processor only.

Variable cost
Interest on working capital @ 8.5%
8%
Fuel wood charge @ 1500/ton
8%
Cost of raw material (12.5 tons)
purchased
76%
labour charge
8%
Fig. 6a: Cost structure of vetiver roots processing units (small scale)
Fixed cost
Depreciation
25%
Interest on fixed capital@13%
12%
Apportioned establishment cost
63%
Fig. 6b: Cost structure of vetiver roots processing units (small scale)
Fig. 6b: Cost structure of vetiver roots processing units (small scale)

Table 4.17: Returns structure of vetiver roots processing units (small scale)
Sl. No. Particulars Value (Rs)
1 Output
a) Main product : Vetiver oil 188 kg @Rs. 8000/kg 15,04,000
b) By product : Waste Vetiver roots 10000 kg @Rs. 4/kg 40,000
2 Gross returns 15,44,000
3 Gross returns per ton of vetiver roots processed (Rs) 1,23,520
4 Gross returns per kg of vetiver oil processed (Rs) 8212.76
5 Total cost of processing (Rs/year) 10,66,500
6 Total cost of processing (Rs/kg oil) 5672.87
7 Total cost of processing (Rs/ton) 85,320
8 Net returns (Rs/year) 4,77,500
9 Net returns per kg of vetiver oil processed (Rs) 2539.89
10 Net returns per ton of vetiver roots processed (Rs) 38,200
0
200000
400000
600000
800000
1000000
1200000
1400000
1600000
Va
lue
(Rs.
)
Gross returns Total cost of processing (Rs/year) Net returns (Rs/year)
Fig. 7: Returns structure of vetiver roots processing units (small scale)
Fig. 7: Returns structure of vetiver roots processing units (small scale)

Table 4.18: Financial feasibility of investment in vetiver roots processing units (small scale)
Sl. No. Particulars Unit Value
1 Net Present Value (@13%) Rs in lakhs 15.06
2 Internal Rate of Return Per cent 72
3 Benefit Cost Ratio (@13%) 1.45
4 Pay Back Period Years 1.66
Plate 4: Small scale vetiver processing unit

Table 4.19: Constraints faced by the farmers in production of vetiver roots
(n=60)
Sl. No. Particulars No of
farmers Percentage to total (%)
1. Non availability of genuine planting material 45 75.00
2. Low yield of vetiver roots 55 91.66
3. Lack of extension education 35 58.33
4. Non availability of labour during peak season 50 83.33
5. High labour cost 56 93.33
6. Prevalence of pest and disease 25 41.66
8. High cost of production 57 95.00
9 Decrease in soil fertility over the years 50 83.33
10 Lack of support from the government 20 33.33
Table 4.20: Constraints faced by the farmers in marketing of vetiver roots
Sl. No. Particulars No of farmers Percentage to
total (%)
1. Lack of information on price 48 80.00
2. Non – existence of local markets 50 83.33
3. Malpractices by middle man 40 66.66
4. Price fluctuations 30 50.00
5. Delayed payment for sale of produce 38 63.33

Table 4.21: Constraints faced by the processors
Sl. No Problems No. of
processor Percentage to
total (%)
Small and Medium scale unit (10+1) 11 -
1) Problems in marketing while dealing with brokers 07 63.63
2) Production costs are high 08 72.72
3) Non availability of fuel wood at cheaper price 05 45.45
4) Non availability of quality raw material 06 54.54
Medium scale 01
1) High sale taxes 01 100
2) High electricity bills 01 100
3) Problems in getting subsidy 01 100

5. DISCUSSION
The results of the investigation presented in the preceding chapter are discussed in detail in this chapter. The main focus here is to throw a light on some of the causes responsible for the major trends observed in the findings. This kind of analysis helps to make policy measures and execute corrections that can be implemented to overcome the constraints encountered by vetiver growers and processors. Keeping the objectives of the study in view the results are discussed here under the following heads
5.1 Socio-economic characteristics of the farmers
5.2 Cost and returns structure in vetiver roots production
5.3 Resource use efficiency in vetiver roots production
5.4 Cost and returns structure of vetiver roots processing units
5.5 Constraints faced by vetiver growers and processors.
5.1 Socio-economic characteristics of the farmers
The socio-economic characteristics of the respondents included general features and details of land holdings which are discussed under fallowing sub heads
5.1.1 General features of vetiver farmers
The results revealed that majority of the farmers were educated (93.33 %) and some of them had even completed college level education (5%) and remaining 6.66 per cent of growers were illiterates. As most of the farmers were educated, they could find required information on vetiver production and processing aspects. The main occupation of them was mainly agriculture and again advanced new crop like vetiver was taken up by them. Only a few respondents (three) main occupation was non agriculture. It was also interesting to note that most of the farmers were young indicating better awareness regarding modern farm practices by young aged respondents. Young age coupled with better education might have made them to increase their farm income by adopting an aromatic crop like vetiver
5.1.2 Pattern of land holding
The findings from the Table 4.2 indicated that the percentage area under rainfed was more compared to irrigated land. Vetiver stands better even under rainfed conditions. This rainfed situation suited well to take up this crop besides growing it in hilly areas. This shows that there is more scope for increasing some additional area under vetiver to augment the farm income. The average size of the land holdings was 6.48 acres of which average area under vetiver crop was 4.40 acres. This indicated that vetiver was grown as major crop by the farmers and also they knew the commercial importance of the crop and it’s byproducts. The total area under vetiver in the study area was more than the 264 acres, but as for the 2004-05 data published by the Directorate of horticulture, Bangalore, area under vetiver crop was 220 acres. This is mainly due to the fact that most of farmers growing this crop in Udupi district had encroached area of forests which had been not reported.
5.2 Costs and returns structure in vetiver roots production
Cost structure includes, pattern of employment and quantity of inputs utilized, returns structure includes average yield of vetiver roots per acre. These have been discussed under fallowing sub-heads.
5.2.1 Pattern of employment in vetiver root production.
From Table 4.3 it could be observed that the total requirement of human labour for vetiver roots production per acre was 159.72 man days for different operations, of which harvesting of vetiver roots required the highest labours (78 mandays). These results are in conformity with the findings of Vinayak (2005). Other major operations required more labours were weeding (24 mandays) and planting (18.2).This indicated that the vetiver is labour intensive crop and provided employment and income to rural labours.

5.2.2 Inputs utilization pattern in vetiver roots production
The inputs utilization pattern in vetiver roots production was illustrated in Table 4.4 and the results were indicated that farmers were using only local varieties of vetiver and also they had applied more doses of fertilizers than the recommended level with a view that poor soil fertility status could improve the yield levels and quality.
Farmers used three tons of FYM per acre to maintain the soil fertility and to get good yield. These results are in conformity with the findings of Farooqi and Vasundhara (1997) and Vinayak (2005). Farmers used relatively more machine hours (10 hr) in the main field preparation by using heavy machine like a JCB or Hitachi due to the fact that vetiver was also grown in the hilly areas and also for better roots development. This indicated farmers were using modern farm practices in cultivation of vetiver. Farmers used only 400 ml of plant protection chemicals due to the fact that no serious pest and diseases were noticed in vetiver cultivation.
5.2.3 Cost structure in vetiver roots production
Table 4.5 revealed that the total cost of vetiver roots production per acre was Rs. 51,556 of which variable cost (Rs. 47,262) accounted for more than 91.64 per cent of total cost. These results are contradictory with the findings of Patra et al. (2004 a). In the present study human labour (Rs. 23,955) accounted for higher cost where as in the study conducted by Patra et al. (2004 a), the land preparation and planting were the major items of variable cost. The expenditure on human labour (about 46.46% of the total cost) was more due to fact that wage rate was relatively high in the study area. For harvesting roots more quantity of human labourers were employed hence cost on human labour was more. These results are in conformity with the findings of Vinayak (2005) and Goswami (2000) but contradictory with the findings of Patra et al (2004 a).The components of fixed cost (8.32 % of total cost) was comparatively less due to the lower land rent (Rs. 3200) value in the study area and also crop was taken up in the low fertile soils besides cultivating this crop just by encroaching forest lands for which nothing has been paid or accounted. The total cost was relatively high since farmers used excess inorganic fertilizers.
5.2.4 Returns structure in vetiver roots production
The results from the Table 4.6 revealed that the average yield of vetiver roots was 1500 kg per acre and farmers realized gross returns of Rs. 1, 05,000 per acre. The average price received for vetiver roots was Rs. 7000 per quintal. Net returns per acre were Rs. 53.444 and net returns per kg were Rs. 35.62. A return per rupee expenditure was Rs. 2.03. These results are in line with study conducted by Patra et al (2004 a) on economics of vetiver and Jadhav et al. (2001) on economics of patchouli.
5.3 Resource use efficiency in vetiver roots production
The Cobb-Douglass production function was employed to analyze the relationship between resource use and productivity of vetiver roots using survey data of sample respondents. The results of the production function analysis are summarized in Table 4.7.
Regression co-efficients for slips and labour were positively significant at one per cent and plant protection chemicals and irrigation charges were positively significant at five per cent. This indicated that one per cent increase in cost on slips, labour, plant protection chemicals and irrigation charge would result in increasing the gross income by 0.2892, 0.5497, 0.0073 and 0.0738 per cent respectively. The elasticity of manures and fertilizers was positive but non - significant. Hence, it would not be profitable to further increase expenditure on this resource. In the study area farmers applied excessive fertilizers resulting in growth of vegetative parts but in turn increased pest and diseases menace and also reduced the quality of vetiver roots.
5.3.1 Marginal value product to marginal factor cost
As indicated in Table 4.8, the ratio of marginal value product to the marginal factor cost ratios for slips, labour, plant protection chemicals and irrigation charge were more than one indicating that still there is a scope to use of these inputs to increase the gross returns. The MVP to MFC ratios for manures and fertilizers was less than unity and positive. This
indicated that expenditure on this resource was just little more than the optimum level. These results are in conformity with the findings of Ravishankar (1993).The sum of elasticities were positive and less than unity exhibiting decreasing returns to scale.
5.4 Cost and returns structure of vetiver roots processing units
Cost and returns structure of vetiver roots processing units both small and medium scales units are discussed here under fallowing sub heads.
5.4.1 Cost and returns structure of vetiver roots processing unit (medium scale)
In the present study, the existing only one medium scale processing unit involved in processing of vetiver oil from vetiver roots in the study area was selected for the detailed economic analysis. The investment pattern of vetiver processing unit of medium scale has been presented on Table 4.9. It clearly showed that cost on machinery was the major item followed by the cost on building and land.
The processing unit (medium scale) had a capacity utilization of 35 tons of vetiver roots per annum. They were working eight hours in a day and 150 days in a year. The machineries used in processing of vetiver roots were boilers, condensers, cooling tower and distillation equipments.
From the Table 4.10 is evident that the annual cost for production of vetiver oil during first year was Rs. 11.00 lakhs and increased to Rs. 32.4 lakhs during eighth year. The difference in cost between these years is mainly because vetiver processing unit could not utilize its installed capacity fully to produce vetiver oil in the first year. It utilized half of its capacity and produced only 350 kg oil where as in the eighth year it produced 600 kg oil making full use of its installed capacity. From eighth year on wards cash out flows were assumed to increase at Rs. 2.75 lakh per year up to 30
th year. Though production of vetiver
oil from eighth year to 30th year is assumed to be the same and the returns are increasing
because of increase in expected price in each year.
The net cash flows obtained in vetiver processing unit during first year were Rs. 5.07 lakhs and increased to Rs. 10.2 lakhs during second year, almost double the net cash flows of first year. During second year the vetiver processing unit started utilizing its full installed capacity. The vetiver oil production in the processing unit assumed to be its fullest capacity from eighth year onwards to 30
th year as was in the eighth year of its operation. Thus the net
cash inflows in vetiver processing unit increased from Rs. 57.64 lakhs in eighth year to Rs. 105.45 lakhs in the 30
th year.
The results presented in the Table 4.11 revealed that the total cost of processing vetiver roots per year was Rs. 35,26,451.66 of which variable cost (Rs. 30,67,295) accounted for 86.97 per cent of the total cost. Cost on raw material (Rs. 24, 50,000) was the major item amounted to 69.41 per cent of total cost considering average cost per kg of vetiver roots at Rs. 70. These results are in conformity with the findings of Ravishankar (1993) and Gawas (2002).The cost on raw material (vetiver roots) was little high because some of the vetiver growers had the processing units of small scale, they knew very well that there is higher prices for oil so they were not inclined to give raw material at lower prices and also some of the farmers in the study area took distillation unit on rent basis. Next major variable cost item was cost of fuel (Rs. 1,75,000). The source of fuel was wood which accounted 4.96 per cent of the total cost. Processing of vetiver roots needs more fuel wood in processing. The fuel woods were taken from the forest area which decreased area under forest as revealed by the forest officials. There was strong opposition from the forest officials and environmentalist in the use of fuel wood due to exploitation of forest. Hence, there is a need to develop alternative cheap source of fuel like use of solar energy for this processing industries. The other major component of variable cost incurred was the sales tax which they used to pay in the form of value added tax (VAT) at the rate of four per cent. However, the sales tax on vetiver oil seems to be too high as revealed by the processor. The processor expressed discontent about the higher sales tax (4 %). For this agro based industry, product based tax relaxation should be given by the government to support processing of vetiver roots. The other major cost was the power charges (Rs. 60,000) which accounted 2.83 per cent of the total cost. In the factory for lighting and for use of fans more electricity was consumed which

was charged as per the commercial rates. The other cheap sources like use of solar lights may be tried. The cost of casual labour, cost of packing material, office maintenance and telephone charges were other variable costs which were contributed less than one per cent to the total cost.
The main component of fixed cost in processing of vetiver roots into vetiver oil (Table 4.11) was salaries to permanent labourers (Rs 2, 88,000 /year) which accounted 8.16 per cent of the total cost forming nearly half of the total fixed cost. These results are in contradictory with the findings of Ravishankar (1993). In the present study area eight permanent labourers were employed and all were unskilled but involved in drying and distillation of vetiver roots. For those unskilled labourers, the salaries paid was relatively high led to more cost.The apportioned establishment cost (Rs. 63, 333) was another major item of fixed cost which accounted 1.79 per cent of the total cost since the total investment was 19 lakhs with 30 years of expected life. The other important component of fixed cost was depreciation value on the machinery which accounted 1.41 per cent (Rs. 50, 000) since the values of the machinery was Rs 15 lakhs with 30 years of expected life.
The study revealed from the Table 4.12 that the gross returns obtained per year in processing of vetiver roots were Rs. 49,12,000 of which returns obtained from vetiver oil were Rs. 48,000,00 and returns from the waste roots were Rs. 1,12,000 considering average market price of Rs. 8000 per kg of vetiver oil and Rs. 4 per kg of waste roots. The total net returns per year from vetiver oil and waste roots together amounted to Rs. 13,85,549, while per ton of vetiver roots was Rs. 39,587.11 and net returns per kg of oil were Rs. 2309.24.This indicated that the processing of vetiver roots was profitable.
5.4.1.1 Financial feasibility of investment in vetiver processing unit (medium scale)
The techniques of project evaluation such as net present value, internal rate of return, benefit-cost ratio and payback period (Table 4.13) were employed to assess the financial feasibility of investment on vetiver processing unit. In analyzing the investment feasibility, the establishment costs, maintenance costs and gross returns from the vetiver processing unit (medium scale) were considered at 13 per cent discount rate representing the opportunity cost of capital.
NPV criterion helps to evaluate the benefits accrued and costs incurred during the project life. It is an absolute measure by discounting the net cash inflows. The NPV of vetiver processing unit (medium scale) at 13 per cent discount rate was Rs. 181.06 lakhs. The formal selection criterion of NPV is to accept all the projects with positive values. Applying this principle, net present value of vetiver processing unit (medium scale) under study clearly indicated that investment on vetiver processing unit (medium scale) is financially feasible.
IRR is very suitable measure for evaluating the profitability of investment on different projects. The formal selection criterion of IRR is to accept the projects with IRR more than the opportunity cost of capital. The internal rate of return was 58.10 per cent for vetiver processing unit (medium scale). Since, IRR was more than the opportunity cost of capital it clearly indicated that investment on vetiver processing unit is financially feasible. These results are in conformity with the findings of Ravishankar (1993).
B: C ratio is another tool for appraising the worthiness of investment and it helps to ascertain the profitability of an enterprise. The decision in B-C ratio frame work is to select the projects where the ratio is more than one. The B-C ratio was 1.92 in vetiver processing unit at 13 per cent discount rate which satisfies the rule indicating the worthiness of investment on vetiver processing unit. The B-C ratio indicates expected returns for each rupee of investment in processing unit.
Pay Back Period refers to the time required for the net benefits to equal the cost of the project. In the present study it worked out to 2.33 years for medium scale vetiver processing unit.
5.4.2 Cost and returns structure of vetiver roots processing units (small scale)
The investment pattern in small scale processing units is similar to medium scale processing unit. These processing units (small scale) do not require huge initial investment compared to medium scale processing unit. The investment pattern of vetiver processing

units (small scale) has been presented in Table 4.14. It clearly showed that cost on machinery was the major item followed by the cost on building and land.
The processing units (small scale) had a capacity utilization of 12.5 tons vetiver roots per annum. They were working 8 hours in a day and 60-90 days in a year. The machineries used in processing of vetiver roots were boilers, condensers and distillation equipments.
From Table 4.15 it is evident that the average annual cost of processing of vetiver roots during first year was Rs. 9.5 lakhs and it increased to Rs. 11 lakhs during fourth year. The difference in cost between these years was mainly because of increase in the raw material cost due to simultaneous increase in output price. From fourth year on wards cash out flows were assumed to increase at Rs. 60,000 per year up to eighth year. Though production of vetiver oil from fourth year to eighth year assumed to be the same, the returns are increasing because of increase in expected price in each year.
The net cash flows obtained in vetiver roots processing during first year were Rs. 2.11 lakhs and increased to Rs. 3.02 lakhs during second year due to the vetiver processing units started utilizing its full installed capacity. The vetiver oil processing units assumed to be used its fullest capacity from fourth year onwards to eighth year. Thus, the net cash inflows in vetiver processing units increased from Rs. 4.36 lakhs in fourth year to Rs. 19.4lakhs in the eighth year.
The results presented in Table 4.16 on cost structure of vetiver roots processing units (small scale) per year revealed that the total cost of processing of vetiver roots per year was Rs. 10,66,500. The average total variable cost (Rs. 9,87,350) incurred in processing of vetiver roots into vetiver oil per year was 92.58 per cent of total cost. This is slightly higher compare to medium scale unit due to non employment of permanent labours in distillation of vetiver roots. The cost on raw material (Rs. 7,50,000) was the major item amounted to 70.32 per cent of the total cost considering average cost per kg of vetiver roots at Rs. 60 per kg. These results are in conformity with the findings of Ravishankar (1993). Cost per kg of vetiver roots are slightly lesser than the medium scale unit due to the fact that processing units (small) located in the growing area itself and these processing units were owned by the big farmers so raw material they got slightly at lower rate and also here no transportation cost was involved. Next major variable cost item was cost of fuel (Rs. 80, 000). The source of fuel was wood which accounted 7.50 per cent of the total cost. Small scale processing units need more fuel wood compared to medium scale. The suggestion made in use of fuel woods in medium scale unit holds true in small scale processing units also. The other major cost component of variable cost was the cost on labourers (Rs. 80, 000) which accounted 7.50 per cent of the total cost. These results are in conformity with the findings of Ravishankar (1993). Four labours were involved in distillation of vetiver roots to complete one batch (12 quintal) and to complete one batch 4-6 days required. This was relatively higher compared to the medium scale processing unit. The wages paid to them was relatively high.
The main component of fixed cost in processing of vetiver roots into vetiver oil (Table 4.16) was apportioned establishment cost (Rs. 50,000) which accounted 4.69 per cent of the total cost since the total investment was four lakhs with eight years of expected life. The other important component of fixed cost was depreciation on the machinery which accounted 1.88 per cent (Rs. 20,000) since the cost of the machinery was three lakhs with eight years of expected life.
From Table 4.17 it could be revealed that the gross returns obtained per year in processing of vetiver roots were Rs.15,44,000 of which returns obtained from vetiver oil were Rs. 15, 04,000 and returns from the waste roots were Rs.40,000 considering average market price of Rs. 8000 per kg of vetiver oil and Rs 4 per kg of waste roots respectively. The total net returns per year from vetiver oil and waste roots together amounted to Rs.4,77,500. While, net returns per ton of vetiver roots were Rs. 38,200 and net returns per kg of oil were Rs. 2539.89.This indicated that small scale processing units got higher net returns per kg of oil compared to medium scale.
5.4.2.1 Financial feasibility of investment in vetiver processing units (small scale)
The techniques of project evaluation such as net present value, internal rate of return, benefit-cost ratio and payback period (Table 4.18) were employed to assess the financial feasibility of investment on vetiver processing units. In analyzing the investment feasibility, the

establishment costs, maintenance costs and gross returns from the vetiver processing units (small scale) were considered at 13 per cent discount rate representing the opportunity cost of capital.
NPV criterion helps to evaluate the benefits accrued and costs incurred during the project life. It is an absolute measure by discounting the net cash inflows. The NPV of vetiver processing units (small scale) at 13 per cent discount rate were Rs. 15.06 lakhs. The formal selection criterion of NPV is to accept all the projects with positive values. Applying this principle, net present value of vetiver processing units (small scale) clearly indicated that investment on vetiver processing units (small scale) is financially feasible.
IRR is very suitable measure for evaluating the profitability of investment on different projects. The formal selection criterion of IRR is to accept the projects with IRR more than the opportunity cost of capital. The internal rate of return was 72 per cent for small scale processing units and slightly higher than the medium scale since IRR was more than the opportunity cost of capital it clearly indicated that investment on vetiver processing units (small scale) is financially feasible.
B: C ratio is another tool for appraising the worthiness of investment and it helps to ascertain the profitability of an enterprise. The decision in B-C ratio frame work is to select the projects where the ratio is more than one. The B-C ratio was 1.45 in vetiver processing units at 13 per cent discount rate which satisfies the rule indicating the worthiness of investment on vetiver processing units but which is slightly lesser than medium scale.
Pay Back Period was 1.45 years which is slightly better than the medium scale processing unit. This indicated that small scale processor recovered cost of the project early compared to medium scale.
5.5 Constraints faced by vetiver growers and processors
The constraints faced by the vetiver growers in production and marketing of vetiver roots and constraints in processing of vetiver roots presented in the previous chapter have been briefly discussed under the fallowing sub headings.
5.5.1 Constraints in production of vetiver roots
Vetiver growers in the study area expressed that high cost of production was the major problem (Table 4.19). This problem of high cost was again due to higher labour cost. The working labourers were not available in the study area but the labours were brought from other distant places like Bijapur and Bagalkot districts. Non availability of labourers on time was another severe problem in the study area because vetiver is labour intensive crop but there was a problem of non availability of labourers especially during the peak time of planting, weeding, harvesting and other operations. Low yield of vetiver roots in the study area was also a major problem reported by the farmers. This was due to non availability of genuine planting material and low fertility status of soils. Lack of extension education on modern practices and prevalence of pest and diseases were other problems expressed by the farmers. Similar problems were also reported in the study conducted by Ravishankar (1993)
5.5.2 Constraints in marketing of vetiver roots
It could be seen from Table 4.20 that non-existence of local market for marketing of vetiver roots was the major problem expressed by the respondents and they sold their produce to middle man. Other problems were lack of information on price, malpractices by the middle man, delayed payment for sale of produce and fluctuation in prices of vetiver roots.
5.5.3 Constraints faced by processing of vetiver roots
From Table 4.21 it could be noticed that non existence of a separate local market for selling the vetiver oil was the main problem for both small scale and medium scale processors which was expressed by respondents due to which processors highly dependent on brokers and handling of brokers for sale of oil was a tough task for the processors. Production costs of vetiver oil are high, according to both small scale and medium scale processing unit’s owner’s opinion. This was mainly because of higher price for raw material (vetiver roots). They also felt that non availability of fuel wood at cheaper price due to strong opposition from forest

officials for cutting trees. Non availability of quality raw material was another major difficulties faced by both small and medium scale processors that led to lower yield of vetiver oil.
High sale tax on vetiver oil sale was another problem faced by medium scale processing owner. A high electricity bill was another constraint in medium scale processing unit. It was because, a commercial rate of electricity was charged for this processing unit, where as for agriculture and other operations there are some subsidies on electricity power supply. Subsidy on power supply for this unit may be extended to support the production and processing of vetiver oil. Problem in getting subsidy on initial investment was another problem expressed by the medium scale unit owners.

6. SUMMARY AND POLICY IMPLICATIONS
Cultivation of medicinal and aromatic crops provide sustainable means of natural source of high value industrial raw material for pharmaceutical, agrichemical, food and cosmetic industries. Aromatic crops open up new possibilities for higher level gains for farmers with significant scope for progress in the rural economy. Over the last two decades advancement in research and development, validation of traditional knowledge and general awareness about the importance of aromatic crops among the people have led to the consumers inclination towards naturals giving boost to the market potential and business all over the world.
Substantial increase in exports of medicinal and aromatic crops in recent years has attracted global interest in traditional health system. Commercially, these plant’s derived medicines, essential oil and products are worth about US $ 72 billion (Rs.360,000 crores) worldwide. These include global business of medicinal and herbal material of US $ 60 billion (Rs.300,00 crores).However, India, with large and diverse geographical area gifted with rich plant biodiversity contributes hardly two per cent in the global trade. Interestingly, on the essential oil front, the essential oil crops contribution in the world production is of 1,10,000 ton with an estimated value of US $ 920 million. Brazil is the leader in production with an annual output of 42,000 tonnes followed by USA (21,500 tonnes) and India (16,000 tonnes).However, USA (US $ 240 million) is the leader in terms of value of the essential oils produced. It is closely followed by India (US $ 195 million) and Brazil comes third (US $ 70 million). India contributes about 15 per cent in terms of production and much better in the value with a proportion of 21 per cent. But amazingly, India’s share in world export of essential oil and perfumery materials is merely 0.4 per cent. It is estimated that India’s annual production of medicinal and aromatic crops raw materials is about Rs.6000 crores. Thus the future holds great promise for India in the fast changing global economy as for as production and trade of raw material is concerned.
Commercial cultivation of vetiver is recent origin in the states of Karnataka, Kerala, Tamil Nadu, Andhra Pradesh, Utter Pradesh and Rajasthan. It has been increasing in Karnataka. Again in coastal Karnataka the area under vetiver is spreading faster than ever before. Udupi district has major area under vetiver crop in Karnataka. Presently, out of 93 ha of vetiver area in Karnataka, Udupi district accounts for 88 ha with the production of 259 tons of vetiver roots. It is blessed with diverse agro-climatic conditions as warm and humid places with heavy rain fall are preferred for optimum vetiver cultivation. But not much research work has been carried out on economic aspects of vetiver
Keeping in view of these aspects, the present study is a modest attempt to analyze the production and value addition of vetiver roots into oil with the following specific objectives.
1. To estimate the cost and returns in cultivation of vetiver in the study area
2. To study the resource use efficiency in vetiver production
3. To examine cost and returns structure in the value addition of vetiver roots into oil and
4. To identify the constraints in production and processing of vetiver.
Methodology
Udupi district was selected purposively for the study since this district is having the highest area under vetiver crop as well as processing units in Coastal Karnataka and also in entire Karnataka. In Udupi district, kundhapura taluk was selected purposively for the study as this taluk was the major vetiver growing taluk in Udupi district. In kundhapura taluk, eight villages were selected namely Jadkal, Yaljith, Mudhur, Kollur, Kodiyalkeri, Goliholle, Baindoor and Shelkodu. The sample farmers were selected based on the highest number of growers in the selected villages and larger area under vetiver Thus from Jadkal, Yaljith, Mudhur and Kollur villages 40 farmers were selected (ten farmers from each village) and remaining 20 farmers were selected from the villages namely Kodiyalkeri, Goliholle, Baindoor and Shelkodu (five farmers from each village). Farmers were selected randomly from each village. Thus, total sample size selected for the study was 60. Out of 20 small scale processing units, ten small scale processing units located near the production area were selected. One medium

scale processing unit was working in kundhapura town was also taken for the detail study and analysis was done for this unit separately. Primary data was collected with the aid of well structured and comprehensive schedule exclusively prepared for study.
Tabular analysis was employed for determining costs and returns from vetiver roots production and processing of vetiver roots into oil and also for problems in production, marketing and processing. Standard financial feasibility evaluation techniques viz., NPV, IRR, PBP and BCR were used to find out the economic viability of investment in vetiver processing units. Cobb-Douglas production function analysis was made use for analysis of resource use efficiency.
Major findings of the study
1. General characteristics of farmers in the study area revealed that the average family size of the respondents was 4.63 and majority of respondents (93.33 per cent) were educated. Average age of the respondents was 40.80. The average area under vetiver crop was 4.4 acres (67.90 per cent of total land holding).
2. Farmers employed 159.70 mandays of human labour per acre in different operations of vetiver roots production.
3. Farmers used 3000 slips in nursery preparation per acre. This is almost equal to the recommended slips rate. Farmers used three tonnes of FYM and 119.70: 123.90:103.00 Kg of N: P: K per acre in nutrient forms and this is more than recommended level. About 10.50 machine hours and 400 ml of plant protection chemicals were used by the farmers.
4. The total cost of cultivation of vetiver roots was Rs 51,556 per acre of which cost on human labour (46.46 per cent) was the highest.
5. The total yield of vetiver roots per acre was 1500 kg and corresponding gross returns and net returns were Rs. 1, 05,000 and Rs. 53,444, respectively.
6. The cost of production of roots per kg and net returns per kg were Rs. 31.50 and Rs. 35.62 respectively and returns per rupee of expenditure was 2.03.
7. Regression co-efficients for slips and labour were positively significant at one per cent and plant protection chemicals and irrigation charges were positively significant at five per cent and had positive influence on gross returns. The regression coefficients for manures and fertilizer were non - significant.
8. MVP/MFC ratio were positive for slips (6.74), labour (1.76), plant protection chemicals (1.35) and irrigation charge (7.79) indicating that the resources were underutilized and there is scope for getting higher returns by increasing the use of these resources. The ratio of marginal value product and marginal factor cost was less than unity and positive for manures and fertilizers indicating that these resources were in excessive use i.e. decrease in the use of these inputs would enhance the returns.
9. The total cost of processing of vetiver roots per year estimated at Rs.35, 26,451.66 for medium scale unit and raw material cost (Rs.24, 50,000) accounted for 69.41 per cent of total cost of processing.
10. The total oil yield and waste roots per year in processing unit (medium scale) were 600 kg and 28,000 kg respectively. Gross returns and net returns were Rs.49,12,000 and Rs.13,85,549 per year in processing unit (medium scale).
11. The total cost of processing per kg of oil and net returns per kg of oil were Rs. 5877.41 and Rs. 2309.24 respectively in processing unit (medium scale).
12. In the vetiver roots processing unit (medium scale) NPV was 181.2 lakhs, the IRR (Internal Rate of Return) was 58.10 per cent, the B:C ratio was 1.92 and PBP (Pay Back Period) was 2.33. Thus, indicated that investment made on vetiver processing unit (medium scale) was feasible.

13. The total cost of processing of vetiver roots per year in small scale processing units was estimated at Rs.10, 66,500 and raw material cost (Rs.7, 50,000) accounted for 70.32 per cent of total cost of processing in small scale units.
14. The total oil yield and waste roots per year in small scale processing unit were 188 kg and 10,000 kg respectively and corresponding gross returns and net returns were Rs.15,44,000 and Rs. 4, 77,500 per year.
15. The total cost of processing per kg of oil and net returns per kg of oil were Rs. 5672.87 and Rs. 2539.89 respectively in processing units (small scale).
16. In the small scale processing unit NPV was 15.06 lakhs, the IRR (Internal Rate of Return) was 72 per cent, the B:C ratio was 1.45 and PBP (Pay Back Period) was 1.66, indicating feasibility of investment made on small scale processing units.
17. Problems expressed by vetiver growers were high cost of production, high labour cost, low yield of vetiver roots, non availability of labour, decrease in soil fertility over the years, non availability of genuine planting material, lack of extension education, prevalence of pest and disease and lack of support from the government.
18. Nonexistence of separate local market, lack of information on price, malpractices by middle man, delayed payment for sale of produce and price fluctuations were major marketing problems expressed by the farmers.
19. Small and medium scale processing units owner expressed that problems in marketing of vetiver oil, production costs are high, non availability of fuel wood at cheaper price and non availability of quality raw material besides problems in marketing of vetiver oils. Problems in getting subsidy, high sale taxes and high electricity bill were constraints pertaining to medium scale unit processors.
Policy implications
1. Returns per rupee of expenditure is more in vetiver roots production, so farmers should be encouraged to take up cultivation of the crop on large scale and also cultivation of vetiver helps in preventing the waste lands, barren lands besides providing additional income & employment to rural labourers.
2. In spite of farmer’s enthusiasm to cultivate vetiver, inadequate supply of genuine planting material on large scale at reasonable price was the main limitation for the farmers to take up vetiver roots production on large scale. Therefore genuine planting material should be made available to the farmers through the department of horticulture or research institutes like IIHR and UHS.
3. Lack of technical guidance on package of practices was expressed by the farmers. Therefore, there is a great need for extension activities by the subject matter specialists in SHU’S and department of horticulture to develop standard package of practices.
4. In the study area, there was no contract farming system .Since, vetiver is an aromatic plant of recent origin, practices of production and marketing not much known to the farmers Contract farming can solve most of the prevailing production and marketing problems i.e., genuine planting material, technical guidance, market information and cheating of farmers by middlemen.
5. In view of feasibility of investment in small scale and medium scale processing units, small scale and medium scale entrepreneurs may be encouraged to establish them for development of the vetiver industry.
6. There is a need to provide or develop alternative sources of fuel for the distillation of vetiver oil since, the present practices of using fuel wood as a fuel is ecologically not favorable and costlier.

REFERENCES Aijan, N., Raveendaram, N., Rajamani, K., Indumathi, V. M. and Vennila, A. R., 2008, an
economic analysis of cultivation and marketing of Glorisa in Tamil Nadu. J. Med. Arom. Plant Sci., 10 (4) : 182-195.
Anonymous, 2004, Horticulture Crop Statistics of Karnataka State at a Glance 2004-2005, Director of Horticulture, Lalbagh, Bangalore, Karnataka (India).
Baby, P., Skaria Joy. P. P., Samuel Mathew, Grey Mathew, Ancy Joseph and Ragina Joseph, 2007, Aromatic Plants, New India Publishing Agency, New Delhi, India.
Benerjee, G. D., 2002, Economics of medicinal plant, Financ. Agric., 34 (3) : 34-36.
Bucchbauer Gerhard, 1990, Aroma therapy, do essential oils have therapeutic properties. Perfumer and Flavorist, 15 (4) : 47-50.
Chandran, C., Alagaappan. V. and Manoharan, M. 2001, Resource use efficiency on pepper cultivation. Spice India. 14 (10) : 20-28.
Deebasouaghanayaki and Sundaravaradarjan, K. R., 2007, An Economic analysis of Aloevera cultivation in Tamil Nadu, J. Agril. Mktg., 3 (1) : 4-8.
Deorukhakar, A. C., Nikam, M. B. and Gawas, M. M., 2007, Economic analysis of kokum fruit products in Sindhudurg, India. Int. J. Agric. Sci., 3 (2) : 120-123.
Deshpande, Smitha Bhaskar, Naveen Hegde and Neelakanta, N. T., 2008, Cultivation of medicinal and aromatic crops as a means of diversification in agriculture, institute for social and economical change. Consolidated Rep., Agriculture Development and Rural Transformation Centre, Institute of Social and Economics Change, Nagarbhavi, Bangalore, pp. 73-100.
Dhanakumar, V. G. and Nendran, K., 2003, Aromatic plantation for Agribusiness in India. J. Arecanut, Spices and Medicinal Plants, 5 (1) : 16-19.
Dhiman Mukerjee, 2008, Cultivation of Swetia chirayita : A high value medicinal herb in high attitude. J. Med. Arom. Plant Sci., 30 (1) : 350-355.
Farooqi, A. A. and Vasudhara, M., 1997, Medicinal Plants : Wealth for farmer and health for all. Farm Digest, pp. 2-11.
Farooqi, A. A. and Vasudhara, M., 2001, Cultivation and utilization of Ashwagandha. Nation. Sem. on Transfer of Technology of Medicinal and Aromatic Crops, held at Bangalore, 20-22 February, 2001, pp. 65-71.
Farooqi, A. A., Vasudhara, M. and Srinivasappa, K. N., 2000, A Guide to the Cultivation of commercially important Aromatic crops. Division of Horticulture. Univ. Agric. Sci., Bangalore and Association for Promotion of Medicinal and Aromatic crops, Bangalore.
Farooqi, A. A., Vasudhara, M. and Srinivasappa, K. N., 2001, Patchouli cultivation as an inter crop in plantation. Nation. Sem. on Transfer of Technology of Medicinal and Aromatic Crops, held at Bangalore, 20-22 February, 2001, pp. 182-188.
Gawas, 2002, Economics of processing of kokum fruits in the western Maharashtra. Indian J. Agric. Mktg., 10 (1): 45-48.
Goswami, 2000, Commercial cultivation of Citronella : A cost- benefit analysis. Agric. Situ. India, 57 (1) : 25-28.
Grimshaw, R. G., 1987, Vetiver Gross : Agriculture Division, World Bank, New Delhi. p. 72
Jadhav, M. S., Pagri, B. V., and Vaidkar, R. D., 2001, Production and Marketing of Isabgoal (Herbs), Patchouli (gross) in Maharashtra. Nation. Res. Sem. on Herbal Conservation, Cultivation, Marketing and Utilization with Special Emphasis on Chhattisgarh, p. 93.
Jarial, G. S., 1999, High value farming – Safed musli or Senna. Nation. Bank News Rev., 15 : 16-23.

Kamala Singh, Rajeshwara Rao, B. R., Kothari, S. K., Singh, O. P., Kaul, P. N., and Sushil Kumar, 2000, cultivation of Aromatic crops in south India : problems and prospectus, J. Med. Arom. Plant Sci., 22 (1b) : 218-230.
Mallar Mathi, K. and Pandey, A. P., 2007, An economic evaluation of Guava processing units in Allahabad district of Uttar Pradesh. Agril. Mktg., 4 (4) : 21-24.
Mittal and Singh, S. P., 2007, Shifting from Agriculture to Agribusiness : The case of Aromatic plants. Agric. Econ. Res. Rev., 20 : 541-550.
Muniram, Aparbal Singh, khunuja, S. P. S., Dasharam, chauhan, and Arya, S. J. K., 2005, improved agronomic practices for citronella java cultivation. J. Med. Arom. Plant Sci., 27 (2) : 340-343.
Oudhia, P., 2001, Problems perceived by Safeda musli growers of chhatisgarh (India) region; A study. J. Med. Arom. Plant Sci., 23 (3) : 396-399.
Patra, D. D., Aparbal Singh, Shasany, A. K., Alok Kalra, and Khanuja, S. P. S., 2003, Agro-package for commercial cultivation of menthol mint. J. Med. Arom. Plant Sci., 25 (4) : 1016-1023.
Patra, D. D., Chattopadhyay, Ashok, K., Singh, Tomar, V. K. S., Apabal singh, Misra, H. O, Alam, M. and Khanuja, S. P. S., 2004c, Agro technology of Kalmegh. J. Med. Arom. Plant Sci., 26 (3) : 534-537.
Patra, D. D., Kambod Singh, Misra, H. O., Gupta, A. K., Janardan Singh, Singh, S. C. and Khanuja, S. P. S., 2004 b , Agro technology of Aswagandha. J. Med. Arom. Plant Sci., 26 (2) : 332-335.
Patra, D. D., Sukhmal chand, Apabal singh, Anwar, M., Lal, R. K., Saudan Singh, Bahl, J. R. and Khanuja, S. P. S., 2004a, Agro technology of Vetiver. J. Med. Arom. Plant Sci., 26 (4) : 784-789.
Patra, D. D., Sukhmal chand, Lal, R. K., Bahl, J. R. and Khanuja, S. P. S., 2005, Agro packages for cultivation of Palmorosa, J. Med. Arom. Plant Sci., 27 (4) : 727-735.
Pawar, B. R., and Pawar, D. B., 2008, Resource productivity, resource use efficiency and optimum resource allocation in jasmine flower production in Maharashtra. Int. J. Agric. Sci., 4 (1) : 1-4.
Pawar. B. P. 2005, Economics of processing of kokum fruits in south Konkan region of Maharashtra state, M. Sc. (Agri.) Thesis, Univ. Agric. Sci., Dapoli, Maharashtra (India).
Powar, B. N and Hange, D. S., 2008, Economics of production and marketing of selected medicinal and aromatic plants in western Maharashtra. Indian J. Agric. Mktg., 22 (3) : 129-140.
Prodyut Bijoy Gogoi, 2009, Economic feasibility of patchouli cultivation in Assam. J. Arecanut, Spices and Medicinal Plants, 2 (3) : 100-106.
Puran Mal, Grover, R. K. and Malik. D. P., 2009, Economic analysis of cultivation of safeda musli in Haryana. J. Arecanut, Spices and Medicinal Plants, 2(1) : 1-7.
Purohit, A. N., 2004, Medicinal and aromatic plant sector : Potentials and possibilities.
Purohit, S. S. and Vyas, S. P., 2005, Marketing of medicinal and aromatic plants in Rajasthan, National Consultative Workshop on Medicinal and Aromatic Plants, held at G. B. Pant U.
Raghu, C., 2006, Economics of Production and Marketing of Patchouli in North Karnataka, M. Sc. (Agri.) Thesis, Univ. Agric. Sci., Dharwad, Karnataka (India).
Raghunatha Reddy, N., 1996, Economics of production and processing of Lemongross in Narasimharajapura taluk of Chikkamangalur district, Karnataka. M. Sc (Agri) Thesis, Univ. Agric. Sci., Bangalore, Karnataka (India).

Rajendra, B. and Gupta, G. N., 1964, Design of a steam distillation equipment for vetiver oil. Indian Perfumer, 8 : 87-90.
Rajesh, D. B., 2006, Economic evaluation of Vanilla cultivation in Uttar Kannada district of Karnataka, M. Sc. (Agri.) Thesis, Univ. Agric. Sci., Dharwad, Karnataka (India).
Rajeswara Rao, 2000, Rose- scented Geranium; Indian and international perspective. J. Med. Arom. Plant Sci., 22 (1b) : 302-312.
Rao, J. K. S. 1964. The Vetiver in India, Indian Council of Agricultural Research, New Delhi, p. 40.
Ravishankar, A., 1993, Economics of Production and Processing Davana (Artemisia pallens) in eastern dry zone of Karnataka . M. Sc. (Agri) Thesis, Univ. Agric. Sci., Bangalore, Karnataka (India).
Sanjay Kumar, Yadav. K. P. and Singh. A. K., 2008, Potential and business opportunities in essential oil sectors. J. Med. Arom. Plant Sci., 30 (3) : 336-339.
Sastry, K. N. R. 1998. Socio-economic dimensions of vetiver in rainfed areas of Karnataka, India
Sheikh Abdul Kadar and Ashwini Chairbha, 2010, Profit appraisal of citronella oil extraction plant in Ballapur district. Paper presented in National Seminar on Changing Ethos of Agribusiness Management and Education, Univ. Mysore, 19-20. p-68.
Smitha, P. R., Jayashree. A. H. and Gulegudda. S. S., 2008, Costs, returns and resource use efficiency in Anthorium cultivation in Coorg district. Agric. Situ. India, 15 (9) : 543-596.
Srinivas, T., Raju, V. T. and Shareef, S. M., 1996, Economics of agro-processing : A Case of Cashewnut processing in Andhra Pradesh, Ind. J. Agric. Mktg., 10 : 48-49.
Subrahmanyam, K. V. and Gajanana, T. M., 2001, Economics of Lemongross cultivation and production of oil in Kerala. J. Med. Arom. Plant Sci., 23 (2) : 5-9.
Suman, P. S. Khanuja, 2008, Aroma vision 2020 : Technology path of cultivating today for a fragrant tomorrow. J. Med. Arom. Plant Sci., 30 (2) : 263-266.
Sundar, a., and kambai Raju, S., 2004, Economics of production of Gloriosa superb in Tamil Nadu. Indian J. Arecanut, Spices and Medicinal Plants, 6 (2) : 61-66.
Suneetha, M. S., 1998, Demand and valuation of medicinal plants and producer in the western Ghats of Kerala-A resource economic study. M. Sc. (Agri.) Thesis, Univ. Agric. Sci., Bangalore, Karnataka (India).
Vasudeva, J. K., 1999, High value farming Periwinkle. Nation. Bank News Rev., 15 : 16-23
Venugopal, C. K., Praveen Jholigikar, Umesh. R. N. and Anand. N. M., 2004, Potentials and problems of patchouli cultivation in North Karnataka. Paper presented in Second Global Summit on Medicinal and Aromatic Plants, 2004. New Delhi (India).
Verma. A. R., 2004, Economic analysis of production resource use efficiency, marketing and constraints of Garlic production and marketing in Indoor district of Madhya Pradesh. J. Agril. Mktg., 3 (1) : 37-49.
Verma. A. R., Rajput, A. M. and Patidar, R. S., 2002, Economic analysis of production resource use efficiency, marketing and constraints of onion production and marketing in Indoor district of Madhya Pradesh. J. Agril. Mktg., 3 (1) : 20-28-49.
Vijaykumar, K., 2004, Patchouli and India - A great leaf forward. Nation. Sem. Prospectus and Potential of Medicinal and Aromatic Crops, held at Bangalore, Karnataka (India), 2004, pp. 106-107.
Vinayak, N. V., 2005, Economics of contract farming – A study of Ashwaganda in North Karnataka. M. Sc. (Agri.) Thesis, Univ. Agric. Sci., Dharwad, Karnataka (India).

ECONOMICS OF PRODUCTION AND VALUE
ADDITION TO VETIVER IN COASTAL KARNATAKA
SUNIL H. R. 2010 DR. M. G. KERUTAGI
MAJOR ADVISOR
ABSTRACT
The present study was conducted to focus on economics of production and value addition to vetiver in Udupi district of Coastal Karnataka. The result of the study revealed that farmers employed 159.70 mandays of human labour per acre. The total cost of cultivation of vetiver roots was Rs 51,556 per acre of which cost on human labour (46.46 per cent) was the highest. The gross returns and net returns per acre were Rs. 1, 05,000 and Rs. 53,444, respectively and returns per rupee of expenditure was 2.03. The total cost of processing of vetiver roots and net returns per year in medium scale unit were Rs.35, 26,451 and Rs.13,85,549 respectively. NPV was 181.2 lakhs, IRR was 58.10 per cent, B:C ratio was 1.92 and Pay Back Period was 2.33 years. Thus, indicated that investment made on medium scale processing unit was feasible. The total cost of processing of vetiver roots and net returns per year in small scale units were Rs. 10, 66,500 and Rs. 4, 77,500 respectively.NPV was 15.06 lakhs, IRR was 72 per cent, the B:C ratio was 1.45 and Pay Back Period was 1.66 years. Thus, indicated that investment made on small scale processing units was feasible. High cost of production, high labour cost, low yield of vetiver roots, non availability of labour during peak season and decrease in soil fertility over the years were major problems in production. Non-existence of local markets, lack of information on price and malpractices by middle man were major marketing problems. Problems in getting subsidy, high sales tax and high electricity bill were constraints pertaining to medium scale unit processors. High cost of processing, problems in marketing while dealing with brokers and non availability of quality raw material were the major problems expressed by both small and medium scale processors.