economics research working paper no. 41 - wipo · economic research working paper no. 41 intangible...
TRANSCRIPT

November 2017
Economic Research Working Paper No. 41
Intangible assets and value capture in global value chains: the smartphone industry
Jason DedrickKenneth L. Kraemer

Intangible assets and value capture in global value chains: the smartphone industry Jason Dedrick, Syracuse University* Kenneth L. Kraemer, University of California, Irvine** Abstract This report uses data on individual smart phones as well as industry data to identify which smartphone firms capture the most value in the form of profits. It finds that Apple captures most of the industry profits, thanks to its high prices, large profit margins and the volume of iPhone sales worldwide. Apple’s success is explained as a result of its ability to develop its own intellectual property (IP) and take advantage of IP created by suppliers through a strategy of selling only a few models at high prices compared to competitors. It also benefits from the most valuable brand name in the world. Finally, it maintains exclusive use of its iOS operating system to keep out competitors in its own ecosystem. Its major competitors, Samsung and Huawei earn high margins on their most expensive phones, but their overall margins are reduced by the large number of low-cost products they sell. Smart phones rely on standards that enable them to connect to wireless networks, without which they would have little value. Many suppliers such as Qualcomm, Ericsson, Nokia, and Samsung have been awarded standard essential patents (SEPs) for critical network standards such as 2G, 3G, 4G and Wi-Fi. They license those SEPs to phone makers. These SEP licenses account for about 5% of the cost of an average smart phone, and in some cases are a substantial source of income for the SEP owners, particularly Qualcomm, which earns the majority of its profits from licensing its patents. While there is general agreement that SEPs should be licensed at a fair, reasonable, non-discriminatory (FRAND) rate, there have been disagreements over what those rates should be, leading to lawsuits between licensors and licensees. In spite of these individual disputes, and the industry has thrived, with annual sales topping a billion units in recent years. Established companies and new entrants alike are able to develop products based on the Android operating system, license the necessary SEPs, and leverage the global supply chain to compete in a growing market. Keywords: smartphone industry, global value chains, value capture, intangible assets Disclaimers The views expressed in this paper are those of the author and do not necessarily reflect the views of the World Intellectual Property Organization or its member states.
* Professor in the School of Information Studies, Syracuse University, [email protected]. ** Research Professor, Paul Merage School of Business, Associate Director of the Center for Research on Information Technology and Organizations (CRITO), and Co-Director of the Personal Computing Industry Center (PCIC) at UC Irvine, [email protected].

Acknowledgements The authors are grateful for the helpful input of commentators at the WIPO Workshop on Intangible Assets in March 2017, and those of Robin Stitzing, Tim Pohlmann and Sacha Wunsch-Vincent. We are also grateful to John Gantz and IDC (International Data Corporation) for providing data from IDC’s Worldwide Mobile Phone Tracker Database, to IHS Markit for providing teardown reports for the Apple, Huawei and Samsung smartphones in the study, and to IPlytics for information on standard essential patents.

1
Introduction Technology, business innovations, trade liberalization and falling transportation costs have led to reorganization of global value chains (GVCs) in a variety of industries. Key elements of this reorganization include the unbundling of value chain activities - the production process and the geographical dispersion of different production stages, as determined by markets, wage costs and technological capability. The distribution of GVCs is well understood as a result of numerous studies over the last decade (Linden et. al., 2009; Gereffi, 2005; Sturgeon, 2002). However, the role of intangible assets – in the form of technological knowledge, software, workers’ skills, business and organizational know-how, innovative design, reputation and other elements – is less well understood. Intangible assets are related to the functioning of GVCs in at least two important ways (WIPO, 2016). First, the organization of international supply chains such as the location of labor-intensive manufacturing in lower-wage economies entails the transmission of some associated technological and business knowledge to those economies. Such knowledge is often subject to various forms of intellectual property (IP) rights, including registered IP such as patents and industrial designs and unregistered IP such as trade secrets. Second, intangible assets shape success in the marketplace and thus determine how value is distributed within GVCs. These phenomena can be seen clearly in the smartphone industry. Smartphones are cellular telephones with an integrated computer and operating system that provide the ability to run a wide variety of software applications. They are small, highly complex, produced in massive volumes by global value chains and used all over the world, giving testimony to the value of their functionality and design. This paper offers a perspective on the role of intangible assets in determining value capture in the smartphone industry. While there are hundreds of companies making and selling smartphones, a few dominate the market, and one—Apple—captures most of the profits in the industry. Samsung is both the largest phone maker and a major component supplier and makes profits from both. Huawei is a recent challenger in smartphones and sources components from its own subsidiaries. It also develops infrastructure equipment through its networking business. Samsung and Huawei contribute to the development of cellular connectivity standards, as does Apple to a smaller extent. These three companies, their products and their GVCs are the focus of this analysis. Besides the phone makers, there are also major component suppliers that enjoy high margins, such as chip maker Qualcomm, and more specialized firms, such as ARM (which licenses its processor designs to chip manufacturers). Qualcomm and other technology companies also contribute heavily to the development of telecommunications and connectivity standards fundamental to the smartphone’s functioning. We use an established methodology for quantifying the value captured at the phone, firm and country level for three phones – Apple’s iPhone 9, Samsung’s Galaxy 7 and Huawei’s P9. We examine the role of intangible assets in the creation and capture of value in individual smartphones and in the smartphone industry. We then use academic studies and databases to assess the value captured by owners of Standard Essential Patents (SEPs), which are patents essential to a specific technical standard, such as complementary cellular technologies that enable connectivity and interoperability between phones, base stations and networks. We examine four kinds of intangible assets: IP, brand, design and strategy. We find that license fees paid by smartphone makers for SEPs are about five percent of the retail price of a smartphone, but do not create competitive advantage as all phone makers can use the standards and are subject to these fees. By contrast, other IP such as implementation and design patents can be a source of competitive advantage when combined with effective strategies. We find that

2
brand identity is an important asset in creating demand for smartphones, especially higher-priced phones for status-conscious consumers. Brand name is a driver of value capture and can be a substantial share of the market value of companies such as Apple and Samsung. Design also creates value by differentiating products. However, the value of these intangibles is not easy to sustain, as some market leaders have lost most or all of their market share in just a few years.
1 Nature and evolution of the smartphone industry While cellular handsets have been integrating more functions since their introduction, industry supply chains in mobile communications, as in the broader electronics industry, have been steadily disaggregating across corporate and national boundaries (Li and Whalley, 2002; Dedrick et., al., 2011). Large integrated companies such as Nokia, Motorola, Ericsson and NTT DoCoMo developed communications technology enabling cellular connectivity, built infrastructure equipment such as base stations, made key components, and designed, manufactured and distributed their own handsets. There is still a degree of vertical integration in the industry, e.g., Samsung’s production of smartphones, displays, memory and other components, and Apple’s design of its own application processor chips and operating system. But more often these activities are carried out in a vast global network spanning the semiconductor, computer, communications, consumer electronics and software markets. Newcomers such as Huawei, Xiaomi and Oppo can leverage this global supply chain, the open nature of cellular and wireless telecommunications standards, and adopt the ubiquitous Android operating system from Google to enter the market and grab handset market share from incumbents. Mobile carriers such as AT&T, Verizon, Sprint, Deutsche Telekom and China Telecom focus on building, maintaining and upgrading the cellular communications infrastructure and sell voice and data services smartphone users. Standard-setting organizations such as ETSI and IEEE develop various network interconnection standards such as the cellular connectivity standards and WiFi. Companies with significant cellular patents (e.g., Qualcomm, Nokia, Ericsson, Alcatel-Lucent, Interdigital, LG, and Huawei) contribute their patented technology to the development of these open standards, and can thus collect licensing fees for their standard-essential patents (SEPs) on smartphones and other equipment that employ those standards. They create innovations that are both fundamental and complementary to the smartphone and enable greater speed, bandwidth and network stability to support technologies such as video streaming and other data-intensive activities. Apple’s iPhone, based on its proprietary iOS operating system and A-series application processors leads the industry in revenues and profits. Meanwhile, over 1000 companies including Samsung and Huawei are making a variety of products based on Google’s Android operating system and processors from Qualcomm and others. Samsung and Huawei are more vertically integrated than most other smartphone makers in terms of the activities in the value chain that they perform internally versus sourcing outside. Significantly, Apple owns its App Store as well as the operating system, thereby giving it greater control over its platform, relationship with users and revenue capture. Google controls the Google Play store used by the majority of Android users and captures revenues from downloads, and content sales and subscriptions, whereas Samsung and Huawei do not capture any.

3
1.1 Evolving nature of demand/market Over the last 20 years, cellular telephones have shifted from analog to digital, and from basic phones used for voice communications to smartphones used mainly for data communications and applications. Although there were earlier versions of smartphones,1 the big shift occurred in 2007 with the introduction of the Apple iPhone, which set the dominant design for such phones (Dedrick, et. al., 2011). It is significant to note that the iPhone evolution coincided with the evolution of cellular connectivity to provide fast wireless data transfer to make the smartphone possible. There were also concurrent advances in Wi-Fi to complement cellular connectivity. This is not to downplay the substantial innovation by Apple but rather to point out the complementarity of smartphones with other technologies.2 The smartphone industry has grown from 123.9 million units sold in 2007 to $1,471 million in 2016 (IDC, 2017).3 The total value of shipments in the industry grew from $52 billion in 2007 to $425.2 billion in 2015 (Table 1). Growth slowed considerably in 2016, with only $418 billion in the value of shipments as the market is becoming saturated. Whereas past growth of the smartphone market has come from developed economies such as the United States, Japan and Europe, as well as the huge China market, most of the growth now is coming in developing countries, led by India. The average selling price of a smartphone remained in the range of $425 from 2007 to 2011, and then started falling to $283 in 2016 (Table 1). Before 2011, performance gains in semiconductors, communications and other technologies were used to increase the capabilities of smartphones while maintaining stable prices. Since then, competition has driven prices and margins down even as the capabilities of smartphones continued to increase. Since 2007, there have been two dominant firms in the industry at any given time (Table 2). However, the initial leaders, Nokia and Blackberry (formerly RIM), have almost disappeared from the market, while Apple and Samsung have taken their places with 35.8% of shipments and 65% of revenues in 2015 (Top Two Firms in Table 1), although their share declined in 2016 to 59% of total value of shipments. The fact that their revenue shares are nearly double their share of shipments reflects the higher prices they are able to charge. More striking is that Apple was estimated to capture 91% of the operating profits in the third quarter of 2016 even as its sales had declined (Kharpal, 2016).
1 For example, NTT DoCoMo’s iMode offered short messaging, while RIM’s Blackberry devices included email and security features in addition to basic phone capabilities. The Nokia N-series devices released since 2005 combined advanced multimedia and camera features with support for 3D Java games. 2 This Qualcomm slide deck presents a good overview of the technological evolution to 4G LTE and LTE-advanced: https://www.qualcomm.com/media/documents/files/the-evolution-of-mobile-technologies-1g-to-2g-to-3g-to-4ghttps://www.qualcomm.com/media/documents/files/the-evolution-of-mobile-technologies-1g-to-2g-to-3g-to-4g-lte.pdflte.pdf. 3 The database used for the smartphone industry was provided to the authors from the International Data Corporation, which tracks data on the industry quarterly. The data provided includes unit sales, value of sales and ASP (average selling price for about 375 companies from 2005-2016.

4
Table 1: Worldwide industry sales, smartphones, 2005-2016 Top 2 Firms 2007 2008 2009 2010 2011 2012 2013 2014 2015 2016 Shipments/Total 59% 56% 59% 49% 38% 49% 46% 39% 38% 35.8 Value/Total 57% 50% 51% 47% 50% 64% 65% 63% 65% 59% Top 20 firms Shipments 99% 98% 85% 84% Value 98% 94% 93% 94% Industry Total Shipments (M) 124 157 173 305 494 727 1,019 1,306 1,437 1,473 Value (US$ Billion)
$52 $65 $73 $130 $210 $280 $340 $393 $425 $418
ASP (US$) $419 $414 $422 $426 $425 $385 $334 $301 $296 $283 Source: IDC Worldwide Mobile Phone Tracker, 2017. Industry total is based on 385 smartphone makers. Table 2: Shift in Top 2 firms by year (based on value of shipments) 2007 2008 2009 2010 2011 2012 2013 2014 2015 2016 Nokia
Nokia Nokia
Apple
Apple Apple Samsung
Apple Apple Apple
Black- berry
Blackberry
Apple
Nokia
Samsung
Samsung
Apple Samsung
Samsung
Samsung
Source: IDC Worldwide Mobile Phone Tracker, 2017 The top 20 smartphone makers commanded 99% of all shipments and 98% of the value of shipments in 2007, but the industry has become less consolidated, with the top 20 accounting for 85% of units shipped and 93% of the value of shipments in 2016. This was due to the large number of producers that have entered the market and shifting membership in the top 20 (Table 1). For instance, Chinese phone makers Xiaomi, OPPO and Vivo were not even in the market in 2010, and were in the top 10 in units sold by 2016 (IDC, 2017, Quarterly Mobile Phone Tracker). 1.2 Brands and demand Growth in the industry has been accompanied by volatility among the market leaders. The leading brands in 2005, Nokia and Blackberry with 61 percent of the shipments and 57 percent of revenues, were no longer even in top 20 firms in 2016 (Tables 3 and 4). In contrast, newcomers Apple and Samsung held 38% of shipments and 65% of revenues in 2016. Huawei, which first came on the scene in 2010 jumped to third place in 2015 with 7% of shipments and 5% of revenues thanks to its leading position in the world’s largest market, China, as well as in Europe and other markets. The proliferation of brands has been aided by the open nature of the cellular connectivity standards and the resulting availability of standardized baseband chipsets from Qualcomm (at the high end) and Taiwan Province of China’s MediaTek (at the low end), which are available to all phone makers, reducing the cost of entry for newcomers. Entry also has been aided by the

5
Android operating system, which is available at very little cost to all firms. Google created, supports and upgrades the open source Android operating system, which can be modified and adapted by phone makers. Developers can create programs for Android using the free Android software developer kit. Table 3: Smartphone market shares by percent of units sold Company 2007 2008 2009 2010 2011 2012 2013 2014 2015 2016 Samsung 1.8% 3.6% 3.2% 7.5% 19.1% 30.2% 31.1% 24.4% 22.3% 21.1% Apple 3.0% 9.1% 14.5% 15.6% 18.8% 18.7% 15.1% 14.8% 16.1% 14.6% Huawei -- -- -- 0.6% 3.5% 4.0% 4.8% 5.7% 7.4% 9.5% Xiaomi -- -- -- -- -- 0.9% 1.8% 4.4% 4.9% 3.6% LG -- -- -- -- 4.3% 3.6% 4.7% 4.5% 4.2% 3.7% Lenovo 0.0% 0.0% 0.0% 0.2% 0.7% 3.3% 4.5% 4.6% 3.0% 3.5% Motorola 6.1% 5.7% 3.3% 4.6% 3.8% 2.3% 1.2% 2.6% 2.1% * HTC 2.4% 4.8% 4.7% 7.2% 8.8% 4.4% 2.2% 1.6% 1.3% 1.0% Nokia 49.2% 40.2% 39.1% 32.8% 15.6% 4.8% 3.0% 2.9% 0.6% * BlackBerry 9.9% 15.6% 19.9% 16.0% 10.3% 4.5% 1.9% 0.4% 0.3% .05% Note: Chinese firms ZTE, OPPO, and vivo have moved up with 3.2%, 6.8% and 2.6% of industry shipments respectively. Source: IDC Worldwide Mobile Phone Tracker, 2017. *Nokia’s smartphone business was bought by Microsoft and Motorola by Lenovo. Together the top 6 Chinese firms account for 40% of global shipments. Table 4: Smartphone market share by percent of revenues Company 2007 2008 2009 2010 2011 2012 2013 2014 2015 2016 Apple 4.2% 13.1% 21.4% 25.7% 31.6% 33.2% 30.1% 33.4% 39.0% 35.6% Samsung 2.1% 3.7% 3.4% 8.6% 18.3% 31.0% 35.2% 29.7% 25.9% 23.7% Huawei -- -- -- 0.2% 1.3% 1.8% 2.3% 3.3% 5.1% 7.7% LG -- 0.3% 0.3% 2.0% 3.8% 3.4% 4.5% 4.2% 3.5% 2.3% Xiaomi -- -- -- -- -- 0.6% 1.2% 2.2% 2.4% 1.9% Motorola 5.3% 4.9% 2.8% 5.2% 3.7% 2.2% 1.2% 2.5% 1.8% * HTC 3.1% 6.2% 5.3% 8.0% 9.3% 4.6% 2.9% 2.1% 1.5% 0.9% Lenovo 0.0% 0.0% 0.0% 0.1% 0.3% 1.2% 1.5% 1.6% 1.1% 2.3% Nokia 46.4% 34.0% 29.8% 21.6% 9.6% 3.6% 2.6% 1.9% 0.4% * BlackBerry 10.3% 15.9% 20.9% 15.8% 9.7% 3.9% 2.2% 0.5% 0.3% 0.1% Note: Chinese firms ZTE, OPPO, and vivo have moved up with 1.3%, 5.7%, and 4.7% of industry revenues respectively. Together the top 6 Chinese firms account for 32% of value of shipments globally. Source: IDC Worldwide Mobile Phone Tracker 2017. *See table above.

6
Android and the rich supplier base have been a double-edged sword for the industry. While they enabled new firms to enter the market, the ease of entry wreaked havoc on the average selling price of phones for all firms except Apple. The average price of an iPhone from 2007 to 2016 ranged from $594 to $690 whereas the average price of Android phones ranged from $403 to $2144 (Table 5). Table 5: Average selling price of smartphones by operating system Year 2007 2008 2009 2010 2011 2012 2013 2014 2015 2016 Operating System
ASP ASP ASP ASP ASP ASP ASP ASP ASP ASP
iOS (Apple) $594 $621 $623 $703 $712 $686 $669 $680 $716 $690 Android (Google) $403 $435 $441 $380 $318 $272 $237 $217 $214 Source: IDC Worldwide Mobile Phone Tracker, 2017. This is similar to the PC market with DOS and then Windows being available to any PC maker (Dedrick and Kraemer, 1998). With PCs, Microsoft charges for Windows and captures the largest share of profits in the industry (Dedrick, et al., 2011). While Android is available for free, it is not without cost. Android is a trademark of Google and if phone makers want to run the Android operating system on their phones, they need a license which requires them to install the Google ecosystem (Search, Play Store, Maps, Drive) on their phone.6 Google also excludes phone makers from any revenue of the Play Store. Moreover, firms that tried to compete with other operating systems than Android failed. Nokia, which initially supported the Symbian OS, adopted Microsoft’s Windows Phone OS in 2011 and ended up selling its handset business to Microsoft in 2013. Microsoft continued to sell feature phones under the Nokia brand until 2016 before shuttering that business in 2016. Nokia is now licensing its brand to HMD Global which produces a range of Android smartphones. Blackberry lost almost all of its market share, and now sells Android as well as Blackberry phones.
4 In a similar analysis, The Wall Street Journal reported that the average price of an iPhone was $687 (among six models on the market), with prices ranging from $449 to $749 while the average price for an Android smartphone was $254, with Samsung’s six models ranging in price from $144 to $768 (Christopher Mims, “In smartphone market, its luxury or rock bottom”, The Wall Street Journal, February 1, 2015). 6 Note that Google’s alleged practice of steering customers to its own shopping service led to a $2.7 billion fine from the European Union in 2017. Google also faces an ongoing antitrust case over the Android operating system (Shaban and Fung, 2017).

7
1.3 Location of value chain activities The location of value chain activities for the smartphone industry is similar to that for the electronics industry generally (Table 6). R&D and design usually occurs near the company’s headquarters and in other locations with access to needed talent and in key markets. Design and development can be distributed between the home country and the location of contract manufacturers’ development teams. Final assembly has been concentrated in low-cost locations near the supply chain in China and East Asia. Table 6: Location of activities in the global value chain of the smartphone industry Activity Standard
setting R&D, design, sourcing
Development and Engineering
Production Manufacture of key components
Final Assembly
Apple International cellular, Wifi, etc. standards committees
U.S. U.S./Taiwan, Province of China
US/Japan/Korea/ Taiwan, Province of China/China
China, India (as of 2017)
Samsung Korea Korea Korea/Japan/US/ China
Korea, Vietnam, China, India, Brazil, Indonesia*
Huawei China China China/Korea China, India *Final assembly for Samsung’s Galaxy phones is in Gumi, Korea (Segan, 2014). Sources: IHS Markit Teardown analyses, Information Week, Nov 21, 2016; Business Korea, 28 January 2015. Apple Corporate Responsibility. http://www.apple.com/supplier-responsibility/progress-report/ 1.4 Determinants of location The primary factors determining the location of R&D and design are the home country of the firm and the availability of scientists and engineers, design professionals and universities that produce such people. Apple’s R&D and design remain concentrated in Silicon Valley, while Samsung’s are in Seoul and Huawei’s in Shenzhen, China. Development and engineering are done jointly by the lead firm and engineers from contract manufacturers at facilities close to the location of final assembly. Location is driven by short product life cycles and need to design for manufacturability, which includes doing pilot production in the actual plants where mass production will occur. The location of manufacturing and final assembly are driven partly by market access but mostly by labor cost and proximity to the supply chain. Samsung has moved half of its mobile phone production to Vietnam, which is now a low-cost location and close enough to China to support with the existing supply chain (Cho, 2015). A large labor pool and the ability to scale up or down in response to market demand are important for final assembly. Local government tax incentives and help with import/export processing also shape location decisions.

8
The bills of material for the three smartphones in this study show that the suppliers of parts and components are located mainly in the U.S., Japan, Korea, Taiwan, Province of China and China. However, there are many upstream suppliers throughout Asia and probably in the U.S. and Europe as well. Looking at Apple’s list of top 200 suppliers (not just for iPhones), 346 have facilities in China, 126 in Japan, 69 in the U.S. and 41 in Taiwan, Province of China, with only 38 in all of Europe (http://www.apple.com/supplier-responsibility/progress-report/ ). Almost every supplier has at least one facility in China, regardless of their home country, showing the importance of the local supply chain. However, as illustrated by these data about Apple suppliers, it is difficult to connect production of specific parts and components to particular plant locations. 1.5 How policy shapes organization of value chains Some activities in smartphone value chains are shifting their location in response to demand. Now, growth is occurring in developing countries such as India, Russia, Brazil, and Indonesia and other economies of Asia, Africa and Latin America. As these markets become important, their governments provide incentives and exert pressures on the phone makers to locate some activity locally in exchange for market access. Samsung, Huawei and Xiaomi already have assembly facilities in places such as China, Vietnam, India, Brazil and Indonesia in response to such forces. Apple’s recent decision to set up production in India (through one of its Taiwanese, Province of China, contract manufacturers) was in response to market demand and government incentives (Phadnisi, 2016 http://timesofindia.indiatimes.com/business/indiahttp://timesofindia.indiatimes.com/business/india-business/apple-plans-to-make-iphones-in-bengaluru-from-april/articleshow/56246016.cmsbusiness/apple-plans-to-make-iphones-in-bengaluru-from-april/articleshow/56246016.cms). Although offshore operations may start with assembly activities, the ambition (of the host government, if not the firm) often is to move up the value chain to the manufacture of parts and components. Ironically, Donald Trump has called for Apple to set up production in the U.S., where iPhones have never been assembled, even though Apple is a U.S. company. Apple has responded that it sourced $50 billion in 2016 from U.S.-based suppliers, and said that it would work to increase that amount (http://mobile.reuters.com/article/idUSKBN16728Q). It also announced a plan to set up a $1 billion fund to invest in U.S. companies that perform advanced manufacturing (Nellis, 2017), and provided Corning with $200 million to develop new glass technologies at Corning’s plant in Kentucky, the home state of Senate majority leader Mitch McConnell (Goel, 2017). 1.6 Innovation in the value chain Product and process innovation occur throughout smartphone value chains, and there is also innovation in the fundamental and complementary technologies that are critical to smartphone capabilities. These innovations occur in generations, such as 2G, 3G, 4G and LTE, and take years to develop and more to fully deploy across the networks before the benefits can be enjoyed. R&D investment in mobile communications is estimated at up to $100 billion per year (Mallinson, 2016). As an example, Nokia’s portfolios containing fundamental SEPs for both cellular and WiFi are the result of over 115 billion euros in R&D investments over the last 20 years (http://www.nokia.com/en_int/investors/investorhttp://www.nokia.com/en_int/investors/investor-relations-events/capital-markets-dayrelations-events/capital-markets-day).

9
Within the smartphone value chain, the lead firms such as Apple, Samsung and Huawei innovate constantly in technology implementation and design for phones. For example, the new A-10 integrated application processor in the iPhone 7 was developed by Apple and is fabricated by the Taiwanese (Province of China) semiconductor manufacturer TSMC in the closely coordinated fabless/foundry relationship that marks much of the chip industry. Innovation also stems from component suppliers, especially semiconductor makers such as Samsung, Qualcomm, Broadcom, Intel, Nvidia, Avago, Analog Devices, Sony and many others, as well as suppliers of batteries, displays and a wide range of software apps. Apple tends to work with innovators outside the company, developing exclusive contracts with them for jointly developed innovations. However, it also has purchased companies that offer core capability or distinguishing feature such as voice recognition and artificial intelligence. For example, Apple bought Siri, Inc. and related companies for voice control software (https://en.wikipedia.org/wiki/List_of_mergers_and_acquisitions_by_Apple). Recently, Apple has announced that it is developing its own capability in graphics processing units (GPUs) rather than continue to buy from Imagination Technologies Group, PLC because it considers this technology key to future developments in virtual reality and artificial intelligence and wants complete control over it (Bradshaw, 2017). Samsung and Huawei, which are large, multidivisional companies, tend to rely more on internal innovation from their subsidiaries. Samsung still relies on outside suppliers for many components to provide functionality in its phones. Samsung is unique in that it innovates both as a lead firm and component supplier. It furnishes key components including processors, NAND flash memory, DRAM memory and displays to other phone makers (including Apple). The phone makers and their suppliers all make large investments in R&D. Apple spent $10 billion or 4.6% of revenues on R&D in 2016, up from just $2.4 billion in 2012 (https://www.google.com/finance?fstype=ii&q=nasdaq:aapl). Samsung has made huge investments R&D and design to catch up with Apple in smartphones and to innovate in its core technology products, spending $13.2 billion or 5.6% of revenues in 2015 (Price Waterhouse, 2015, i1000 database). S emiconductor firms typically spend 10% to 25% of their revenues on R&D, driving much of the innovation in the industry (http://www.icinsights.com/news/bulletins/Semiconductor-RD-Growthhttp://www.icinsights.com/news/bulletins/Semiconductor-RD-Growth-Slows-In-2015/Slows-In-2015/), such as Qualcomm spending $3.7 billion or 23.1% of revenues on R&D in 2015 (http://www.icinsights.com/news/bulletins/Semiconductor-RD-Growth-Slows-In-2015/). 2. VALUE CAPTURE IN SMARTPHONES 2.1. Analytical approach Our framework for measuring and mapping the value created and captured along a value chain is shown in Figure 1 and explained as follows. Within a value chain, each producer purchases inputs and then adds value, which then becomes part of the cost of the next stage of production. The sum of the value added by everyone in the chain equals the final product price. The natural

10
starting point for estimating these values is a map of a value chain showing the activities involved in passing from raw material to the consumer.5 Figure 1: Generic smartphone value chain
Moving from left to right, every smartphone is enabled by complementary technology that enables communication with the network and with other phones. Firms such as Ericsson, InterDigital, Nokia, Qualcomm and others contribute their patented technology to the development of the open cellular and WiFi standards. Their standard-essential patents can be licensed by phone makers on FRAND (fair, reasonable, and non-discriminatory) terms, facilitating market access for downstream manufacturers. Each smartphone has a large number of components. Most are low-value components, such as capacitors and resistors that cost only pennies each as IP cost is typically not included in component prices. Although the manufacturers of these components earn profits, they account for a small share of the value added along the supply chain. There also are some mechanical parts, such as the body of a smartphone that can be quite costly to design and manufacture. Most smartphones also contain a few high-value components, such as a visual display, memory, storage or key integrated circuits. These components, which are themselves complicated systems, are the most likely to embody proprietary knowledge that helps to differentiate the final product and to command a commensurately high margin (although as we’ll see, fierce competition in some of these markets has driven margins down). By virtue of their high cost, these inputs will usually account for a relatively large share of total value added. Innovation is rapid in these components, and accounts for much of the rapid innovation in final products. These complex components may have their own multinational supply chains. For example, an integrated circuit might be designed by a U.S. company but fabricated by a contractor in Taiwan, Province of China and encased in its final packaging in Malaysia before being shipped to a product assembly plant. For the assembly of these components into the final product, a number of large multinationals, such as Flextronics, Foxconn, Pegatron, and Wistron provide assembly services. These assemblers compete fiercely for high-volume opportunities, limiting their margins. Apple outsources all of its production, while Samsung, Lenovo, and Huawei now outsource part of their production to these contractors.
5 The supply chain analysis method used in this paper has previously been applied in studies of notebook computers, the iPod and cellular handsets (Linden et al., 2009; Dedrick et al., 2011) where it is explained in detail.

11
Finally, coordinating the value chain, the lead firm contributes its market knowledge, intellectual property, system integration and cost management skills, and a brand name whose value reflects its reputation for quality, innovation, and customer service. Lead firms can create value by transforming the innovations of others into products that consumers find useful and usable. They may also handle distribution through their own retail and online stores, other retail outlets such as Best Buy and carriers such as AT&T, Verizon and China Mobile. Using this diagram as a guide, we calculate the value captured at each stage of the value chain by estimating the selling price of that stage’s output and subtracting the cost of all purchased inputs. A product-level study, such as we are undertaking, allows us to break out the value embedded in an innovative product and clarifies how it is distributed across the many participants in the value chain. Aggregating this firm-level data, we are able to make an initial estimate of the distribution of value by country as well. In aggregating firm level data to the country level, we assign value capture to the home country of each firm even though the location of production might be elsewhere. 2.2 Data sources and definitions The analysis here is based on product-level data, which are extremely hard to obtain directly from electronics industry firms, who guard information about the pricing deals they have negotiated and often compel the silence of their suppliers and contractors through nondisclosure agreements. However, for some electronic products, lists of components and their estimated factory prices are available from industry analysts, such as IHS Markit whose teardowns we use here. These “teardown” reports are often cited in the press. Our analysis leads to an estimate of the handset maker’s product-level gross profit, or, when expressed in percentage terms, gross margin (See Box 1). Since teardown reports do not include license fees for the intellectual property in smartphones, we have obtained estimates for SEP licenses from other sources (Mallinson, 2015; Galetovic et al., 2015, 2016; Sidak, 2016) and add these to the analysis. Firm-level information about pure value added is not readily available because publicly-listed companies do not generally reveal the amount of their wages for “direct labor” (workers who are involved in converting inputs to a salable product). Instead, the wage bill is hidden within “cost of goods sold” or “cost of sales.” Therefore, the number we will use to estimate the value captured by suppliers is “gross profit,” also called “gross margin,” the difference between “net sales” and “cost of goods sold.” Gross profit data are readily available from annual reports in the case of public companies. Figure 2 shows the difference between value added and gross profit. The red area includes the components of value added and the blue area includes the components of gross profit, or value captured by the firm

12
Figure 2: Components of value added and gross profit
Gross profit is just one measure of financial value captured by a firm. It is related to the more-familiar concept of net profit as follows:
Wholesale price
- Cost of Goods Sold (purchased inputs, IP and direct labor) = Gross profit
- Overhead costs (R&D, depreciation, marketing, sales generation and administrative expenses) = Operating profit
- Interest expenses, taxes, and one-time adjustments = Net profit Gross profit shows what share of a firm’s sales price is retained after the direct costs of producing a product are deducted. Those funds can then be used to invest in future growth (R&D), cover the cost of capital depreciation, pay overhead expenses (marketing and administration), and reward shareholders (dividends). It is an appropriate concept for the product-specific level of analysis that we use in most of this paper because it abstracts from the company’s administrative efficiency (reflected in operating profit) and from non-production factors such as the firm’s leverage and its investments in other firms (reflected in net profit). Operating profit also reflects R&D, which typically applies to many different product lines in a non-proportional way, and depreciation, which is an accounting number that may have little to do with the actual economic decay of (or flow of services from) plant and equipment. Our attention is concentrated on brand name vendors and suppliers of high-value components. In cases where the supplier is not identified in the teardown report, we conduct additional research to identify possible sources. For many components, handset makers use multiple sources, and a teardown report will identify only one of these. With the exception of memory chips, this is less likely to affect high-value components, which are often specifically engineered for a particular phone manufacturer. Since the prices of components change over time, our goal is to derive an estimate that reflects values within a few months of the phone’s introduction. 2.3. Inside phones Using teardown reports from IHS Markit, we compared the key parts in three cell phone models made by the leading smartphone companies in 2015 – Apple, Samsung and Huawei. Table 7 shows how the three systems compare in terms of their key inputs as a percentage of the cost of goods sold (the total of the inputs). In all three phones, the most expensive single input–up to 20% of the total–is the display/touchscreen module, which must be compact and high-resolution. The applications/baseband processers range from 16% to 20%. Memory and storage are also a significant expense area, accounting for about 10-15% of the cost in all three models. The

13
smartphone enclosures are around 8%. Most of the remaining cost is taken up by the camera module, the battery, printed circuit boards, sensors, and the assembly of components into the final product. Each of these accounts for between 1% and 7% of the cost of goods sold, with details shown in Table 7. Beyond these physical components are the operating systems and the licenses for intellectual property. Apple develops its own operating system (iOS) and its cost is part of the firm R&D expenditures, which were $10 billion or 5% of sales in 2016. Samsung and Huawei, and all of the other phone makers, use the Android operating system which was developed and is maintained by Google. The input cost of Google’s Android operating system is unknown, but it is not free to phone makers. Google requires phone makers who wish to use the Android logo on their phones to preload their phones with software that benefits Google, including Search, the App Store, Drive, Maps and others. Some phone makers also develop custom interfaces for Android to try to differentiate themselves. These are real costs, but their values are unknown. Table 7: Comparison of Inputs as Percentage of Cost of Goods Sold: Three Smartphones Note: IP licenses for SEPs are a percentage of factory cost here whereas Figures 4-7 show IP licenses as a percentage of retail cost, so the values are larger here.
Function Apple iPhone 7 Samsung Galaxy 7
Huawei P9
Number of Parts 1814 1518 1773 Display/touchscreen 15.9% 20.5% 16.8% Apps processors/baseband 10.2% 18.1% 14.3% Storage 4.5% 5.2% 4.2% Memory 6.1% 10.1% 7.3% Enclosure 8.2% 8.6% 7.8% Camera 7.4% 5.7% 4.9% RF/PA 3.3% 6.1% % Accessories 4.0% -- -- Main PCB 2.4% 3.5% 5.2%
WLAN/ Bluetooth 2.8% 1.5% 1.0% Battery 0.9% 1.2% 2.1% Power management 1.1% 1.5% 1.0% Sensors 1.6% 1.7% 2.4% Subtotal for key components 72.7% 71.3% 63.6% Hundreds of other components 13.0% 18.2% 21.8% Assembly 2.2% 1.6 2.4% Total factory cost 88.0% 88.9% 88.0% Software iOS* Android** Android** IP licenses for SEPs 12.0% 11.1% 12.0% Cost of goods sold 100% 100% 100%
Source: Authors’ calculations. *iOS is part of Apple’s R&D expenses.

14
**Android is “free,” but phone makers must pre-install Google Search, Google Play and other Google apps, but do not receive any income from these apps. Some phone makers invest in R&D to create their own user interfaces in an effort to differentiate themselves from the many Android-based phones. All phone makers also use and license common intellectual property that was contributed by others, predominantly in the form of Standard Essential Patents. SEPs relate primarily to open connectivity standards such as the fundamental cellular communication standards that enable connectivity between the phone and the cellular network infrastructure. Taken together, licensing royalties for SEPs are an input cost equal to around 5% of the cost of the phone. A more detailed accounting of the key inputs in each phone is given in Appendix tables A-1 to A-3. As suggested by the similarities in price breakdowns between the columns in Table 7, smartphone architectures (e.g. touchscreens, chips, enclosure) have come together around a dominant design that basically imitates the original iPhone, which replaced earlier designs such as clamshell and flip phones. 2.4. Value captured per phone along the value chain Next we turn to a consideration of value capture along the value chain. We start by looking at component suppliers and the lead firm, with the results for suppliers broken down as follows: U.S.-based, Japan, China, South Korea, Taiwan, Province of China, Europe and Location unidentified. Supplier value capture Supplier value capture is estimated by applying each supplier’s 2015 gross margin to the value of the input it supplied to the phone, as detailed in the Appendix tables. Where the supplier is unknown, we applied 33%, the average gross margin for 270 of the leading global electronics firms for 2015 as reported in the Price Waterhouse “Innovation 1000” listing (Price Waterhouse, 2015, i1000 database). Table 8 shows the share of gross profits by the home country of suppliers. (Appendix Table 14 shows the names of the key component suppliers for each phone maker.) Each cell of the table represents our estimate of the value captured by suppliers in a particular country as a share of all supplier profits, not including the value captured by the lead firm through internal production, but including the profits of the independent subsidiaries of Samsung (Samsung Semiconductor, Samsung Electromechanical, and Samsung SDI) as Korean suppliers. It also includes HiSilicon which is a subsidiary of Huawei as a Chinese supplier for the Huawei P9. From 13.6% to 30.3% of the aggregate supplier profits in each phone could not be tied to a firm or country.

15
Table 8: Value capture for suppliers as percent of total supplier gross profits Phone U.S.
based suppliers
Japan- based Suppliers
Korea-based suppliers
China-based suppliers
Taiwan,- Province of China based suppliers
Europe- based Suppliers
Supplier location unidentified
Total
Apple iPhone 7
29.0%
11.8%
9.1%
0.3% 29.2%*
2.7%
17.4%
100%
Samsung Galaxy S7
45.2%
5.8%
28.1% 0% 0%
0%
20.9%
100%
Huawei P9
7.5% 4.8% 20.3% 32.3% 5.2 % 0% 29.9% 100%
*The A10 processor, which is designed by Apple and manufactured by Taiwan, Province of China’s TSMC, is treated as belonging to a Taiwan, Province of China supplier, as we assume the price in the teardown is what Apple pays TSMC for fabricating the chip. Allocating it to Apple would change the distribution significantly, as the gross profit on this chip is the highest value of any component in the iPhone 7. The geographical data in Table 8, suggests a relationship between lead firm nationality and supplier choice. The role of U.S.-based suppliers ranges from 29% to 45% for the handsets from the U.S. and Korea, but is only 9% in Huawei’s P9 phone. Korean suppliers accounted for 31% of the gross profits of suppliers for Samsung, while Chinese suppliers accounted for 34% of gross profits of suppliers for Huawei. Smartphone firm value capture We refer to the retail prices of smartphones to drive the analysis of how much value is captured by particular firms and countries. Table 9 shows these lead firm gross profits in dollar terms and compares them with the gross profits of all suppliers. In all three cases, the gross profit of the lead firm is far more than the combined gross profits of all the suppliers. Table 9: Estimated Gross Profits of Phone Makers and Suppliers Phone Worldwide
Retail price
Handset Maker Gross
Profit
Lead Firm
HQ Location
Total Gross Profits For all
Suppliers
Apple iPhone 7 $649 $283 US $70.71
Samsung Galaxy S7
$672 $228 Korea $76.45
Huawei P9 $483 $188 China $47.09 Source: IHS and authors’ calculations. Samsung and Huawei include profits from components produced internally.

16
Value capture by country Figures 4- 6 below show the value captured in dollar terms as a percent of the retail price of a smartphone for each of the three phones. For example, Apple captures 42% of the retail price of each iPhone sold or $270. The figures below also show the value captured by firms which are headquartered in a particular country. For example, besides Apple there are other U.S.-headquartered companies that capture value from the iPhone equal to 3% of the retail price of an iPhone or $21. These figures do not necessarily mean that production occurs in the U.S. We do not know where it occurs, because firms have multiple subsidiaries in multiple countries. But we do know that the company is headquartered in the U.S. and therefore assign value capture to the firm’s home country. Of course, the headquarters country is where R&D, IP, design, marketing and distribution are performed or at least coordinated. Apple and Huawei actually have the same gross margin for their high-end smartphones, at 42%. This is even though Huawei’s selling price is much lower, thanks to its reliance on low cost components that it makes internally, sources from its subsidiary Hi-Silicon, or sources from other low cost suppliers. Samsung follows at 34%. Samsung’s margin is hurt by its greater reliance on retailers and carriers to sell its products. Apple sells a significant share of its products in its 450 Apple Stores and 23 Internet retail shopping websites around the world.6 Huawei operates a chain of over 35,000 retail stores in 170 countries and plans to add another 15,000 in 2017.7 One half of these stores (17,500) are in Asia. The stores not only carry the full range of Huawei phones but also carry many other electronics products. Of course it costs money to run those stores, which add significantly to Huawei’s overhead costs.
6 Farfan, Barbara (2016). Apple computer retail store global location, https://www.thebalance.com/apple-retailhttps://www.thebalance.com/apple-retail-stores-global-locations-2892925, Updated October 12stores-global-locations-2892925, Updated October 12, 2016. 7 Huawei’s numbers are highly inflated as it counts stores run by merchants and carriers in its numbers and many of its stores are primarily for products other than phones. Heifeng, He, Huawei plans 15,000 new retail stores around the world this year, South China Morning Post, http://www.scmp.com/tech/chinahttp://www.scmp.com/tech/china-tech/article/1995146/huawei-plans-15000-new-retail-stores-around-world-yeartech/article/1995146/huawei-plans-15000-new-retail-stores-around-world-year, Updated Tuesday, July 26, 2016.

17
Figure 4 Value capture for iPhone 7
Figure 5: Value Capture for Samsung Galaxy S7
Source: Authors’ calculations.
IP licenses % 5
Distribution % 15
Apple 42 %
Other U.S. % 3
% 0 Taiwan , Province of China
% 3
Japan 1 %
South Korea % 1
Unidentified material
% 5
Cost of materials
% 22
Labor (China) 1 %
Unidentified labor 2 %
Source: Authors’ calculations.
IP licenses % 5
Distribution 20 %
Samsung % 34
Other South Korea 3 %
Japan % 1
U.S. % 5
Unidentified material
% 7
Cost of material
% 23
Labor ) China ( % 1
Unidentified labor % 2
18
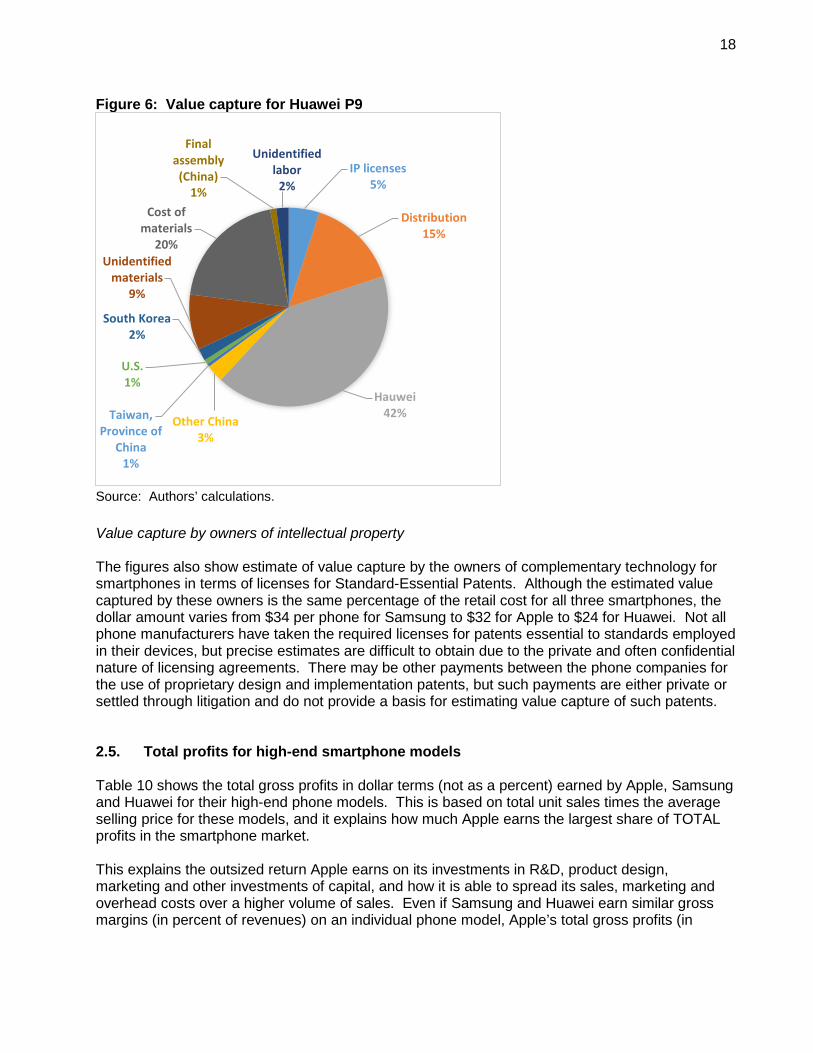
Figure 6: Value capture for Huawei P9
Value capture by owners of intellectual property The figures also show estimate of value capture by the owners of complementary technology for smartphones in terms of licenses for Standard-Essential Patents. Although the estimated value captured by these owners is the same percentage of the retail cost for all three smartphones, the dollar amount varies from $34 per phone for Samsung to $32 for Apple to $24 for Huawei. Not all phone manufacturers have taken the required licenses for patents essential to standards employed in their devices, but precise estimates are difficult to obtain due to the private and often confidential nature of licensing agreements. There may be other payments between the phone companies for the use of proprietary design and implementation patents, but such payments are either private or settled through litigation and do not provide a basis for estimating value capture of such patents. 2.5. Total profits for high-end smartphone models Table 10 shows the total gross profits in dollar terms (not as a percent) earned by Apple, Samsung and Huawei for their high-end phone models. This is based on total unit sales times the average selling price for these models, and it explains how much Apple earns the largest share of TOTAL profits in the smartphone market. This explains the outsized return Apple earns on its investments in R&D, product design, marketing and other investments of capital, and how it is able to spread its sales, marketing and overhead costs over a higher volume of sales. Even if Samsung and Huawei earn similar gross margins (in percent of revenues) on an individual phone model, Apple’s total gross profits (in
Source: Authors’ calculations.
IP licenses 5 %
Distribution 15 %
Hauwei % 42
Other China 3 %
Taiwan , Province of
China 1 %
U.S. % 1
South Korea % 2
Unidentified materials
% 9
Cost of materials
% 20
Final assembly ( ) China
1 %
Unidentified labor
% 2

19
dollars) is much larger than Samsung and Huawei’s profits. This is because Apple sells many more high-end phones. Implications: The key difference among the three companies is not the gross margin they earn on a single phone, but how many of those high margin phones they can sell. With its strategy of focusing on high-margin phones only, Apple was able to capture 73% of the gross profits for the high-end products of the three leading smart phone makers in 2015 and 2016 combined (Table 10). Table 10: Comparison of gross profits for premium phone models in 2015-2016
Smartphone model
Global ASP
Mfg cost
Gross profit Worldwide Total gross
profits Share of total
(IDC) (IHS) per unit shipments (IDC)
Apple iPhone 6 (2015) $748 0.42 $314.06 106,789,685 $33,538,409,615 Apple iPhone 7 (2016) $726 0.42 $304.91 89,136,826 $27,178,617,679 Apple total $60,717,027,293 73% Samsung Galaxy 6 (2015) $733 0.34 $249.22 22,866,189 $5,698,712,814 Samsung Galaxy S7 (2016) $705 0.34 $239.64 49,077,520
$11,760,928,205 Samsung total $17,459,641,019 21% Huawei P8 (2015) $298 0.42 $125.04 13,472,253 $1,684,626,687 Huawei P9 (2016) $428 0.42 $179.57 16,376,205 $2,940,683,978 Huawei total $4,625,310,665 6% Total for 3 companies $82,801,978,977 100% Note: ASPs can differ from the retail price used from teardowns in Table 9 and Figures 4-6 depending on different configurations sold. For instance, most iPhone buyers might choose configurations with more memory, and pay a higher price than the retail price in the teardowns. 2.6. Value capture by component suppliers There is a wide variance in revenues and profitability of the many suppliers to the smartphone makers. Qualcomm, stands out for its outsized profits, which is a result of its control of core intellectual property in key standards and the performance of its baseband chipsets. These factors drive its profitable chip sales and even more profitable licensing business.8 If Apple earns 80-90% of the profits in the smartphone business, Qualcomm dominates its segments of the mobile chip market. Even Samsung, with all of its semiconductor design and manufacturing prowess, uses
8 Qualcomm developed the first digital cellular standard based on CDMA, and continues to contribute patented technology to cellular standard generations to the current 4G LTE standard and the upcoming next-generation 5G.

20
three Qualcomm chips, including the baseband processor, worth a total of $57.54 in the Galaxy 7, making it by far the largest external supplier in that phone (Table A2). Meanwhile, Apple has started using Intel processors in some of the iPhone 7 models, including the model in our analysis. Intel had missed the emergence of the smartphone and is still catching up to provide mobile chipsets. Apple also has become unhappy with Qualcomm’s licensing fees. Apple is suing Qualcomm for $1 billion over rebates that Qualcomm allegedly failed to pay Apple after Apple cooperated with a Korean antitrust case against Qualcomm (Decker et al, 2017). It also has announced that it will not pay Qualcomm the licensing fees that Qualcomm is charging, and will take Qualcomm to court to decide the issue (Freeman, 2017). Qualcomm’s main competitor in the baseband processor market is Taiwan, Province of China’s MediaTek, but Qualcomm has 60% of the market by revenue compared to MediaTek’s 19% http://marketrealist.com/2015/12/competition-picks-qualcomm/ Qualcomm’s margins are far higher than those of MediaTek, which mostly sells to low price phone makers. Qualcomm Gross Margin = 61%, Operating margin = 22.4% MediaTek Gross Margin = 35%, Operating margin = 8.4% Source: Financial Times Markets Data, https://markets.ft.com/data Among the other suppliers to the smartphone market, there is a wide range of profitability (Table A4). Chipmakers’ gross margins range from Analog Devices’ 65% down to Micron’s 20%. TSMC, which manufactures chips for Apple, Qualcomm and others earns 49% gross margins. In markets such as displays and memory, which are more commodified, the dominant player, Samsung, earns 60% gross margins, while memory maker Micron Technologies settles for a 20% gross margin and a 2% operating margin. Japan Display has a 7% gross margin, and a -2.3% operating margin. Japanese specialist Murata, which makes high-end capacitors has gross margins of 38% and operating margins of 18%. By contrast, giant contract manufacturer and component maker Hon Hai/Foxconn, which manufactures most iPhones, has a gross margin of 7% and an operating margin of 4%. It employs 1.3 million workers. However, its subsidiary, Foxconn Technology, which makes enclosures for the iPhone, has gross margins of 18% and operating margin of 15%, and employs just 46,000. These are entirely different businesses under one parent company. For suppliers, it is a high-risk, high-return business. R&D investments are very high and there is no guarantee of a return. Being selected as a supplier for a high-volume product leads to large sales, but a large customer can exert downward pressure on component prices because the threat of being replaced by another supplier is always present. 3 Value capture from intangible assets in smartphones The gross profit from a smartphone and its components can be considered in part a measure of the value of intangible assets that are owned by members of the value chain. The ability to sell a smartphone at a profit depends largely on its innovative features, design, performance, operating software, and ability to function on a network and run applications. It also depends on the brand name and marketing associated with the product. While there is a good deal of labor involved in designing and marketing a smartphone, success depends as much on knowledge (an intangible) as on effort. Even the regiments of lawyers that Apple and others employ help maintain profit margins by their success in the frequent litigation that marks the industry. However, the importance of intangibles actually goes further, and is a part of the cost of the physical product. The value of the raw materials that make up a smartphone, and the labor, energy and other physical inputs that go into making and delivering the phone to a customer, is

21
quite low compared to the price of the inputs. For instance, the value of an integrated circuit mainly comes from the knowledge (an intangible asset) required to design and manufacture a chip. Even the value of the extremely expensive equipment that is used to manufacture these chips is more a function of the knowledge embedded in that equipment than in the cost of actually making the equipment. So, while it is difficult to put a value on all of the intangible assets embodied in a smartphone, it is clearly very large. Here we discuss the elements of intangible assets associated with smartphones, including patents, design, and brand value. However, this picture is necessarily incomplete, as it includes only the intangibles associated with the brand name phone makers and major suppliers. We do not examine the upstream suppliers (e.g., of the glass in a display or the plastics in an enclosure). We also do not try to analyze the larger ecosystem, which includes providers of complementary assets (e.g., apps and accessories), and the mobile carriers that make huge investments to provide the network infrastructure that the devices use. 3.1 Intellectual Property Concepts: Patents There are two types of patents issued by the U.S. Patent Office, utility and design patents. a. Utility— given for a new and useful process, machine, manufacture or composition of matter or a new and useful improvement. Last up to 20 years. 90% of patent documents issued by USPTO are utility patents (also called patents for invention). b. Design—new, original and ornamental design embodied in or applied to an article of manufacture. Last for 14 years. An example is an Apple design patent on the iPhone, which it claimed was infringed by Samsung, and which is currently in litigation (Liptak and Geol, 2016). Utility patents can be divided into two categories for the purposes of this report. a. Implementation patents. These patents cover innovations that can be used to improve a product relative to competing products. These include things like user interface features (e.g., swipe to shut down), mapping, accelerometer, voice recognition/expert system or other hardware and software features that add value to a smartphone. Licensing fees for implementation patents are negotiated between the patent holder and the user (sometimes via lawsuits). b. Standard essential patents (SEP). These patents cover technologies that are incorporated into technical standards by standard setting organizations (SSO). These technologies are needed to make the product function in a network such as cellular, WiFi, GPS or Bluetooth. 3.2 Standard essential patents There are many patents considered essential to technology standards, referred to as “standard-essential patents (SEP)”, subject to licensing on “fair, reasonable and non-discriminatory” (FRAND) terms by firms that use those standards in their products (Farrar, et al., 2007). Smartphones employ a number of such standards, in order to enable interoperability, for example, with cellular and Wi-Fi networks the h.264 video coding standard used in smartphones is another example of an open standard with essential patents subject to licensing on FRAND terms. These innovations provide the foundation for the other innovation that happens in the smartphone

22
industry. As a result, smartphone manufacturers have to pay to license these patents from their owners. This may require direct royalty payments on top of the cost of the components and systems that embody those patents, or there may be a cross-licensing agreement between the parties. Such royalty payments to the owners of SEPs are necessary to compensate for the innovation and their permission to let standard-setting organizations use proprietary technology in their standards. For instance, Qualcomm has a number of SEPs relating to cellular connectivity. It sells integrated circuits to phone makers embodying those patents, but even if a phone maker does not use any Qualcomm chips, it still may have to pay royalties to Qualcomm for use of its SEPs. This is seen in the company’s annual financials, where revenues are divided between Qualcomm CDMA Technologies (QTC), which comprises sales of ICs, software and services, and Qualcomm Technology Licensing (QTL), which licenses its IP portfolio of patents essential or useful in wireless product including CDMA2000, WCDMA, CDMA TDD, and LTE standards. Two-thirds of Qualcomm’s revenues in 2016 were from chip sales ($15,409 million) whereas one-third were from licensing its technology ($7,664 million). However, QTL (Qualcomm Technology Licensing) earned $6,528 million before taxes (an 85% operating margin), while QCT (Qualcomm CDMA Technologies) earned $1,812 million (a 12% operating margin) (Annual Report, 2016, p. 46). Overall, the company’s operating margin was 33.8%, but the licensing business earned a much higher margin than the sales of equipment and services illustrating the value of IP. It is not clear how Qualcomm’s R&D expenses, which total 22% of revenue (Qualcomm 10-K, 2016, p.43) is divided between QTL and QCT, or the division of SG&A expenses, but, in any case, the margins for technology licensing would remain much higher than for chip sales. Qualcomm reported total device sales by its licensees of $267 billion in 2016, so its $7.6 billion in licensing revenue would represent 2.85% of the revenues of its licensees (Qualcomm 10-K, 2015). However, total smartphone sales were over $423 billion (Galetovic, et al., 2016) (there were many phone makers that were apparently not Qualcomm licensees), so Qualcomm’s licensing revenues would be less than 2% of the total revenues of the industry. According to its most recent financial statements, Qualcomm licensing fees equaled 2.3% of the global sales of devices using its patented technologies in the second quarter of fiscal 2017 (Qualcomm, 2017). This data shows Qualcomm’s licensing fees as a share of global smartphone sales have been falling. Qualcomm agreed with the Chinese government to charge royalty rates of up to 5% for CDMA and WCDMA devices and 3.5% for 4G devices that do not implement CDMA or WCDMA, using a royalty base of 65% of the net selling price of the phone (list price minus retail and distribution). This is equivalent to 3.25% royalty rate on every 3G phone sold in China, and 2.275 percent for every 4G device (Yoshida, 2015). http://www.eetimes.com/document.asp?doc_id=1325631. Qualcomm states that certain licensees in China are not fully complying with the obligations. However, Qualcomm has signed agreements with nine of the ten largest Chinese smartphone OEMs, including Vivo and Oppo (Forbes, 2016). There are many other firms that claim ownership of standard-essential patents for smartphones. For LTE phone baseband processors, these include Motorola, Alcatel-Lucent, Huawei, Ericsson, Nokia, Nortel, ZTE, Siemens, Interdigital, Via Licensing, Sisvel Patent Pool, and Vodafone. Table 11 identifies the 20 organizations with the largest number of patents declared as essential to GSM, UMTS or LTE standards. According to IPlytics, there are 35,752 patents associated with these standards. These can be narrowed down into 9060 patent families, which includes a set of either patent applications or publications taken in multiple countries to protect a single invention by a common inventor and then patented in more.

23
In another analysis, Via Licensing analyzed 55,606 LTE standards patents that had been filed with the European Technology Standards Institute. Via grouped these into 5915 patent families, then further removed patents declared after the LTE Release 8 cutoff date, patents for infrastructure only, and patent families lacking a US, European or Patent Cooperation Treaty family member. This left 2,071 patent families that Via considered truly essential LTE handset patents. If a similar process were applied to the 9060 patent families identified by IPlytics, we might see a smaller number of patent families overall and for each firm (Siino, 2017). Table 11: Standard essential patents associated with GSM, UMTS and LTE standards
Assignee Patent Count
Patent Family Count
QUALCOMM Incorporated 5,133 851 Samsung Electronics Co. Ltd. 3,528 964 LG Electronics Inc. 3,520 520 Nokia Corporation 3,056 833 InterDigital, Inc. 2,820 469 Ericsson 2,272 606 Huawei Technologies Co., Ltd. 1,925 990 NTT DOCOMO, Inc. 1,254 334 Google Inc. 1,079 393 Panasonic Corporation 830 176 BlackBerry Limited 808 162 Highbridge Principal Strategies Llc 787 29 Siemens Aktiengesellschaft 627 157 Intel Corporation 604 55 NEC Corporation 515 141 2011 Intellectual Property Asset Trust 506 89 Apple Inc. 467 128 Sony Corporation 436 96 Alcatel-Lucent 371 117 Innovative Sonic Limited 351 86
Notes: A patent family is a set of either patent applications or publications taken in multiple countries to protect a single invention by a common inventor and then patented in more than one country Unique patents for GSM, UMTS and LTE equal 35,752, Unique family counts equals 9060. Source: IPlytics, 2017. Another supplier which earns revenues from IP licensing is Ericsson, once a major mobile phone maker which is now mostly a manufacturer of network infrastructure equipment. Ericsson has 39,000 patents and reported $1.6 billion in IPR revenues for 2015. If Ericsson’s licensees had a similar device revenue as Qualcomm’s ($251 billion), its royalty rate would be 0.6%. This would be consistent with a reported cross-licensing agreement with Apple, which is reported to involve Apple paying 0.5% of its revenues on iPads and iPhones to Ericsson (Nordenstam & Swahnberg, 2015). Unfortunately, however, most suppliers do not report licensing income as a separate item in their income statements, and some of those who have SEPs in smartphone standards have diverse

24
businesses that go well beyond mobile phones (e.g., Nortel9and Siemens), so their reported licensing fees wouldn’t necessarily apply only to mobile phones. Although IP is spread across the value chain, there are no estimates of IP value other than license fees for SEP patents. Several studies have been done in an effort to develop realistic estimates of these costs and they suggest that SEP license costs range from 3% to 5% of the retail price of a smartphone. Malinson’s 2014 estimates have been updated and confirmed by more recent analysis by Galetovic et al (2016), who identified total royalties for smartphone SEPs of $14.3 billion, equal to 3.4% of the value of smartphones shipped ($423 billion). Galetovic et al., (2016) conduct several sensitivity analyses to identify the impacts of non-license paying phone makers (reducing industry revenues to just cover license-paying firms), and adding possible unreported licensing revenues, and come up with an upper bound estimate of 5.5%. Sidak (2016) estimates that aggregate SEP royalty payments were between 4 and 5 percent of global handset revenues using 3G and 4G standards in 2013 and 2014. Table 12: Mobile SEP Licensing Fee Revenues and Royalty Yields on Global Handset Market
20 14 Revenues Yield*
Major SEP owners with licensing programs: Alcatel-Lucent, Ericsson, Nokia, InterDigital, Qualcomm
$10.6 billion
2.6%
Patent Pools: SIPRO (WCDMA), Via Licensing (LTE), Sisvel (LTE)
<$4 billion <1%
Others: including Apple, Huawei, RIM, Samsung, LG <$6 billion <1.5% Cumulative maximum: fees and yield for mobile SEPs ~$20 billion ~5% * Yields are total licensing fee revenues including lump sums and running royalties as a percentage of $410 billion in total global handset revenues. Source: Malinson (2014). Galetovic et al (2016) put SEP license costs in perspective by comparing them to other costs in the smartphone value chain. These “other costs” are not the cost of IP, but of the components themselves, e.g., baseband processors, other semiconductors and other costs as shown in Figure 7.
9 Nortel’s patent portfolio was bought by consortium consisting of Apple, Microsoft, Sony and RIM. https://www.theguardian.com/technology/2011/jul/01/nortel-patents-sold-apple-sony-microsoft.

25
Figure 7: SEP licenses compared to other costs in the smartphone value chain (2015)
Source: Galetovic, et al, 2016, Figure 2, Mobile Phone Economics (2015). As a result of our review, we conclude the following about patents:
• Much patent activity is around standards-essential patents (SEP) embedded in various communications standards (e.g., cellular connectivity in the form of the 2G, 3G, and current 4G standard generations, Wi-Fi), which ensure interoperability of devices with networks and other devices. These standards and their essential patents make the modern smartphone possible and are thus complementary to other innovation. They do not offer any competitive advantage to individual phone firms, but are critical to the diffusion of new generations of smartphones and networks. The cost of SEP royalties equals 3-4% of total smartphone revenues. For firms that actually pay royalties, the rate may be as much as 5%.
• Implementation patents involve technologies that can provide differentiation for specific products of individual manufacturers. For instance, voice recognition software such as Apple’s Siri and Google’s Assistant may differentiate their products from other smartphones and increase their profit margins. The cost of non-SEP royalties is impossible to estimate without internal company data, as these royalties are negotiated between firms and may be part of broader cross-licensing agreements. One piece of information that has been revealed is that Microsoft may have been earning $2 billion a year in licensing revenue from Android phone makers, based on its patents used in Android. However, the amount has reportedly fallen as low-price Chinese made phones gain market share, and may not be paying Microsoft any licensing fees (Rosoff, 2016, http://www.businessinsider.com/microsoft-android-patenthttp://www.businessinsider.com/microsoft-android-patent-licensing-revenue-falling-2016-4licensing-revenue-falling-2016-4).
Patent license costs 3.3 % Baseband processor cost
3.7 %
Other semiconductors
cost 15.5%
Other costs 62.6 %
Phone maker operating profit
14.9 %

26
3.3 Design as an asset The design of a smartphone is distinct from the technology inside as indicated by the distinction between technology vs. design patents. Technology patents depend on whether an invention has proved useful and improved the functioning of a product whereas design patents depend on the distinctive look and feel of a product. The look and feel has been key to all of Apple’s products since the original Macintosh, including the iPhone where Apple established a distinctive design, including the user interface, polished aluminum casing, rounded edges, and compact dimensions. Other smartphone makers have imitated the iPhone format although some have gone beyond. Samsung has emphasized larger phones and displays. Huawei ‘s P9 design is the result of partnerships with Porsche Design, and Huawei has announced that design is a major feature of its strategy in smartphones (Kate Hoy, 2017). 3.4 Brand value We use three comparisons of brand value similar to that in WIPO’s 2013 World Intellectual Property Report (WIPO, 2013) as shown in Table 13. Using Interbrand’s rating, Apple is the most valuable brand in the world, with a value in 2016 of $178 billion, compared to $51 billion for Samsung and $5.8 billion for Huawei. Brand Z and Forbes give similar rankings. Table 13 also shows that brand value is a significant share of market cap for leaders Apple and Samsung, while much less for newcomer Huawei. Interbrand reports brand value increases for 2016 at 18% for Huawei, 14% for Samsung, 11% for Google and 5% for Apple. It corroborates earlier analysis arguing that brands make a significant contribution to shareholder value and that their contribution is increasing over time (WIPO, 2013). We also show the brand value of Google’s parent Alphabet since Google is the licensor of the Android operating system and has recently become a phone maker as well. Google’s high brand value helps Android-based phone makers similar to the way that the brand value of Microsoft and Intel helped PC makers with their brand reputation and image. Although “Android inside” does not differentiate the phone makers, it signals quality, functionality and reliability. Table 13: Brand Value for three smartphone makers plus Google, 2016 Company Interbrand
Rank Value
Brand value as % market cap
BrandZ Brand value as % market cap
Forbes Brand value as % market cap
Apple #1 $178B
23% #2 $228B
30% #1 $154B
20%
Samsung #7 $52B
20% #48 $19B
7.2% #11 $36B
13%
Huawei #72 $6B
0.4% #50 $19B
1.3% Not ranked n.a.
Alphabet/ Google
#2 $133B
23% #1 $229B
40% #2 $83B
14%
Sources: Interbrand (2016), Best Global Brands 2016 Rankings, http://interbrand.com/best-brands/best-globalhttp://interbrand.com/best-brands/best-global-

27
brands/2016/ranking/?sortBy=rank&sortAscending=descbrands/2016/ranking/#?sortBy=rank&sortAscending=desc Millward Brown (2016) BrandZ Top 100 Global Brands, http://www.millwardbrown.com/brandz/top-globalhttp://www.millwardbrown.com/brandz/top-global-brands/2016brands/2016; Forbes (2016) The World’s Most Valuable Brands. https://www.forbes.com/powerful-brands/list/3/#tab:rank There are some important limitations of brand values as a determinant of value capture. For example, Forbes explains “Our first step in valuing the brands was to determine revenue and earnings before interest and taxes for each brand” http://www.forbes.com/sites/kurtbadenhausen/2016/05/11/thehttp://www.forbes.com/sites/kurtbadenhausen/2016/05/11/the-worlds-most-valuable-brands-2016-behind-the-numbers/ - 2f02a9f37383worlds-most-valuable-brands-2016-behind-the-numbers/#2f02a9f37383. They effectively use a company’s profits as the starting point to calculate brand value, so the causality is not clear. Also, the perception of a brand can change quickly for better or worse. The Blackberry brand was synonymous with smartphones as late as 2009, yet its market share disappeared in a few years. Another aspect of brand is image, and iPhone has achieved the image of a luxury brand. One indication of the iPhone’s status is that Apple Stores have higher revenue/store than the luxury brand Tiffany.10 Since smartphones are a fashionable consumer good, a strong brand can attract customers, especially in the case of Apple, which had a strong brand name long before it invented the iPhone. Apple and especially Samsung spend heavily on advertising and have increased spending on advertising over the last five years. For example, Apple has increased spending from $691 million in 2010 to $1.8 billion in 2015, while Samsung spent $3.3 billion in 2015 (data for Huawei is not available). 3.5 Intangible assets and value capture in companies How does ownership of intangible assets relate to value capture in smartphones? Apple was a latecomer to mobile phones, and many questioned its move from computers to this new market, which required mastering new technologies, working with mobile carriers to gradually reach out to the mass market (the iPhone was only sold by AT&T for its first two years in the U.S.). More importantly, it built an ecosystem of mobile apps and effectively took control of the customer relationship away from the carriers. As a result, it has created switching costs for customers that have adopted its own applications (e.g., iTunes, iCloud) and third-party apps built for the iPhone. As noted above, there are estimates that Apple captures as much as 90% of the profits in the global smartphone industry. It should be noted that this applies only to smartphone makers, not components. So the question remains, why is a company with a global market share of less than 15% able to capture nearly all of the profits in the industry? There are a few possibilities, which we will consider next. 3.5.1 Intellectual property
10 Apple is first among the top 5 physical retailers, which includes Tiffany ($2951/store), and illustrates Apple’s “luxury” status as a brand. Source: Mary Meeker (2016). Internet Trends 2016 – Code Conference. Kleiner, Perkins, Caufield, Byers kpcb.com/InternetTrends

28
The key issue is not just having IP, but commercializing it, and using it defensively to try to block competitors, or to cross-license with others to avoid being blocked by competitors. Given that cellular standards are open standards to facilitate entry, a company can enter the market without having contributed to development of the standard, provided it pays royalties to the standard’s owners. It is reported that many new entrants, especially in Asia, do not pay for the IP they use. It is estimated that the overall evasion rate for the smartphone industry is 23.6% (Galetovic, et al, 2016, Section 1.6 Sensitivity). Thus, new entrants with no IP can, if they have their own, distinctive strengths, rapidly gain market share. 3.5.2 Relationship between standards and ecosystems Apple’s position in the smartphone market is similar to its earlier position in the PC industry. The PC industry was dominated by Microsoft and Intel, who set the standards (or took them over from IBM) for 95% of the market. Individual PC makers had to compete with ferocious rivalry and struggled to break even over the long term. Apple, with no competition in the Macintosh market, charged premium prices, and generally turned a profit until Windows 95 came out and took away much of its market. But Apple always was at the mercy of developers who were in a position to provide the key complementary asset—software applications—in its ecosystem. Many developers did not want to make products for such a small market, and it was largely due to Microsoft’s decision to keep supporting a Mac version of its Office software that Apple was able to survive. On the surface, the situation is not so different in smartphones. Android has about 88% of the global market and Apple’s iOS about 12% (down from about 20% in 2012). So it would seem that Apple is at risk of losing again, and perhaps it will. A big difference, however, is the size of the market. In 2011 alone, Apple sold more iOS devices than all the Macs ever sold before then, going back to 1984 (https://techcrunch.com/2012/02/16/apple-sold-more-iphones-than-macs-ever/). So while the iOS market share might be small, the market is still big enough to attract developers. Also, the Android market is fragmented, with hardware makers adding their own interfaces on top of the stock version of Android, affecting both the user interface of the phone and the way that apps run on different phones. Carriers also have varying policies about whether to support Android upgrades for the phones on their networks. Apple maintains a single version of iOS and vets every app before it can be sold on its App Store to maintain a quality user experience. For now it appears that Apple has the best of both worlds. Apple controls the iPhone platform (iPhone, IOS, Apple Store) and has platform lock-in of high-value customers and application developers. It has a robust ecosystem providing apps from thousands of developers. It has steadily built its distribution channel (remember that you could only buy an iPhone for AT&T for the first two years) encompassing carriers, retailers, and its own online and Apple stores. And it has no competition in the iOS market, so it doesn’t have to worry about low-cost competitors offering exact substitutes. 3.5.3 Product strategy Apple usually has just three generations of iPhones available at any time, with a total of 6-8 models in a few different configurations. Samsung and Huawei, trying to satisfy every price point in every market, have many more. In 2016, Huawei sold over 120 models worldwide, some for less than $100. Samsung had over 130 (IDC data shared with authors). The cost of maintaining such complex product lines, from engineering to manufacturing, distribution, marketing, support and maintenance must be relatively high, while average selling prices are lower. The average selling price for iOS phones was $716 versus $217 for Androids.

29
Apple’s simpler product line keep some costs under control, but forces it to spread its fixed costs across a smaller number of market niches. Apple has to bear, for example, the costs of developing and upgrading its own operating system. So far, its ability to develop new products that are attractive to customers willing to pay a premium price has secured it much higher gross margins and in sufficient quantity to earn large profits. It uses IP effectively as an offensive and defensive weapon, but the keys to its extraordinary level of value capture seem to lie mainly with a brand image built on a combination of shrewd product and standards strategies, shrewd marketing, and efficient distribution and supply chain operations. 3.5.4 Content ecosystem Both Apple and Google have built up large ecosystems around their operating systems, the most important of which are the applications (apps) that run on them. The availability of apps is critical to the value of the platform—the lack of apps helps explain why Microsoft’s Windows Phone failed in the market even with a well-regarded user interface. Apple’s App Store and Google’s Play Store (formerly called the Android Market) were both launched in 2008, but Apple jumped to the lead as developers usually developed the iOS version first and Android later. In time, Android caught up and by 2017 there were 2.7 million apps on the Play Store and 2.2 million on the App Store. The Play Store had 64 billion downloads in 2016 compared to Apple’s 25 billion (Vaidos, 2017). Most apps are introduced on the two stores at the same time now. However, the App Store is a more profitable location for developers, generating an estimated $5.4 billion in revenues in Q4 2016, compared to $3.3 billion for the Play Store (Vaidos, 2017). Both stores take 30% of revenues, leaving developers with 70%, but App Store customers are much more likely to pay for apps. This is likely due to Apple’s focus on high end customers who are more willing and able to pay than Android customers. Apple also makes significant revenues from iTunes music downloads and its own apps such as iCloud. App sales are an increasing source of revenue for Apple and Google, but relatively small in their overall revenue picture. For Apple, content mainly helps sell phones and for Google, content sells advertising (especially its own apps such as YouTube, G-mail and Google Maps, which run on both platforms). Independent developers of successful apps can make money on downloads or subscriptions. The main losers here are the manufacturers of Android phones who don’t make money on apps. The other major players in the ecosystem are the mobile carriers, who have benefited by selling data plans which now provide a large share of their income. But they lost out on the services they expected to sell to their captive customers. Consider Verizon’s 2004 press release announcing annual earnings three years before the release of the first iPhone:
Contributing to wireless data revenues, 3 billion text messages were exchanged during the quarter. Additionally there were 32.6 million picture messages and 30.2 million downloads of Get It Now’s more than 500 games, exclusive content and other applications. The company next week will launch V CAST, the nation’s first 3G consumer multimedia services, delivering high-quality video, 3D games and music to 3G handsets. (https://www.verizonwireless.com/news/article/2005/01/pr2005-01-27.html)
This vision of Verizon at the center of the mobile universe, selling exclusive content and applications to generic-sounding handsets and charging for text and picture messages must have

30
looked quite lucrative at the time. But when Apple launched the iPhone, it gained the loyalty of its customers, and it was able to take away the content business from the carriers. 3.6 Dynamic Perspective on Value Capture and Intangibles Over time, smartphone market share in terms of units sold has shifted from Europe and North America to Asia, with Nokia and Blackberry losing share and Samsung, Huawei and several other Chinese companies gaining share. This is partly a reflection of the size of the China market, where locally based producers have had direct and indirect support from the government. In the U.S., phones from Chinese producers still have a limited presence. It is also a reflection of the lower average selling price of phones from Chinese producers, although they are gradually moving up-market. As shown in Table 3 and Table 4, the 2016 market share in value terms is lower than share in revenue for all firms except Apple and Samsung. Nevertheless, given that brand name vendors capture a large share of gross profits, the shift in market share toward Asia implies a shift in the geography of value capture. At the component level, the rise of Samsung and Huawei, with their own captive suppliers, and Samsung’s dominance in major components such as memory and displays, means that value capture is shifting to Asia as well. This shift should not be overstated, given Apple’s dominance in the industry’s total operating profits, and Qualcomm’s leadership in components. And much of Samsung’s gains have come at the cost of Japanese component suppliers rather than North American or European firms. Still, it is worth examining this shift to Asia and what implications it might have for other countries attempting to capture value in the industry, particularly with respect to developing or acquiring intangible assets. To do so, we need to understand the nature of the shift. It is partly a function of the continued evolution of global value chains, as discussed in Section 1. As the value chains have spread and matured, a great deal of knowledge has diffused from developed countries to industrializing economies. The diffusion process, combined with local market development, has jump-started local innovation. To the extent that knowledge can be translated into value, this means that the sources of value have also become more geographically dispersed. When a leading company like Apple works with manufacturing partners and suppliers, it transfers a certain amount of knowledge to those companies. More importantly, it collaborates with those companies to develop knowledge in the process of designing and manufacturing its products. The knowledge created is an important intangible asset that is shared by Apple and its partners—for instance, Apple has worked with Foxconn on a variety of manufacturing processes such as plastic molding, machine tooling, final assembly and quality control. While Apple often has exclusive access to the output of particular machines and technologies, the general experience of being part of Apple’s demanding supply chain system can be transferred to other clients and remains in the heads of engineers as they change jobs to other suppliers. At the component level, the fabless chip model adopted by major chipmakers such as Qualcomm, Broadcom and Apple involves close collaboration with foundries such as TSMC to design chips to meet specific manufacturing processes (Brown and Linden, 2009). Both parties learn from the other’s knowledge, and some of this cutting-edge knowledge is captured in commercial design software. While a great deal of the knowledge remains tacit, it doesn’t necessarily need to leave the building to diffuse. Qualcomm rivals Mediatek, Spreadtrum, and Huawei’s chip subsidiary, HiSilicon, are all TSMC customers, benefitting to some extent from the pioneering co-development

31
work that Qualcomm undertakes with TSMC to develop each new generation of process technology. Another factor is the internal transfer of knowledge across borders within multinational corporations (MNCs). For instance, Samsung manufactures half of its mobile phones in its own plants in Vietnam. Apple has software developed in various countries. A certain amount of knowledge transferred within these organizations eventually leaks out, and can be captured and applied by other MNCs or local companies. The knowledge is partly technical, but it is also about how leading MNCs do business, another important intangible asset for firms that want to participate in GVCs or compete with MNCs directly. The most spectacular examples of how the spread of knowledge can allow brand-name value to emerge, are Samsung and LG in Korea. Much has been written about the rise of South Korea in the electronics industry, usurping Japan’s leadership in memory chips and displays (e.g. Dedrick and Kraemer, 1998), and more recently in consumer electronics. It involved a mix of government support, heavy investment when the Japanese were pulling back in the 1990s, flying in Japanese engineers to help develop Korea’s chip industry, hiring Korean engineers trained in the U.S., and developing strong brands outside of Korea. Suffice to say that there is no equivalent to Samsung anywhere in the world. The newest region where value is being created is Greater China. The combination of the huge market of the PRC, government policies to promote domestic firms, and the shift of production by firms from Taiwan, Province of China to the mainland has created a massive electronics manufacturing base, first for PCs and consumer electronics and later for smartphones. There has been an ongoing transfer of knowledge to Greater China since the 1980s, when Taiwan, Province of China set up research institutes to transfer technologies to local companies and spawn startups such as TSMC (Dedrick and Kraemer, 1998). These companies became the workshop to the PC industry, providing many of the components (e.g., power supplies, keyboards, mice, displays), and taking over manufacturing and even some of the design process. As investment rules were eased, manufacturing shifted to the mainland, along with manufacturing knowledge (Dedrick and Kraemer, 2006, 2008; Yang, 2006). U.S. suppliers also invested heavily in mainland China, often complying with requirements to partner with a local firm and/or to transfer technology. Interestingly, however, mainland-based companies did not become major players in the supply chain for the smartphone industry (see Table 8). Instead, some developed their own brand name businesses for the domestic market, and a couple (with government support) became global competitors. In PCs, it was Lenovo, thanks to its dominance in China and its purchase of IBM’s PC business. In smartphones, it is Huawei, Lenovo, and upstarts Xiaomi, Oppo and Vivo. As to how these companies developed the intangibles needed to compete, there are different stories. Huawei is one of the three leading communications network equipment companies in the world next to Ericsson and Nokia. In its earlier days, it was sued by Cisco for unauthorized use of Cisco’s IOS software, although Cisco eventually dropped its case. Huawei had a partnership with 3Com to co-develop products, and has developed its network technologies through its own R&D. Its knowledge of network technologies was useful as it entered the smartphone market. It also develops many of its own components through its HiSilicon subsidiary. So Huawei brings its own supply of intangibles to the industry. Lenovo has been in the mobile phone business for well over a decade, with mixed success. In 2014 it acquired Motorola Mobility from Google, but Google retained most of Motorola’s IP. Lenovo

32
gained Motorola’s U.S. market presence but not its large patent portfolio. Lenovo remains in the low end of the market, with 3% share of unit sales but just 1.1% of revenues (Tables 3 and 4). The recent Chinese entrants into the market, Xiaomi, Oppo and Vivo make cheap products mainly for the China market. They use standard chipsets and other components and the Android OS, and have little in the way of IP. Their marketing and distribution in China have allowed them to grow quickly, and their low-cost production makes them viable competitors in that market. Outside of these countries and companies, each based on a set of specific conditions, there has been little transfer of intangibles or creation of either new competitors or new participants in the global value chains of the MNCs. There is only one Samsung in the world, and there is only one China. The global value chains of the smartphone industry are quite stable at this point, except to the extent that final assembly is expanding to certain locations due to labor costs or government pressure (e.g., Wistron is opening a plant in India to make iPhones as part of a deal for Apple to gain greater access to the large India market). And while companies come and go in the top 20, the bulk of the value capture remains in the hands of Apple and some of the key component suppliers. 3.7 Technology transfer, government policy and indigenous innovation When Apple introduced the iPhone in 2007, neither Samsung nor Huawei were major players in the smartphone industry, but by the end of 2010 Samsung launched its first Android-based smartphone – the Galaxy S-1. By 2013, Samsung was the leading smartphone manufacturer in the world. Similarly, the Huawei Device Company was first set up in 2005, but by 2016 was the largest smartphone maker in China and number three in the world. How did these companies develop their capabilities in smartphones? 3.7.1 Samsung Samsung has a long history as a manufacturer of appliances and consumer electronics, often for sale under the brand names of other companies. It started in the phone business by making mobile phones for telecoms carriers. Its engineers were developing products to meet the specs of mobile carriers and brand name companies and gained experience with different operating systems (e.g., Palm, Windows). Twenty years ago, Samsung basically made parts and components for outside firms whereby it developed basic engineering capabilities. However, in 1996, it made a major a major shift towards developing internal design capabilities by creating multidisciplinary teams of designers, engineers, marketers, ethnographers to develop new products (Yoo and Kim, 2015). About the same time, Korean network operators were looking to upgrade their networks to digital technologies. Most of the world was looking towards a standard known as GSM. The Korean government’s Electronics and Telecommunications Research Institute (ETRI) felt that CDMA was a better technology and struck a deal with Qualcomm, who had patents on the technology, to jointly develop, test and deploy CDMA as its digital wireless standard. ETRI and Qualcomm decided on a profit sharing deal where 80 percent of licensing profits from CDMA phone sales in Korea would go to Qualcomm. The other 20 percent would belong to ETRI. All Korean network operators adopted the technology and as a result it was estimated that ETRI would collect $200 million in royalties for its share of the technology by 2008 (ITU, 2005, Box 3.1). The government’s decision and support gave Korean equipment makers a head start on CDMA,

33
and helped LG and Samsung get into the US market, which was the only other major market where CDMA was being used. Samsung grew to become a major phone manufacturer. After the iPhone proved successful, they needed to shift quickly from making mobile phones to making wireless mobile computers with phone functionality. Because their software skills were not well developed, they adopted Google’s Android OS and were able to use their design, engineering, manufacturing and component strength to make cutting-edge hardware. They were also able to leverage their well-established distribution relationships with carriers and retailers in the U.S. and Korea. Samsung made an effort to develop some software independence by developing its own mobile OS, Tizen, a variant of the open-source Linux system. While Tizen made it into a Samsung smartwatch and a few phone models that were released only in India, it seems to have reached a dead end. Samsung also had complementary assets in its vertically integrated business structure. Different divisions of the company make semiconductors, display panels, batteries, and printed circuit boards for their own use and for competitors. Because each division was able to compete on its own, advanced knowledge about all the key components in a smartphone was available in-house. To catch-up with Apple, Samsung encouraged cooperation between the divisions in bringing together the best of each technology and competition between teams of designers to integrate these technologies into prototypes. When a best prototype was identified from among the competing teams, members of the other teams joined the winning team to speed development of the product (Song, et al., 2016). 3.7.2 Huawei Device Company, Ltd Huawei Device Company was set up in 2003 to develop, manufacture, market and sell mobile devices and accessories. Its first 3G phone was released in 2004. Like other Chinese smartphone manufacturers, Huawei started its smartphone business as an OEM, manufacturing low-end phones for Chinese and other telecom carriers. Since 2011, Huawei has stopped making phones for carriers and focused on own brand manufacturer (OBM) devices using a dual-brand and dual-channel strategy. It created high- and low-end devices and in-store and online channels to serve different economic and social markets. It also developed an integrated “cloud-pipe-device” strategy that included cloud computing, intelligent information networks, and smart devices with the goal of developing synergies across its business (Xiao, 2017). Huawei’s parent company is a multinational networking and telecommunications equipment and services manufacturer – the largest in the world, having relationships with 120 carriers in 75 countries (Xiao, et al., 2017). Huawei picked up basic telecom technology by reverse-engineering foreign products - euphemistically called “bootstrapping” (Chong, 2013) - and using that technology as the foundation to develop more complex technology. In 1990, however, Huawei decided to develop in-house R&D rather than set up an international joint venture to import and learn from foreign partners (Chong, 2013). Huawei invested heavily in R&D and did so consistently over many years (Hu, 2017). In 1999, Huawei founded a chip design subsidiary, now called HiSilicon Technologies, to design integrated circuits for its telecom business. The subsidiary has successfully designed baseband and application processors that have been used in its high-end smartphone models such as the P9 (Xiao, et al., 2017). The use of in-house chip designs creates the potential for differentiation based on performance or functionality. To improve its hardware design, Huawei has hired key designers from companies such as BMW, Siemens, Samsung, Nokia and Apple. They have also partnered with Leica, Harmon/Kardon and

34
Porsche Design to improve quality and the user experience, although these tie-ups may be about brand image as much as technology or design. Perhaps most important, Huawei Devices has a unique asset that is unmatched by Apple and Samsung. Huawei’s parent company’s extensive relationships with telecoms providers worldwide help to promote Huawei smartphones globally, make it easier for Huawei to distribute smartphones through local telecom carriers’ sales networks, and give Huawei smartphones unique access to wireless data transfer and speech capabilities offered by carriers (Xiao, et al., 2017). Huawei also gives discounts on its phones to companies that use its network equipment. This has worked in Europe and other markets, but not in the US, because the US government blocks them in the telecoms market. Huawei’s U.S. market share is less than 0.4% (Cendrowski, 2017). Although Huawei turned down government investment, they were chosen to be China’s national champion in the telecommunications industry. As a result, they have received a lot of government support going abroad, and protection at home. As said by Huawei’s founder: “If there had been no government policy to protect [national companies], Huawei would no longer exist.” (Cendrowski, 2017)

35
Conclusions The smartphone industry is dynamic. Firms that were leaders in handsets in 2005 were not even in the top 20 in 2015, while firms that entered the market after 2010 had jumped into the top 10. The industry’s profits, however, remain concentrated among a few firms, particularly Apple, and Samsung when its components business is included. A number of component makers enjoy large profits in the smartphone business (Qualcomm in particular), but most component markets are very competitive and profits are limited. There has been a series of legal battles between companies that create complementary technologies that enable interoperability and those that use the technologies in their products. These owners of standards essential patents (SEPs) and the companies that use those standards expect fair and reasonable (FRAND) pricing, but disagree on what is fair and reasonable. When they can’t agree, they turn to the courts or to regulators to intervene. Nokia and Apple recently reached an agreement and ceased all litigation whereas Apple is now facing off against Qualcomm in a dispute between the most powerful companies in the industry. Outside the U.S., the governments of China and South Korea have intervened to rein in Qualcomm’s licensing fees and market power. Still, it should be remembered that while the licensing fees for SEPs are significant and the knowledge produced in generating them could prove useful in downstream markets, SEPs are not a direct source of competitive advantage for handset makers due to the fundamental, market-enabling nature of technical standards. The real drivers of value capture in the industry are all of the other intangibles, including non-SEP (implementation) patents, design patents, trade secrets, brand assets, and various domains of tacit knowledge, that differentiate one firm from another. But even these assets are only valuable in the context of a business strategy that includes product development and the building and management of a vibrant ecosystem of complementary assets. Apple has taken a unique approach in the industry, with a proprietary operating system that it shares with no other phone brands, yet opens up to a huge community of app developers and creators of other complements (e.g., speakers, headphones). This strategy succeeded because Apple had successfully pioneered the dominant design for smartphones and held a commanding market share lead before the Android ecosystem developed. It would be very hard for a new entrant to succeed by following the same approach. Apple also uses its highly successful retail stores to sell a full assortment of its own products and those of its complementors. It has kept its product line very lean and focused only on selling higher price phones, ceding the rest of the market to Android phones. This strategy has enabled Apple to capture most of the profits in the industry. The Android ecosystem is larger, with hundreds of phone makers selling thousands of models at all price levels. Samsung has been the dominant player in this market, while other brands rise and fall around it. Still, the greatest value is probably captured by Google, which licenses Android for free, but requires phone makers to install all of the Google mobile apps, with their associated advertising revenues. It is difficult to estimate Google’s share of the Android market’s profits, but by 2016, 59.5% of its global ad revenue was earned on mobile devices, most of which run Android (https://www.emarketer.com/Article/Mobile-Moves-Majority-Share-of-Googles-Worldwide-Adhttps://www.emarketer.com/Article/Mobile-Moves-Majority-Share-of-Googles-Worldwide-Ad-Revenues/1014633Revenues/1014633).

36
At the national level, the leaders are the U.S. (home to Apple, Google, Qualcomm, Intel, Broadcom and a number of other component makers), South Korea (home to Samsung, LG, and SK Hynix), Taiwan, Province of China (home to TSMC, Foxconn and some smaller chip and other component makers), Japan (home to Japan Display, Sony, Murata), and China (home to Huawei and its subsidiary HiSilicon, Xiaomi, Oppo, Vivo, Lenovo and the location of production by over 300 suppliers, including the contract manufacturers who make most smartphones). Europe, which led the world in mobile phone adoption and set standards used globally in the 1990s, has fallen behind, with no major smartphone manufacturers, and few major suppliers. How can we explain the varying fortunes of firms in the smartphone industry? Success has been driven by constant investment in R&D, acquisition of other firms with valuable technologies, and aggressive patenting to create IP portfolios that can be used strategically to develop new products, block competitors, at least temporarily from the market, or to license to others. Besides the technologies inside the phone, value capture is also achieved by creating compelling designs, developing a strong brand to attract and keep customers, and building extensive distribution systems, particularly by developing relationships with mobile service providers/carriers around the world. Most importantly, the smartphone is a platform for users and application developers. The market is currently divided between only two platforms - Apple’s iOS platform and Google’s Android. Apple monopolizes iOS, keeping it just for its own phones and iPads. It offers a complementary ecosystem of software, services and content through its App Store, iTunes store and other services. This ecosystem makes the Apple platform more attractive to many customers and creates customer lock-in among high end users who will pay a premium for an Apple phone and then also buy more apps, music, videos, movies and shop more from their phone (travel, goods, services) over the Internet. Apple’s user base in turn makes the iOS platform attractive to developers who can earn more from Apple’s greater number of pay-for apps. The Android world is less controlled than Apple’s world. Google runs its own Google Play store, but Android apps can be bought beyond the Google Play store. The Android universe is also more fragmented because carriers adopt different policies about requiring their subscribers to update the phone operating system they use. Moreover, Android user interfaces can be customized by phone makers to differentiate their products. Developers thus find it more difficult to develop across the larger number of Android devices, form factors, and OS variants. Perhaps the most important intangible of all is strategy and its implementation. Apple’s strategy only works as long as it can bring out new products that keep its customers excited, nurture its ecosystem of app developers (to whom Apple has paid over $50 billion since it created the App Store), and maintain good relations with mobile carriers and governments who would like a bigger piece of the value that Apple is capturing. Qualcomm’s strategy only works as long as it can stay ahead of competitors in its core products across each new generation of mobile standards while maintaining its licensing business. Samsung’s recent fall in sales and profits, and the bad publicity around the Galaxy Note 7, show that its Android market dominance is potentially vulnerable. Huawei’s phone business is threatened with layoffs just months after it said it was aiming to be the number one phone maker in the world, as it has failed to meet profit targets. The rapid changes in the industry are likely to continue, and new innovations, new strategies, or changes in customer tastes could make today’s smartphone as obsolete as a flip phone.

37
References Bradshaw, T., 2017. Apple looks long term with development of GPUs, Financial Times, (https://www.ft.com/content/8c778fae-18df-11e7-a53d-df09f373be87) last accessed 4/4/2017. Breznitz, D., 2012. Testimony of Dan Breznitz to the U.S.-China Economic and Security Review Commission, May 10, 2012. Brown, C.and G.Linden, 2009). Chips and Change: How Crisis Reshapes the Semiconductor Industry. MIT Press. Cambridge, MA. Cendrowski, S., 2017. Is the world big enough for Huawei? Fortune, http://fortune.com/huawei-chinahttp://fortune.com/huawei-china-smartphone/smartphone/. Cho, Jin-young, 2015. Samsung made in Vietnam. 50% of Samsung mobile phones made in Vietnam, Business Korea, Jan 28, 2015. http://www.businesskorea.co.kr/english/news/industry/8785-samsunghttp://www.businesskorea.co.kr/english/news/industry/8785-samsung-made-vietnam-50-samsung-mobile-phones-made-vietnammade-vietnam-50-samsung-mobile-phones-made-vietnam last accessed Feb 6, 2017. Chong, G., 2013. Chinese telecommunications giant Huawei: Strategies to success, Singapore: Nanyang Technopreneurship Center, Nanyang Technological University. Decker, S., A. Webb, and I King, 2017. Apple is one of Qualcomm’s biggest customers, and it’s suing the chipmaker for US$1billion. Financial Post, January 20. http://business.financialpost.com/fp-techhttp://business.financialpost.com/fp-tech-desk/apple-is-one-of-qualcomms-biggest-customers-but-its-still-suing-for-us1-billion-over-patent-royalties?__lsa=49ce-ae59desk/apple-is-one-of-qualcomms-biggest-customers-but-its-still-suing-for-us1-billion-over-patenthttp://business.financialpost.com/fp-tech-desk/apple-is-one-of-qualcomms-biggest-customers-but-its-still-suing-for-us1-billion-over-patent-royalties?__lsa=49ce-ae59royalties?__lsa=49ce-ae59 Dedrick, J. and K.L. Kraemer, Asia’s Computer Challenge: Threat or Opportunity for the United States and the World? Oxford Univ. Press, 1998. Dedrick, J. and Kraemer, K. L., 2006. Is production pulling knowledge work to China? A study of the notebook PC industry, Computer, 39 (7): 36-42. Dedrick, J. and K.L. Kraemer, 2008. Globalization of innovation: The personal computing industry. In J.T. Macher and D.C. Mowrey (eds), Running Faster to Stay Ahead? Globalization of Innovation in HighTechnology Industries. Washington DC: National Academies Press, pp. 21-57. Dedrick, J., K.L. Kraemer and G. Linden, 2010. Who profits from innovation in global value chains? A study of the iPod and notebook PCs, Industrial and Corporate Change, 19 (1): 81-116. Dedrick, J. and K.L. Kraemer, “Knowledge Management across Firm and National Boundaries: Notebook PC Design and Development,” unpublished report, Personal Computing Industry Center, Univ. of California, Irvine, 2003; www.pcic.gsm.uci.edu/notebookpc.pdf. Dedrick, J. and K. L. Kraemer (2015). Who captures value from science-based innovation? The distribution of benefits from GMR in the hard disk drive industry, Research Policy, 44: 1615-1628

38
Dinsmore, J. “Samsung Mobile: Market share and profitability in smartphones.” Ivey Publishing, 2016. Ernst, D., 2009. A new geography of knowledge in the electronics industry? Asia’s role in global innovation networks, Policy Studies No. 54. Honolulu: East-West Center. Ernst, D., and L. Kim (2002). Global production networks, knowledge diffusion, and local capability formation, Research Policy 31:1417–29. Forbes, 2016a. The world’s most valuable brands. http://www.forbes.com/powerful-brands/list/ last accessed Feb 6, 2017. Forbes, 2016b. We’re increasing our price estimate for Qualcomm to $65. Nov. 29. http://www.forbes.com/sites/greatspeculations/2016/11/29/were-increasing-our-price-estimate-forhttp://www.forbes.com/sites/greatspeculations/2016/11/29/were-increasing-our-price-estimate-for-qualcomm-to-65/ - 6b667a0d66b3qualcomm-to-65/#6b667a0d66b3 Freeman, M. (2017). “Will Qualcomm see an iPhone ban in escalating patent dispute with apple?” San Diego Union-Tribune, May 4. http://www.sandiegouniontribune.com/business/technology/sd-fi-itchttp://www.sandiegouniontribune.com/business/technology/sd-fi-itc-qualcomm-20170504-story.htmlqualcomm-20170504-story.html Gereffi, G., J. Humphrey and T.Sturgeon, 2005,“The governance of global value chains,” Review of International Political Economy, 12(1). Galetovic, A., S. Haber and R. Levine, 2015. An empirical examination of patent hold-up. Working Paper Series No. 15010, Hoover Institution Working Group on Intellectual Property, Innovation and Prosperity, Stanford University. Galetovic, Alexander, Haber, Stephen H. and Zaretzki, Lew (2016). A new dataset on mobile phone patent license royalties. Working paper series No. 16011, Hoover Institution Working Group on Intellectual Property, Innovation and Prosperity, Stanford University. Goel, V.,2017. Apple gives Corning $200 million to invent better phone glass. New York Times, May 12. https://www.nytimes.com/2017/05/12/technology/apple-corning-phone-glass.html Grimes, S. and S. Yutao,2016. China’s evolving role in Apple’s global value chain, Area Development and Policy, Vol. 1, Issue 1 Hoy, K.,2017. Huawei CEO: We’ll be number one smartphone vendor in five years. Posted January 13, 2017, http://www.idgconnect.com/blog-abstract/23728/huawei-ceo-we-smartphone-vendor). Hu, K. 2017. Good signals: Huawei pushes further forward, Cheung Kong Graduate School of Business. http://knowledge.ckgsb.edu.cn/2017/03/27/china-business-strategy/huawei-strategy-push-forward/. IDC, 2016. Data Tracker database on the smartphone industry, 2005-2015. Boston, MA: International Data Corporation. IHS Markit, 2016. Teardown reports for the Apple iPhone, Samsung Galaxy S7 and Huawei P9.

39
ITU, 2005. Ubiquitous network societies: The case of the Republic of Korea. Geneva: International Telecommunication Union. Jiang, S., Ten Wolde, H. 2017. Huawei staff fear cuts as smartphone profits disappoint. Reuters. http://www.reuters.com/article/us-telecoms-mobileworld-huawei-idUSKBN1670LN

40
Kharpal, A. 2016. Apple captures record 91 percent of global smartphone profits: research. CNBC, Nov. 23. http://www.cnbc.com/2016/11/23/apple-captures-record-91-percent-of-global-smartphone-profitshttp://www.cnbc.com/2016/11/23/apple-captures-record-91-percent-of-global-smartphone-profits-research.htmlresearch.html Kenny, M. and B. Pon, 2011. Structuring the smartphone industry: Is the mobile internet OS platform the key? Helsinki: The Research Institute of the Finnish Economy. Layne-Farrar, A., A.J. Padilla and R. Schmalensee, 2007. Pricing patents for licensing in standard-setting organizations: making sense of frand commitments, Antitrust Law Journal, 74(3): 671-706 http://www.jstor.org/stable/27897563. Le, L. B., V. Lau, E. Jorswieck, N.-D. Dao, A. H., D. I. Kim and T. L.-Ngoc, Enabling 5G mobile wireless technologies, EURASIP Journal on Wireless Communications and Networking, September: 218-232 (http://jwcn.eurasipjournals.springeropen.com/articles/10.1186/s13638-015-0452-9) Last accessed 1/26/2017. Lemley, M. A., and C. Shapiro. "Patent holdup and royalty stacking." Tex. L. Rev. 85 (2006): 1991. Li, F. and I. Whalley, 2002. Deconstruction of the telecommunications industry: from value chains to value networks, Telecommunications Policy, 26 (9-10): 451-472. Linden, G., K.h L. Kraemer and J. Dedrick, 2009. Who captures value in a global innovation network? The case of Apple’s iPod, Communications of the ACM, 52(3): 1-5. Liptak, A. and V. Goel, 2016. Supreme Court gives Samsung a reprieve in Apple patent case. New York Times, Dec. 6. http://www.nytimes.com/2016/12/06/technology/samsung-apple-smartphone-patenthttp://www.nytimes.com/2016/12/06/technology/samsung-apple-smartphone-patent-supreme-court.html?_r=0supreme-court.html?_r=0 last accessed Dec. 27, 2016. Lu, L.Y.Y. and Liu, J.S., 2004. R&D in China: An Empirical Study of Taiwanese IT Companies,” R&D Management, 34(4): 453-465. Mallinson, K., 2014. Mallinson on Intel & Wilmer Hale Smartphone Royalty Stack. For IP Finance. Sept. 19. Mallinson, K., 2015. Keith Mallinson, WiseHarbor, on cumulative mobile-SEP royalties. For IP Finance, 19th August, 2015. Mallinson, K., 2016. Analyst angle: smartphone innovation will increase in the run-p to 5G introduction, September 14, 2016. http://www.rcrwireless.com/20160914/analyst-angle/analyst-angle-smartphonehttp://www.rcrwireless.com/20160914/analyst-angle/analyst-angle-smartphone-innovation-will-increase-run-5g-introduction-tag9innovation-will-increase-run-5g-introduction-tag9 Mims, C., 2015. In smartphone market, its luxury or rock bottom”, The Wall Street Journal, February 1, 2015. Nellis, S., 2017. Apple to create $1 billion U.S. advanced manufacturing fund, Reuters, May 3 http://www.reuters.com/article/us-apple-fund-idUSKBN17Z2PI .

41
Nicas, J., 2017. Google parent Alphabet reports jump in earnings, The Wall Street Journal, January 26 (http://www.wsj.com/articles/google-parent-alphabet-reports-jump-in-earningshttp://www.wsj.com/articles/google-parent-alphabet-reports-jump-in-earnings-1485465426?mod=djemalertTECH&mg=id-wsj1485465426?mod=djemalertTECH&mg=id-wsj). Last accessed 1/26/2017. Nordenstam, S. and O. Swahnberg, 2015. Ericsson signs patent deal with Apple, shares soar. Technology News, Reuters, Dec. 21. http://www.reuters.com/article/us-ericsson-apple-idUSKBN0U40MT20151221 last accessed Dec. 27, 2016. Ovide, S. and D. Wakabayashi, 2015. Apple’s share of smartphone industry’s profits soars to 92%, Wall Street Journal, July 12, 2015. https://www.wsj.com/articles/apples-share-of-smartphone-industryshttps://www.wsj.com/articles/apples-share-of-smartphone-industrys-profits-soars-to-92-1436727458profits-soars-to-92-1436727458. Phadnisi, S., 2016. Apple plans to make iPhones in Bengaluru from April, The Times of India, December 30, 2016 http://timesofindia.indiatimes.com/business/india-business/apple-plans-to-make-iphones-inhttp://timesofindia.indiatimes.com/business/india-business/apple-plans-to-make-iphones-in-bengaluru-from-april/articleshow/56246016.cmsbengaluru-from-april/articleshow/56246016.cms last accessed April 4, 2017.. Price Waterhouse, 2015. i1000 database provided to the authors for use in this study and covering the electronics industry. See for example, 2016 Global Innovation 1000 Study http://www.strategyand.pwc.com/innovation1000 Last accessed Feb 6, 2017. Rai, S., 2016. India seeks manufacturing jobs as smartphone market takes off, Industry Week, November 21, 2016. http://www.industryweek.com/emerging-markets/india-seeks-manufacturing-jobshttp://www.industryweek.com/emerging-markets/india-seeks-manufacturing-jobs-smartphone-market-takessmartphone-market-takes last accessed Feb 6, 2017. Rosoff, M., 2016. A huge shift in the Android market is hurting Microsoft. Business Insider, April 21. http://www.businessinsider.com/microsoft-android-patent-licensing-revenue-falling-2016-4 last accessed Dec. 27, 2016. Seagan, S., 2014. Inside Samsung’s Galaxy S5 production line, PC, Aril 8, 2014. http://www.pcmag.com/slideshow/story/322390/inside-samsung-s-galaxy-s5-production-line Last accessed Feb 6, 2017. Shaban, H. and B. Fung, 2017. Here’s what you need to know about the Google E.U. fine. Washington Post, June 27. https://www.washingtonpost.com/news/the-switch/wp/2017/06/27/heres-what-youhttps://www.washingtonpost.com/news/the-switch/wp/2017/06/27/heres-what-you-need-to-know-about-the-google-e-u-fine/?utm_term=.fcbc67e3d496need-to-know-about-the-google-e-u-fine/?utm_term=.fcbc67e3d496 Sidak, J. G., 2016. What aggregate royalty do manufacturers of mobile phones pay to license standard essential patents? Criterion, 1: 701-719. Siino, J. 2017. Why solving the dilemma is the key to a successful future for IP deal making. Via Group. July/August. http://www.via-corp.com/newsdetail.aspx?id=2344

42
Song, J., K. Lee and T. Khanna, 2016. Dynamic capabilities at Samsung: optimizing internal co-opetition, California Management Review, 58(4): 118-114. Sturgeon, Timothy, 2002. Modular production networks: A new American model of industrial organization, Industrial and Corporate Change, 11(3):451-496. Sullivan & Cromwell (2013) Royalty rates for standard-essential patents. April 30. https://www.sullcrom.com/siteFiles/Publications/SC_Publication_Royalty_Rates_for_Standard_Essentia l_Patents_414F.pdf last accessed Dec. 27, 2016. Teagarden, M. B. and C. Fifi, 2015. Xiaomi, Inc.: The rise of a Chinese indigenous competitor, Thunderbird School of Global Management. Vaidos, A., 2017. “Google Play Store vs Apple’s App Store – A comparison,” Softpedia, Feb. 5. http://news.softpedia.com/news/google-play-store-vs-apple-s-app-store-a-comparison-512601.shtml WIPO, 2016. Terms of Reference, Global Value Chains and Intangible Assets. Geneva: World Intellectual Property Organization. WIPO, 2013. World Intellectual Property Report: Reputation and image in the global marketplace. Geneva: World Intellectual Property Organization. Yang, Y., 2006. The Taiwanese notebook computer production network in China: Implication for upgrading of the Chinese electronics industry. Irvine, CA: Personal Computing Industry Center. Yoo, Y and K. Kim, 2015. How Samsung became a design powerhouse, Harvard Business Review, September 2015: 72-78. Xiao, Y., T. Tong, G. Chen and K. Wu, 2017. Huawei: A dark horse in the global smartphone market, INSEAD. https://cb.hbsp.harvard.edu/cbmp/content/sample/IN1324-PDF-ENG.

43
Box 1: Assessment of data and methods. The value capture methodology is the best approximation of costs and value capture associated with smartphones known to date. It has been applied to a wide variety of products from the iPod to PCs to smartphones and has been accepted for publication in academic journals. We are unaware of any published academic or industry critique that questions or challenges the conceptual approach or its implementation. The general approach has used by other researchers and has been cited extensively in the literature. For this study, we used Teardown reports from IHS Markit to estimate the bill of materials for each smartphone model we analyzed. Such reports are the standard benchmark for cost analysis in the electronics industry. However, a teardown report is valid only for the specific phone studied, as phone makers often use multiple suppliers for technical or strategic reasons and costs may vary by supplier. Therefore, the results cannot be generalized even to other phones of the same model, or to other models from the same company. The costs shown for parts and components do not take into account discounts that specific phone makers might receive due to volume or multi-year contracts. They also do not reflect internal transfer pricing in multidivisional companies such as Samsung and Huawai. Actual component pricing information is private to the parties involved and closely guarded. With respect to IP costs, the royalty rates for SEPs are not published, but have been estimated in more than one careful study, and we are confident that our estimates are within a realistic range of the actual payments. Beyond SEPs, there are certain IP payments which are not visible in any public datasets, and also are closely guarded by the companies. These include the IP payments that are included in hardware component prices and the costs of non-hardware components such as operating systems and vendor supplied apps used in smartphones. The IDC data on smartphone shipments, value, and average sales price used in the study is the most comprehensive and reliable in the industry. It is collected quarterly and is constantly adjusted to reflect new understanding and new categories as they develop. The data on number of patents and patent families by company for key smartphone standards has been collected carefully and cleaned to eliminate redundant or inactive patents by IPlytics. Given the large number of patents, the numbers may not be exact, but we believe they are in the right range.

44
Appendix Tables Table 14: Suppliers of major components for the three phones Major components
Suppliers Phone maker/model
Applications processor
Hi-Silicon Huawei P9 TSMC iPhone 7 Samsung Semiconductor
Galaxy 7
Display Japan Display iPhone 7, Huawei P9 Samsung Electronics Galaxy 7
Baseband processor
Hi-Silicon Huawei P9 Intel iPhone 7 Qualcomm Galaxy 7
Memory Samsung iPhone 7 SK-Hynix Huawei P9
Storage Samsung Semiconductor
Huawei P9
Intel iPhone 7 Camera Sony iPhone 7, Galaxy 7
Sunny Optical Huawei P9 Wireless
Broadcom Huawei P9 Samsung Electromechanical
Galaxy7
Universal Scientific iPhone 7 Battery
Huizhou-Desay iPhone 7 Samsung Galaxy7 Huawei Huawei P9
Enclosure Foxconn Technology iPhone 7 Samsung Galaxy 7 Huawei Huawei P9

45
Table A-1: Key Inputs in the Apple iPhone 7
Type Component Supplier
Company HQ Location
Estimated Cost
Price as % of Cost of
Gross Margin
Estd. Value Capture
Operating
Display Display/touchscreen Japan Display Japan $43.00 15.93% 7.8% $3.35 1.7%
Processors Apps process. (sys on chip)
TSMC (Apple design)
Taiwan, Province of China
$27.50 10.19% 49.0% $13.47
38.0%
Mechanicals Enclosure Foxconn Technology
Taiwan, Province of China
$22.20 8.23% 18.0% $4.00
15.0%
Camera Front & rear Sony Japan $19.90 7.37% 25.1% $4.99 3.6% Storage NOR Flash-32M Bytes Intel US $12.21 4.52% 62.5% $7.63 25.3%
Baseband Baseband processor Intel2 US $10.55 3.91% 55.0% $5.80 25.3% Memory SDRAM-2GB Samsung Korea $10.00 3.71% 38.5% $3.85 13.2% Memory NAND-32GB SK Hynix1 Korea $6.40 2.37% 40.9% $2.61 23.3%
Wireless BT/WLAN/GPS UniversalSci Taiwan, Province of China
$7.65 2.83% 10.5% $0.80
3.5%
PCB 10 layer PCB Compeq
Taiwan, Province of China
$6.37 2.36% 14.9% $0.95
10.8%
RF RF transceiver Intel US $4.80 1.78% 55.0% $2.64 25.3% Sensors Fingerprint sensor Analog Devices US $4.30 1.59% 65.8% $2.82 24.2% Power amp. PAM (2) Avago US $4.23 1.57% 52.1% $2.20 23.9% Power mgt. PM IC - main Dialog Semicon. UK $2.65 1.10% 50.0% $1.32 19.2%

46
Battery Li-polymer Huizhou Desay China $2.50 .93% 8.9% $0.22 3.%9 Processors User interface co- NXP Netherland $1.35 0.50% 45.8% $0.62 40.1%
Accessories Headphone jack, charger, headset, USB cable
Lite-on Taiwan, Province of China
$10.70 3.96% 12.97 $1.39 4.0%
Sub-Total $196.31 72.73%
Other parts $35.18 13.03%
Conversion costs $5.96 2.21%
Factory cost $237.45
Software iOS Included in R&D -
IP Licenses SEP & related 5% retail price/phone $311.45 12.02% - COST OF GOODS SOLD $269.90 100.00%
Notes: Apple iPhone 7 sells for$649 retail price, 60 million units expected annual production, 3 yr lifetime, $231.49 direct material costs; $5.96 conversion costs; $3.16 insertion cost, $1.52 assembly, $1.24 test; $237.45 total cost; 1814 parts. Source: IHS Markit (2016) and authors’ calculations. Estimated value capture = Estimated cost x the gross margin of the supplier. 1Some phones have Toshiba.
11 Intel is used for GSM phones and Qualcomm for CDMA.

47
Table A-2: Key Inputs in the Samsung Galaxy S7
Type Component Supplier
Company HQ Location
Estimated Price
Price as % of Cost of GoodS Sold
Gross Margin
Estd. Value Capture
Operating Margin
Display module Display/touchscreen
Samsung Electronics Korea $55.00 18.2% 38.5% $21.17 13.2%
Processors Baseband/Apps processors
Qualcomm2* US $48.64 16.1% 60.0% $29.18 22.8%
Memory SDRAM -4GB SK Hynix Korea $27.22 9.0% 40.9% $11.13 23.3% Enclosure Main/top & bottom Samsung Korea $23.10 7.6% 38.5% $8.89 13.2% Camera Primary & secondary Sony Japan $14.98 5.0% 25.1% $3.21 22.0%
Storage NAND Flash 32GB Samsung Semiconductor Korea $13.92 4.6% 60.0%
$8.35 3.6%
PCB 8-Layer, rigid/flex hybrid SI Flex Co. Ltd.3
Korea $5.13 1.7% 8.0% $0.41 3.6%
PCB 10-LayerI DAP Korea $4.40 1.5% 8.9% $0.39 4.0% User interface
Sensors12 Samsung Korea $4.65 1.5% 38.5% $1.79 4.9%
RF transceiver Qualcomm US $4.92 1.8% 60.0% $2.95 13.2%
WiFi/BT WLAN/BT modules Samsung Electro- Korea $4.10 1.4% 38.5% $1.58 22.8%
RF FEM Murata Japan $2.11 0.8% 58.7% $1.24 13.2% Power Power mgt ICs Qualcomm US $3.98 1.3% 60.0% $2.39 22.7% Battery Li-Polymer Samsung SDI Korea $3.13 1.2% 38.5% $1.20 22.8%
12 Includes accelerometer (Invensense), gyroscope (Invensense), compass, fingerprint sensor, pressure (barometer) sensor and optical pulse sensor (Maxim); companies per S7 teardown; Audio CODEC (Cirrus Logic), Touchscreen controller (ST Micro); wireless charging (Texas Instruments). 2Qualcomm processors contain Broadcom chip. 3SIFlex and DAP Corporation are small private Korean companies that make PCBs. Cannot find GM for them so use Compeq, which is a Taiwan, Province of China PCB maker

48
Sub-Total $215.28 71.3%
Other parts $48.82 16.2%
Estimated assembly and test
$4.17 1.4%
Factory cost $268.27 88.9%
Software Android Google Free
IP Licenses SEPs and related 5% retail price/phone $33.60 11.1%
COST OF GOODS SOLD $301.87 100%
Samsung Galaxy S7 lists for $672 retail, uses Android v6.0 OS. Source: IHS (2016) and authors’ calculations.

49
Table A-3: Key Inputs in the Huawei P9 Function Component
Most Likely Supplier
Company HQ Location
Estimated Factory Price
Price as % of cost of goods sold
Gross Margin
Est’d Value Capture
Operating margin
Display Display Module Japan Display Japan $29.20 14.7% 7.8% $2.28 1.7% Processors Apps/baseband HiSilicon China $24.87 12.5% 45.0% $11.19 11.6% Memory SDRAM 3GB SK Hynix Korea $12.80 6.4% 40.9% $5.23 23.3% Storage Flash & NAND Samsung
Semi Korea $7.41 4.4% 60.0% $4.45 21.0%*
Enclosures Primary, bottom Huawei China $10.25 5.2% 41.7% $4.27 11.6% Secondary, top Huawei China $5.04 2.5% 41.7% $2.10 11.6% Camera Primary 12MP Sunny Optical China $5.47 3.1% 16.5% $0.90 9.1% Secondary 8MP Sunny Optical China $3.10 1.5% 16.5% $0.51 9.1% Sensors Fingerprint O-Film Tech China $4.25 2.1% 12.2% $0.52 4.7% Battery Pack Lithium polymer Huawei China $3.71 1.9% 41.7% $1.55 11.6% Wireless BT/FM/WLAN/GPS Broadcom US $3.49 1.8% 55.0% $1.92 23.9% Cellular RF HiSilicon China $1.37 0.69% 45.0% $0.62 11.6%
Main PCB Logic Via Telecom Taiwan, Province of China
$2.94 1.5% 45.0% $1.32 -37.0%
Main PCB 10 layer Compeq Mfg. Taiwan, Province of China
$2.56 1.3% 14.9% $0.38 10.8%
Main PCB PAMs Skyworks (2) US $1.94 1.1% 40.9% $0.79 31.4%
Main PCB Image processor Altek Taiwan, Province of China
$1.66 0.8% 45.0% $0.75 2.0%
Power mgt. Power mgt. IC HiSilicon (2) China $1.76 0.9% 45.0% $0.79 11.6% User interface Audio DSP HiSilicon China $1.34 0.7% 45.0% $0.35 11.6%

50
IC Touchscreen contr. Synaptics US $1.86 1.1% 45.0% $0.84 9.5% Accessories Battery charger Huawei China $1.25 0.6% 41.7% $0.52 11.6% Sub-Total $126.27 63.6
Other parts $43.19 14.8%
Estimated assembly and test $4.79 2.4%
Factory cost $174.25 88.0%
Software Android Free
Licenses SEP & related 5% retail price/phone $24.15 12.0%
COST OF GOODS SOLD $198.40 100%
Huawei P9 sells for $483 worldwide, volume of 8 million annually, $169.46 total material cost per HIS; $1.13 hand assembly, $0.49 test, $3.17 machine insertion for a total of $4.79 “conversion costs”; 1773 total parts. Source: IHS Markit, Huawei P9 Chinese version (2016) and authors’ calculations.

51
Table A4. Financials for companies, 2015 Company name Supplier
for HQ/ Country
Gross Margin %
Chip Margin %**
Operating margin %
R&D %
SG&A %
Altek (camera) P9 Taiwan,
Province of China
13.0 45 2.0 8.0 3.0
Analog Devices IPhone 7 US 65.8 24.2 18.6 13.9 Apple (apps processor/audio codec IC)
IPhone 7 US 40.1 20 30.5 3.0 6.0
Asahi Kasei Japan 27.5 15.7 3.8 7.9 Avago (now owned by Broadcom) IPhone 7 US 52.1 23.9 15.4 7.1 Broadcom (GNSS receiver IC) P9 US 52.0 55H-55A 23.9 15.4 7.1 Cirrus Logic (audio power amplified IC)
IPhone 7 US 46.0 50 12.0 21.0 11.0
Compeq (PCB) P9, iPhone 7
Taiwan, Province of China
14.9 10.8 0.6 4.3
DAP Corporation (PCB) Galaxy 7 Korea 8.9 4.9 3.8 Dialog Semi. (Power mgt. IC) iPhone 7 UK 46.1 50 19.2 16.5 10.5
Foxconn (HonHai) iPhone 7 Taiwan,
Province of China
7.0 4.0 1.0 2.0
Huawei P9 China 41.7 11.6 15.1 15.8 Huizhou Desay (battery) IPhone 7 China 8.87 3.92 na na HiSilicon (Huawei) P9 China 41.7 45 11.6 15.1 15.8 Infineon (baseband chips) iPhone 7 Germany

52
Intel (RF transceiv, Power mgt IC, baseband proc)
IPhone 7 US 62.6 50-60 25.3 21.9 14.3
Japan Display IPhone 7, P9
Japan 7.8 -2.3 2.3 6.1
Largan Precision (camera lens) (inside Sony)
Taiwan, Province of China
63.6 54.7
Lattice Semi.(FPGA IC) US -26.4 60 -31.1 33.7 24.0 Lite-on Technologies IPhone 7 Taiwan,
Province of China
12.9 4.0 2.8 6.2
Maxim (analog ICs) US 56.6 60 14.3 21.2 13.0
Mediatek Taiwan,
Province of China
35.6 8.35 21.8
Murata Mfg. Galaxy 7 Japan 58.7 22.7 6.4 12.0 Micron 20 2 11.4 NXP Semiconductor (Interface/NFC controller)
IPhone 7 Netherlands 45.8 60 40.1 13.0 7.0
Shenzhen O-Film Tech (glass panels)
P9 China 12.21 4.73 na na
Qorvo US 40.3 45 7.2 9.7 13.0 Qualcomm – RF and Baseband IC Galaxy 7 US 41 60 22.8 21.7 9.3 Power mgt IC Galaxy 7 55 Robert Bosch Samsung Galaxy,
P9, iPhone 7
Korea 38.5 13.2 7.4 25.3
Samsung Semi.-Power mgt IC/touchscreen IC
Galaxy 7 Korea Nic. 60

53
Heart monitor All phones Korea Nic. 50 Si Flex (PCB) P9 Korea 8.0 4.0 3.0 SK Hynix Korea 40.9 23.3 8.4 17.6 Skyworks Solutions Galaxy 7,
iPhone 7 US 47.7 31.4 9.3 5.9
Silicon Motion Taiwan,
Province of China
51 55 21.1 19.7 9.9
Sony P9 Japan 25.1 3.6 6.7 17.6 ST Micro iPhone Switzerland 33.8 1.6 20.7 13.0 Sunny Optical China 16.5 9.1 4.7 3.3 Synaptics (Display driver IC) P9 US 34 45-50 9.5 17.2 7.5 TDK (components) IPhone 7 Japan 27.9 8.1 7.4 19.8 Texas Instruments (Power mgt IC) IPhone 7 US 58.1 45H-53A 32.9 9.8 13.4 Toshiba 17.0 TSMC iPhone7 Taiwan,
Province of China
49.0 38.0 8.0 3.0
Universal Scientific Taiwan, Province of China
10.5 3.5 6.5 7.2
Via Telecom (using Via Technologies)
Taiwan, Province of China
27.0 45BB 70PM
-37.0 32 32
*Abbreviations used in table: Nic. = not included in the analysis. H = Huawei and A = Apple. BB = baseband, PM = power management. **These GM estimates are for chips only, and obtained from the IHS IC price evaluator section. BB = baseband ICs, PM = power mgt; H = Huawei; A = Apple. Financial data based on company annual reports/10K for the 2015 calendar year, which coincides with at least 75% of the companies’ fiscal year.