economics@anz anz international economics monthly...• given the anticipated slow progress on...
TRANSCRIPT

Inside:
Main article...............................1
Financial Markets Update............7
FX and Policy Rate Forecasts.......9
Macro Economic Forecasts ........10
LT FC Govt. Bond Ratings .........11
Country Updates .....................12
Authors:
Amy Auster Head of International Economics +61 3 9273 5417 [email protected]
Jasmine Robinson Senior Economist International +61 3 9273 6289 [email protected]
Alex Joiner Economist, International +61 3 9273 6123 [email protected]
Mark Rodrigues Senior Economist, Australia +61 3 9273 6286 [email protected]
Cameron Bagrie Chief Economist, New Zealand +64 4 802 2212 [email protected]
June 2006
ANZ International Economics Monthly
China : High liquidity, rapid loan growth - and the banks that depend on it
Economics@ANZ
Economics@ANZ undertook a short research trip to China in mid-June. Discussions with government policymakers and private sector experts focused on developments in monetary policy, the exchange rate and the banking system. The main themes and ideas generated by the meetings are as follows:
• China’s Big Four state-owned banks remain highly dependent upon their deposit base to provide the liquidity for their loan book, which in turn is still dominated by state-owned enterprises. A large proportion of that deposit base is believed to be held by a very small percentage of the population. The potential for loss of deposits is a major risk for these banks, leading to concerns about any source of competition.
• There are two imminent potential sources of competition. The first is the opening of the domestic banking system to foreign institutions under WTO in December 2006. The second is the gradual opening of the capital account to allow for easier transfer of savings out of China. Although the government has committed to liberalisation of the banking sector and the capital account, concerns about banking system stability ensure that progress will be slow.
• The government will correctly resist pressures to free the exchange rate for several years, for as long as significant capital controls are in place. However, the authorities will continue with the development of the domestic market infrastructure, such as the introduction of new hedging instruments, in order to facilitate the transition to greater currency volatility. Currency volatility may also be increased via a widening the RMB trading band.
• Given the anticipated slow progress on opening the capital account, we do not anticipate that the RMB will appreciate beyond USD/RMB7.0 in the near or medium term. Indeed, on a fundamental basis, the magnitude of potential capital outflows as against current and relatively stable inflows leads us to believe that the RMB is not necessarily undervalued, and certainly not to the extent that many market participants would seem to believe. Whether the government believes the currency is significantly undervalued is also debatable.
• We put forward the argument that high domestic liquidity is problematic in China not because of foreign capital inflows, as is commonly perceived, but because of the growth-target strategy of local governments and their financiers. Foreign direct investment has been static at roughly US$60 bn per annum for several years, as against US$200 bn in domestic loans written last year. From this vantage point, China’s rapid pace of FX reserve accumulation may be occurring because it is required by investors (local and foreign) to cover a minimum percentage of the monetary base, such that investors feel at ease with their ability to hedge against future currency volatility and convert future profits to foreign currencies.
Data flow for April and May suggest that the economy accelerated in the second quarter, raising the possibility that real GDP growth may be 10.5% YOY after 10.3% growth in the first quarter. More measures aimed at cooling the economy should be anticipated. The measures should remain concentrated in certain sectors such as coastal property markets and heavy manufacturing, although there could (and should) be greater efforts to slow down credit growth.

Economics@ANZ ANZ International Economics Monthly – June 2006
Page 2
China’s banks and future competition
Over the next six months, state-owned banks in China are meant to be preparing for a new world in which they will compete with foreign banks for the Chinese market. This process has been in the works for some time, with significant reforms undertaken over the past five years to get the banks ready for this new environment. The reforms – which have focused on improving asset quality, advancing the supervisory and regulatory framework, and restructuring ownership including via the introduction of foreign partners – have improved banks’ balance sheets significantly, as seen in the chart below.
Profile of major banks’ balance sheets
Sources: CBRC, National Bureau of Statistics, China
0.0
0.5
1.0
1.5
2.0
2.5
3.0
2002 2003 2004 20050
5
10
15
20
25
30
NPL Ratio (RHS)
Total NPLs (LHS)% of total loansRMB tr
Nonetheless, there are ongoing concerns as to how ready China’s banks really are for competition, which in the next 12 months is meant to come from two primary sources. The first is increased competition in the domestic market, which is taking place under the umbrella of the Qualified Foreign Institutional Investor Act (QFII) passed in 2002. In its initial phase, QFII allowed licensed foreign financial institutions to provide financial services to Chinese enterprises, as well as limited investments in the domestic equities and bond markets. At the end of this year, that license will extend so that QFII-licensed firms will be able to offer services to all Chinese clients, including at the retail level. As at the end of last year, 138 foreign banks had been approved to conduct RMB-related business in China, but their assets at US$85 bn amounted to only 2% of total assets in the banking sector.1
The second source of competition is from the global capital market, with the advent of the Qualified Domestic Institutional Investor (QDII) program under which licensed Chinese financial institutions will be able to convert RMB deposits to invest offshore in foreign currency assets.
1 Ding Lu, “China’s Banking Sector: Meeting the WTO Agenda,” April 2006.
Challenges posed by competition
There are two key challenges facing China’s largest banks in an environment of increased competition.
On the liability side, there is significant risk of a shrinking deposit base. China’s Big Four state-owned banks are still heavily reliant upon the deposit base that funds their loan book.2 The volume of deposits is huge; bank deposits are 160% of GDP in China as against 77% in the US, 78% in Korea, and 119% in Singapore. Moreover, 72% of Chinese residents’ net wealth is held in bank deposits, where the average real return is 0.3% per annum, thanks in part to controlled interest rates. This is also potentially very high velocity money, as it is estimated that up to half of the Big Four’s deposits are held by 2% of the population – the wealthiest and most sophisticated class of savers.
Big Four still reliant on high velocity deposits
Sources: McKinsey Global Institute, Putting China’s Capital to Work, May 2006
2
18
25
55
0 20 40 60
Affluent Mass affluentMiddle income Mass retail
2% of households are responsible for more than half of state-owned banks’ deposits and profits
Customers by segment (%) % branch profitability
55
48
8
-11
-50 0 50 100
Affluent Mass affluentMiddle income Mass retail
On the asset side, the Big Four banks are still oriented toward the large state-owned enterprises. While many SOEs have improved their financial performance and balance sheets, there is no question that some SOEs are not competitive. OECD studies suggest that SOE productivity overall is half that of private enterprise in China.3 Yet, loan growth is still high. Thus, concern remains as to the quality of new assets that the Big Four are writing. Indeed, a number of credit rating agencies and other observers have published research reports that indicate the current level of problem loans is US$160 bn, or as much as the current US$164 bn in official NPLs among all commercial banks.4
2 China’s large four state-owned banks are International Commercial Bank of China (ICBC); Bank of China (BOC); China Construction Bank (CCB); and Agricultural Bank of China (ABC) 3 Dougherty and Herd, 2005, OECD 4 China: Taking stock of Banking System NPLs, Fitch Ratings, May 2006

Economics@ANZ ANZ International Economics Monthly – June 2006
Page 3
Loan growth to SOEs is still high
Sources: McKinsey Global Institute, Putting China’s Capital to Work, May 2006
0%
20%
40%
60%
80%
100%
# of e
nter
prise
s
Cont
rib to
GDP
Shar
e of lo
ans
Local private SMEsQuasi-private/foreign/large localSOEs
% of total
Profile of bank loans (2002)
0
50
100
150
200
250
300
350
2001 2002 2003 20040
5
10
15
20
25
New loans issued
RMB tr
Nominal (LHS)
% GDP (RHS)
% GDP
Controlled competition
It is clear that the Chinese authorities intend to increase the level of competition in the banking system by opening up both the domestic and foreign markets. Indeed, some local observers have characterised the introduction of the QDII legislation as “aggressive”, with a scope and timetable well in advance of what many were expecting. It is also clear, however, that ensuring stability in the banking system is a much higher policy priority. This is why we expect that the ongoing process of liberalising the banking sector, the capital account, interest rates and the exchange rate regime will continue to proceed very cautiously and slowly; there will be no “Big Bang” in China.
First, the authorities will continue to exert control over the banking system through opaque regulation, which allows for plenty of administrative intervention. Licensing to qualify for the QDII or QFII programs is not straightforward. Even after licenses have been approved, interpretation of regulations remains a major challenge for most firms. Market participants, and particularly foreign institutions, generally err on the side of caution in order to avoid punitive action by the regulators.
Second, enabling regulations have numerous exemptions. For example, although commercial banks licensed under QDII can convert RMB to foreign currency and invest offshore, those investment choices are limited to the fixed income market. On the other hand, fund managers (who operate under different licenses to banks) can only raise foreign currency funds, but can invest in both fixed income and equity.
Third, existing regulations change frequently. For example, starting last year existing foreign banks operating in China encountered new restrictions on their use of so-called foreign debt quotas, otherwise known as overseas funding sources. This has restricted the ability of foreign banks to bring foreign currency onshore, and has forced an increased reliance on funding from local banks.
We expect regulatory mechanisms such as licensing and quotas to continue to hamper competition in the financial market in China until the authorities are comfortable about the position of the major banks.
Implications for FX policy
The above scenario has important medium-term implications for the Chinese economy, including potentially lower productivity growth, a long-term build-up of contingent liabilities and a continued excessively high domestic savings rate (with lower household consumption). In the short term, however, the main macro implications are for the exchange rate and monetary policy because of the expected slow pace of capital account liberalisation.
The bottom line is that we believe that the government will continue to resist pressure to free the exchange rate for several years – not because the authorities are dedicated to maintaining a fixed exchange rate, but because it is unwise and probably impossible for any government to attempt to have both a floating exchange rate and a closed capital account.
The RMB can only find its market-clearing rate when all capital is free to move across China’s borders, both into and out of the country. However, some regulatory bodies are extremely hesitant to allow capital to leave the country unabated, for fear of a surge of outflows that could destabilise the banking system and/or reduce interest in the domestic capital markets. Although it is hard to envision it now, as recently as 2002 the authorities were far more concerned about capital outflows than capital inflows. The chart below shows net capital flows on commercial bank debt were negative for 5 consecutive years following the Asian crisis, which presented a far greater risk at the time given the smaller current account surplus.
China’s foreign capital inflows
-40
-20
0
20
40
60
80
100
120
140
160
1990 1993 1997 2000 2004
US$ bn
Source: IIF
-20
0
20
40
60
199019931996199920022005
FDIPortfolio equityCommercial bank debtOther creditors
US$ bn
Current account balance Net foreign capital flows
The chart above also highlights the skew of cross-border capital flows to China. Because of the concern about the possibility of outflows and a long-standing focus on promoting foreign investment, the

Economics@ANZ ANZ International Economics Monthly – June 2006
Page 4
implementation of the capital account regulation is more heavily weighted to preventing outflows than preventing inflows. Conversion of foreign currency to RMB requires documented proof of an underlying transaction for trade or purchase of a real asset; conversion from RMB to foreign currency faces a higher threshold and in many cases is simply not allowed. If a financial institution has documentary evidence from a local government that they have agreed to purchase a real (eg, non-financial) asset in China, the State Administration of Foreign Exchange (SAFE) as the regulator must allow the conversion of funds.
As a result of uneven regulation, the bias in terms of capital flows tends to be inflows over outflows – that is, China’s economy is facing surging foreign capital inflows, while outflows are minimal.
Is the RMB undervalued?
The massive ever-increasing foreign capital inflows into China have given rise to a commonly-held view that the currency is undervalued. Speculation, to the limited extent that it exists, has put some upward pressure on the currency. The weight of real and speculative inflows has brought foreign exchange reserves to US$925 billion as at May 2006.
However, in our view it cannot be assumed that the exchange rate is undervalued. If the Chinese government were to lift all capital controls tomorrow, what percentage of the banks’ US$2.5 trillion deposit base would be at risk of moving offshore? Taking a step back, M2 (currency in circulation + deposits + short-term liquid assets) is currently roughly US$4 trillion, or four times the level of foreign exchange reserves. As shown in the chart below, M2 has also been growing at a rapid rate, with a nominal increase of US$590 bn over the year to May as against a US$233 bn increase in FX reserves over the same period. A mere 10% shift in the monetary base to offshore right now would represent a loss of 43% loss of FX reserves.
FX reserves and monetary base
0
1
2
3
4
5
Jan-01 May-02 Sep-03 Jan-05 May-060
2
4
6
8
10
12US$ trillion M2/reserves
M2/FX reserves ratio(RHS)
M2 (LHS)
FX reserves (LHS)
Sources: Datastream, IMF, Economics@ANZ
Why would some funds move offshore? To put it simply, the rate of return on investment assets in China remains very low due to the lack of domestic financial market development. The chart below shows why the weighted average real return on household wealth across all assets in China is 1.3% pa as against 3.0% pa in the United States.
Real return on household wealth
Sources: McKinsey Global Institute, Putting China’s Capital to Work, May 2006
0.3
0.3
1.6
4.5
1.6
4.9
2.5
3.4
1.0
1.9
2.4
4.8
1.3
3.0
0 1 2 3 4 5 6
China
US
Bank deposits Pension and insuranceFixed income EquityMutual funds Real estateWeighted average
Over time, as China’s capital markets develop, rates of return should increase. This would reduce the risk of capital outflows when the capital account is liberalised – but since this process will take time, it is another argument in favour of a slow liberalisation of the capital account.
Meanwhile, as long as the capital account remains closed, and the exchange rate unable to equilibrate between the real demand and supply for RMB onshore and offshore, we believe the authorities will resist allowing the exchange rate to appreciate significantly.
We do not believe that the exchange rate will appreciate past USD/RMB7.0 for at least several years, if at all. First, the authorities are aware of the potential downward pressure on the RMB as the capital account is liberalised. Second, PPP-based models for the RMB suggest a fair value of around USD/RMB7.0-7.5. These models are skewed by the measures of relative prices in China, but still do not suggest the RMB is far off fair value at the current USD/RMB7.998. Third, a relatively weak exchange rate helps to attract investment and promote Chinese exports, although in our view the exchange rate is by far less important vis-à-vis China’s cost base than the relative costs of labour and capital. Fourth, the government has come to the view – to which we agree – that allowing slight currency appreciation simply signals that more appreciation is on its way, tending to fuel speculation. Finally, and most importantly, the authorities simply do not appear to believe that the exchange rate is significantly undervalued.
While we anticipate that the government will maintain a fixed or nearly-fixed exchange rate

Economics@ANZ ANZ International Economics Monthly – June 2006
Page 5
regime for some time, we expect continued measures aimed at building up the infrastructure for an eventual on-shore foreign currency market. The forward market opened in September, and the first licenses in the onshore swap market were issued in April. In June, the government announced it would trial some currency deregulation mechanisms in the Binhai province, with Tianjin as its major city. Currency volatility may be allowed to increase, for example by widening the intraday trading band from its current +/-0.3% margin.
The cause of rising FX reserves
Is the level of the exchange rate and expectations of ongoing appreciation principally responsible for rising foreign exchange reserves in China? FX reserves reached US$925 bn as of May, implying that reserves have been rising by an average of US$21 bn per month for the first five months of the year as against an average of US$18 bn per month in the second half of 2005. Reserve accumulation has accelerated even as capital flows and reserve accumulation in other Asian economies has slowed in the first half of this year.
At first glance, the cause of rising FX reserves appears to be the trade surplus and high FDI. However, trade and FDI do not tell the whole story. In 2005, the trade surplus plus FDI totalled US$160 bn, while FX reserves rose by US$210 bn, leaving 24% of the reserve accumulation unaccounted for by regulated inflows. In the 5 months to May 2006, trade + FDI was US$69 bn vs US$106 bn of reserve accumulation, or a 35% gap.
Conventional wisdom blames the gap to speculative inflows arising from currency appreciation plays, and blames high M2 growth on inflow-driven liquidity and incomplete sterilisation. There is, however, another potential explanation – that reserve accumulation is required by investors to cover a minimum percentage of M2, such that investors feel comfortable with their ability to convert future profits to foreign currencies. The chart below highlights the magnitude of difference in the monthly accumulation rates of M2 and reserves.
Liquidity driven by high loan growth
0
20
40
60
80
100
Oct-02 Apr-04 Oct-05
M2 Reserves
US$bn
M2 and FX accumulation
Sources: Datastream, IMF, Economics@ANZ
1.11.226,835Sing
3.53.31,259Indon
3.1
3.0
4.9
4.3
M2 / reserves current
3.1
2.9
4.4
4.7
M2 / reserves 2005 average
25,444Hong Kong
15,119Taiwan
2,576Thai
1,702China
GDP per capitaUS$
High liquidity
The reason why M2 is expanding so rapidly is not because of high foreign capital inflows, but rather because of high domestic loan growth, which is in turn the result of the growth-target strategy of local governments and their financiers. Local and provincial governments are quite powerful entities that enjoy both very soft budget constraints and strong relationships with local and regional banks. While the national authorities have announced measures aimed at stemming loan growth – first in 2004 and again this year – they have not reduced the growth and employment targets against which local government performance is measured. Targets aside, provincial governments are all keen to attract investment and boost growth. It is not surprising, therefore, that the tightening measures appear to have had little affect thus far.
If the above argument is correct, then it must be expected that China’s foreign exchange reserves will continue to rise as long as credit expansion continues at such a rapid pace in China. Comparing China to other economies as in the table above, which appears to put a benchmark for the M2/reserves at about 3, one of two things will happen. Either M2 will shrink by 25% to reach US$3 trillion or – more likely – reserves will rise to about US$1.4 trillion in the next year. While sterilising those reserves represent an ongoing cost to the People’s Bank of China, this is a cost that the authorities have proven they are willing to bear.
Liquidity also driving strong growth
Rapidly expanding credit is also driving high growth rates in China. Data flow for April and May suggest that the economy accelerated in the second quarter, raising the possibility that real GDP growth may be 10.5% YOY after 10.3% growth in the first quarter – results should be announced later in July. More measures aimed at cooling the economy should be anticipated, including higher interest rates, potentially higher reserve requirements, more guidance on lending criteria and perhaps measures to impose greater budget discipline at the local government level.
Domestic economy still accelerating
Sources: UN Statistics Database, Datastream, Economics@ANZ
Gross fixed capital formation
10
15
20
25
30
35
40
45
50
1970 1978 1986 1994 2002
Contribution to GDP ( )
US
AustraliaJapan
China
India
Real GDP growth
0
3
6
9
12
15
Q4 92 Q2 97 Q4 01 Q2 06
% ANZforecasts
Trend

Economics@ANZ ANZ International Economics Monthly – June 2006
Page 6
Although we suspect that foreign investment is not what is driving China’s burgeoning credit growth, there is still concern among regulators about the stability of foreign capital inflows and their impact on monetary policy. As such, efforts to cool lending growth could extend to foreign companies and financial institutions if the government chooses to wind back the favourable tax treatment that has to date been extended to foreign investment in China.
Amy Auster Head of International Economics Email: [email protected] Ph: +61 3 9273 5417 References: Lu, D (April 2006) “China’s Banking Sector Meeting the WTO Agenda” China Policy Institute The University of Nottingham McKinsey & Company (May 2006) “Putting China’s Capital to Work: The Value of Financial System Reform” McKinsey Global Institute

Economics@ANZ ANZ International Economics Monthly – June 2006
Page 7
Financial Markets Update
Exchange rates, US$ per local currency unit, indexed
80
85
90
95
100
105
110
115
Jan-06 Mar-06 Jun-06
03 Jan 2005 = 100
Korea
Australia
Japan
Taiwan
China
New Zealand
95
98
100
103
105
108
110
113
Jan-06 Mar-06 Jun-06
03 Jan 2005 = 100
Singapore
Indonesia
Malaysia
Thailand
Philippines
Vietnam
Exchange rates
• US dollar weakness, subsequent to the latest hike in the Fed Funds rate in late June, has provided some respite to currencies across the region. Nominal exchange rates had been in free fall since mid-May as investors withdrew from Asian markets amidst expectations of a US rate hike in late June, which became a reality.
• Volatility in exchange rates in the ASEAN region has increased significantly over the past few months. Strong regional appreciation over the first part of the year unwound significantly throughout May and June. However, the upward trend has seemingly now resumed post the Fed Funds rate hike in late June.
• The Indonesian rupiah climbed by around 6% from February to May only to drop the same amount in some turbulent days in mid-May. The rupiah has rallied 3% since mid-June, posting the largest gains in the region.
90
95
100
105
110
115
120
125
130
135
140
Jan-04 Jul-04 Jan-05 Jul-05 Jan-06
Jan 2003=100
NZ
Taiwan
Australia
Korea
Japan
Real exchange rates, US$ per local currency unit, indexed
90
100
110
120
Jan-04 Jul-04 Jan-05 Jul-05 Jan-06
Jan 2003=100
Indonesia
Thailand
Philippines
Malaysia
Singapore
Real Exchange rates
• The latest data in this chart, which is May, shows real exchange rates of the Philippines and Indonesia depreciating amidst moderating inflation and weak nominal exchange rates.
• Further evidence of a pick-up in economic activity and expectations of higher inflation as well as a stronger yen led to a sharp appreciation in Japan’s real exchange rate in May.
• Higher inflation in Australia has exaggerated the appreciation of the real exchange rate beyond its nominal rate of increase. The decline in New Zealand’s real exchange rate halted in May assisted by an appreciating nominal exchange rate.
Policy rates
0
1
2
3
4
5
6
7
8
Mar-05 May-05 Aug-05 Nov-05 Feb-06 May-06
Hong Kong
Korea
Taiwan
%
US
Australia
New Zealand
0
2
4
6
8
10
12
14
Mar-05 May-05 Aug-05 Nov-05 Feb-06 May-06
Thailand
Malaysia
Philippines
%
Singapore
Indonesia
Policy rates
• We still forecast the Fed Funds rate to peak at 5.5% in 2006 from the current 5.25%, with the next hike expected at the August meeting.
• Policy rates in the economies of North Asia and Australia are still firmly on an upward trend. Rates in the ASEAN region, however, seem to be reaching the top of their tightening cycles. In the case of Indonesia, the central bank has begun to adopt a loosening stance. After the impact of reduced fuel subsidies on petrol prices eases off in the second half of 2006, inflation is expected to broadly moderate across ASEAN.
• Another 25 bps rate hike is expected for Australia later in 2006 as core inflation edges closer to the top of the target band.

Economics@ANZ ANZ International Economics Monthly – June 2006
Page 8
Government Bond Index
1
2
3
4
5
6
Sep-05 Nov-05 Jan-06 Apr-06 Jun-06
Korea
Yield (on traded index)
Australia
Hong Kong
China
Japan
1
3
5
7
9
11
13
15
17
Sep-05 Nov-05 Jan-06 Apr-06 Jun-06
Indonesia
Thailand
Yield (on traded index)
Philippines
Malaysia
Singapore
Source: JPMorgan
Philippines’ index is the 10-year bond yield as there is no GBI index.
Bond markets
• Trends in the fixed income markets have been mixed over recent months. A gradual upward drift in yields is apparent across North Asia due to rising inflation expectations. Markets closely linked to the US, in Hong Kong and Australia, have climbed the most rapidly as US yields continue to rally on accelerating inflation expectations and higher cash rates.
• Yields in Japan have moderated in recent months. The upward trend in yields in the first quarter was based on inflation expectations that were buoyed by positive momentum in both the core and headline measures. However, yields now appear to be in pause mode, awaiting BOJ’s exit from its zero interest rate policy.
• Significant upward movements in yields were experienced in the Philippines and Indonesia as investors removed funds from these lower-rated debt markets. The higher-rated markets in the rest of the ASEAN region remained relatively insulated from these capital outflows.
Foreign exchange reserves
0
100
200
300
400
500
600
700
800
900
1,000
2001 2002 2003 2004 2005 2006
China
US$ bn
Korea
Japan
Taiwan
0
20
40
60
80
100
120
140
160
180
2001 2002 2003 2004 2005 2006
Singapore
Hong Kong
US$ bn
Malaysia
Thailand
India
Indonesia
Source: Bloomberg
International reserves
• Reserve accumulation in China showed no signs of letting up with a US$20 bn increase in April followed by a US$30 bn rise in May. Reserves now stand at US$925 bn, surging well above the second highest reserves holder Japan at US$842 bn. At this pace, China’s reserves will reach US$1 tr before year’s end. Reserves growth was again driven by strong trade and investment flows. China's trade surplus hit a record high of US$13bn in May, bringing the surplus for the first five months of the year to around US$47bn. China has also attracted US$23bn in foreign direct investment in the five months to May.
• India’s foreign reserves have resumed their upward trend bolstered by strong remittance flows and FDI in recent months, and despite a local equity market sell-off.
Share price indices
60
80
100
120
140
160
180
Jan-05 Jun-05 Dec-05 May-06
1 Jan 2004 = 100
HK
Japan
Korea
Taiwan
China
50
75
100
125
150
175
200
225
Jan-05 Jun-05 Dec-05 May-06
1 Jan 2004 = 100
Singapore
Malaysia
Indonesia
Philippines
Thailand
Source: Datastream
Equity markets
• Stockmarkets edged up in the final week of June after the sharp correction which began in mid-May. For North Asia, the indices were still above that recorded at the start of the year. However, for Southeast Asia, the May fall-out has led to serious erosion of gains made through the year.
• In contrast to other North Asian markets, the rally in China’s stockmarket in 2006 has been rapid, reflecting ample liquidity.
• Thailand’s financial markets have been fairly resilient given the current uncertain political backdrop that has put a cloud on investment prospects.

Economics@ANZ ANZ International Economics Monthly – June 2006
Page 9
Foreign Exchange and Policy Rate Forecasts May-06 Jun-06 Sep-06 Dec-06 Mar-07 Jun-07 Sep-07
China
USD/CNY, eop 8.02 7.99 7.91 7.79 7.73 7.67 7.61 AUD/CNY, eop 6.03 5.91 5.69 5.45 5.33 5.21 5.17 One year base lending rate 5.85 5.85 6.12 6.12 6.12 6.12 5.85 Hong Kong USD/HKD, eop 7.76 7.79 7.78 7.78 7.77 7.76 7.75 AUD/HKD, eop 5.84 5.76 5.60 5.45 5.36 5.28 5.27 HKMA discount rate 6.25 6.75 7.00 7.00 7.00 6.50 6.00 India USD/INR, eop 46.4 45.5 45.0 44.5 44.3 44.0 43.5 AUD/INR, eop 34.9 33.7 32.4 31.2 30.5 29.9 29.6 Reverse Repo rate 5.50 5.75 6.00 6.00 6.00 5.75 5.50 Indonesia USD/IDR, eop 9,255 9,000 8,900 8,750 8,700 8,650 8,600 AUD/IDR, eop 6,962 6,660 6,408 6,125 6,003 5,882 5,848 BI rate 12.75 12.50 11.50 10.25 9.50 8.50 7.25 Korea USD/KRW, eop 946 970 960 950 960 970 980 AUD/KRW, eop 711 718 691 665 662 660 666 Overnight call rate 4.00 4.25 4.50 4.75 4.75 4.50 4.50 Malaysia USD/MYR, eop 3.63 3.62 3.59 3.57 3.55 3.54 3.52 AUD/MYR, eop 2.73 2.68 2.58 2.50 2.45 2.40 2.39 Overnight policy rate 3.50 3.50 3.75 3.75 3.50 3.25 3.25 Philippines USD/PHP, eop 52.9 52.0 51.5 50.8 50.5 50.3 50.0 AUD/PHP, eop 39.8 38.5 37.1 35.5 34.8 34.2 34.0 Overnight Reverse Repo rate 7.50 7.50 7.75 7.75 7.50 7.25 7.25 Singapore USD/SGD, eop 1.58 1.57 1.56 1.55 1.55 1.54 1.54 AUD/SGD, eop 1.19 1.16 1.12 1.09 1.07 1.05 1.05 3-month interbank rate 3.44 3.50 3.60 3.60 3.60 3.50 3.40 Taiwan USD/TWD, eop 32.0 31.8 30.5 30.0 29.8 29.5 29.3 AUD/TWD, eop 24.1 23.5 22.0 21.0 20.5 20.1 19.9 Discount rate 2.38 2.50 2.63 2.50 2.50 2.40 2.40 Thailand USD/THB, eop 38.1 38.0 38.5 37.8 37.0 36.8 36.5 AUD/THB, eop 28.7 28.1 27.7 26.5 25.5 25.0 24.8 14-day repo rate 4.75 5.00 5.00 5.00 4.75 4.50 4.25 Vietnam USD/VND, eop 15,958 16,015 16,047 16,079 16,122 16,154 16,186 AUD/VND, eop 12,003 11,851 11,554 11,255 11,124 10,985 11,007 Japan USD/JPY, eop 112.7 115.0 110.0 105.0 102.0 100.0 98.0 AUD/JPY, eop 84.7 85.1 79.2 73.5 70.4 68.0 66.6 Overnight call rate 0.01 0.00 0.25 0.5 0.50 0.75 1.0 Australia AUD/USD, eop 0.75 0.74 0.72 0.70 0.69 0.68 0.68 Cash rate 5.50 5.75 5.75 6.00 6.00 6.00 6.00 New Zealand NZD/USD, eop 0.63 0.62 0.60 0.58 0.55 0.53 0.53 AUD/NZD, eop 1.19 1.19 1.20 1.21 1.25 1.28 1.28 Overnight call rate 7.25 7.25 7.25 7.00 6.50 6.50 6.00

Economics@ANZ ANZ International Economics Monthly – June 2006
Page 10
Macro Economic Forecasts Real GDP Growth (%)
2004 2005 2006f 2007f
Australia 3.6 2.5 2.9 3.1
Cambodia 7.7 9.6 7.9 7.6
China 10.1 9.9 9.8 8.9
Hong Kong 8.6 7.3 4.8 3.5
India+ 7.5 8.4 7.5 7.2
Indonesia 5.0 5.6 4.8 6.4
Japan 2.3 2.6 2.4 2.0
Korea 4.7 4.0 5.0 3.2
Malaysia 7.1 5.3 5.4 5.0
New Zealand 4.3 2.3 1.5 1.4
Philippines 6.0 5.1 4.5 4.3
Singapore 8.7 6.3 7.0 5.0
Taiwan 6.1 4.1 5.1 3.0
Thailand 6.2 4.6 4.5 4.3
Vietnam 7.7 8.4 7.8 7.4
Nominal GDP (US$ bn)
2004 2005 2006f 2007f
Australia 637.4 705.4 725 715.9
Cambodia 4.9 5.2 5.4 5.6
China 1931.0 2175.6 2437.4 2680.8
Hong Kong 165.7 173.6 185.7 196.8
India+ 670 753 845 935
Indonesia 257.6 300 345 390
Japan 4674.7 4672.3 4765.7 4813.4
Korea 681.5 799.7 847.7 890.1
Malaysia 117.7 125 136 146
New Zealand 97.8 108.6 99.4 89.9
Philippines 86.1 98 110 122
Singapore 106.8 114 123 130
Taiwan 305.4 330.7 350.6 368.1
Thailand 161.7 177 195 208
Vietnam 45.3 53.1 61.3 69.6
Inflation (%)
2004 2005 2006f 2007f
Australia 2.3 2.7 2.9 2.7
Cambodia 3.8 5.8 5.3 5.0
China 3.9 1.8 2.5 3.0
Hong Kong 0.0 0.8 1.8 1.5
India+ 3.8 4.1 4.5 3.5
Indonesia 6.1 10.4 12.7 7.7
Japan 0.0 -0.2 0.2 0.9
Korea 3.6 2.8 3.1 3.8
Malaysia 1.4 3.1 4.0 3.0
New Zealand 2.7 3.2 3.7 2.7
Philippines 5.9 7.7 7.5 6.0
Singapore 1.7 0.5 1.5 0.9
Taiwan 1.6 2.3 3.0 2.5
Thailand 2.8 4.5 4.8 3.0
Vietnam 7.8 8.2 6.0 4.5
Fiscal Balance (% of GDP)*
2004 2005 2006f 2007f
Australia 1.2 1.7 1.0 1.0
Cambodia -5.4 -5.6 -5.8 -6.0
China -2.1 -1.1 -2.0 -1.9
Hong Kong -0.4 -0.4 -0.4 -0.7
India+ -4.5 -4.2 -3.8 -3.6
Indonesia -1.6 -0.5 -1.4 -0.8
Japan -6.5 -6.2 -6.0 -5.8
Korea 0.7 -0.3 -0.8 -0.2
Malaysia -4.3 -3.3 -3.0 -2.3
New Zealand 5.2 4.1 5.8 3.3
Philippines -3.9 -2.8 -2.1 -1.5
Singapore -0.1 0.2 -1.3 0.1
Taiwan -2.5 -2.5 -2.2 -2.4
Thailand 0.1 -1.2 -1.7 -1.4
Vietnam -1.7 -2.1 -2.3 -2.9
Current Account (% of GDP)
2004 2005 2006f 2007f
Australia -6.3 -6.0 -5.4 -6.0
Cambodia -10.1 -10.9 -10.6 -10.3
China 4.0 6.7 4.4 4.0
Hong Kong 9.5 9.3 5.6 2.1
India+ -0.1 -2.1 -2.5 -2.5
Indonesia 1.2 0.5 1.2 1.6
Japan 3.8 3.9 4.0 3.5
Korea 4.1 2.4 1.7 1.2
Malaysia 12.5 11.7 8.9 6.6
New Zealand -6.7 -8.9 -10.2 -8.3
Philippines 2.6 2.0 2.0 1.8
Singapore 26.1 28.5 24.0 22.0
Taiwan 5.8 3.4 3.1 2.5
Thailand 4.1 -1.4 -1.1 -1.0
Vietnam -2.1 -2.7 -3.6 -4.0
Foreign Exchange Reserves (US$ bn)
2004 2005 2006f 2007f
Australia 33.9 43.3 n.a. n.a.
Cambodia 0.94 0.95 0.94 0.96
China 609 818 925 850
Hong Kong 123 123 125 127
India 126.5 138 150 155
Indonesia 34.9 33 35 40
Japan 833 828 815 800
Korea 198 215 230 220
Malaysia 66.6 70.5 75 80
New Zealand 6.9 9.1 n.a. n.a.
Philippines 13.1 16 17.5 18.5
Singapore 112.2 117 122 125
Taiwan 241 253 265 270
Thailand 48.7 50.7 52 54
Vietnam 7.0 8.9 9.6 10.2
+: Fiscal year beginning April; *:Fiscal balance for Australia, New Zealand, Malaysia and Singapore corresponds to fiscal year

Economics@ANZ ANZ International Economics Monthly – June 2006
Page 11
Long Term Foreign Currency Government Bond Ratings
Investment Grade Sub-Investment Grade
Moody’s S&P Moody’s S&P
Aaa AAA Ba1 BB+ Australia Australia Costa Rica Egypt Canada Canada Egypt El Salvador France France Morocco India
Germany Germany Panama Morocco Japan Singapore Romania
New Zealand United Kingdom Singapore United States Ba2 BB
United Kingdom Colombia Colombia United States Fiji Costa Rica
Guatemala Jordon Aa1 AA+ Jordan Panama
Belgium Belgium Peru Brazil New Zealand Ba3 BB-
Aa2 AA Peru Cook Islands Italy Vietnam Guatemala Aa3 AA- Brazil Philippines
Cayman Islands Hong Kong Turkey Serbia Taiwan Italy Turkey
Japan Venezuela Taiwan Ukraine
A1 A+ Vietnam Czech Republic Qatar
Hong Kong Kuwait B1 B+ Hungary Papua New Guinea Ghana Macau Philippines Indonesia Qatar Suriname Pakistan UAE Ukraine A2 A Indonesia
China Chile B2 B Cyprus Cyprus Honduras Papua New Guinea Israel Korea Pakistan Uruguay Kuwait Saudi Arabia Venezuela Argentina Poland
A3 A- B3 B- Korea China Argentina Bolivia
Malaysia Czech Republic Bolivia Lebanon Saudi Arabia Hungary Lebanon Paraguay
Israel Uruguay Suriname Malaysia
Baa1 BBB+ Caa1 and below CCC and below Chile Oman Cuba Belize
Mexico Poland Ecuador Ecuador South Africa Thailand Nicaragua Thailand South Africa Paraguay
Oman Belize Baa2 BBB
Mauritius Mexico Tunisia Tunisia Russia Bulgaria
Russia Baa3 BBB-
El Salvador Romania India
Bulgaria
At the end of May, Moody’s changed its ratings methodology and established new country ceilings that are 1 or 2 notches above the sovereign credit rating for many countries rated A and below. Bloomberg’s CSDR page now shows the new country ceilings rather than the old sovereign bond ratings. We are evaluating the change and how we will interpret the new ratings.

Economics@ANZ ANZ International Economics Monthly – June 2006
Page 12
Country Update: Australia Growth back to trend
0
1
2
3
4
5
03 04 05 06
% change
Quarterly
Year-ended
Retail sales remain solid, but petrol is beginning to bite
60
70
80
90
100
110
120
130
140
03 04 05 060
0.1
0.2
0.3
0.4
0.5
0.6
0.7
0.8
0.9
1
Retail Sales (RHS) Petrol price(LHS)
cents per litre % ch trend
Sources: Australian Bureau of Statistics
• GDP grew by 0.9% in the March quarter, lifting theannual rate to 3.1% - the first time it has been above 3%since the September quarter 2004. Householdconsumption was the primary driver of growth in thequarter, providing the first ‘hard’ evidence that thecaution that has characterised consumer spending overthe past year is beginning to recede.
• Retail sales eased by 0.3% in May, following a strong1.1% surge in April. Trend growth in retail spending hasslowed marginally this year, providing some evidence thatthe rise in petrol prices over this period has begun to bite.Nevertheless, at 0.6%, trend monthly growth in retailspending in the first five months of 2006 is around doublethe pace of the final five months of 2005, confirming thesolid underlying path of consumer demand.
• Private sector credit grew by a robust 1.1% in May, withbusiness credit up 1.1% and household credit up 1.0%.The ongoing robust credit growth is indicative of theunderlying strength of domestic economic conditions andrefutes the view that the household sector is facing animminent balance sheet correction. Our analysissuggests that both the business and household sectorsretain ample capacity for further debt accumulation.
• The labour market also strengthened further, withemployment up by a massive 56,000 jobs in May, and theunemployment rate falling to 4.9% - the lowest level inaround 30 years.
• Recent data suggest underlying momentum in theeconomy may be a little stronger than we had thought.However, we expect the RBA will proceed cautiously.These data pre-date the May rate rise. We expect theRBA will wait to gauge the effects of these factors beforemoving again, opening the door for a 25bp rate risetoward the end of the year.
Mark Rodrigues
Economic data – Australia Monthly data Oct 05 Nov 05 Dec 05 Jan 06 Feb 06 Mar 06 Apr 06 May 06 Building Approvals, 000’s 12.3 12.7 12.3 12.1 12.2 12.7 12.3 12.7 Retail Sales, % YOY 3.1 3.1 3.9 4.6 4.6 5.0 7.3 5.2 Exports, % YOY 14.3 15.8 24.1 13.4 24.4 19.3 14.6 n/a Imports, % YOY 5.6 11.6 11.2 13.0 10.1 9.9 13.1 n/a Trade Balance, AUD bn -1.33 -2.40 -0.98 -2.40 -0.43 -1.51 -1.09 n/a Foreign Exchange Reserves, US$ bn 41.2 42.9 43.3 43.7 41.4 44.3 48.5 51.3 Quarterly data Jun 04 Sep 04 Dec 04 Mar 05 Jun 05 Sep 05 Dec 05 Mar 06 Real GDP, % YOY 4.7 3.3 2.0 2.0 2.7 2.6 2.9 3.1 - Private consumption 6.4 5.7 4.5 3.6 3.3 2.8 2.7 2.9 - Government consumption 3.3 4.0 3.9 3.1 3.8 1.8 2.6 1.9 - Gross fixed capital expenditure 10.8 6.9 5.2 3.0 7.9 9.1 9.7 12.0 Consumer Price Index, % YOY (nsa) 2.5 2.3 2.6 2.4 2.5 3.0 2.8 3.0 Current Account, AUD bn -12.1 -14.1 -16.0 -15.3 -12.1 -13.5 -14.3 -14.0 Capital Account, AUD bn (nsa) 11.3 15.5 15.4 14.6 10.8 15.7 13.3 13.7
Sources: Australian Bureau of Statistics, RBA. Note: data seasonally adjusted unless otherwise stated

Economics@ANZ ANZ International Economics Monthly – June 2006
Page 13
Country Update: Cambodia
Cambodia: Exports to US, Imports from Asia
0
50
100
150
200
250
300
350
00 01 02 03 04 05 06
Imports from
Exports to
January-00 to December 05
$US mn
Asia Trade
0
20
40
60
80
100
120
140
160
180
200
00 01 02 03 04 05 06
$US mn
Exports to
Imports from
January-00 to Dec 05
US Trade
Source: IMF Direction of Trade Statistics
Heavily reliant on US as key exports market
0 15 30 45 60
US
Germany
Vietnam
UK
Canada
Japan
2004
2005
% of Total Exports
0 15 30
Thailand
China
HongKong
Vietnam
Singapore
Japan
2004
2005
% of Total imports
Exports Imports
Source: IMF Direction of Trade Statistics
• Cambodian GDP growth surprising on the upside for 2005 was in no small part due to significant improvements in trade performance. Strong export growth has been sustained despite increased competition in Cambodia’s only significant export industry, the garments trade. Significant liberalisation of this sector has occurred after the expiration of both the Agreement on Textiles and Clothing at the end of 2004 and the Multi-fibre Agreement at the end of 2005. Cambodia’s overall merchandise exports increased by 10.2% in 2005, with significant growth in the key market of the US. Exports to the US grew by 18.2% in 2005 as Cambodia continues to pick up market share in US garment sector. In other key markets, fortunes were mixed, with exports to the EU down by 11.1%. However, much of this fall was offset by a 21.3% increase in exports to Asia. Exports to close neighbours Vietnam and Thailand both increased significantly as Cambodia seeks to forge closer relations with these countries. Crackdowns on border smuggling, particularly in petrol, may have also assisted these bilateral trade relationships. Exports to the US accounted for around 60% of Cambodia’s total exports in 2005 followed by 21% to the EU and 10% to Asia.
• Virtually all of Cambodia’s exports to the US are garments (averaging around 97% over the last 3 years). US trade data indicates that Cambodia’s exports to the US have increased around 29% in the first four months of 2006 (c/w same period in 2005). This performance has been supported by the US (and EU) continuing to contain garment imports from China and Vietnam. In addition, the “Better Factories Cambodia” project, funded by the ILO, has boosted productivity and improved labour conditions. Both of which have assisted export performance and encouraged the manufacturing base to expand significantly. Ministry of Commerce figures for April indicate an 11% increase in the number of employees in the garments sector, to 293,600, since January 2005. The number of garment manufacturing factories also increased by around 13% during 2005.
Alex Joiner
Economic data – Cambodia Monthly data Oct 05 Nov Dec 05 Jan 06 Feb 06 Mar 06 Apr 06 May Consumer Price Index, % YOY 6.4 6.7 6.7 6.3 6.2 5.9 4.8 4.9 -Transport & Communication 11.4 10.0 9.1 10.2 9.9 8.9 9.5 10.5 -Food & Beverages 10.0 10.8 11.1 10.8 10.7 10.2 7.4 7.2 Exports, % YOY 10.8 13.8 23.1 30.6 n/a n/a n/a n/a Imports, % YOY 16.8 11.2 21.0 18.7 n/a n/a n/a n/a Trade Balance, US$ mn -89.2 -83.8 -117.7 -28.4 n/a n/a n/a n/a Foreign Exchange Reserves, US$ mn 942.2 929.2 952.7 959.1 981.9 1,002.7 n/a n/a Tourist Arrivals, % YOY 41.9 26.8 34.5 17.5 21.1 14.3 23.1 n/a GDP Composition 2004 Trading Partners Exports Imports Real GDP, % YOY 7.7 2004 % share US 55.9 Viet’m 10.9 - Agriculture, % YOY -2.0 Germany 11.7 Thail’nd 22.5 - Industry, % YOY 16.1 UK 6.9 Sing 10.8 - Services, % YOY 9.2 Vietnam 4.4 China 13.6 Nominal GDP, US$ bn 4.89 Japan 3.5 HK 14.1
Sources: Datastream, National Institute of Statistics of Cambodia

Economics@ANZ ANZ International Economics Monthly – June 2006
Page 14
Country Update: China
CPI accelerating as base effect of 2004 grain spike wear off and liquidity expands
-10
0
10
20
Jan-01 Jul-02 Jan-04 Jul-05-30
-20
-10
0
10
20
30
40% YOY
Grain
Food
House lease
CPI
CPI
Sources: Bloomberg, Datastream
M2 growth
0
5
10
15
20
25
30
Jan-01 Jul-02 Jan-04 Jul-05
% YOY
Fixed asset investment is still growing strongly
-20
-10
0
10
20
30
40
50
60
70
80
90
100
Feb-05 Jun-05 Oct-05 Feb-06
% YOY
Metal products
Transportequip
Food and beverage
All manuf
Fixed asset investment – by manufacturing sector
Sources: Bloomberg, Datastream
-20
-10
0
10
20
30
40
50
60
Feb-03 Jun-04 Oct-05
% YOY
Total urban
Secondaryindustry
Local projects
Tertiary industry
Fixed asset investment – by economic sector
• The economy shows no sign of slowdown. Activity in fact appears to have accelerated in the second quarter, raising the possibility that GDP growth will exceed the 10.3% YOY recorded in the first quarter. Industrial production rose 23% YOY in May, with heavy industry growth still outpacing that of light industry, as exports rose 25% YOY. Perhaps more surprising, consumption data appears to have ticked upward with retail sales rising 14.2% YOY after average annual growth of 12.8% in the first quarter. Imports, perhaps the most reliable high frequency indicator of total domestic demand, rose 21.7% YOY in May after growth of 24.8% in the first quarter.
• In addition to strong activity, CPI has recorded its first strong increase in May, rising 1.4% YOY as against an average of 1.2% YOY in the first quarter. The uptick is no doubt related to the wearing off of the base effect of the 2004 grain price spike, with grain prices rising 2.9% YOY (nsa) in April and 3.4% YOY (nsa) in May after recording significant deflation for the past 18 months. The cost of rent and house leasing also turned positive – in the case of rental prices, it is the first positive annual price rise since the series was introduced in 2002.
• As expected, the authorities continued to announce measures to cool the economy by raising the reserve requirement to tighten liquidity in the banking system. Three powerful central agencies issued further warnings to local governments on the need to rein in investment spending – though, as the charts show, fixed asset investment in manufacturing is also strong. Some observers have suggested that an upcoming reshuffle of provincial-level leadership is a key cause of the flood of investment, making it akin to election-year spending. However, we forecast ongoing tightening measures including another rise in lending rates as of August.
• The RMB appreciated by 0.25% in nominal terms in June after depreciating slightly in May. It is now trading at USD/RMB7.998 and is likely to continue to remain below the USD/RMB8.0 level.
Amy Auster
Economic data – China Monthly data Oct 05 Nov 05 Dec 05 Jan 06 Feb 06 Mar 06 Apr 06 May 06 Retail Sales, % YOY 12.8 12.4 12.5 15.5 9.4 13.5 13.6 14.2 Consumer Price Index, % YOY 1.2 1.3 1.6 1.9 0.9 0.8 1.2 1.4 Exports, % YOY 29.6 18.6 18.2 28.4 22.2 28.3 23.9 25.1 Imports, % YOY 23.4 21.0 22.2 25.3 29.5 21.1 15.3 21.7 Trade Balance, US$ bn 12.0 10.5 11.0 9.7 2.44 11.19 10.46 13 Foreign Exchange Reserves, US$ bn 784.9 794.2 818.9 845.2 853.7 875.1 895.0 925.0 Quarterly data Jun 04 Sep 04 Dec 04 Mar 05 Jun 05 Sep 05 Dec 05 Mar 06 Real GDP, % YOY 9.6 9.1 9.5 9.9 10.1 9.8 9.9 10.3 - Primary sector 4.9 5.5 6.3 4.6 5.0 5.0 5.2 4.5 - Secondary sector 11.5 11.1 11.1 10.9 11.0 10.9 11.4 12.5 - Tertiary sector 8.1 8.1 10.0 9.7 9.8 10.0 9.6 8.9 Nominal GDP, US$ bn 455.1 473.8 567.8 565.1 580.2 608.5 470.1 n/a Current Account, US$ bn 51.6 76.1 100.8 125.7 137.8 154.1 174.0 184.2 FDI (actual), US$ bn* 19.1 14.8 15.3 13.4 15.2 14.7 17.7 14.3 Sources: Datastream, Bloomberg * - Quarterly sum

Economics@ANZ ANZ International Economics Monthly – June 2006
Page 15
Country Update: Hong Kong
Tourism and retail sales softening but labour market tightness contributing to CPI rises
Tourism and retail
-8
-6
-4
-2
0
2
4
6
8
10
00 01 02 03 04 05 06
%
CPI, YOY
Unemployment
CPI and unemployment
Source: Datastream, Economics@ANZ
-20
0
20
40
60
01 02 04 05-100
-50
0
50
100
150
200
250% YOY
Visitor arrivals (RHS)
Retail sales , volume (LHS)
% YOY
Hang Seng rally contributing to local high liquidity
M2 growth
0
2,000
4,000
6,000
8,000
10,000
12,000
14,000
16,000
18,000
01 02 03 04 05 060
20
40
60
80
100
120Index
Hang Seng (LHS)
Index
Property prices (RHS)
Market prices
Source: Datastream, Economics@ANZ
-10
-5
0
5
10
15
20
25
30
01 02 04 05
% YOY
• The economy continues to benefit from its expanding ties to the mainland. Chinese IPOs on the Hang Seng are increasing its capitalisation and generating capital inflows, while rising visitor arrivals from China continue to outpace growth from other geographies. The government remains keen to benefit from the mainland’s boom, and this month signed off on the fourth phase of the Closer Economic Partnership Agreement to reduce cross-border restrictions in the areas of legal services, construction, tourism and air transport.
• Growing activity between Hong Kong and China is allowing the economy to absorb what would otherwise be dampening effects on growth. Exports have slowed to annual growth of only 8% as of May, while the property sector has softened with sharp declines in mortgage approvals and a softening of what had been strong rises in property prices. Retail sales have also softened, to an annual increase of only 2.0%, in volume terms, in May after rising at more than 8% in the first four months of the year. Nonetheless, unemployment reached a five-year low of 4.9% in May.
• Some of the overflow of China’s high liquidity can be seen in the Hong Kong economy, where M2 growth accelerated to 17.6% in May after average growth of 8.6% over the first four months of the year and despite ongoing official interest rate increases. The Hong Kong base rate rose to 6.75% in June, following the 17th US Federal Reserve hike. However, the prime lending rate offered by commercial banks has remained at 8% since March, in effect ignoring two official rate hikes. The CPI accelerated to 2.1% YOY in May, the highest rate since before the Asian crisis.
• Some of the costs associated with close proximity to the mainland are also becoming apparent; a report released last month by three local universities estimated that air pollution now brings economic losses equivalent to US$2.6 bn (1.5% of GDP) per year.
Amy Auster
Economic data – Hong Kong Monthly data Oct 05 Nov 05 Dec 05 Jan 06 Feb 06 Mar 06 Apr 06 May 06 Visitor Arrivals, %YOY 6.2 5.6 5.5 15.6 10.6 14.8 9.5 7.0 Retail Sales, % YOY 4.8 4.1 6.8 11.6 -3.2 9.1 9.4 5.3 Consumer Price Index, % YOY 1.3 1.2 1.4 1.8 1.3 1.7 1.9 2.1 Exports, % YOY 12.1 11.8 7.0 4.7 21.1 15.3 10.0 n/a Imports, % YOY 10.1 13.9 11.0 1.2 28.9 16.6 11.8 n/a Trade Balance, US$ bn 0.4 -0.5 -2.2 0.6 -3.0 -2.4 -1.9 n/a Foreign Exchange Reserves, US$ bn 121.9 122.4 124.3 127.8 125.7 125.9 127.0 126.5 Quarterly data Jun 04 Sep 04 Dec 04 Mar 05 Jun 05 Sep 05 Dec 05 Mar 06 Real GDP, % YOY 12.3 7.0 7.5 5.5 7.3 8.4 7.8 8.0 - Private consumption 11.2 5.7 6.0 4.1 2.4 3.6 3.4 4.5 - Government consumption 0.0 -1.3 -1.7 -4.6 -2.3 -1.6 -3.8 1.3 - Gross fixed capital expenditure 10.3 0.8 -2.4 0.4 4.9 2.8 8.4 8.5 Nominal GDP, US$ bn 41.5 41.1 42.1 42.7 44.3 44.9 45.8 n/a Current Account, US$ bn 0.6 6.5 7.5 4.2 4.1 5.6 6.4 4.6 Capital Account, US$ bn 0.0 -0.2 -0.1 -0.3 -0.2 -0.1 -0.1 n/a Source: Datastream

Economics@ANZ ANZ International Economics Monthly – June 2006
Page 16
Country Update: India Inflation picks up
Wholesale prices
4
5
6
03 04 05 06
% pa.
Policy rate
Sources: Bloomberg,Datastream
0
2
4
6
8
10
12
14
16
03 04 05
Annual % change
Reverse repo rateTotal WPI
Fuel
Current account reverts to surplus in Q1 2006
-20000
-15000
-10000
-5000
0
5000
10000
98 99 00 01 02 03 04 05
Sources: Bloomberg and Reserve Bank of India
US$ mn
Trade
Services
Transfers
Current account
• The central bank’s unexpected inter-meeting interest rate hike signals growing concerns over inflation risks. The RBI lifted its key reverse-repurchase rate by 25 bps to 5.75% on 8 June, three days after the government lifted gasoline and diesel prices. The wholesale price index, which is used as an inflation benchmark, has begun to gather momentum. It rose by 5.44% in the week ended 17 June, the fastest pace since 14 May 2005. Higher fuel costs together with increases in fruit and vegetable prices have lifted inflation. However, the government has recently taken steps to reduce import duties on essential commodities to help stem price increases. The import duty on wheat has been reduced to 5% from 50% with effect from 28 June till 31 December and pulses and sugar have been allowed in duty-free. Exports of pulses have also been banned.
• The RBI has maintained its inflation target of 5-5.5%. We expect that the central bank will lift its policy rate by another 25 bps to 6% at its next meeting on 25 July and the risk of a further rate hike has increased especially in the climate of global monetary tightening.
• The current account recorded a surplus of US$1.8 bn in the March quarter, underpinned by strong remittance inflows from Indians working abroad and revenue from software exports. For FY2005/06, the current account deficit widened to US$10.6 bn, compared with a shortfall of US$5.4 bn in FY2004/05. Foreign direct investment was a stronger US$2.04 bn in the March quarter compared with an average of US$1.2 bn over the past three quarters and portfolio investment Was US$4.3 bn.
• On the political front, the agreement between India and China to resume trade through the Himalayan Nathula Pass, which has been closed for more than 40 years, signals a further thawing of bilateral relations. India’s trade with China reached US$18.7 bn in 2005 or 7.8% of India’s total trade.
Jasmine Robinson
Economic data – India Monthly data Oct 05 Nov 05 Dec 05 Jan 06 Feb 06 Mar 06 Apr 06 May 06 Industrial Production, %YOY 9.4 5.9 5.9 8.9 8.9 8.8 9.1 n/a Passenger car sales, % YOY 2.3 0.0 1.3 8.5 7.7 19.1 21.0 27.7 Consumer Price Index, % YOY 4.2 5.4 5.6 4.4 4.6 4.6 4.6 n/a Exports, % YOY 30.3 22.7 26.9 25.7 12.3 20.6 12.1 21.6 Imports, % YOY 32.6 20.5 16.0 14.1 21.4 18.7 16.7 8.0 Trade Balance, US$ bn -3.2 -2.5 -2.7 -2.9 -3.2 -2.9 -4.2 -3.8 Foreign Exchange Reserves, US$ bn 137.0 137.0 131.0 134.0 136.0 145.0 154.0 n/a Quarterly data Jun 04 Sep 04 Dec 04 Mar 05 Jun 05 Sep 05 Dec 05 Mar 06 Real GDP, % YOY (at factor cost) 7.9 6.7 7.0 8.4 8.5 8.3 7.5 9.3 - Agriculture 6.6 8.0 8.1 6.8 9.5 6.3 7.0 7.9 - Industry 3.5 -0.2 -1.2 1.0 3.4 4.0 2.9 5.5 - Services 10.1 8.4 9.4 11.4 9.6 9.7 8.2 10.8 Nominal GDP, US$ bn 144.2 142.0 171.9 175.9 168.4 168.3 191.1 196.4 Current Account, US$ bn 3.4 -3.5 -5.5 0.2 -4.6 -5.1 -3.9 n/a Capital Account, US$ bn 4.5 3.1 11.7 12.4 5.4 9.9 -0.6 n/a Source: Datastream, Bloomberg

Economics@ANZ ANZ International Economics Monthly – June 2006
Page 17
Country Update: Indonesia Foreign reserves and debt indicators improve
20
25
30
35
40
45
00 01 02 03 04 05
US$ bn
Source: Datastream
Foreign reserves Debt Indicators
40
60
80
100
120
140
160
180
200
96 97 98 99 00 01 02 03 04 05
ratios
Debt to GDP
Short-term debt to reserves
Inflation moderates, lifting prospects for further interest rate cuts
Annual % change
Inflation
-8
-6
-4
-2
0
2
4
6
8
01 02 03 04 05
% pa
Real interest rates
Sources: Datastream, Bank Indonesia
-5
0
5
10
15
20
01 02 03 04 05
Total CPI
CPI-Food
• The government has indicated that its plans to pay US$3.7 bn of the US$7.8 bn owed to the IMF shortly. The partial repayment, which is ahead of its 2010 schedule, highlights the improvement in Indonesia’s external position with foreign reserves exceeding US$40 bn as at May 2006. The early payment will also alleviate the government’s debt servicing burden and offers scope for the reallocation of spending.
• The government is committed to maintaining fiscal discipline, having made inroads in containing the deficit in recent years. The fiscal deficit for 2006 is now estimated to reach 1.4% of GDP, up from the initial budget estimate of 0.7% of GDP. The government is expected to use funds left over from the 2005 budget to help mitigate the economic impact of high interest rates. However, the GDP growth estimate of 5.9% for 2006 appears optimistic.
• Partial indicators suggest that private consumption remains weak. Motor-cycle sales are still down by more than 20%. An expected easing in inflation will prompt further cuts in the BI rate in the months ahead and this will also help to lift both consumption and investment. Inflation continued its decline in June, moderating to 15.5% YOY, compared with 17% YOY at the start of the year. We expect a 50 bps cut in July, bringing the BI rate to 12%.
• The rupiah has weakened since early May, largely reflecting US dollar strength on the back of expectations of further US interest rate hikes. While a fall in Indonesian rates will also contribute to a further narrowing of interest rate differentials, Indonesian rates are still at a relatively high level and the current negative real interest rate gap will narrow and, we expect it to become positive in the second half of the year, giving some support to the currency.
Jasmine Robinson
Economic data – Indonesia Monthly data Oct 05 Nov 05 Dec 05 Jan 06 Feb 06 Mar 06 Apr 06 May 06 Industrial Production, %YOY -5.4 0.2 -4.7 -3.3 0.07 0.17 n/a n/a Motor cycle sales, % YOY 28.5 35.4 -3.0 -31.1 -9.0 -31.0 -33.5 -23.1 Consumer Price Index, % YOY 17.9 18.4 17.1 17.0 17.9 15.74 15.4 15.6 Exports, % YOY 4.8 11.5 22.1 22.5 15.18 1.14 11.89 n/a Imports, % YOY 15.3 3.7 -3.7 3.6 5.33 -12.93 -5.4 n/a Trade Balance, US$ bn 3.0 2.8 3.3 3.3 2.84 3.11 2.85 n/a Foreign Exchange Reserves, US$ bn 31.0 31.6 33.0 33.2 33.66 38.17 40.69 n/a Quarterly data Jun 04 Sep 04 Dec 04 Mar 05 Jun 05 Sep 05 Dec 05 Mar 06 Real GDP, % YOY 4.4 4.7 7.0 6.3 5.6 5.8 4.8 4.6 - Private consumption 5.3 5.1 3.9 3.4 3.8 4.4 4.2 3.2 - Government consumption 7.1 -1.6 -0.9 -8.1 -6.3 14.4 33.2 13.8 - Gross fixed capital expenditure 14.3 17.0 16.2 14.3 15.0 9.4 1.8 2.5 Nominal GDP, US$ bn 62.1 63.3 66.1 67.8 69.1 69.5 74.8 82.8 Current Account, US$ bn 2.2 2.8 0.3 1.0 0.9 -0.1 1.3 n/a Capital & Financial Account, US$ bn -0.7 0.9 1.1 0.1 -0.2 1.7 4.7 n/a Sources: Bloomberg, Datastream, Bank Indonesia

Economics@ANZ ANZ International Economics Monthly – June 2006
Page 18
Country Update: Japan
Leading indicators continue upward climb Leading indicators
-65
-55
-45
-35
-25
-15
-5
5
15
25
95 98 01 04
Index levelLarge enterprises
All businesses
Manufacturing
Tankan – business conditions
Source: Datastream, Economics@ANZ
30
40
50
60
70
80
90
100
110
Oct-01 Oct-03 Oct-05
Leadingeconomic
index
Index level
Purchasing managers' index
Market participants anticipating BOJ move Inflation
-15
-10
-5
0
5
10
00 01 02 03 04 05 06
% YOY
Industrial production
Retail sales
IP and retail sales
Source: Datastream, Economics@ANZ
-3
-2
-1
0
1
2
3
Oct-01 Oct-03 Oct-05
10-yr bondyield, % pa
%
Headline CPI, % YOY
Core CPI, % YOY
• The long-awaited Tankan survey report for June confirmed suspicions that business activity has continued to increase and the outlook to improve. Overall business conditions scored a 6, a level not seen since 1992. The diffusion index (DI) for large manufacturers rose by one point to 21, while the diffusion index for large non-manufacturers rose by 2 points to 20. The DI is a ratio of those who express a positive outlook as against a negative outlook for the economy.
• The Tankan survey led to increased speculation that the Bank of Japan will imminently end its zero interest rate policy and raise its overnight call rate to above zero at its 13-14 July meeting. We have pencilled in a rate hike for August, as we believe the BOJ will await second quarter GDP data before determining whether deflationary pressures have been vanquished.
• There are data that support a more cautious BOJ approach, such as an unemployment rate that is still above 4%; declining unit labour costs in the manufacturing sector; the failure of disposable income to rise despite tightening labour markets; and a lack of clear direction on consumption indicators such as retail sales. Most importantly, the GDP deflator remained in negative territory on a MOM and YOY basis in the first quarter, likely representing domestic productivity gains and a lack of pass through of higher input prices to end users by manufacturers.
• Another reason why the BOJ can afford to wait is because, unlike the US bond market, the Japanese bond market is already doing the central bank’s work. Yields on long-term bonds have risen by roughly 50 bps since the start of the year, or roughly the same amount as core inflation. In other words, the removal of quantitative easing and transmission of BOJ’s policy intentions are already tightening liquidity conditions in Japan and leading to a more neutral monetary policy stance. Under these conditions, the BOJ can afford to wait until it is convinced that deflation has left the building.
Amy Auster
Economic data – Japan Monthly data Oct 05 Nov 05 Dec 05 Jan 06 Feb 06 Mar 06 Apr 06 May 06 Industrial Production, %YOY 2.5 3.4 4.9 2.8 2.5 3.1 3.3 3.1 Retail Sales, % YOY -0.5 0.6 1.3 -0.4 1.1 1.1 -0.8 0.1 Consumer Price Index, % YOY -0.7 -0.8 -0.1 0.5 0.4 0.3 0.4 n/a Exports, % YOY 2.3 1.4 2.9 1.4 7.5 5.9 2.0 13.5 Imports, % YOY 11.7 3.1 11.6 13.4 16.0 12.5 10.2 12.6 Trade Balance, US$ bn 7.1 5.0 7.7 -3.1 8.0 8.2 5.6 3.4 Foreign Exchange Reserves, US$ bn 823.2 824.3 828.8 832.9 831.6 832.7 839.2 842.8 Quarterly data Jun 04 Sep 04 Dec 04 Mar 05 Jun 05 Sep 05 Dec 05 Mar 06 Real GDP, % YOY 2.6 2.3 0.5 1.1 2.7 2.7 4.0 3.5 - Private consumption 2.5 2.4 0.6 1.1 1.8 2.0 3.3 2.4 - Government consumption 2.2 1.6 1.4 1.9 1.4 2.1 1.6 0.8 - Gross fixed capital formation 0.9 1.5 -1.1 1.0 3.4 5.1 3.9 4.8 Nominal GDP, US$ bn 4643.7 4525.6 4515.0 4676.0 4766.3 4821.9 4771.2 4766.1 Current Account, US$ bn 179.1 171.4 170.2 170.9 167.9 165.5 167.4 200.4 Capital Account, US$ bn 2.7 2.3 0.5 1.1 2.7 2.7 4.0 3.0 Source: Datastream
Economics@ANZ ANZ International Economics Monthly – June 2006
Page 19
Country Update: Korea
Leading indicators leveling off
80
90
100
110
120
130
140
01 02 03 04 05
Leadingeconomic
index
Index level
Consumer sentiment
-10
-5
0
5
10
15
20
25
30
00 01 02 03 04 05
%
Industrial production
Retail sales
Leading indicators IP and sentiment
Source: Datastream, Economics@ANZ
But conditions still appear rather tight
0
1
2
3
4
5
6
01 02 03 04 05
CPI
% YOY
Core
60
65
70
75
80
85
90
95
100
00 01 02 03 04 050
1
2
3
4
5
6
7
8Ratio
Operating ratio
Unemployment
%
Inflation Capacity constraints
Source: Datastream, Economics@ANZ
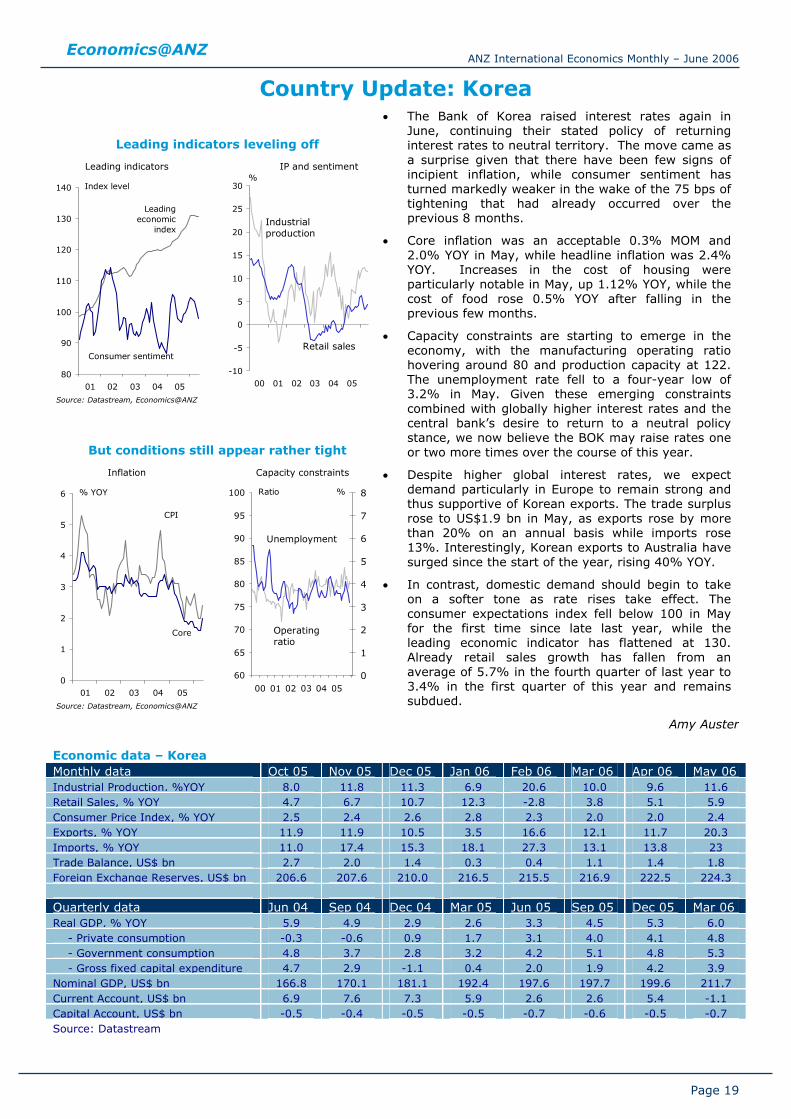
• The Bank of Korea raised interest rates again in June, continuing their stated policy of returning interest rates to neutral territory. The move came as a surprise given that there have been few signs of incipient inflation, while consumer sentiment has turned markedly weaker in the wake of the 75 bps of tightening that had already occurred over the previous 8 months.
• Core inflation was an acceptable 0.3% MOM and 2.0% YOY in May, while headline inflation was 2.4% YOY. Increases in the cost of housing were particularly notable in May, up 1.12% YOY, while the cost of food rose 0.5% YOY after falling in the previous few months.
• Capacity constraints are starting to emerge in the economy, with the manufacturing operating ratio hovering around 80 and production capacity at 122. The unemployment rate fell to a four-year low of 3.2% in May. Given these emerging constraints combined with globally higher interest rates and the central bank’s desire to return to a neutral policy stance, we now believe the BOK may raise rates one or two more times over the course of this year.
• Despite higher global interest rates, we expect demand particularly in Europe to remain strong and thus supportive of Korean exports. The trade surplus rose to US$1.9 bn in May, as exports rose by more than 20% on an annual basis while imports rose 13%. Interestingly, Korean exports to Australia have surged since the start of the year, rising 40% YOY.
• In contrast, domestic demand should begin to take on a softer tone as rate rises take effect. The consumer expectations index fell below 100 in May for the first time since late last year, while the leading economic indicator has flattened at 130. Already retail sales growth has fallen from an average of 5.7% in the fourth quarter of last year to 3.4% in the first quarter of this year and remains subdued.
Amy Auster
Economic data – Korea Monthly data Oct 05 Nov 05 Dec 05 Jan 06 Feb 06 Mar 06 Apr 06 May 06 Industrial Production, %YOY 8.0 11.8 11.3 6.9 20.6 10.0 9.6 11.6 Retail Sales, % YOY 4.7 6.7 10.7 12.3 -2.8 3.8 5.1 5.9 Consumer Price Index, % YOY 2.5 2.4 2.6 2.8 2.3 2.0 2.0 2.4 Exports, % YOY 11.9 11.9 10.5 3.5 16.6 12.1 11.7 20.3 Imports, % YOY 11.0 17.4 15.3 18.1 27.3 13.1 13.8 23 Trade Balance, US$ bn 2.7 2.0 1.4 0.3 0.4 1.1 1.4 1.8 Foreign Exchange Reserves, US$ bn 206.6 207.6 210.0 216.5 215.5 216.9 222.5 224.3 Quarterly data Jun 04 Sep 04 Dec 04 Mar 05 Jun 05 Sep 05 Dec 05 Mar 06 Real GDP, % YOY 5.9 4.9 2.9 2.6 3.3 4.5 5.3 6.0 - Private consumption -0.3 -0.6 0.9 1.7 3.1 4.0 4.1 4.8 - Government consumption 4.8 3.7 2.8 3.2 4.2 5.1 4.8 5.3 - Gross fixed capital expenditure 4.7 2.9 -1.1 0.4 2.0 1.9 4.2 3.9 Nominal GDP, US$ bn 166.8 170.1 181.1 192.4 197.6 197.7 199.6 211.7 Current Account, US$ bn 6.9 7.6 7.3 5.9 2.6 2.6 5.4 -1.1 Capital Account, US$ bn -0.5 -0.4 -0.5 -0.5 -0.7 -0.6 -0.5 -0.7 Source: Datastream

Economics@ANZ ANZ International Economics Monthly – June 2006
Page 20
Country Update: Malaysia Inflation pressures likely to persist in second
half of 2006
Inflation Money supply
Source: Datastream
-10
-5
0
5
10
15
01 02 03 04 05
% YOY
PPI
CPI
0
5
10
15
20
25
30
35
01 02 03 04 05
% YOY
M2
Trade trends
Source: Datastream
-15
-10
-5
0
5
10
15
20
25
30
35
2002 2003 2004 2005
3-month mvg avg, %YOY
imports
exports
• Malaysia’s inflation rate eased in May to 3.9% YOY after staying above 4.5% YOY in March and April. Money supply (M2) has also slowed from over 30% YOY in July 2005 to 14.8% YOY in May 2006. However, we still expect inflation to remain elevated in the second half of the year. The impact of utility rate hikes (domestic electricity and water tariffs lifted in June and July respectively), recovery in chicken and meat prices and still-high petrol prices are expected to filter through to consumer prices.
• Against the backdrop of rising global interest rates, relatively healthy economic growth and inflation concerns, Bank Negara is expected to continue on the path of policy normalisation. We have forecast another 25 bps hike in the overnight policy rate (OPR) when the central bank meets at the end of July. The OPR is currently at 3.5%.
• Export trends have eased in recent months while imports have outpaced export expansion. Imports of capital goods have stayed strong but the outlook for exports is for some slowing as global growth decelerates. We therefore expect real GDP to expand by around 5.4% this year, slower than the government’s forecast of 6%.
• After the steady appreciation track of the ringgit since the new exchange rate regime was adopted in July 2005, the currency has retreated over the past month and is heading towards USD/MYR3.70 from a high of USD/MYR3.57 in early May. While this largely reflects US dollar strength underpinned by expectations of further US interest rate hikes, the recent fluctuations in the MYR signal greater flexibility in exchange rate management on the part of the central bank. We continue to expect the MYR, along with other Asian currencies, to appreciate against the US dollar in the second half of the year, riding on the back of JPY and CNY strength. Expectations of higher domestic interest rates will also support a ringgit appreciation.
Jasmine Robinson
Economic data – Malaysia Monthly data Oct 05 Nov 05 Dec 05 Jan 06 Feb 06 Mar 06 Apr 06 May 06 Industrial Production, %YOY 6.3 8.5 2.2 4.7 7.9 3.6 4.7 n/a Motor Vehicle sales, % YOY 29.1 7.7 4.9 2.9 -8.7 -9.4 -5.4 -0.5 Consumer Price Index, % YOY 3.1 3.3 3.2 3.2 3.2 4.8 4.6 3.9 Exports, % YOY 13.8 12.5 13.8 11.6 17.1 12.6 10.3 n/a Imports, % YOY 9.5 6.6 8.7 10.3 20.1 17.2 15.6 n/a Trade Balance, US$ bn 2.8 2.3 2.5 2.3 2.0 2.6 2.0 n/a Foreign Exchange Reserves, US$ bn 76.9 72.6 70.2 71.3 72.7 73.2 75.9 80.1 Quarterly data Jun 04 Sep 04 Dec 04 Mar 05 Jun 05 Sep 05 Dec 05 Mar 06 Real GDP, % YOY 8.4 6.8 5.9 5.9 4.1 5.4 5.2 5.2 - Private consumption 11.9 11.2 10.2 10.1 7.4 10.4 9.0 7.5 - Government consumption 9.5 1.3 4.4 1.0 0.6 4.7 12.6 0.1 - Gross fixed capital expenditure 3.5 3.2 2.3 2.0 6.7 9.6 0.4 11.4 Nominal GDP, US$ bn 29.4 30.1 30.7 31.2 32.0 33.6 34.0 35.2 Current Account, US$ bn 3.3 4.4 3.4 5.8 4.8 4.9 4.5 5.3 Capital & Financial Account, US$ bn 0.2 -0.9 2.9 0.9 0.1 1.5 -12.4 -1.4 Sources: Datastream, Bloomberg

Economics@ANZ ANZ International Economics Monthly – June 2006
Page 21
Country Update: New Zealand
Gross Domestic Product
-0.2
0
0.2
0.4
0.6
0.8
1
1.2
1.4
Jun-04 Dec-04 Jun-05 Dec-05 Jun-06 Dec-06
QOQ% Change
Rebound
Easing for remainder of 2006
Current Account Deficit
-10
-9
-8
-7
-6
-5
-4
-3
-2
-1
0
93 94 95 96 97 98 99 00 01 02 03 04 05 06
% of GDP
Source: Statistics NZ
• As expected, the New Zealand economy recorded a pick-up in economic activity in the March quarter, following a flat second half of 2005. Gross Domestic Product increased 0.7% over the quarter, taking annual growth to 2.2%, from 2.3% in December.
• But just as we believed growth was understated in the second half of 2005, there were influences that inflated the March outturn. A rebound in inventories, which alone contributed 1.2 percentage points to growth, overstated the level of economic activity in the March quarter, just as a massive stock run-down overstated the weakness in the December quarter.
• With close to 70% of the economy being domestic and spending dominated, slow consumer spending leaves a massive void to fill. A weaker currency is laying the platform for a strong up-tick in export performance although the lag between the two is typically 18 months. In the interim, there is a glaring absence of an engine to drive the economy, leaving growth decidedly sluggish into 2007. This foreshadows a two-sided economy during this period as a rebalancing takes place from the domestic to the export orientated sectors.
• New Zealand recorded a current account deficit of 9.3% of GDP during the year ended March 2006, the worst since 1975. However, the composition does not look as bad as the headline implies with the deterioration largely driven by a high investment income deficit, which is heavily linked to a strong domestic profitability cycle.
• The Reserve Bank left the Official Cash Rate unchanged at 7.25% at the review on the 8th of June. While acknowledging a backdrop of slowing economic activity, the Bank continues to talk tough in an attempt to maintain policy traction along the yield curve and keep a lid on inflation expectations.
Cameron Bagrie
Economic data – New Zealand Monthly data Oct 05 Nov 05 Dec 05 Jan 06 Feb 06 Mar 06 Apr 06 May 06 Retail Sales, % YOY 7.0 6.7 6.4 6.4 6.3 6.1 5.7 n/a Residential building consents (% -17.5 -17.8 -17.2 -15.1 -13.6 -16.0 -13.6 -10.7 Exports, % YOY 1.6 0.8 0.3 -0.5 -1.2 0.0 0.4 4.1 Imports, % YOY 8.0 7.9 6.8 8.5 8.1 7.7 7.6 8.7 Annual Trade Balance, US$ bn -4.3 -4.6 -4.5 -4.9 -4.9 -4.5 -4.3 -4.4 Quarterly data Jun 04 Sep 04 Dec 04 Mar 05 Jun 05 Sep 05 Dec 05 Mar 06 Real GDP, % YOY 4.1 4.3 4.3 3.7 3.1 2.7 2.3 2.2 - Private consumption 6.5 6.7 6.5 5.8 5.7 5.1 4.7 4.1 - Government consumption 4.8 5.3 5.6 5.2 5.0 5.9 5.7 5.6 - Gross fixed capital expenditure 15.6 15.4 13.2 7.8 4.9 4.0 4.3 5.6 Nominal GDP, US$ bn 89.5 93.6 97.8 100.5 105.0 107.8 108.6 107.6 Annual Current Account, US$ bn -4.4 -5.6 -6.5 -7.4 -8.4 -9.1 -9.6 -10.1 Consumer Price Index, annual % 2.4 2.5 2.7 2.8 2.8 3.4 3.2 3.3 Sources: Statistics NZ, ANZ National Bank

Economics@ANZ ANZ International Economics Monthly – June 2006
Page 22
Country Update: Philippines Inflation moderates keeping interest rates
unchanged
Inflation
6
7
8
9
10
03 04 05 06
% pa.Policy rates
Sources: Bloomberg, Datastream
0
1
2
3
4
5
6
7
8
9
10
03 04 05 06
%YOY
Overnight lending rate
Overnight borrowing rate
core
Total CPI
External trade improves
Trade Remittances
Sources: Bloomberg, Datastream
-10
-5
0
5
10
15
20
25
30
35
40
03 04 05 06
3-mth mvg avg, %YOY
exports
Imports
1
1.5
2
2.5
3
03 04 05
US$ bn
• The central bank left its policy rate unchanged for the ninth successive month. The overnight borrowing rate is currently at 7.5%. Inflation in May of 6.9% YOY was the lowest in four months. However, we expect high oil prices, higher VAT rate and the lifting of the minimum wage in Manila by 8% and impending wage increases across other regions, to lead to upward price pressures. This raises the prospect of a rate hike in the second half. The impact on the peso of successive US rate hikes and the narrowing of interest rate differentials are also likely to lend support for further monetary tightening.
• On the external front, a narrower trade deficit and an increase in remittances from overseas workers have helped to improve the Philippines’ current account surplus in Q1 2006. It increased to US$1.2 bn in Q1 2006 compared with US$594 mn in Q1 2005. The trade deficit fell by 15% while remittances climbed by more than 14%. A larger balance of payments surplus of US$2.1 bn was also recorded in Q1 2006 compared with US$782 mn in Q1 2005. This has contributed to a steady climb in reserves, which stood at US$20.9 bn as at May 2006, up 13.3% from December 2005.
• The country’s fiscal position also looks likely to improve on targets set for 2006. For the first five months of 2006, the budget deficit was Ps44.2 bn down from Ps67.8 bn for January-May 2005. Total public sector debt fell to 93.4% of GDP in 2005, down from a ratio of 109% in 2004 and on-going fiscal consolidation will help to reduce this further.
• While economic fundamentals have been improving, the political situation remains volatile. Opposition parties have launched a new campaign to impeach President Arroyo for the second time during this term. While public support for the President has waned, she still has the support of the lower house and it appears unlikely that this latest attempt by the opposition will be successful. Nevertheless, the pace of reform could be impeded.
Jasmine Robinson
Economic data – Philippines Monthly data Oct 05 Nov 05 Dec 05 Jan 06 Feb 06 Mar 06 Apr 06 May 06 Manufacturing Production, %YOY 7.3 10.8 0.4 -9.4 -11.4 -7.7 -13.9 n/a Motor Vehicle sales, % YOY 12.8 -4.0 11.2 19.9 -12.7 -3.8 -12.3 5.2 Consumer Price Index, % YOY 7.0 7.1 6.7 6.7 7.6 7.6 7.1 6.9 Exports, % YOY -3.2 -1.5 16.8 1.2 14.9 26.3 20.5 n/a Imports, % YOY -3.1 1.4 28.9 5.0 4.6 8.0 7.4 n/a Trade Balance, US$ mn -248.0 -79.0 -382.0 -354.0 90.0 -10.0 -505.0 n/a Foreign Exchange Reserves, US$ bn 76.6 72.6 70.2 71.6 73.2 73.5 76.7 79.8 Quarterly data Jun 04 Sep 04 Dec 04 Mar 05 Jun 05 Sep 05 Dec 05 Mar 06 Real GDP, % YOY 6.9 6.0 5.5 4.2 5.4 4.8 5.3 5.5 - Private consumption 6.3 5.5 5.7 5.0 4.8 5.0 5.0 5.1 - Government consumption 0.8 -1.9 1.6 2.2 12.4 -0.3 1.1 9.4 - Gross fixed capital expenditure 3.3 -3.4 0.8 -8.1 -2.5 -0.1 -4.6 -3.4 Nominal GDP, US$ bn 21.3 22.0 22.6 23.3 24.5 24.4 26.3 27.6 Current Account, US$ bn 0.3 0.5 1.5 0.7 0.4 0.2 1.1 n/a Capital Account, US$ mn 0.8 -0.7 -1.5 1.1 0.5 0.5 -3.1 n/a Sources: Datastream, Bloomberg

Economics@ANZ ANZ International Economics Monthly – June 2006
Page 23
Country Update: Singapore Industrial production moderates
-40
-30
-20
-10
0
10
20
30
99 00 01 02 03 04 05
Annual % ch., 3-mth mvg avg
Source: Datastream
Industrial production
Domestic exports –Electronics*
Electronics exports : disk drives, integrated circuits, PCs, parts of PCs & telecom. eqpt
Inflation eases
-5
-4
-3
-2
-1
0
1
2
3
4
01 02 03 04 05
YOY % ch
Source: Datastream
CPI-Total
CPI-Transport & Communications
CPI-Food
• Growth in industrial production in April and May has been significantly slower than the first quarter. With manufacturing accounting for about a quarter of GDP, real GDP growth in the second quarter is not expected to match the strong performance of the first quarter. However, relatively healthy external demand is likely to support a respectable growth outcome for Q2 2006. Demand for pharmaceuticals is expected to remain firm, although production cycles will mean wide fluctuations in output over the year. Within the electronics industry, disk drive production has been weak but semiconductor output is expected to expand at a strong pace.
• Singapore’s trade position remains healthy with the merchandise trade surplus rising by 29% YOY, in US dollar terms, for the first five months of this year. Non-oil domestic exports, in particular, rose a strong 18% YOY in the same period, underscoring the upturn in global electronics demand and solid world growth.
• Inflation has eased from a high of 1.8% YOY in January to 1.1% YOY in May. Housing (eg. utilities) and food prices have edged up while the rate of decline in transport & communications costs is slowing and could turn positive in the latter part of the year, reflecting still-high oil prices and an increase in taxi fares. Inflation risks remain on the upside reflecting some commodity price pass-through as well as an upturn in domestic demand. However, the gradual appreciation of the currency is likely to help to stem imported inflation. In its April 2006 monetary policy statement, the central bank lifted its inflation forecast for 2006 to 1-2% from 0.5-1.5% previously.
Jasmine Robinson
Economic data – Singapore Monthly data Oct 05 Nov 05 Dec 05 Jan 06 Feb 06 Mar 06 Apr 06 May 06 Industrial Production, %YOY 18.9 21.1 5.4 1.8 37.1 25.8 2.8 10.6 Retail Sales, % YOY 6.3 6.4 7.4 -0.6 10.6 12.1 6.8 n/a Consumer Price Index, % YOY 1.1 1.0 1.3 1.8 1.2 1.1 1.1 1.1 Exports, % YOY 16.9 18.1 20.2 18.6 30.7 20.7 16.0 23.3 Imports, % YOY 20.3 13.1 19.0 10.4 40.3 12.5 13.5 30.2 Trade Balance, US$ bn 2.2 3.2 3.8 3.1 1.9 3.8 2.7 2.1 Foreign Exchange Reserves, US$ bn 115.7 114.6 115.8 119 119.0 121.4 126.5 n/a Quarterly data Jun 04 Sep 04 Dec 04 Mar 05 Jun 05 Sep 05 Dec 05 Mar 06 Real GDP, % YOY 13.2 8.4 7.6 3.6 5.7 7.6 8.5 10.8 - Private consumption 10.1 5.1 2.9 2.9 2.0 1.3 3.9 1.9 - Government consumption -6.9 -5.9 0.5 7.6 -1.8 7.1 9.9 10.0 - Gross fixed capital expenditure 12.3 13.6 0.7 -8.8 -6.4 -6.6 15.0 11.4 Nominal GDP, US$ bn 26.1 26.5 28.6 28.3 28.7 29.3 30.4 30.9 Current Account, US$ bn 5.9 7.4 7.5 6.5 7.8 9.4 9.5 9.4 Capital & Financial Account, US$ bn -4.9 -6.8 -3.1 -4.0 -1.0 -9.4 -5.8 -4.8 Sources: Bloomberg, Datastream, Economic Survey of Singapore

Economics@ANZ ANZ International Economics Monthly – June 2006
Page 24
Country Update: Taiwan
Downturn in government consumption hit GDP results for first quarter
Leading indicators
-20
-15
-10
-5
0
5
10
15
20
25
30
01 02 03 04 05
% YOY
Industrial production (volume)
Exports
Exports and IP
Source: Datastream, Bloomberg, Economics@ANZ
-30
-20
-10
0
10
20
30
40
50
00 01 02 03 04 05 0690
95
100
105
110
115
120
125% YOY
Export orders (LHS)
LEI (RHS)
Index level
Monetary conditions look pretty easy
Interest rates Nominal exchange rates
Source: Datastream, Bloomberg, Economics@ANZ
0
2
4
6
8
00 01 02 03 04 05 06
% pa
Taiwan money market
Fed funds
80
85
90
95
100
105
110
115
Jan-06 Mar-06 Jun-06
03 Jan 2005 = 100KRW
MYR
NT$
JPY
CNYSGD
• Economic prospects continue to look strong, with leading indicators and high frequency data continuing to rise in the second quarter. Taiwan’s composite leading index rose to 109.7 in May after a reading of 108.4 the previous month and weakness in the first quarter. Export orders surged 26% YOY and are up more than 20% for the year as a whole. The export price index rose 2.4% YOY in May, its strongest gain since late in 2004. Unsurprisingly, industrial production recorded a strong gain of 8.6% in May.
• We expect external conditions to remain supportive, particularly in North Asia, with global demand for electronics remaining strong. World semiconductor sales rose 11% YOY in May, led by Asia (15%) and the US (9.6%). Taiwan’s exports rose 12% YOY in May, but rising imports limited the trade surplus to US$655 mn after an average of US$1.3 bn for the January-April period. Given our expectations for solid growth in North Asia, we believe demand for Taiwanese exports will remain strong.
• Despite the rising pace of domestic activity and a higher interest rate environment externally, the central bank has raised interest rates very slowly. Meanwhile, the Taiwanese dollar has been kept at roughly USD/NT$32 while other Asian currencies have broadly appreciated against the US dollar. The combination of low interest rates and a relatively weak exchange rate imply a continuation of easy monetary policy conditions. While CPI-ex food remains low, rising only 0.7% YOY in May, headline inflation has started to trend up again and we would expect to see a further drift upward given present conditions.
• A poll conducted in June showed that President Chen has a 70% disapproval rating following a string of scandals that have struck the government. While the President survived a recall motion in Parliament this month, the government remains distracted and increasingly fragmented.
Amy Auster
Economic data – Taiwan Monthly data Oct 05 Nov 05 Dec 05 Jan 06 Feb 06 Mar 06 Apr 06 May 06 Industrial Production, %YOY 8.5 9.5 9.3 4.1 14.1 7.7 6.1 8.6 Retail Sales, % YOY 3.5 4.0 7.1 6.2 -1.7 1.1 1.3 n/a Consumer Price Index, % YOY 2.7 2.5 2.2 2.7 1.0 0.4 1.2 1.6 Exports, % YOY 15.6 9.6 15.6 5.0 24.9 7.2 15.4 10.5 Imports, % YOY 8.1 4.5 -10.6 -6.6 45.3 -0.5 5.3 12.3 Trade Balance, US$ bn 2.2 2.1 3.6 2.3 -0.6 1.5 2.3 0.7 Foreign Exchange Reserves, US$ bn 252.0 251.8 253.3 257.3 257.0 257.1 259.0 260.9 Quarterly data Jun 04 Sep 04 Dec 04 Mar 05 Jun 05 Sep 05 Dec 05 Mar 06 Real GDP, % YOY 7.8 8.9 5.3 2.5 2.3 3.2 4.3 6.5 - Private consumption 5.1 5.9 1.6 3.1 2.5 3.1 3.8 2.7 - Government consumption 1.4 -0.2 -1.4 -2.0 -0.6 0.9 1.0 1.5 - Gross fixed capital expenditure 15.2 24.1 15.5 15.7 8.8 7.9 0.2 -13.8 Nominal GDP, US$ bn 79.4 80.6 80.0 82.1 86.3 86.9 86.7 86.0 Current Account, US$ bn 5.9 5.5 5.3 1.7 4.4 1.8 1.0 9.2 Capital Account, US$ bn -5.7 -5.0 -4.8 -4.4 -4.6 -3.4 -2.9 -7.6 Sources: Bloomberg, Datastream, National Statistics

Economics@ANZ ANZ International Economics Monthly – June 2006
Page 25
Country Update: Thailand
Moderating inflation gives potential for pause in rate hikes
Inflation
0
1
2
3
4
5
6
2002 2003 2004 2005 2006
% pa.
Policy rate
Source: Datastream
-1
0
1
2
3
4
5
6
7
2002 2003 2004 2005 2006
% change YOY
14-day repurchase rate
Core CPI
Total CPI
US Fed Funds rate
Source: Datastream, Economics@ANZ
Oil receipts driving current account blow out
-2000
-1500
-1000
-500
0
500
1000
1500
2000
Jan-01 Jul-01 Jan-02 Jul-02 Jan-03 Jul-03 Jan-04 Jul-04 Jan-05 Jul-05 Jan-06 Jul-06
0
500
1000
1500
2000
2500
US mn US mn, inverted
Current Account Balance (LHS)
Crude Oil imports(RHS)
Current Account Balance & Crude Oil imports
Source: Datastream, Economics@ANZ
• First quarter GDP came in at a stronger than expected 6.1%YOY on the back of a positive trade performance and strong increases in tourist arrivals. This growth was not heavily influenced by the current political turmoil that has now taken hold in Thailand. Over the remainder of 2006 it is expected that the political situation will detract from growth as levels of uncertainty continue to rise. Already the bidding for large public infrastructure investments has been shelved and free-trade talks with Japan and the US have been delayed. With April’s election annulled, a caretaker government remains in place until new elections in mid-October. However, in late June the political uncertainty intensified with the Attorney General’s office suggesting that the ruling Thai Rak Thai and main opposition parties may be disbanded for violating election laws.
• Sustained high oil prices are expected to dampen growth throughout 2006. Higher fuel prices have reduced purchasing power and will impact negatively private consumption. In addition, the significant tightening of monetary policy will also serve to keep consumer demand curtailed. These factors have pushed consumer confidence in April to a 4-year low. However, some relief from interest rate hikes may be in sight. Inflation in June moderated to 5.9%YOY, down from 6.2% in May, with this trend expected to continue in the second half of 2006. Despite the domestic tightening cycle running simultaneously with that of the US, the BoT Governor has indicated that the recent Fed Funds rate hike of 29 June will not influence BoT’s upcoming policy meeting on 19 July.
• Thailand’s trade deficit blew out to an 11-month high in May, with a rapid increase in the import bill due to the sustained higher oil price. In Q2 it is expected that this strong import growth will erode the positive net export contribution to GDP in the first quarter.
• On the basis of weaker consumption and net exports, the Bank of Thailand and Ministry of finance have both revised down their GDP forecasts for 2006 to 4.5% and 4.25-5.25% respectively.
Alex Joiner
Economic data – Thailand Monthly data Oct 05 Nov 05 Dec 05 Jan 06 Feb 06 Mar 06 Apr 06 May 06 Manufacturing Production, %YOY 7.8 7.8 5.7 5.8 13.1 10.2 4.5 9.2 Car Sales, % YOY 3.7 8.3 6.4 -2.8 13.3 -2.2 -4.3 -7.3 Consumer Price Index, % YOY 6.2 5.9 5.8 5.9 5.6 5.7 6.0 6.2 Exports, % YOY 8.4 14.5 11.6 13.6 22.8 15.9 11.7 18.8 Imports, % YOY 18.8 14.8 27.9 2.0 19.0 1.3 0.3 6.4 Trade Balance, US$ bn -0.2 0.1 -0.1 -0.4 -0.3 0.3 -0.6 -0.7 Foreign Exchange Reserves, US$ bn 48.5 49.4 50.7 51.7 52.9 53.7 55.5 n/a Quarterly data Jun 04 Sep 04 Dec 04 Mar 05 Jun 05 Sep 05 Dec 05 Mar 06 Real GDP, % YOY 6.4 6.1 5.4 3.3 4.5 5.4 4.7 6.1 - Private consumption 6.2 5.9 5.2 4.3 4.8 4.5 4.1 4.1 - Government consumption 5.8 1.6 3.7 16.9 8.6 16.6 7.1 -0.9 - Gross fixed capital expenditure 13.2 10.4 15.9 14.7 14.5 9.2 7.6 6.9 Nominal GDP, US$ bn 40.2 39.7 41.8 43.9 43.3 44.0 45.3 48.5 Current Account, US$ bn 0.6 1.3 2.9 -1.4 -4.5 1.2 0.9 1.7 Capital & Financial Account, US$ bn 0.3 0.2 0.5 0.1 4.3 2.9 0.2 0.9 Sources: Bloomberg, Datastream, ANZ Bank

Economics@ANZ ANZ International Economics Monthly – June 2006
Page 26
Country Update: Vietnam The slowing depreciation of the Vietnamese
dong
10,000
11,000
12,000
13,000
14,000
15,000
16,000
17,000
18,000
19,000
20,0001993 1995 1996 1998 1999 2001 2002 2004 2005
0
5
10
15
20
25
Depreciation of VND %YOY
(RHS)
Vietnamese Dong (LHS inverted scale)
USD/VND % YOY
Source: Bloomberg, Economics@ANZ
Inflation eroding trade competitiveness
90
100
110
120
Jan-05 Jul-05 Jan-06
Jan 2003=100Indonesia
Thailand
Philippines
Malaysia
Increases in the index represent an appreciating real exchange rate
Vietnam
80
90
100
110
120
Jan-05 Jul-05 Jan-06
Jan 2003=100
Indonesia
Thailand
PHP
Malaysia
Vietnam
Source: Economics@ANZ, Datastream, Bloomberg
• Vietnam has maintained a heavily managed exchange rate regime against the USD, administered by the State Bank of Vietnam (SBV) since the late 1980’s. Since 1999, the official VND rate has been set by the SBV, in a process in which the official rate can move with the interbank market rate, yet the interbank rate cannot deviate beyond a band set around the official rate. Between early-1999 and mid-2002 this band stood at ± 0.1% and has since widened to ± 0.25% where it remains today. In practice, the SBV will quote the average exchange rate in the interbank market during the previous business day as the official rate. Banks can then trade at an exchange rate within 0.25% on either side of this rate. However, the non-interbank market tends to trade above this official ceiling rate. Despite the widening of the band, the rate of depreciation of the currency has slowed steadily since 2001. Under this system, the SBV plays the role of market maker as the interbank market is thin and can be inactive due to the small number of participants, which are predominantly state-owned commercial banks. This system allows the SBV to allow the dong to depreciate in line with its policy objectives.
• The policy of gradual nominal depreciation is most likely aimed at economic imperatives, namely GDP growth. The gradual depreciation seeks to enhance Vietnam’s trade competitiveness as well as attract much-needed FDI to promote growth and industrialisation. However, trade competitiveness could actually be eroded due to Vietnam’s relatively high inflation environment. The charts demonstrate this point with the real exchange rate (on a CPI basis) appreciating significantly versus the depreciation of nominal rate. Much of this inflation is being driven by the external impact of higher oil prices. However, another significant contributor has been food, which accounts for a sizeable proportion of exports. This appreciation of the dong on a real exchange rate basis erodes the nominal gains of the currency versus other regional currencies. Consequently, gains in trade competitiveness against regional counterparts may also be lost.
Alex Joiner
Economic data – Vietnam Monthly data Oct 05 Nov 05 Dec 05 Jan 06 Feb 06 Mar 06 Apr 06 May 06 Industrial Production+, %YOY 18.1 16.5 16.7 15.7 15.8 12.8 15.6 15.9 Retail Sales+, % YOY 19.1 19.7 20.0 24.8 19.2 19.3 19.4 19.6 Consumer Price Index, % YOY 7.3 7.8 8.3 8.8 8.4 7.7 7.3 7.5 Exports+, % YOY 18.7 21.1 21.9 16.0 28.3 20.3 25.1 24.2 Imports+, % YOY 20.0 19.2 18.3 10.8 4.2 1.9 6.9 7.3 Trade Balance*, US$ bn -0.363 -0.35 -0.33 0.466 -0.31 -0.1 -0.3 -0.4 Tourist Arrivals+, %YOY 22.7 20.6 20.3 15.9 15.1 16.3 15.9 12.0 China, number of visitors* 527,138 559,790 621,786 69,569* 96,277 142,664 210,348 264,870 Quarterly data Growth Q1-Q4 2005 Contributions to Growth Real GDP+, % YOY 7.2 Agriculture, forestry, fishery, % 2.1 1.0 Industry & construction, % YOY 8.7 3.1 Services, % YOY 7.4 3.1 +: January-to date vs same period in previous year *: January to date ^: US$ bn Source: General Statistics Office of Vietnam

ANZ International Economics Monthly – June 2006
Page 27
ANZ Research Economics@ANZ Saul Eslake Fiona Allen Chief Economist Business Manager +61 3 9273 6251 +61 3 9273 6224 [email protected] [email protected] Tony Pearson Julie Toth Mark Rodrigues Riki Polygenis Amber Rabinov Head of Australian Economics Senior Economist, Industry Senior Economist,
Australia Economist, Australia
Economist, Australia
+61 3 9273 5083 +61 3 9273 6252 +61 3 9273 6286 +61 3 9273 4060 +61 3 9273 4853 [email protected] [email protected] [email protected] [email protected] [email protected] Amy Auster Jasmine Robinson Alex Joiner Head of International Economics Senior Economist,
International Economist, International
+61 3 9273 5417 +61 3 9273 6289 +61 3 9273 6123 [email protected] [email protected] [email protected] Paul Braddick Ange Montalti Head of Financial System Analysis Senior Economist, Financial
System Analysis
+61 3 9273 5987 +61 3 9273 6288 [email protected] [email protected] Warren Hogan Cherelle Murphy Head of Markets Research Economist, Markets +61 2 9227 1562 +61 3 9273 1995 [email protected] [email protected] ANZ Investment Bank Warren Hogan Sally Auld Tony Morriss Patricia Gacis Head of Markets Research Senior Interest Rate
Strategist Senior Currency Strategist
Fixed Income Analyst
+61 2 9227 1562 +61 2 9227 1809 +61 2 9226 6757 +61 2 9227 1272 [email protected] [email protected] [email protected] [email protected]
Sarah Percy-Dove John Manning Bradley Bugg Head of Credit Research Senior Credit Analyst Senior Credit Analyst +61 2 9227 1142 +61 2 9227 1493 +61 2 9227 1693 [email protected] [email protected] [email protected] Research & Information Services Mary Yaxley Marilla Chant Manesha Jayasuriya Head of Research & Information Services
Senior Information Officer Information Officer
+61 3 9273 6265 +61 3 9273 6263 +61 3 9273 4121 [email protected] [email protected] [email protected]
ANZ New Zealand Cameron Bagrie Khoon Goh John Bolsover Chief Economist Senior Economist Economist +64 4 802 2212 +64 4 802 2357 +64 4 802 2287 [email protected] [email protected] [email protected]
Sean Comber Steve Edwards Kevin Wilson Economist Economist Rural Economist +64 4 802 2286 +64 4 802 2217 +64 4 802 2361 [email protected] [email protected] [email protected]

ANZ International Economics Monthly – June 2006
Page 28
Important Notice
Australia and New Zealand Banking Group Limited is represented in: AUSTRALIA by Australia and New Zealand Banking Group Limited ABN 11005 357 522 10th Floor 100 Queen Street, Melbourne 3000, Australia Telephone +61 3 9273 6224 Fax +61 3 9273 5711
UNITED KINGDOM by: Australia and New Zealand Banking Group Limited ABN 11 005 357 522 Minerva House, PO Box 7, Montague Close, London, SE1 9DH, United Kingdom Telephone +44 20 7378 2121 Fax +44 20 7378 2378
UNITED STATES OF AMERICA by: ANZ Securities, Inc. (Member of NASD and SIPC) 6th Floor 1177 Avenue of the Americas New York, NY 10036, United States of America Tel: +1 212 801 9160 Fax: +1 212 801 9163
NEW ZEALAND by: ANZ National Bank Limited Level 7, 1-9 Victoria Street, Wellington, New Zealand Telephone +64 4 802 2000
In Australia and the UK, ANZ Investment Bank is a business name of Australia and New Zealand Banking Group Limited, ABN 11 005 357 522 (“ANZ Bank”), which holds an Australian Financial Services licence no. 234527 and is authorised in the UK by the Financial Services Authority (“FSA”). In New Zealand, ANZ Investment Bank is a business name of ANZ National Bank Limited WN / 035976 (“ANZ NZ”).
This document is being distributed in the United States by ANZ Securities, Inc. (“ANZSI”) (an affiliated company of ANZ Bank), which accepts responsibility for its content. Further information on any securities referred to herein may be obtained from ANZSI upon request. Any US person(s) receiving this document and wishing to effect transactions in any securities referred to herein should contact ANZSI, not its affiliates.
This document is being distributed in the United Kingdom by ANZ Bank for the information of its market counterparties and intermediate customers only. It is not intended for and must not be distributed to private customers. In the UK, ANZ Bank is regulated by the FSA. Nothing here excludes or restricts any duty or liability to a customer, which ANZ Bank may have under the UK Financial Services and Markets Act 2000 or under the regulatory system as defined in the Rules of the FSA. This document is issued on the basis that it is only for the information of the particular person to whom it is provided. This document may not be reproduced, distributed or published by any recipient for any purpose. This document does not take into account your personal needs and financial circumstances. Under no circumstances is this document to be used or considered as an offer to sell, or a solicitation of an offer to buy. In addition, from time to time ANZ Bank, ANZ NZ, ANZSI, their affiliated companies, or their respective associates and employees may have an interest in any financial products (as defined by the Australian Corporations Act 2001), securities or other investments, directly or indirectly the subject of this document (and may receive commissions or other remuneration in relation to the sale of such financial products, securities or other investments), or may perform services for, or solicit business from, any company the subject of this document. If you have been referred to ANZ Bank, ANZ NZ, ANZSI or their affiliated companies by any person, that person may receive a benefit in respect of any transactions effected on your behalf, details of which will be available upon request. The information herein has been obtained from, and any opinions herein are based upon, sources believed reliable.
The views expressed in this document accurately reflect the author’s personal views, including those about any and all of the securities and issuers referred to herein. The author however makes no representation as to its accuracy or completeness and the information should not be relied upon as such. All opinions and estimates herein reflect the author’s judgement on the date of this document and are subject to change without notice. No part of the author's compensation was, is or will directly or indirectly relate to specific recommendations or views expressed about any securities or issuers in this document. The author’s compensation will, be based upon, among other factors, the overall profitability of ANZ, including profits from investment banking revenues.
ANZ Bank, ANZ NZ, ANZSI, their affiliated companies, their respective directors, officers, and employees disclaim any responsibility, and shall not be liable, for any loss, damage, claim, liability, proceedings, cost or expense (“Liability”) arising directly or indirectly (and whether in tort (including negligence), contract, equity or otherwise) out of or in connection with the contents of and/or any omissions from this communication except where a Liability is made non-excludable by legislation. Where the recipient of this publication conducts a business, the provisions of the Consumer Guarantees Act 1993 (NZ) shall not apply.