economy - valuewalk.com · an illustrated executive summary the election of modi (m), the...
TRANSCRIPT

ECONOMY
Research Analysts:
October 2016
M+R+T resets = A revolution in 'access'
Ritika Mankar Mukherjee, [email protected]
Tel: +91 22 3043 3175
MARKET
SME
India's transformation in 'access’
Foreign Investor
Ports & Roads
Domestic Investor
Sumit [email protected]
Tel: +91 22 3043 3229
Nitin [email protected]
Tel: +91 22 3043 3241

Economy
October 04, 2016 Ambit Capital Pvt. Ltd. Page 2
CONTENTS
Section 1: The three ‘access’ related transformations ……………………9 underway in India
Section 1.1: Transformation#1: Access to end-markets ………………………..9
Section 1.2: Transformation#2: Access to capital ……………………………..17
Section 1.3: Transformation#3: Access to physical infrastructure ……………29
Section 2: Macroeconomic Implications …………………………………….34
Impact#1: Improved market access and access to …………………………….34 inputs of production is likely to yield gradual improvements in GDP growth in India
Impact#2: Cost of debt capital is set to fall over the next 5 years …………..36
Articulating our GDP forecast for FY18 ………………………………………….41
Section 3: Investment Implications …………………………………………..44
Investment theme 1: Plays on enhanced consumption ……………………….44
Investment theme 2: Plays on a more competitive financial system …………45
Investment theme 3: Plays on an improved transport network ………………46

Ambit Capital and / or its affiliates do and seek to do business including investment banking with companies covered in its research reports. As a result, investors should be aware that Ambit Capital may have a conflict of interest that could affect the objectivity of this report. Investors should not consider this report as the only factor in making their investment decision.
THEMATIC October 04, 2016
Economy
Exhibit A: GDP growth recovery to be U-shaped
Source: CEIC, Ambit Capital research
Exhibit B: Stocks in focus
Stock Ticker MCap (USD mn) Upside
Plays on enhanced consumption
Asian Paints APNT IN 17,198 3%
Havells HAVL IN 4,049 -4%
TTK Prestige TTKPT IN 938 6%
Trent TRENT IN 1,114 0%
Plays on a more competitive financial system
Axis Bank AXSB IN 19,761 9%
Cholamandalam CIFC IN 2,772 10%
City Union Bank CUBK IN 1,216 7%
Plays on an improved transport network
Ashok Leyland AL IN 3,554 23%
Sadbhav Infrastructure SINP IN 569 20%
Ashoka Buildcon ASBL IN 492 29%
Source: Bloomberg, Ambit Capital research
Research Analysts
Ritika Mankar Mukherjee, CFA +91 22 3043 3175 [email protected]
Sumit Shekhar +91 22 3043 3329 [email protected]
Nitin Bhasin +91 22 3043 3241 [email protected]
5.6%
6.6%
7.2%
6.8% 6.8%
7.3%
5%
6%
7%
8%
FY13
FY14
FY15
FY16
FY17
E
FY18
E
Rea
l GD
P g
row
th(Y
oY
cha
ng
e, in
%)
M+R+T resets = A revolution in ‘access’ The election of Modi (M), the appointment of Rajan (R) and the advent of Technology (T) set off a collapse in earnings growth in India from FY14 (refer to our note titled ‘M+R+T = Earnings recession in India’ for details). Whilst the M+R+T resets have been disruptive in the short run, in this note we describe how the policy decisions triggered by M+R+T have propelled a silent revolution in ‘access’ to end-markets, capital and physical infrastructure. We expect the resultant reduction in cost of debt capital and slow but sure productivity boost to trigger a consumption-driven U-shaped economic recovery in India in FY18 (Ambit GDP est. for FY18 is 7.3% vs 6.8% in FY16). Hence, we urge investors to BUY plays on enhanced consumption, plays on a more competitive financial system and plays on the improved transport network in India.
M+R+T = Earnings recession in India in the short term In our note dated December 16, 2015 we highlighted that earnings growth for India Inc is set to stay under pressure owing to three sets of structural changes, namely “…(1) PM Modi (M) who is calling time on the traditional model of crony capitalism driven capex growth; (2) Governor Rajan (R) who is increasing competition for traditional banks, deepening of corporate bond markets and reducing regulatory arbitrage between banks and NBFCs; and (3) Technology which is weakening the traditional offering of Indian IT services firms whilst increasing competition for retail lenders and B2C companies”.
M+R+T = A silent revolution in ‘access’ in the long term Whilst the M+R+T resets have been disruptive in the short run, in this note we describe how the range of policy decisions triggered by Modi, Rajan and Technology has set off a silent revolution in ‘access’. In specific, we highlight: Transformation#1: Access to ‘end-markets’: The advent of e-commerce
and the potential implementation of a single Goods and Services Tax (GST) hold the potential of transforming access to end-markets for producers of goods as well as services in India.
Transformation#2: Access to ‘capital’: Three sets of changes are set to improve cost and accessibility of finance, namely: (1) increased competition ‘amongst banks’ and ‘to banks’ (from NBFCs, corporate bonds and other financial technology driven offerings), (2) improved access to capital for SMEs (through schemes like MUDRA and credit extended by e-commerce majors), and (3) improvement in access to consumer finance (through schemes like PMJDY and lenders competing to provide retail credit).
Transformation#3: Access to ‘physical infrastructure’: The Modi-led NDA administration’s focus on improving physical connectivity (via roads, railways, air and waterways) holds the potential of dramatically improving mobility of labour as well as raw materials.
Macroeconomic and investment implications The combination of superior physical infrastructure and rollout of GST will boost access to end-markets as well as inputs. Cross-country experience suggests that such reforms boost productivity in a gradual manner. Furthermore, Modi’s black money crackdown is likely to result in a reduction in the cost of debt capital in India. We expect the cost of debt capital in India (proxied by the SBI lending rate) to fall by ~360bps by FY20. Based on these two macro impacts, we expect GDP to undergo a U-shaped improvement and expect GDP growth in FY18 to be recorded at 7.3% YoY (see exhibit in the right hand margin). Hence, we urge investors to BUY plays on enhanced consumption (Asian Paints, Havells, TTK prestige, Trent), plays on a more competitive financial system (Axis bank, Cholamandalam and City Union bank) and plays on the improved transport network in India (Ashok Leyland, Sadbhav Infrastructure and Ashoka Buildcon).
Economy
October 04, 2016 Ambit Capital Pvt. Ltd. Page 4
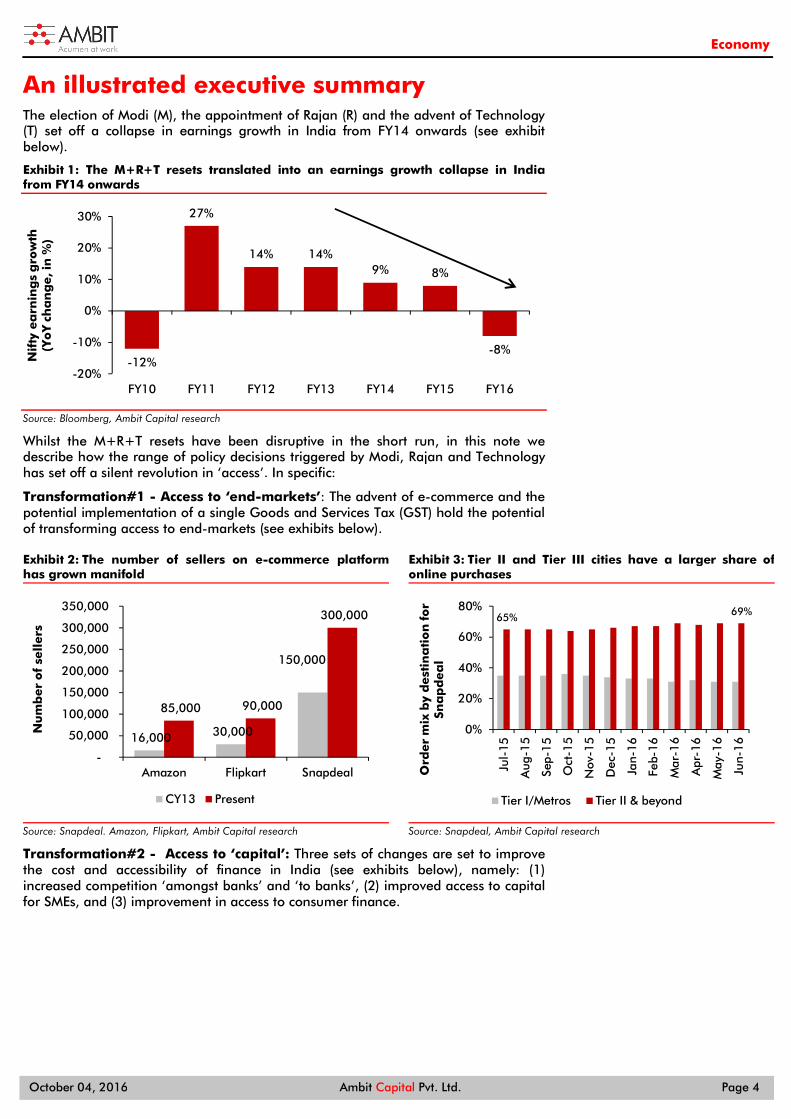
An illustrated executive summary The election of Modi (M), the appointment of Rajan (R) and the advent of Technology (T) set off a collapse in earnings growth in India from FY14 onwards (see exhibit below).
Exhibit 1: The M+R+T resets translated into an earnings growth collapse in India from FY14 onwards
Source: Bloomberg, Ambit Capital research
Whilst the M+R+T resets have been disruptive in the short run, in this note we describe how the range of policy decisions triggered by Modi, Rajan and Technology has set off a silent revolution in ‘access’. In specific:
Transformation#1 - Access to ‘end-markets’: The advent of e-commerce and the potential implementation of a single Goods and Services Tax (GST) hold the potential of transforming access to end-markets (see exhibits below).
Exhibit 2: The number of sellers on e-commerce platform has grown manifold
Source: Snapdeal. Amazon, Flipkart, Ambit Capital research
Exhibit 3: Tier II and Tier III cities have a larger share of online purchases
Source: Snapdeal, Ambit Capital research
Transformation#2 - Access to ‘capital’: Three sets of changes are set to improve the cost and accessibility of finance in India (see exhibits below), namely: (1) increased competition ‘amongst banks’ and ‘to banks’, (2) improved access to capital for SMEs, and (3) improvement in access to consumer finance.
-12%
27%
14% 14%9% 8%
-8%
-20%
-10%
0%
10%
20%
30%
FY10 FY11 FY12 FY13 FY14 FY15 FY16
Nif
ty e
arn
ing
s g
row
th(Y
oY c
ha
ng
e, i
n %
)
16,000 30,000
150,000
85,000 90,000
300,000
-
50,000
100,000
150,000
200,000
250,000
300,000
350,000
Amazon Flipkart Snapdeal
Nu
mb
er
of
sell
ers
CY13 Present
65% 69%
0%
20%
40%
60%
80%
Jul-
15
Aug
-15
Sep-
15
Oct
-15
Nov
-15
Dec
-15
Jan-
16
Feb-
16
Mar
-16
Apr
-16
May
-16
Jun-
16
Ord
er
mix
by
dest
ina
tio
n fo
r Sn
ap
dea
l
Tier I/Metros Tier II & beyond

Economy
October 04, 2016 Ambit Capital Pvt. Ltd. Page 5
Exhibit 4: The RBI has taken a range of measures to increase competition ‘amongst banks’ and ‘to banks’
Steps to increase competition ‘amongst banks’
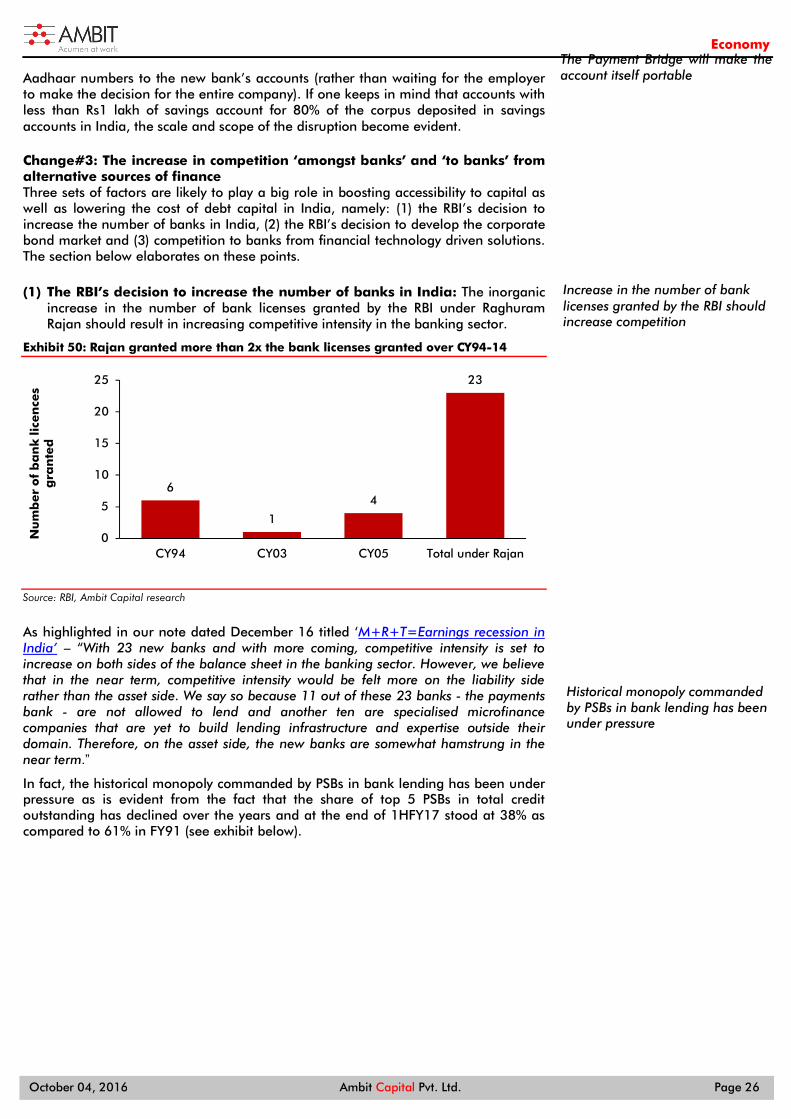
The inorganic increase in the number of bank licenses granted by the RBI under Raghuram Rajan should result in increasing competitive intensity in the banking sector The advent of financial technology is set to disrupt the financial industry as a whole. Specifically, it will induce more competition in the banking system. Fintech can potentially make low-value, high-volume transactions cheaper and, hence, will pose a threat to the banking system.
Steps to increase competition ‘to banks’
Raghuram Rajan approved a slew of measures in August 2016 to promote the growth of corporate bond markets. From FY19, accessing bank credit beyond certain thresholds will become costlier for large corporates. The RBI has also addressed various market impediments to promote participation and improve liquidity in secondary bond market. Source: mudra.org.in, Ambit Capital research
Transformation#3 - Access to ‘physical infrastructure’: The Modi-led NDA administration’s focus on improving physical connectivity holds the potential of dramatically improving mobility of labour as well as raw material (see exhibits below).
Exhibit 5: The NDA Government has boosted spending on infrastructure…
Source: Union budget documents, Ambit Capital research
Exhibit 6: … with a special focus on road building
Source: Ministry of Roads, Transport and Highways, Ambit Capital research
Exhibit 7: The Government has ambitious targets for infrastructure development
Head Target
Roads
Government think tank NITI Aayog has set ambitious targets of doubling the network of national highways and hiking the railway track length by almost eight times between now and CY20 as it aims to create world-class infrastructure to boost the economy. The total network of highways — including single and intermediate lanes and 4 & 6 lanes — is set to more than double to 96,000 km in 2020 from 45,406 km in FY16-end.
Railways The target for total track length, including commissioning of new lines, has been set at 130 lakh km for FY20 from 17.8 lakh km in FY17 and 16.5 lakh km achieved in FY16. At the same time, the government aims to reduce the empty freight wagon return ratio from an abysmal 39% during the current and last fiscal to 30% by CY20.
Airways The targets for passenger and cargo capacity have been set at 440 million passengers per year and 6 million tonnes a year, respectively. For the current fiscal, the passenger capacity target is set at 270 million, higher than the 250 million passenger capacity during last fiscal, while the cargo capacity has been maintained flat at four million tonnes for FY17.
Ports The target for FY20 has been fixed at 2,331 million tonnes per annum (mtpa) as against the current capacity of 1602 mtpa.
Source: NITI Aayog, Ambit Capital research
Macroeconomic implications
The combination of superior physical infrastructure and the rollout of GST will boost access to end-markets as well as inputs. Cross-country experience suggests that such reforms boost productivity in a gradual manner. Furthermore, Modi’s black money crackdown is likely to result in a reduction in the cost of debt capital in India. We expect the cost of debt capital in India (proxy is the SBI lending rate) to fall by ~360bps by FY20.
2.0%
3.1% 3.0%
3.6%
0%
1%
2%
3%
4%
FY14 FY15 FY16 FY17 (BE)
Go
vt. sp
en
din
g o
n
infr
ast
ruct
ure
(as
% o
f G
DP
)
7
24
810
25
0
5
10
15
20
25
30
FY12 FY13 FY14 FY15 FY16RE
FY17BE
Ro
ad
aw
ard
s(i
n '0
00
s o
f K
Ms)
Economy
October 04, 2016 Ambit Capital Pvt. Ltd. Page 6
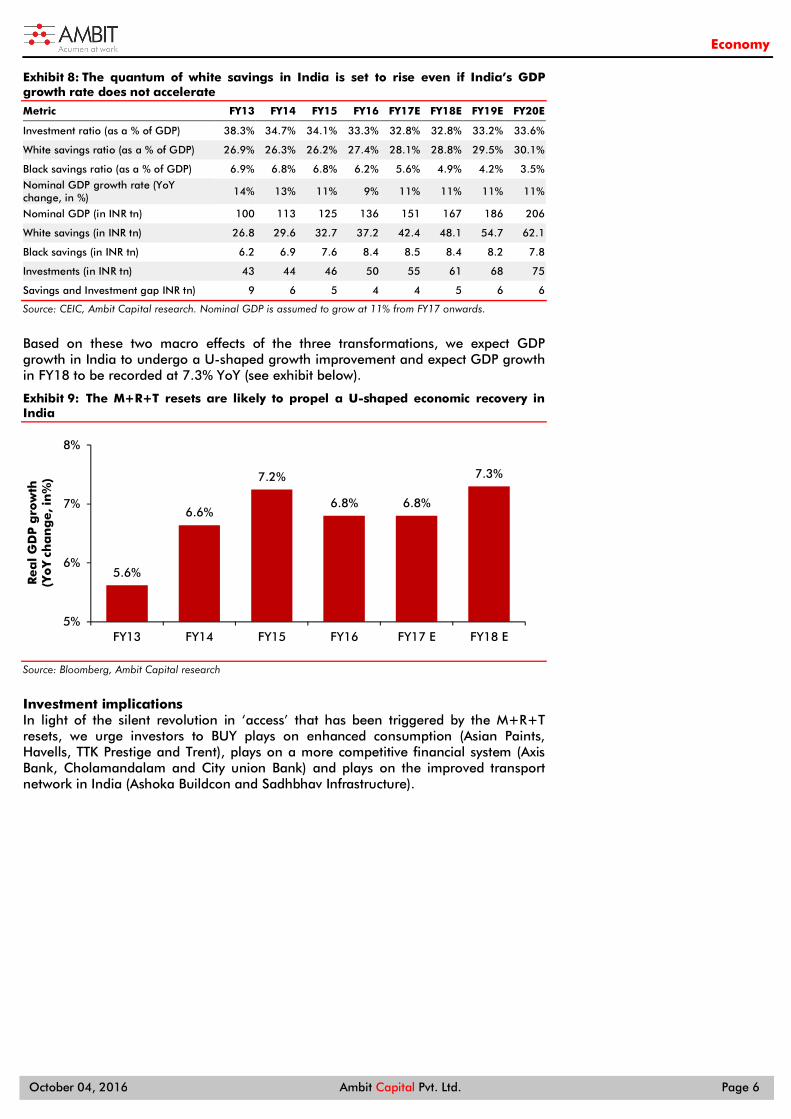
Exhibit 8: The quantum of white savings in India is set to rise even if India’s GDP growth rate does not accelerate
Metric FY13 FY14 FY15 FY16 FY17E FY18E FY19E FY20E
Investment ratio (as a % of GDP) 38.3% 34.7% 34.1% 33.3% 32.8% 32.8% 33.2% 33.6%
White savings ratio (as a % of GDP) 26.9% 26.3% 26.2% 27.4% 28.1% 28.8% 29.5% 30.1%
Black savings ratio (as a % of GDP) 6.9% 6.8% 6.8% 6.2% 5.6% 4.9% 4.2% 3.5%
Nominal GDP growth rate (YoY change, in %)
14% 13% 11% 9% 11% 11% 11% 11%
Nominal GDP (in INR tn) 100 113 125 136 151 167 186 206
White savings (in INR tn) 26.8 29.6 32.7 37.2 42.4 48.1 54.7 62.1
Black savings (in INR tn) 6.2 6.9 7.6 8.4 8.5 8.4 8.2 7.8
Investments (in INR tn) 43 44 46 50 55 61 68 75
Savings and Investment gap INR tn) 9 6 5 4 4 5 6 6
Source: CEIC, Ambit Capital research. Nominal GDP is assumed to grow at 11% from FY17 onwards.
Based on these two macro effects of the three transformations, we expect GDP growth in India to undergo a U-shaped growth improvement and expect GDP growth in FY18 to be recorded at 7.3% YoY (see exhibit below).
Exhibit 9: The M+R+T resets are likely to propel a U-shaped economic recovery in India
Source: Bloomberg, Ambit Capital research
Investment implications In light of the silent revolution in ‘access’ that has been triggered by the M+R+T resets, we urge investors to BUY plays on enhanced consumption (Asian Paints, Havells, TTK Prestige and Trent), plays on a more competitive financial system (Axis Bank, Cholamandalam and City union Bank) and plays on the improved transport network in India (Ashoka Buildcon and Sadhbhav Infrastructure).
5.6%
6.6%
7.2%
6.8% 6.8%
7.3%
5%
6%
7%
8%
FY13 FY14 FY15 FY16 FY17 E FY18 E
Rea
l G
DP
gro
wth
(Yo
Y c
ha
ng
e, i
n%
)

Economy
October 04, 2016 Ambit Capital Pvt. Ltd. Page 7
Prologue: M+R+T = Earnings recession in India in the short term “After a decade of ossification, the landscape is changing at a rapid rate for India Inc as: (1) An unconventional PM calls time on the traditional model of subsidy funded consumption growth and crony capitalism driven capex growth in India; (2) A gutsy RBI Governor brings about multiple policy changes to radically increase competition in the Financial Services sector; and (3) Technology lowers the barriers to entry into B2C sectors such as lending, consumer goods and auto.”
‘M+R+T=Earnings recession in India’, December 16, 2015
In our note dated December 16, 2016 we said that the resets engineered by PM Modi, the changes instituted by Governor Rajan, and the technology-induced resets will entail short-term pain in India. In specific, we pointed to three set of resets: some engineered by the PM, some by the then RBI Governor, and some due to the spread of new technology.
Reset #1: Modi hits the ‘reset’ button
In our note dated 23 March 2015, “Modi hits the ‘reset’ button”, we highlighted that Modi (who is essentially a man driven by personal goals and searing political ambition) has sensed the need to deliver three structural changes to perpetuate his political success.
“Our discussions with the policy ecosystem in Delhi as well as our understanding of the key policy measures announced by the NDA Government suggest that the Prime Minister is seeking to engineer three structural resets: (1) shift India’s savings landscape away from gold and land and towards the formal financial system, (2) disrupt the Indian model of crony capitalism, and (3) redefine India’s subsidy mechanism”.
In other words, Prime Minister Modi has been calling time on the traditional model of black money funded consumption growth and crony capitalism driven capex growth.
Reset #2: Rajan’s resets
Dr. Raghuram Rajan, who served as the Governor of the RBI from September 2013 to September 2016, played a pivotal role in transforming the Indian financial landscape. He increased competition for traditional private banks through the introduction of a record number of new banks, deepened the corporate bond market, worked to resurrect PSU banks, and reduced the regulatory arbitrage between banks and NBFCs.
Reset #3: The ‘technology’ induced resets
The rise of e-commerce over the past few years was termed as ‘disruptive’ in nature by media and practitioners alike.
The growing penetration of smartphone and internet combined with an increasing propensity of Indian consumers to transact online has led to firms like Flipkart and Snapdeal being considered a serious threat to existing brick and mortar players. While the success of these dot com firms cannot be labelled as ‘disruptive’ in nature, the radical improvements achieved by them using technology over the traditional model cannot be overlooked.
‘Modi’, ‘Rajan’ and ‘Technology’ resets to entail short-term pain
In conclusion, we thus made the point that the interplay of the above stated resets is likely to result in powerful pressure on corporate earnings in the short run (see exhibit below).
Three resets driven by Modi, Rajan and Technology led to an earnings recession
Prime Minister Modi has been calling time on the traditional model of black money funded consumption growth
Rajan increased competition for traditional private banks through the introduction of a record number of new banks
The rise of e-commerce over the past few years was termed as ‘disruptive’ in nature

Economy
October 04, 2016 Ambit Capital Pvt. Ltd. Page 8
Exhibit 10: Earnings growth for the Nifty has tapered over the last four years
Source: Bloomberg, Ambit Capital research
This is because incumbents who had enjoyed high earnings growth on the back of corruption and artificial suppression of competition under the UPA Government are now facing increasing pressure on their revenues and earnings.
‘Modi’, ‘Rajan’ and ‘Technology’ resets to revolutionise ‘access’ in the long term
Whilst the M+R+T resets have been disruptive in the short run, in this note we describe how the range of policy decisions triggered by Modi, Rajan and Technology are transforming access to ‘end-markets’, access to ‘capital’ as well as access to ‘physical infrastructure’ from a long-term perspective. The subsequent note is divided into three sections, namely:
Section 1 elaborates on three dimensions along which ‘access’ is being transformed in India.
Section 2 endeavors to eke out the macroeconomic implications of these unique changes while drawing from cross-country experience in this regard.
Section 3 focusses on highlighting the investment implications of these changes.
-12%
27%
14% 14%
9% 8%
-8%
-15%
-10%
-5%
0%
5%
10%
15%
20%
25%
30%
FY10 FY11 FY12 FY13 FY14 FY15 FY16
Nif
ty e
arn
ing
s g
row
th
Incumbents are facing increasing pressure on their revenues and earnings.

Economy
October 04, 2016 Ambit Capital Pvt. Ltd. Page 9
Section 1: The three ‘access’ related transformations underway in India India has historically been a supply-constrained economy mainly owing to the existence of barriers that prevent easy access to the three basic inputs of production, namely capital, labour and technology. As highlighted in the preceding section, the MRT resets have been disruptive in the short run as incumbents are forced to deal with an inorganic rise in competition and/or a breakdown in the old ways of doing business (which was centered on leveraging political connectivity). In this note, we highlight that despite the short-term pain triggered by the MRT resets, these resets have inadvertently triggered a silent revolution that is likely to transform access to ‘capital’, ’end-markets' and ‘physical infrastructure’.
Even as no solution appears to be on the horizon with respect to India’s problem of providing jobs to its large and youthful demographic structure (which is largely uneducated and unemployed: refer to our note titled ‘Sizing India’s demographic bomb’ for details), these three ‘access’ related transformations are likely to enhance the pace of output growth in India.
In the subsequent section, we elaborate on each of the three transformations that are currently underway in India, namely: Transformation #1: Access to end-markets,
Transformation #2: Access to capital, and
Transformation #3: Access to physical and virtual infrastructure.
Section 1.1: Transformation#1: Access to end-markets
“Our main finding is that market access is indeed an important determinant of Sub-Saharan Africa’s (SSA’s) economic development. This effect is still lower than that found for other parts of the world, but our results do show that the importance of market access has increased markedly in SSA over the last two decades….These findings are robust after controlling for many other variables affecting economic development (most notably human capital, institutions, natural resource dependence, and other more standard measures of a country’s geography). In our most conservative specification, we find that a 1% increase in a SSA country’s market access is associated with a 0.03% increase in its GDP per worker. “
- Garretsen, ‘Market Access: A Key Determinant of Economic Development in Sub-Saharan Africa’ (2012)
The advent of e-commerce in India and the potential implementation of a single Goods and Services Tax (GST) hold the potential of transforming access to end-markets for producers of goods as well as services in India.
One of the main reasons responsible for the small scale of operations of Indian firms has been the high cost of access and creation of pan-India distribution networks. The advent of e-commerce has helped producers find an inorganic solution to this problem as sellers have the option of simply tying up with one or more e-commerce majors and, thereby, creating access to the whole of India overnight. Concomitantly, manufacturers and retailers across India are increasingly moving towards selling products online as the number of Indians with access to the internet rises systematically.
Section 1.1.1: Improved access for small companies to end-markets through e-commerce According to the Economic Survey for 2016, “With 3.6 crore [36mn] units spread across the country, that employ 8.05 crore [80.5mn] people, Micro, Small and Medium Enterprises (MSME) have a contribution of 37.5% to the country’s GDP. The sector has huge potential for helping address structural problems like unemployment, regional imbalances, unequal distribution of national income and wealth across the country.” MSMEs account for 37% of India’s total manufacturing output and generate employment for nearly a tenth of India’s total population (see exhibit below).
India has historically been a supply-constrained economy owing to the existence of barriers that prevent easy access to the three basic inputs of production
The advent of e-commerce and GST hold the potential of transforming access to end-markets
Manufacturers and retailers across India are increasingly moving towards selling products online
MSMEs account for 37% of India’s total manufacturing

Economy
October 04, 2016 Ambit Capital Pvt. Ltd. Page 10
Exhibit 11: MSMEs contribute 37% of India’s manufacturing sector GDP…
Source: Ministry of MSME, Ambit Capital research
Exhibit 12: …and employ about one-tenth of the total population
Source: Ministry of MSME, Ambit Capital research
However, as is evident from the chart above, MSMEs’ share in manufacturing has been declining (even as the total share of manufacturing in India’s GDP remains stagnant) mainly because MSMEs in India must contend with the challenge of poor access to end-markets. The ministry of MSME, in its annual report for FY15, has noted that “MSMEs in India face constraints such as high cost of credit, low access to new technology and lack of access to national and international markets”.
MSMEs in India are defined as firms with investment in plant and machinery under US$2.5mn. MSMEs in India typically remain small as market access is limited to a particular locality or a small region owing to a range of constraints, including weak physical infrastructure and the high cost of creating a widespread distribution network.
This, in turn, prevents MSMEs from organically growing into larger firms that can exploit economies of scale. For instance, India’s manufacturing sector is characterised by significantly smaller firms as compared to China (see exhibit below).
Exhibit 13: About 88% of Indian factories have less than 100 workers each
Source: EPW, Ambit Capital research. Note data pertains to CY13
42% 42%41%
40%39%
37% 37%
33%
36%
39%
42%
45%FY
07
FY0
8
FY0
9
FY1
0
FY1
1
FY1
2
FY1
3
MSM
E m
an
ufa
ctu
rin
g(a
s %
of
tota
l m
an
ufa
ctu
rin
g
81 84 88 92 97 101 106 111 117
0
20
40
60
80
100
120
140
FY0
7
FY0
8
FY0
9
FY1
0
FY1
1
FY1
2
FY1
3
FY1
4
FY1
5
MSM
E em
plo
ymen
t(i
n m
illi
on
s)
25 26 2317
5 2 1 0
77
11 6 4 2 1 0 00
20
40
60
80
100
0-4
9
50-
99
100
-199
200
-499
500
-999
100
0-1
99
9
200
0-4
99
9
500
0-Sh
are
of
fact
ori
es
wit
h s
peci
fied
nu
mb
er
of
wo
rkers
(in
%)
Number of workers hired
China India
MSMEs in India must contend with the challenge of poor access to end-markets
India’s manufacturing sector is characterised by significantly smaller firms as compared to China
Economy
October 04, 2016 Ambit Capital Pvt. Ltd. Page 11
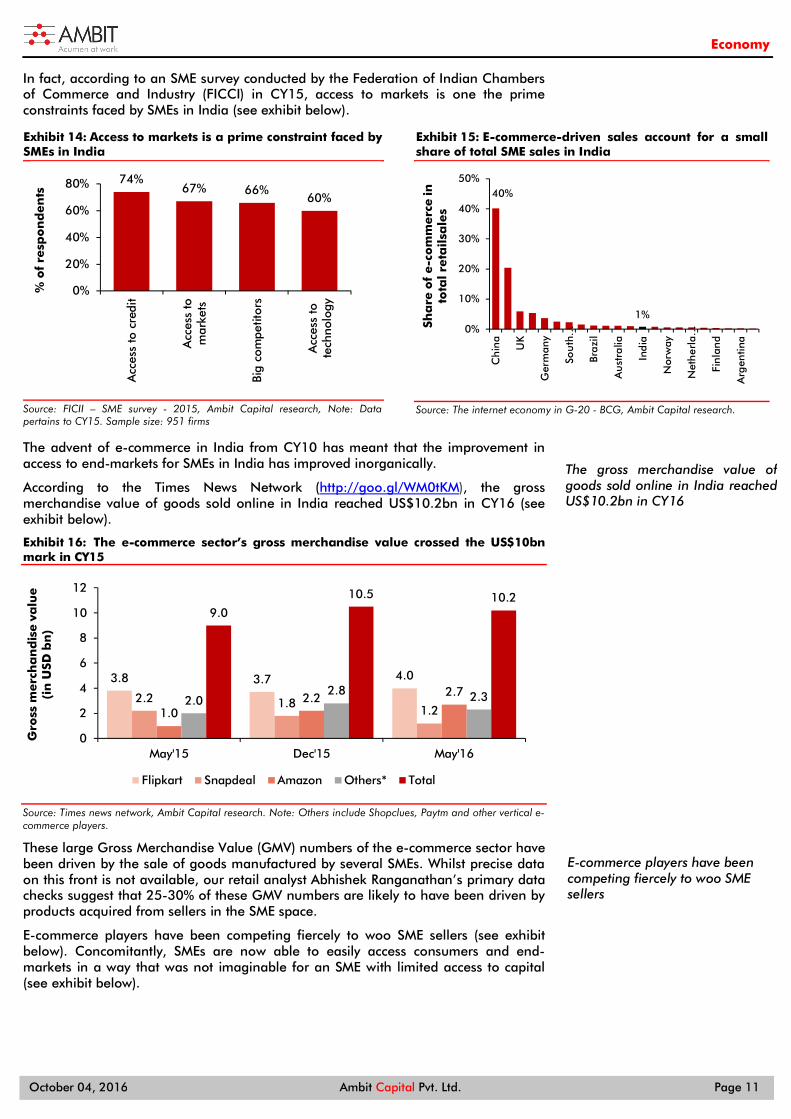
In fact, according to an SME survey conducted by the Federation of Indian Chambers of Commerce and Industry (FICCI) in CY15, access to markets is one the prime constraints faced by SMEs in India (see exhibit below).
Exhibit 14: Access to markets is a prime constraint faced by SMEs in India
Source: FICII – SME survey - 2015, Ambit Capital research, Note: Data pertains to CY15. Sample size: 951 firms
Exhibit 15: E-commerce-driven sales account for a small share of total SME sales in India
Source: The internet economy in G-20 - BCG, Ambit Capital research.
The advent of e-commerce in India from CY10 has meant that the improvement in access to end-markets for SMEs in India has improved inorganically.
According to the Times News Network (http://goo.gl/WM0tKM), the gross merchandise value of goods sold online in India reached US$10.2bn in CY16 (see exhibit below).
Exhibit 16: The e-commerce sector’s gross merchandise value crossed the US$10bn mark in CY15
Source: Times news network, Ambit Capital research. Note: Others include Shopclues, Paytm and other vertical e-commerce players.
These large Gross Merchandise Value (GMV) numbers of the e-commerce sector have been driven by the sale of goods manufactured by several SMEs. Whilst precise data on this front is not available, our retail analyst Abhishek Ranganathan’s primary data checks suggest that 25-30% of these GMV numbers are likely to have been driven by products acquired from sellers in the SME space.
E-commerce players have been competing fiercely to woo SME sellers (see exhibit below). Concomitantly, SMEs are now able to easily access consumers and end-markets in a way that was not imaginable for an SME with limited access to capital (see exhibit below).
74%67% 66%
60%
0%
20%
40%
60%
80%
Acc
ess
to c
redi
t
Acc
ess
tom
arke
ts
Big
com
petit
ors
Acc
ess
tote
chno
logy
% o
f re
spo
nd
en
ts 40%
1%0%
10%
20%
30%
40%
50%
Ch
ina
UK
Ger
man
y
Sou
th…
Bra
zil
Au
stra
lia
Ind
ia
Nor
way
Net
her
la…
Fin
lan
d
Arg
entin
a
Sha
re o
f e-c
om
merc
e in
to
tal re
tail
sale
s
3.8 3.7 4.0
2.2 1.81.21.0
2.2 2.72.0
2.8 2.3
9.0
10.5 10.2
0
2
4
6
8
10
12
May'15 Dec'15 May'16
Gro
ss m
erc
ha
nd
ise v
alu
e(i
n U
SD b
n)
Flipkart Snapdeal Amazon Others* Total
The gross merchandise value of goods sold online in India reached US$10.2bn in CY16
E-commerce players have been competing fiercely to woo SME sellers
Economy
October 04, 2016 Ambit Capital Pvt. Ltd. Page 12
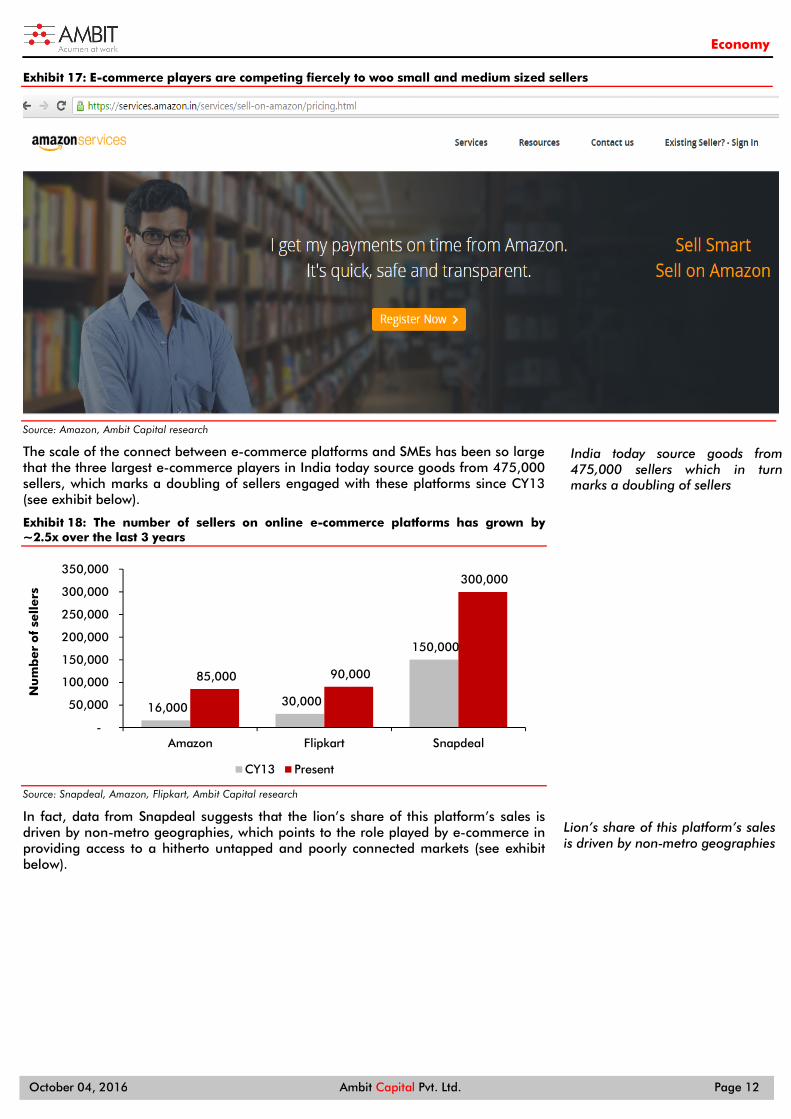
Exhibit 17: E-commerce players are competing fiercely to woo small and medium sized sellers
Source: Amazon, Ambit Capital research
The scale of the connect between e-commerce platforms and SMEs has been so large that the three largest e-commerce players in India today source goods from 475,000 sellers, which marks a doubling of sellers engaged with these platforms since CY13 (see exhibit below).
Exhibit 18: The number of sellers on online e-commerce platforms has grown by ~2.5x over the last 3 years
Source: Snapdeal, Amazon, Flipkart, Ambit Capital research
In fact, data from Snapdeal suggests that the lion’s share of this platform’s sales is driven by non-metro geographies, which points to the role played by e-commerce in providing access to a hitherto untapped and poorly connected markets (see exhibit below).
16,000 30,000
150,000
85,000 90,000
300,000
-
50,000
100,000
150,000
200,000
250,000
300,000
350,000
Amazon Flipkart Snapdeal
Nu
mb
er
of
sell
ers
CY13 Present
India today source goods from 475,000 sellers which in turn marks a doubling of sellers
Lion’s share of this platform’s sales is driven by non-metro geographies

Economy
October 04, 2016 Ambit Capital Pvt. Ltd. Page 13
Exhibit 19: More than 60% of Snapdeal’s sales are driven by non-metropolitan geographies
Source: Snapdeal, Ambit Capital research
However, the most striking feature of e-commerce players reaching out to small sellers/manufacturers is that they are providing this access to the market place at a fairly reasonable cost amounting to ~5% of the product price (see exhibit below).
Exhibit 20: E-commerce majors are offering a selling platform to sellers at a very minimal rate
Category Mobile
Product Price Rs5,000 (including shipping charge to buyers)
Referral Fee Rs175 (3.5% of Rs5000)
Closing Fee/Unit Sold Rs10
Easyship Fee Rs30
Sub-Total Rs215
Service Tax on Fee Rs32.25 (15% inclusive of Swachh Bharat and Krishi Kalyan Cess)
Total Fee Rs247.25
The seller makes Rs4,752.75
Source: Amazon India, Ambit Capital research
In fact, a survey conducted by industry body FICCI explicitly highlights that SMEs find internet platforms to be a cost-effective medium to grow sales (see exhibit below).
Exhibit 21: Most SMEs highlight that e-commerce is a cost-effective medium to grow sales
Source: FICCI SME survey – 2015, Ambit Capital research. Sample size: 951 firms
65% 65% 65% 64% 65% 66% 67% 67% 69% 68% 69% 69%
0%
20%
40%
60%
80%Ju
l-15
Aug
-15
Sep-
15
Oct
-15
Nov
-15
Dec
-15
Jan-
16
Feb-
16
Mar
-16
Apr
-16
May
-16
Jun-
16
Ord
er
mix
by
dest
ina
tio
n fo
r Sn
ap
dea
l
Tier I/Metros Tier II & beyond
44%
43%
37%
35%
32%
0% 10% 20% 30% 40% 50%
Employment
Increase in profits
Increase in sales
Geographic reach
Increase in customers
Reasons given by SMEs for purpose of internet usage
Access to the market place is provided at a fairly reasonable cost amounting to ~5%
SMEs find internet platforms to be cost effective

Economy
October 04, 2016 Ambit Capital Pvt. Ltd. Page 14
The advent of online platforms has indeed transformed the ‘access to end-markets’ of SME manufacturers and retailers. In fact, our primary data checks suggest that sales have increased manifold after these producers started selling their products online (see exhibit below).
Exhibit 22: Small traders/manufacturers have been able to grow sales dramatically by using online platforms
Business Testimony
Seller of multiple products, including toys and electronic items -Area of operations: Central and North India -Size of business: Medium
How has selling on online retail platforms helped your business? The scale of operations has increased manifold since we started doing business with one of the leading online marketplaces in India. We are now selling on a pan-India basis with effectively no marketing cost. How have sales improved after tying up with e-commerce majors? When we started in CY14 we were selling 50 products, but today we are selling 4000 products and 18 different categories.
Manufacturer of antique furniture -Area of operations: Jodhpur -Size of business: Medium
What is your business model? We are an antique furniture manufacturer based in Jodhpur. We have historically been an export oriented business with very little domestic sales till a few years ago. What has been your experience with respect to online selling? We built our own online platform four years ago and have also started selling on major Indian online portals. With minimal domestic sales a few years back, today I am getting 300-500 orders every day. Hence, domestic sales now account for nearly 15-20% of my total sales.
Jewellery Manufacturer -Area of operations: Jaipur -Size of business: Medium
How has tying up with the large e-commerce companies helped your business? There is no doubt that tying up with online retailers has increased hassles with respect to return orders and payments. However, the hassle is completely worth it as we have increased our sales manifold. Can you give us some quantification regarding the increase in sales? Online sales now accounts for 20-25% of our total sales. In the absence of online portals, we actually did very little business outside Jaipur. So the entire online sales piece is over and above what we used to do earlier and, hence, is a big add-on.
Manufacturer of snacks -Area of operations: Pan India -Size of business: Medium
How did you start your business? We felt that there is a market for healthy snacks at reasonable prices. This is the core idea that led us to start our business. What has been the role of online marketplace in your business? Our entire model has no brick and mortar selling component and we sell online only. The technology has allowed us to access a wider marketplace beyond our physical location. What has been your overall experience in selling online? We initially struggled to create space for ourselves as we were new and had to deal with limited customer awareness. Whilst we are still dealing with this issue, the reach we have for our size is disproportionately large. A lot of start-ups are using the online platform as their main selling platform because of this reach that it offers.
Source: Ambit Capital research.
It is also critical to note that manufacturers and retailers across India are increasingly moving towards online business models as they offer a cost-effective way to distribute goods (see exhibit below).
Exhibit 23: SMEs are also setting up websites to directly sell online
Name/Organisation Testimony
Karan Chugh, Proprietor, Florence Clothing
“We will close all our stand-alone stores as soon as the rental deals are over. The overhead operating costs are high and we will save Rs1.5 lakh per store per month if we close them as we save on rentals, utilities and other costs” (https://goo.gl/S5uFKW\).
Chirag Pavecha, MK Synthetics
“Our brick and mortar retail business is credit based and has low returns. Whereas online, we get the order first and then fulfil it, giving us a better view of our inventory and return on investment.” (https://goo.gl/S5uFKW).
Amit Sharda, MD, Soulflower India Pvt. Ltd
“The return on investment in standalone stores is not worth our time. We can double our sales if we put that same money and focus on e-commerce as compared to standalone stores” (https://goo.gl/S5uFKW).
Source: Media reports, Ambit Capital research
Whilst e-commerce players and websites being directly set up by manufacturers for online selling are boosting access to end-markets in India, the improvement in access to end-markets has been mainly driven by the rapid rise in the number of Indians with access to the internet (see exhibit below).
Sales have increased manifold after these producers started selling their products online
Manufacturers and retailers across India are increasingly moving towards online business models
The improvement in access to end-markets has been driven by the rapid rise in the number of Indians with access to the internet
Economy
October 04, 2016 Ambit Capital Pvt. Ltd. Page 15
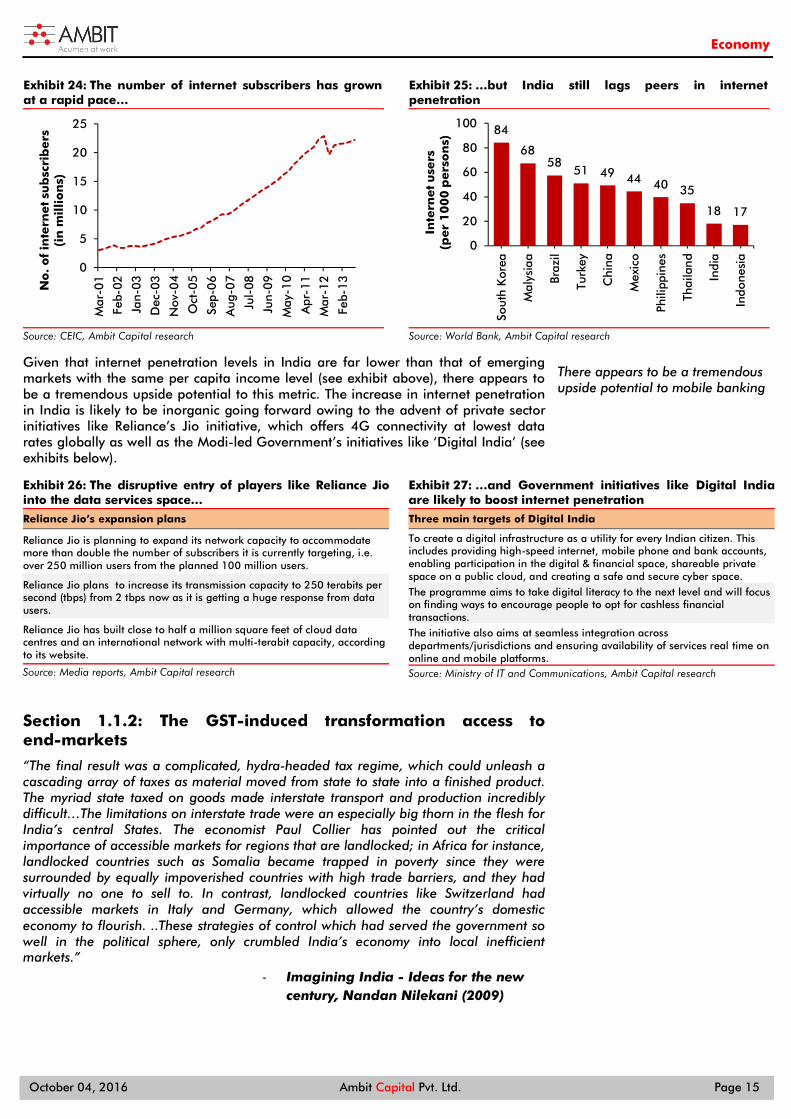
Exhibit 24: The number of internet subscribers has grown at a rapid pace…
Source: CEIC, Ambit Capital research
Exhibit 25: …but India still lags peers in internet penetration
Source: World Bank, Ambit Capital research
Given that internet penetration levels in India are far lower than that of emerging markets with the same per capita income level (see exhibit above), there appears to be a tremendous upside potential to this metric. The increase in internet penetration in India is likely to be inorganic going forward owing to the advent of private sector initiatives like Reliance’s Jio initiative, which offers 4G connectivity at lowest data rates globally as well as the Modi-led Government’s initiatives like ‘Digital India’ (see exhibits below).
Exhibit 26: The disruptive entry of players like Reliance Jiointo the data services space…
Reliance Jio’s expansion plans
Reliance Jio is planning to expand its network capacity to accommodate more than double the number of subscribers it is currently targeting, i.e. over 250 million users from the planned 100 million users.
Reliance Jio plans to increase its transmission capacity to 250 terabits per second (tbps) from 2 tbps now as it is getting a huge response from data users.
Reliance Jio has built close to half a million square feet of cloud data centres and an international network with multi-terabit capacity, according to its website.
Source: Media reports, Ambit Capital research
Exhibit 27: …and Government initiatives like Digital Indiaare likely to boost internet penetration
Three main targets of Digital India
To create a digital infrastructure as a utility for every Indian citizen. This includes providing high-speed internet, mobile phone and bank accounts, enabling participation in the digital & financial space, shareable private space on a public cloud, and creating a safe and secure cyber space. The programme aims to take digital literacy to the next level and will focus on finding ways to encourage people to opt for cashless financial transactions. The initiative also aims at seamless integration across departments/jurisdictions and ensuring availability of services real time on online and mobile platforms. Source: Ministry of IT and Communications, Ambit Capital research
Section 1.1.2: The GST-induced transformation access to end-markets
“The final result was a complicated, hydra-headed tax regime, which could unleash a cascading array of taxes as material moved from state to state into a finished product. The myriad state taxed on goods made interstate transport and production incredibly difficult…The limitations on interstate trade were an especially big thorn in the flesh for India’s central States. The economist Paul Collier has pointed out the critical importance of accessible markets for regions that are landlocked; in Africa for instance, landlocked countries such as Somalia became trapped in poverty since they were surrounded by equally impoverished countries with high trade barriers, and they had virtually no one to sell to. In contrast, landlocked countries like Switzerland had accessible markets in Italy and Germany, which allowed the country’s domestic economy to flourish. ..These strategies of control which had served the government so well in the political sphere, only crumbled India’s economy into local inefficient markets.”
- Imagining India - Ideas for the new century, Nandan Nilekani (2009)
0
5
10
15
20
25
Mar
-01
Feb-
02
Jan-
03
Dec
-03
Nov
-04
Oct
-05
Sep-
06
Aug
-07
Jul-
08
Jun-
09
May
-10
Apr
-11
Mar
-12
Feb-
13No
. o
f in
tern
et su
bsc
rib
ers
(in
mil
lio
ns)
84
6858
51 49 44 40 35
18 17
0
20
40
60
80
100
Sout
h K
orea
Mal
ysia
a
Braz
il
Turk
ey
Chi
na
Mex
ico
Phili
ppin
es
Thai
lan
d
Indi
a
Indo
nesi
a
Inte
rnet u
sers
(per
10
00
pers
on
s)
There appears to be a tremendous upside potential to mobile banking
Economy
October 04, 2016 Ambit Capital Pvt. Ltd. Page 16
The introduction of GST will ensure that indirect tax structures are common and uniform across the country. This will eliminate the ‘tax risk’ or make the entire country tax-neutral irrespective of the choice of the geographic location of the business’ operation. In the current framework, three sets of issues are particularly problematic.
A Central Sales Tax (CST) of 2% is levied on inter-state transactions, which creates inefficiencies in the supply chain as goods produced for local consumption attract lower tax rates than those produced for consumption in other states. This creates a cost for the free movement of goods across states as a producer is likely to be able to sell at a more competitive price in the state that he produces in.
Secondly, differential tax regimes across states add to the already elevated cost of movement of goods in India. For instance, according to a study conducted by National Council for Applied Economic Research (NCAER), trucks in India travel only ~200km in a day as opposed to ~800km in the US as 25% of the total travel time is taken by check points and other official stoppages. This raises direct costs in the form of wages to drivers as well as the cost of holding inventory.
Thirdly, according to the Chief Economic Advisor’s report on the revenue-neutral rate, inter-state trade costs exceed intra-state trade costs by a factor of 7x to 16x. This points to the clear existence of border barriers to inter-state movement of goods. Further, inter-state trade costs in India exceed inter-state costs in the US by a factor of 6, suggesting that India’s border effects are large by international comparison. Bringing India’s inter-state trade costs down to the US level could increase welfare by 15%; conversely, completely eliminating intra-state trade frictions could raise welfare by 5%.
The introduction of GST will ensure that indirect tax structures are common and uniform across the country
Central Sales Tax (CST) of 2% creates inefficiencies
Differential tax regimes across states add to the already elevated cost of movement of goods in India
There is a clear existence of border barriers to inter-state movement of goods
Economy
October 04, 2016 Ambit Capital Pvt. Ltd. Page 17
Section 1.2: Transformation#2: Access to capital
“Finance thrives when financial infrastructure is strong. The RBI has been working hard to improve the financial infrastructure of the country - it has made tremendous advances, for example, in strengthening the payment and settlement systems in the country. Similarly, it has been working on improving information sharing through agencies such as credit bureaus and rating agencies. I propose to carry on such work, which will be extremely important to enhance the safety and speed of flows as well as the quality and quantity of lending in the country. On the retail side, I particularly want to emphasise the use of the unique ID, Aadhaar, in building individual credit histories. This will be the foundation of a revolution in retail credit.”
-Dr. Raghuram Rajan’s first speech as the 23rd Governor of the RBI delivered on 4 September 2013
Three powerful sets of changes underway in India are dramatically transforming ‘access to finance’ in India namely, (1) Improvement in access to capital for SME’s (through schemes like MUDRA and credit being extended by e-commerce majors), (2) improvement in access to consumer finance (through schemes like PMJDY and lenders competing to provide retail credit) and (3) system-level improvements in the lending landscape in India owing to increased competition ‘amongst banks’ and ‘to banks’ (from NBFCs, corporate bonds and other financial technology driven sources). India’s lending landscape has been ‘closed’ and ‘oligopolistic’ thus far
“Normally manufactures in India face real capital costs (nominal lending charges minus inflation) exceeding 4-5% compared with 1-2% costs for their global competitors...It is reported that in a survey, that more than two-thirds of SMEs preferred not to utilise commercial bank credit because of the long and complicated processing times and large volume of collateral demanded by banks.”
- Revisiting manufacturing policy, Rajiv Kumar Senior Fellow at The Centre for Policy Research, 2014
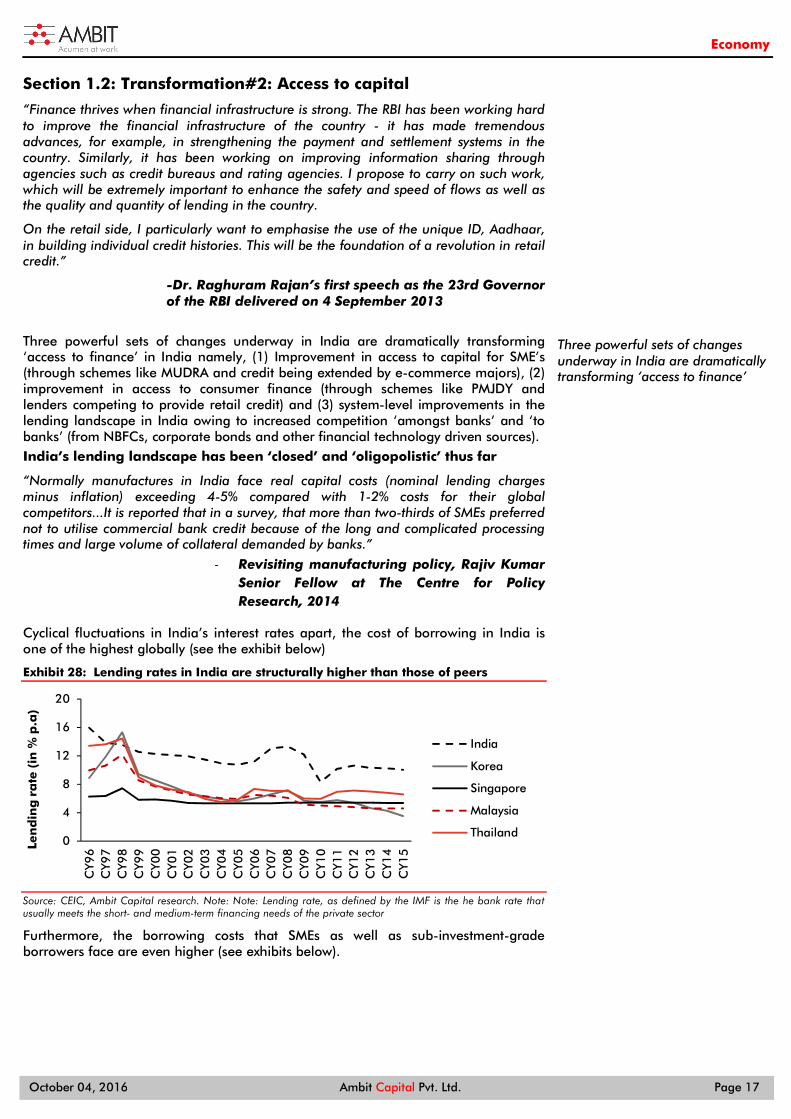
Cyclical fluctuations in India’s interest rates apart, the cost of borrowing in India is one of the highest globally (see the exhibit below)
Exhibit 28: Lending rates in India are structurally higher than those of peers
Source: CEIC, Ambit Capital research. Note: Note: Lending rate, as defined by the IMF is the he bank rate that usually meets the short- and medium-term financing needs of the private sector
Furthermore, the borrowing costs that SMEs as well as sub-investment-grade borrowers face are even higher (see exhibits below).
0
4
8
12
16
20
CY9
6C
Y97
CY9
8C
Y99
CY0
0C
Y01
CY0
2C
Y03
CY0
4C
Y05
CY0
6C
Y07
CY0
8C
Y09
CY1
0C
Y11
CY1
2C
Y13
CY1
4C
Y15Le
nd
ing
ra
te (
in %
p.a
)
India
Korea
Singapore
Malaysia
Thailand
Three powerful sets of changes underway in India are dramatically transforming ‘access to finance’
Economy
October 04, 2016 Ambit Capital Pvt. Ltd. Page 18
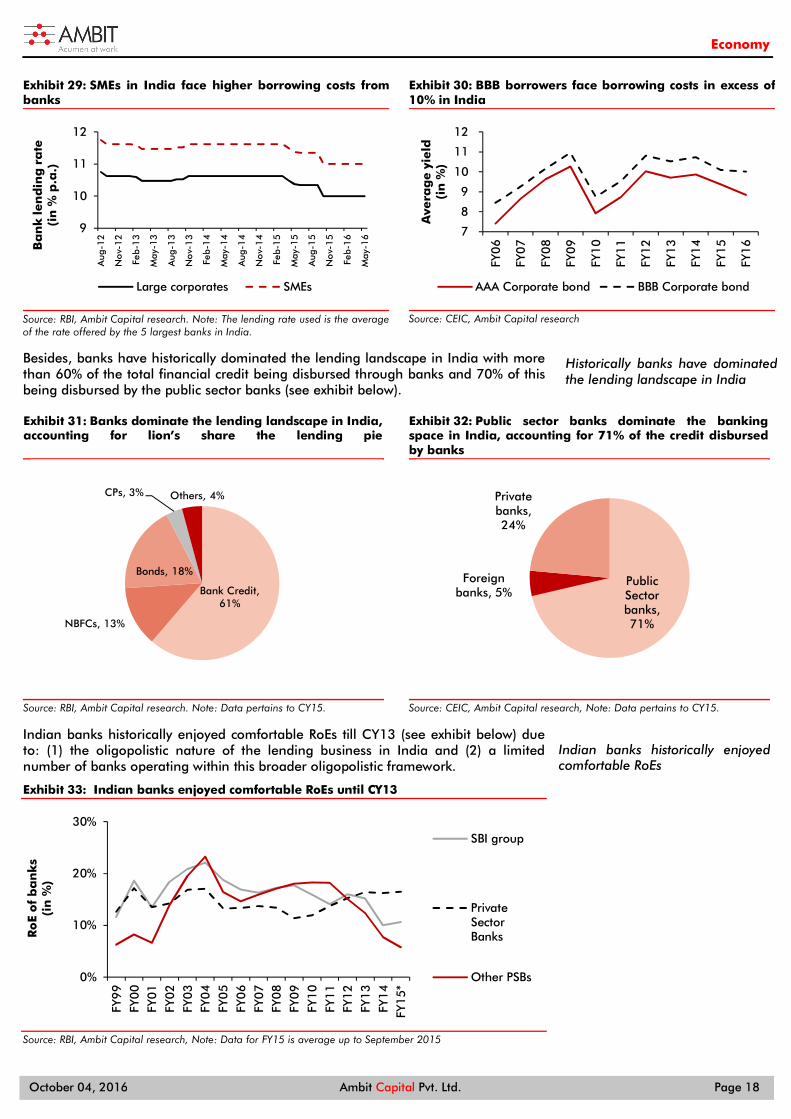
Exhibit 29: SMEs in India face higher borrowing costs from banks
Source: RBI, Ambit Capital research. Note: The lending rate used is the average of the rate offered by the 5 largest banks in India.
Exhibit 30: BBB borrowers face borrowing costs in excess of 10% in India
Source: CEIC, Ambit Capital research
Besides, banks have historically dominated the lending landscape in India with more than 60% of the total financial credit being disbursed through banks and 70% of this being disbursed by the public sector banks (see exhibit below).
Exhibit 31: Banks dominate the lending landscape in India, accounting for lion’s share the lending pie
Source: RBI, Ambit Capital research. Note: Data pertains to CY15.
Exhibit 32: Public sector banks dominate the banking space in India, accounting for 71% of the credit disbursed by banks
Source: CEIC, Ambit Capital research, Note: Data pertains to CY15.
Indian banks historically enjoyed comfortable RoEs till CY13 (see exhibit below) due to: (1) the oligopolistic nature of the lending business in India and (2) a limited number of banks operating within this broader oligopolistic framework.
Exhibit 33: Indian banks enjoyed comfortable RoEs until CY13
Source: RBI, Ambit Capital research, Note: Data for FY15 is average up to September 2015
9
10
11
12
Aug
-12
No
v-1
2
Feb-
13
May
-13
Aug
-13
No
v-1
3
Feb-
14
May
-14
Aug
-14
No
v-1
4
Feb-
15
May
-15
Aug
-15
No
v-1
5
Feb-
16
May
-16
Ba
nk
len
din
g r
ate
(i
n %
p.a
.)
Large corporates SMEs
7
8
9
10
11
12
FY0
6
FY0
7
FY0
8
FY0
9
FY1
0
FY1
1
FY1
2
FY1
3
FY1
4
FY1
5
FY1
6
Ave
rag
e y
ield
(in
%)
AAA Corporate bond BBB Corporate bond
Bank Credit, 61%
NBFCs, 13%
Bonds, 18%
CPs, 3% Others, 4%
Public Sector banks, 71%
Foreign banks, 5%
Private banks, 24%
0%
10%
20%
30%
FY9
9FY
00
FY0
1FY
02
FY0
3FY
04
FY0
5FY
06
FY0
7FY
08
FY0
9FY
10
FY1
1FY
12
FY1
3FY
14
FY1
5*
Ro
E o
f b
an
ks
(in
%)
SBI group
PrivateSectorBanks
Other PSBs
Historically banks have dominated the lending landscape in India
Indian banks historically enjoyed comfortable RoEs

Economy
October 04, 2016 Ambit Capital Pvt. Ltd. Page 19
Not only did Public Sector Banks (PSBs) dominate the lending landscape in India until CY13, but the model of lending dominated by PSBs often favoured large corporates with political patronage. The clear advantage that access to capital yielded in a capital-scarce economy was evident from the fact that politically connected companies used to outperform the overall markets until CY10 (see exhibit below).
Exhibit 34: Politically connected companies outperformed the broader market until CY10
Source: Bloomberg, Ambit Capital research
This structure in which a handful of banks dominated the lending landscape in India (typically lending to their cronies with less than ideal due diligence) was the root cause of the lending binge that transpired between FY04-08. During this period, GDP growth was recorded at an average pace of 9% YoY, gross capital formation (GFCF) grew at a multi-decadal high pace of 19% YoY (in real terms), and non-food credit grew at 28% YoY (see exhibit below).
Exhibit 35: The lending binge spanning FY04-08 was funded by indiscriminate bank lending
Source: Bloomberg, Ambit Capital research
This indiscriminate lending by banks to politically connected companies resulted in bad loans piling up to record levels in the Indian banking system, thereby compromising the traditional banking system’s ability to lend (see exhibits below).
-
500
1,000
1,500
2,000
2,500
3,000
Jan-
04
May
-04
Sep-
04
Jan-
05
May
-05
Sep-
05
Jan-
06
May
-06
Sep-
06
Jan-
07
May
-07
Sep-
07
Jan-
08
May
-08
Sep-
08
Jan-
09
May
-09
Sep-
09
Jan-
10
May
-10
Sep-
10
Ambit Connected Cos Index BSE 500
20% 20%
9%
27% 28%
16%17% 17%
7%
0%
5%
10%
15%
20%
25%
30%
Bank-Credit Non-food GFCF
Ave
rag
e Y
oY g
row
th
20 yr average FY04-08 FY09-13
The model of lending dominated by PSBs often favoured large corporates with political patronage.
Banks typically lent money to their cronies with less than ideal due diligence
This indiscriminate lending by banks to politically connected companies resulted in bad loans

Economy
October 04, 2016 Ambit Capital Pvt. Ltd. Page 20
Exhibit 36: Gross NPAs have increased in public sector banks…
Source: RBI, Ambit Capital research.
Exhibit 37: …as also in private sector banks
Source: RBI, Ambit Capital research.
Resets induced by Modi, Rajan and Technology are disrupting the old system of lending
Three powerful sets of changes underway in India are dramatically transforming ‘access to finance’ in India, namely: (1) Improvement in access to capital for SMEs (through schemes like MUDRA and credit being extended by e-commerce majors), (2) improvement in access to consumer finance (through schemes like PMJDY and lenders competing to provide retail credit), and (3) system-level improvements in the lending landscape in India owing to increased competition ‘amongst banks’ and ‘to banks’ (from NBFCs, corporate bonds and other financial technology driven sources).
Change#1: Improvement in access to capital for SMEs
“Small businesses are run by smart businessmen but their growth currently is being limited by a shortage of capital; this is why we are launching the Growth Capital programme”
- Ankit Nagotri, Chief Business Officer, Flipkart [July 17, 2015]
Access to capital for SMEs is set to improve dramatically going forward owing to three sets of forces springing to life, namely:
The end of an era whereby large companies foreclosed supply of credit for SMEs by virtue of their political connectivity,
E-commerce majors extending loans to SMEs, and
Government-driven schemes like Micro Units Development and Refinance Agency (MUDRA) boosting access to capital.
E-commerce majors are now extending credit to the tune of Rs500bn-600bn, or ~0.4% of GDP, annually to SME sellers (according to our retail team) and MUDRA-driven credit disbursements are projected to increase to Rs1.8tn, or ~1.2% of GDP, by FY17-end. This compares to the credit of Rs4.9tnn or 3.6% of GDP extended by banks to SME in FY16.
In the section below, we elaborate on each of these three strands that are improving access to capital for SMEs.
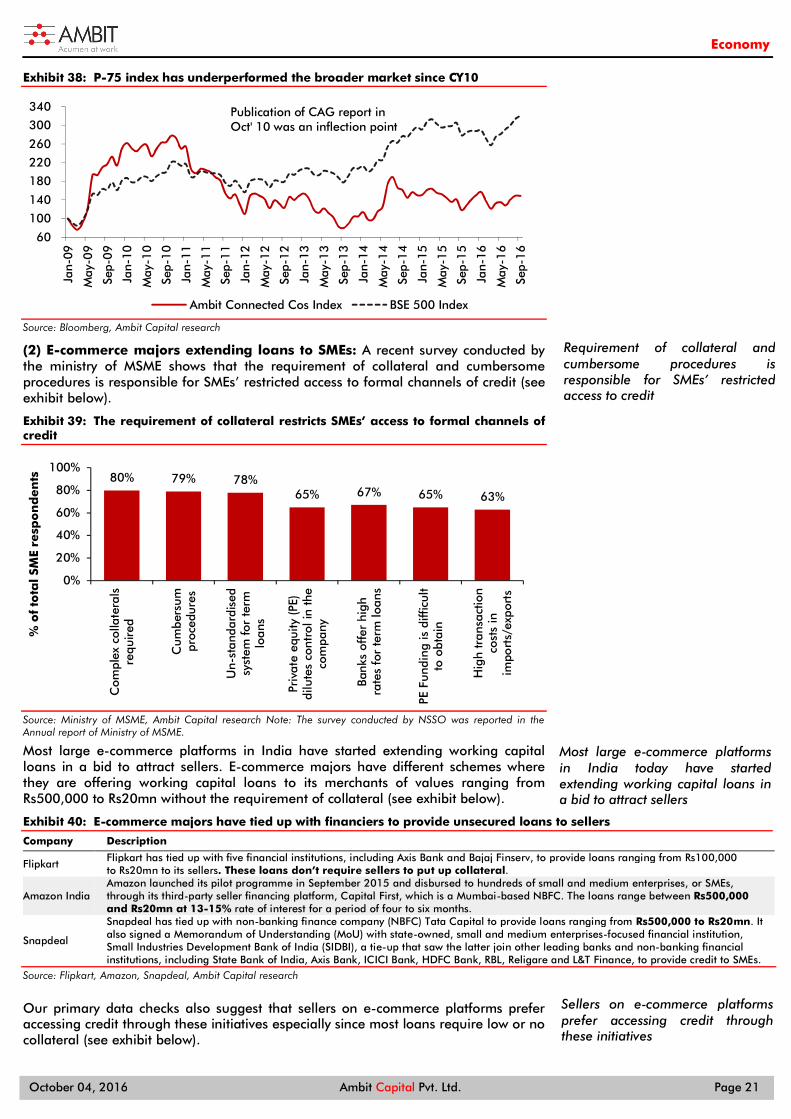
The end of the crony-capitalist centered lending era: Thus far, politically linked companies had privileged access to capital; hence, SMEs ended up paying unusually high cost for debt with the supply of credit being foreclosed by the politically-linked large companies. The resets engineered by PM Modi are now breaking the crony capitalists’ privileged access to capital. The fall of politically linked companies is evident from the fact that the index of politically connected companies has underperformed the overall markets since CY10 (see exhibit below).
0%
4%
8%
12%
16%
FY1
1
FY1
2
FY1
3
FY1
4
FY1
5
1H
FY16
PSUsRestructuredLoansPSUs GrossNPAs
0%
2%
4%
6%
FY1
1
FY1
2
FY1
3
FY1
4
FY1
5
1H
FY16
PrivateRestructuredLoans
Private GrossNPAs
Three powerful sets of changes underway in India are dramatically transforming ‘access to finance’
Access to capital for SMEs is set to improve dramatically
E-commerce majors are now extending credit to the tune of Rs500-600bn, or ~0.4% of GDP,annually to SME sellers
SMEs ended up paying unusually high costs for debt
Economy
October 04, 2016 Ambit Capital Pvt. Ltd. Page 21
Exhibit 38: P-75 index has underperformed the broader market since CY10
Source: Bloomberg, Ambit Capital research
(2) E-commerce majors extending loans to SMEs: A recent survey conducted by the ministry of MSME shows that the requirement of collateral and cumbersome procedures is responsible for SMEs’ restricted access to formal channels of credit (see exhibit below).
Exhibit 39: The requirement of collateral restricts SMEs’ access to formal channels of credit
Source: Ministry of MSME, Ambit Capital research Note: The survey conducted by NSSO was reported in the Annual report of Ministry of MSME.
Most large e-commerce platforms in India have started extending working capital loans in a bid to attract sellers. E-commerce majors have different schemes where they are offering working capital loans to its merchants of values ranging from Rs500,000 to Rs20mn without the requirement of collateral (see exhibit below).
Exhibit 40: E-commerce majors have tied up with financiers to provide unsecured loans to sellers
Company Description
Flipkart Flipkart has tied up with five financial institutions, including Axis Bank and Bajaj Finserv, to provide loans ranging from Rs100,000 to Rs20mn to its sellers. These loans don’t require sellers to put up collateral.
Amazon India Amazon launched its pilot programme in September 2015 and disbursed to hundreds of small and medium enterprises, or SMEs, through its third-party seller financing platform, Capital First, which is a Mumbai-based NBFC. The loans range between Rs500,000 and Rs20mn at 13-15% rate of interest for a period of four to six months.
Snapdeal
Snapdeal has tied up with non-banking finance company (NBFC) Tata Capital to provide loans ranging from Rs500,000 to Rs20mn. It also signed a Memorandum of Understanding (MoU) with state-owned, small and medium enterprises-focused financial institution, Small Industries Development Bank of India (SIDBI), a tie-up that saw the latter join other leading banks and non-banking financial institutions, including State Bank of India, Axis Bank, ICICI Bank, HDFC Bank, RBL, Religare and L&T Finance, to provide credit to SMEs.
Source: Flipkart, Amazon, Snapdeal, Ambit Capital research
Our primary data checks also suggest that sellers on e-commerce platforms prefer accessing credit through these initiatives especially since most loans require low or no collateral (see exhibit below).
60
100
140
180
220
260
300
340
Jan-
09
May
-09
Sep-
09
Jan-
10
May
-10
Sep-
10
Jan-
11
May
-11
Sep-
11
Jan-
12
May
-12
Sep-
12
Jan-
13
May
-13
Sep-
13
Jan-
14
May
-14
Sep-
14
Jan-
15
May
-15
Sep-
15
Jan-
16
May
-16
Sep-
16
Ambit Connected Cos Index BSE 500 Index
80% 79% 78%65% 67% 65% 63%
0%
20%
40%
60%
80%
100%
Com
plex
col
late
rals
requ
ired
Cum
bers
umpr
oced
ures
Un-
stan
dard
ised
syst
em fo
r te
rmlo
ans
Priv
ate
equi
ty (
PE)
dilu
tes
cont
rol i
n th
eco
mpa
ny
Bank
s of
fer
high
rate
s fo
r te
rm lo
ans
PE F
undi
ng is
diff
icul
tto
obt
ain
Hig
h tr
ansa
ctio
nco
sts
inim
port
s/ex
port
s
% o
f to
tal SM
E re
spo
nd
en
ts
Requirement of collateral and cumbersome procedures is responsible for SMEs’ restricted access to credit
Most large e-commerce platforms in India today have started extending working capital loans in a bid to attract sellers
Sellers on e-commerce platforms prefer accessing credit through these initiatives
Publication of CAG report in Oct' 10 was an inflection point

Economy
October 04, 2016 Ambit Capital Pvt. Ltd. Page 22
Exhibit 41: Sellers and manufacturers are availing credit facilities extended by e-commerce majors
Business Testimony
Seller of multiple products including toys and electronic items Area of operations: Central and North India Size of business: Medium
“All the major e-commerce majors have offered me credit without collateral and on simple terms. This is a huge relief as obtaining loans from the banks is difficult without a collateral. I have used this platform to get credit once in the past year and plan to use it in future as well.”
Seller of apparels Area of operation: Central India Size of business: Medium
“I have not used the credit facilities myself but had availed it for my manufacturer who is a supplier. The process was easy and they got a loan of Rs800,000 within few days of registering and applying for the same.”
Source: Ambit Capital research
Globally, advances made in analytics have helped e-commerce players develop full-fledged lending businesses that are a source of easily accessible and affordable credit to SME sellers (see exhibit below for a case study on China).
Exhibit 42: Case study of the rise of Alibaba in China
Head Description
E- commerce major Alibaba’s financial arm, Ant Financial
In China, Alibaba’s financial arm, Ant Financial, within a span of 4 years has scaled up a range of financial products varying from online payments to lending to credit scoring
Carved out in 2011, Ant Financial and its flagship product, Alipay, commands more than 82% share in China’s online payment market (although part of this could be because of the protection from competitive forces that Alibaba has received from the Chinese authorities)
This combined with other services such as wealth management, provides Ant Financial access to rich data (e.g. shopping history, utility bills, work & home addresses, property, family links
Financial access to rich data (e.g. shopping history, utility bills, work & home addresses, property, family links). Analytics on this data has enabled Ant’s lending business to cater to small businesses which were previously neglected by the banks due to sub-par credit scores
Source: iresearch global, Ambit Capital research
Among the online marketplaces in India, Flipkart, Snapdeal and Amazon, have begun offering working capital loans to their merchants using merchants’ selling patterns, ratings, customer feedback and social media profile for credit scoring. This sub-activity undertaken by e-commerce players in India has the potential of growing into a full-fledged business in India thereby alleviating the acute problem of access to capital to India’s small borrowers. In fact early signs of such businesses taking off can already be seen in India (see exhibit below).
Exhibit 43: Online e-commerce majors have started providing working capital loans to sellers
Title/Source Description
Paytm starts offering collateral-free loans for merchants on its platform (Livemint, July 11, 2016 http://goo.gl/cNvLKW).
Payments services and e-commerce firm Paytm on July 11 said it has started offering collateral-free working capital loans for merchants on its platform. These small loans would be in the range of Rs10,000 to Rs100,000 thousand, which can be increased later based on the eligibility criteria and the working capital needs of merchants, Paytm said.
Flipkart to arrange easy working capital loans to vendors to ensure loyalty (The Economic Times, Dec 09, 2015 http://goo.gl/Xc9RKa).
Flipkart has started providing easy working capital loans to its sellers. Merchant loyalty and engagement have become key factors in India's cut-throat e-commerce industry. Snapdeal and Amazon, too, have launched similar loan schemes for their merchants, seeking to lock in key sellers and encourage them to sell more. Flipkart, India's largest online marketplace by sales, said its loan scheme will give its vendors easier access to loans with basic documentation in 2-5 days.
Shopclues plans to disburse Rs50bn worth loan to sellers ( Livemint, August 23, 2016 http://goo.gl/CTw4DR)
Shopping portal ShopClues (Clues Network Pvt. Ltd) on August 23 said it plans to disburse Rs50bn worth of loans to merchants selling on its platform under its financing initiative Capital Wings. Of this, Rs2bn will be disbursed ahead of this year's Diwali festival.
Source: Media reports, Ambit Capital research
(3) Government driven schemes like MUDRA: PM Modi introduced the Micro Units Development and Refinance (MUDRA) scheme in CY15 under which small ticket loans of various sizes are offered to the small and medium entrepreneurs without any collateral. MUDRA is set to partner with Banks, Micro Finance Institutions (MFIs) and other lending institutions in a bid to boost access to capital for SMEs (see exhibit below).
Advances made in analytics have helped e-commerce players develop full-fledged lending businesses
Among the online marketplaces in India, Flipkart, Snapdeal and Amazon, have begun offering working capital loans
MUDRA is set to partner with Banks, Micro Finance Institutions (MFIs) and other lending institutions in a bid to boost access to capital for SMEs

Economy
October 04, 2016 Ambit Capital Pvt. Ltd. Page 23
Exhibit 44: MUDRA will partner banks/MFIs to provide financial assistance to the MSME sector
Source: mudra.org.in, Ambit Capital research
The MUDRA scheme incentivises SME lending by the banking and MFI sectors mainly because the financial institutions can get refinance from MUDRA and also a Government guarantee in which 50% of the bad loans will be covered by National Credit Guarantee Corporation (NCDC).
Our discussions with the Chief Financial Officer (CFO) of MUDRA suggest that the Government has actually put the MUDRA scheme on priority and the progress is monitored regularly through the Prime Minister’s Office (PMO).
A similar scheme was run in Indonesia (see exhibit below for details) and its success points to the upside potential of such a scheme.
Exhibit 45: Indonesia’s KUR is similar to MUDRA
Scheme Details
Microfinance Program: Kredit Usaha Rakyat (KUR)
The Indonesian government intends to disburse IDR 30 trillion (USD 2.2 billion) in small business loans under its Kredit Usaha Rakyat (KUR) program, which is intended to provide credit to micro-, small and medium-sized enterprises (MSMEs) and cooperatives. The aims of KUR include boosting economic growth in 2015 and decreasing microcredit interest rates.
The Government would subsidise state banks so they could cut their microcredit interest rate from 21 to 12% starting in 2015
The government reduced the cap on the annual interest rate of loans under KUR from 22% to 21% and set the maximum amount of each collateral-free loan at IDR 15 million (USD 1,150) as of March 2015.
Source: Media reports, Ambit Capital research
50% of the NAPs will be covered by National Credit Guarantee Corporation (NCDC).

Economy
October 04, 2016 Ambit Capital Pvt. Ltd. Page 24
Change#2: The improvement in access to consumer finance
Given the fact that there is no sign of an investment recovery materialising in India, within bank credit growth the main component that has been growing at a rapid pace is retail credit (see exhibit below).
Exhibit 46: Retail credit has been growing at a faster pace than overall credit
Source: RBI, Ambit Capital research
The combination of the Pradhan Mantri Jan-Dhan Yojna (PMJDY), the JAM trinity (i.e. Jan Dhan-Aadhaar-Mobile) and Unified Payments Interface (UPI) possesses the potential of vastly democratising access to capital in a country where 40% of consumer finance is raised from informal sources. PM Modi launched the Pradhan Mantri Jan-Dhan Yojna (PMJDY) scheme in August 2015 and, as a result of this scheme, every Indian household today has a bank account (see exhibit below). As per the latest data, 1.03bn Indians possess Aadhaar cards and this unique number is being linked to their bank accounts to transfer various Government subsidies directly into the account of the beneficiaries (see exhibit below).
Exhibit 47: Aadhaar and bank accounts have been used to transfer various Government subsidies
Item
Number of Aadhaar cards seeded (in millions
Status as on May 31, 2014
Status as on Mar 31, 2016
LPG connections 28.2 122.8
Food & Public Distribution (No. of ration cards) 12 113.9
MNREGA Job cards NA 59
National Social assistance program (Pension Scheme) NA 9.5
Voter ID cards NA 310
PMJDY NA 93.2
Passport NA 2.4
CBDT(Income TAX) Returns NA 4.5
Jeevan Pramaan (Pension certificate) NA 1.4
Source: Ministry of Communication and Information technology, Ambit Capital research. Note: The Government has started seeding Aadhaar cards to various beneficiaries’ identities to remove duplication.
The JAM trinity (i.e. Jan Dhan-Aadhaar-Mobile) has helped boost mobile banking in India in a big way (see exhibits below). In FY16, Rs625bn (or 0.5% of GDP) of credit was disbursed via mobile banking (see exhibit below).
0%
5%
10%
15%
20%
25%
Jul-
15
Jul-
15
Aug
-15
Sep-
15
Sep-
15
Oct
-15
Nov
-15
Nov
-15
Dec
-15
Jan-
16
Jan-
16
Feb-
16
Mar
-16
Mar
-16
Apr
-16
May
-16
Jun-
16
Jun-
16
Jul-
16
Yo
Y g
row
th(i
n %
)
Retail credit Overall credit
The main component that has been growing at a rapid pace is retail credit
As per the latest data, 1.03bn Indians possess an Aadhaar card
JAM trinity (i.e. Jan Dhan-Aadhaar-Mobile) has helped boost mobile banking in India in a big way

Economy
October 04, 2016 Ambit Capital Pvt. Ltd. Page 25
Exhibit 48: Mobile banking has grown at a rapid pace in the recent past
Source: RBI, Ambit Capital research
The launch of the Unified Payments Interface (UPI) by the National Payments Corporation of India (NPCI) is likely to act as a catalyst to dramatically increase mobile banking because: (1) the UPI plays the critical role of being the central registry which can convert detailed account information into a one word address, (2) UPI acts as a payment “bridge” between all Indian individuals as well as firms, and (3) UPI allows people to request for payments.
With the UPI, one might simply need to enter details and get a billing request on the phone. This request can then be accepted or rejected right away. For example, a local grocery shop from which you purchase grocery items frequently could take your UPI details and then at the end of each month can send you a bank request for the money owed. You simply have to accept or reject the request. This is revolutionary in the sense that it eliminates use of personal details such as bank account number or credit card details (see exhibit below).
Exhibit 49: The UPI payments interface is likely to dramatically boost the prospects of mobile banking in India
Head Description
What is UPI and what can a user do with the app?
UPI is a payment system that allows money transfer between any two bank accounts by using a smartphone. UPI allows a customer to pay directly from a bank account to different merchants, both online and offline, without the hassle of typing credit card details, IFSC code, or net banking/wallet passwords.
How can one download the UPI app?
The UPI app of 19 banks -- Andhra Bank, Axis Bank, Bank of Maharashtra, Bhartiya Mahila Bank, Canara Bank, Catholic Syrian Bank, DCB Bank, Federal Bank, ICICI Bank, TJSB Sahakari Bank, Oriental Bank of Commerce, Karnataka Bank, UCO Bank, Union Bank of India, United Bank of India, Punjab National Bank, South Indian Bank, Vijaya Bank and YES Bank -- will be available on the Google Play Store of Android phones in the next few days for customers to download.
What is revolutionary about the concept?
People can send money using virtual ID - they do not have to give other details. They just have to enter the virtual ID on the payments page of the vendor and they will receive an alert on the mobile asking them to authorise the transaction. Secondly, a vendor can use UPI to “pull” the payment from the customer’s account.
Source: Media reports, Ambit Capital research
As Nandan Nilekani put it on the date of the launch of UPI on April 11, 2016, “Payments have evolved in different ways. You had a card system, mobile money, Internet e-wallets. But completely mobile interoperable person-to-person instant real time with push and pull really didn’t exist anywhere. So I think that is where UPI is a leapfrog”.
In fact, the combination of UPI and JAM can spur liability-side innovation in a big way. Using the UPI-NPCI bridge, the payment banks and the small finance banks licensed by the RBI in 2015 can extend their reach into the wallets of the 300 million Indians who receive subsidy payments from the Government. Using mobile phones, rather than branches, these new types of banks can hoover up the savings of not just the currently financially excluded constituency but also of salaried middle class workers who at present receive sub-par interest rates from their banks. Such savings account portability will become easy if employers pay salaries to employees’ Aadhaar numbers from where UPI-NPCI directs the payment to the account chosen by the employee. In effect, the UPI will make the money in savings accounts fungible between accounts. The Payment Bridge will make the account itself portable. Thus, if a new upstart bank offers better savings rates, employees can individually map their
0
100
200
300
400
500
600
700A
pr-0
4O
ct-0
4A
pr-0
5O
ct-0
5A
pr-0
6O
ct-0
6A
pr-0
7O
ct-0
7A
pr-0
8O
ct-0
8A
pr-0
9O
ct-0
9A
pr-1
0O
ct-1
0A
pr-1
1O
ct-1
1A
pr-1
2O
ct-1
2A
pr-1
3O
ct-1
3A
pr-1
4O
ct-1
4A
pr-1
5O
ct-1
5Mo
bil
e b
an
kin
g tra
nsa
ctio
ns
(in
IN
R b
illi
on
)
The launch of the UPI by the NPCIis likely to act as a catalyst to dramatically increase mobile banking
Combination of UPI and JAM can spur liability-side innovation in a big way
Economy
October 04, 2016 Ambit Capital Pvt. Ltd. Page 26
Aadhaar numbers to the new bank’s accounts (rather than waiting for the employer to make the decision for the entire company). If one keeps in mind that accounts with less than Rs1 lakh of savings account for 80% of the corpus deposited in savings accounts in India, the scale and scope of the disruption become evident.
Change#3: The increase in competition ‘amongst banks’ and ‘to banks’ from alternative sources of finance Three sets of factors are likely to play a big role in boosting accessibility to capital as well as lowering the cost of debt capital in India, namely: (1) the RBI’s decision to increase the number of banks in India, (2) the RBI’s decision to develop the corporate bond market and (3) competition to banks from financial technology driven solutions. The section below elaborates on these points.
(1) The RBI’s decision to increase the number of banks in India: The inorganic
increase in the number of bank licenses granted by the RBI under Raghuram Rajan should result in increasing competitive intensity in the banking sector.
Exhibit 50: Rajan granted more than 2x the bank licenses granted over CY94-14
Source: RBI, Ambit Capital research
As highlighted in our note dated December 16 titled ‘M+R+T=Earnings recession in India’ – “With 23 new banks and with more coming, competitive intensity is set to increase on both sides of the balance sheet in the banking sector. However, we believe that in the near term, competitive intensity would be felt more on the liability side rather than the asset side. We say so because 11 out of these 23 banks - the payments bank - are not allowed to lend and another ten are specialised microfinance companies that are yet to build lending infrastructure and expertise outside their domain. Therefore, on the asset side, the new banks are somewhat hamstrung in the near term.”
In fact, the historical monopoly commanded by PSBs in bank lending has been under pressure as is evident from the fact that the share of top 5 PSBs in total credit outstanding has declined over the years and at the end of 1HFY17 stood at 38% as compared to 61% in FY91 (see exhibit below).
6
1
4
23
0
5
10
15
20
25
CY94 CY03 CY05 Total under Rajan
Nu
mb
er
of
ba
nk
lice
nce
s g
ran
ted
The Payment Bridge will make the account itself portable
Increase in the number of bank licenses granted by the RBI should increase competition
Historical monopoly commanded by PSBs in bank lending has been under pressure

Economy
October 04, 2016 Ambit Capital Pvt. Ltd. Page 27
Exhibit 51: The share of top 5 PSBs in total credit outstanding has declined over the years
Source: RBI, Ambit Capital research
(2) The RBI’s decision to develop the corporate bond market: In India, bank credit dominates the lending landscape by accounting for 77% of market share, whilst the corporate bond market accounts for only for 23% of the market (see exhibits below).
Exhibit 52: Share of the bond market is far higher than banks’ total credit in developed countries
Source: IMF, BIS, SEBI, Ambit Capital research.
Exhibit 53: Size of the corporate bond market is very small in India
Source: IMF, BIS, World Bank, Ambit Capital research
To facilitate the development of the bond markets, the RBI recently announced measures to liberalise bond markets (see exhibit below).
0%
10%
20%
30%
40%
50%
60%
70%FY
91
FY9
2FY
93
FY9
4FY
95
FY9
6FY
97
FY9
8FY
99
FY0
0FY
01
FY0
2FY
03
FY0
4FY
05
FY0
6FY
07
FY0
8FY
09
FY1
0FY
11
FY1
2FY
13
FY1
4FY
15
FY1
61
HFY
17
Sha
re in
to
tal cr
ed
it
ou
tsta
nd
ing
(to
5 5
PSB
s)
76% 74% 70%
40%23%
24% 26% 30%
60%77%
0%
40%
80%
120%
JP US UK KR IN
Sha
re o
f b
on
d m
ark
et
in
corp
ora
te c
red
it
Bankcredit
Corporatebond
353%331%
143%
92%
13%0%
100%
200%
300%
400%
Japan UK US Korea India
Co
rpo
rate
bo
nd
ma
rket
(as
% o
f G
DP
)
In India, bank credit dominates the lending landscape

Economy
October 04, 2016 Ambit Capital Pvt. Ltd. Page 28
Exhibit 54: Measures announced by the RBI will help deepen corporate bond markets in India
Measure Steps takes
To push large corporates to bond markets [Announced on August 25, 2016]
New norms apply on any corporate (called "Specified Borrower") Aggregate Sanctioned Credit Limit (ASCL) more than Rs250bn, any time during FY18. This limit further goes down to Rs150bn in FY19 and Rs100bn in FY20.
After crossing ASCL in any given year, 50% of the incremental borrowing in next FY, above ASCL, by the 'Specified Borrower" will be considered to carry "high risk".
Accordingly, banks will have to make 300bps additional provision and use 75% additional risk weights on such on such "high risk" exposures.
To enhance liquidity in bond markets [Announced on August 25, 2016]
The RBI has commenced process to amend the RBI Act, in order to allow corporate bonds as eligible collateral for Liquidity Adjustment Facility (LAF), with appropriate haircuts.
Total PCE (partial credit enhancement) that banks may provide for a bond issue will be increased from 20%, currently, to 50% (along with A single bank limit of 20%).
Banks may raise 1) AT1, 2) Tier-2 capital bonds and 3) long term bonds for infrastructure and affordable housing by way of rupee denominated bonds overseas (masala bonds).
FPIs (Foreign Portfolio Investors) will be allowed to trade on screen based NDS-OM (used for secondary market trading in Government securities) through primary members.
FPIs will be allowed to transact in corporate bonds directly without involving brokers. Retail investors have been allowed to trade directly on NDS-OM recently. RBI will further remove remaining restrictions
on seamless transfer of Government securities between depositories and RBI. Brokers (market makers) can now participate in the corporate bond repo market. So far, only regulated entities (e.g.
banks, primary dealers, mutual funds and insurance companies) were allowed. Listed companies can lend through repos in G-sec, without any tenor or counterparty restrictions. By end-September 2016, a market making scheme by Primary Dealers will be launched to augment liquidity in the G-
sec market. By end-October 2016, the RBI will issue guidelines for introduction of electronic dealing platforms for repo in
corporate bonds. Source: RBI, Ambit Capital research
Owing to the above measures, from FY19 accessing bank credit beyond certain thresholds will become costlier for large corporates. The RBI has also addressed various market impediments to promote participation and improve liquidity in secondary bond markets. As highlighted in our note dated August 30, 2016 (click here for the note), our banking team believes that the measures highlighted by the RBI along with introduction of bankruptcy code should lead to the creation of a vibrant bond market in India.
The share of corporate bonds in total corporate borrowings has been increasing (from 30% at end-1QFY13 to 38% at end-1QFY16: see exhibit below) and should continue to rise, resulting in an overall compression in the cost of debt capital.
Exhibit 55: The share of bonds in corporate borrowing has been increasing
Source: RBI, Ambit Capital research.
(3) Competition to banks from financial technology driven solutions
Financial technology is set to disrupt the financial industry as a whole. Specifically, it will induce more competition in the banking system. New technology is likely to make low-value, high-volume transactions cheaper and, hence, will pose a threat to the banking system.
70% 68% 68% 64% 62%
30% 32% 32% 36% 38%
0%
10%20%
30%
40%
50%60%
70%
80%
90%100%
Jun'12 Jun'13 Jun'14 Jun'15 Jun'16
Sha
re in
to
tal cr
ed
it t
o
corp
ora
tes Debt market -
corporate
Bank loans -corporate
Accessing bank credit beyond certain thresholds will become costlier for large corporates
The share of corporate bonds in total corporate borrowings has been increasing
The financial technology is set to disrupt the financial industry

Economy
October 04, 2016 Ambit Capital Pvt. Ltd. Page 29
Exhibit 56: Financial Technology is set to disrupt the banking sector
Head Description
Fintech start-ups disrupt mammoth banks, The Hindu December 2015 (https://goo.gl/cHEqnw).
Banks are right to be afraid of the fintech (short for financial technology) boom. A slew of start-ups in the fintech space are disrupting the financial services and banking industry. These firms are developing innovations that include peer-to-peer lending platforms that match borrowers and savers. They are helping banks to detect fraud and money laundering using artificial intelligence and machine learning.
How FinTech is disrupting the financial services ecosystem in India, Firstpost, January 2016 (https://goo.gl/MUX1xA
Technology is now being utilized to acquire online users. Most financial products are now available online too, to feed the growing mobile population. Disruptive technologies in financial services or FinTech have changed almost every financial activity from banking to payments to raising loans etc. The targets of most BSFI start-ups today, unlike traditional companies are the number of transactions rather than increasing the transaction size. What FinTech start-ups might not make in size of transactions, they are more than making up in the number of transactions
Disruption will change banking significantly, Business Standard, August 2016 (https://goo.gl/wxTEfZ)
With the emergence of technologies such as automated teller machines, Internet and mobile transactions, banking in India catapulted to a different orbit in the last decade. But the future will bring even more change. Banking as we know it will stand on its head in the next 10 years
Source: Media reports, Ambit Capital research
Section 1.3: Transformation#3: Access to physical infrastructure
“Poor infrastructure impedes a nation’s economic growth and international competitiveness. Insufficient infrastructure also represents a major cause of loss of quality of life, illness and death. This raises infrastructure services from good investment to a moral and economic imperative. In order to stimulate growth and reduce poverty, it is essential to improve the supply, quality and affordability of infrastructure services. The unmet demands are huge, and investments have not matched demand.”
-The World Bank, CY08
Even as India has been naturally endowed with an abundance of factors of production, i.e. physical raw material as well as labour, India has failed to exploit the potential of this endowment owing to problems associated with physical connectivity. The Modi-led NDA administration’s focus on improving physical connectivity (via roads, railways, air, ports and waterways) holds the potential of dramatically improving mobility of labour as well as raw materials.
The Modi administration’s focus on building roadways, railways, waterways, ports and air connectivity is likely to result in a dramatic improvement on this front by CY20 (see exhibit below).
Exhibit 57: The Government has set up ambitious targets for infrastructure development
Head Target
Roads
Government think tank NITI Aayog has set ambitious targets of doubling the network of national highways and hiking the railway track length by almost eight times between now and CY20 as it aims to create world-class infrastructure to boost the economy. The total network of highways — including single and intermediate lanes and 4 & 6 lanes — is set to more than double to 96,000 km in 2020 from 45,406 km in FY16-end.
Railways The target for total track length, including commissioning of new lines, has been set at 130 lakh km for FY20 from 17.8 lakh km in FY17 and 16.5 lakh km achieved in FY16. At the same time, the government aims to reduce the empty freight wagon return ratio from an abysmal 39% during the current and last fiscal to 30% by CY20.
Airways The targets for passenger and cargo capacity have been set at 440 million passengers per year and 6 million tonnes a year, respectively. For the current fiscal, the passenger capacity target is set at 270 million, higher than the 250 million passenger capacity during last fiscal, while the cargo capacity has been maintained flat at four million tonnes for FY17.
Ports The target for FY20 has been fixed at 2,331 million tonnes per annum (mtpa) as against the current capacity of 1602 mtpa.
Source: NITI Aayog, Ambit Capital research
India lags its peers on the physical connectivity front
India scores very poorly on the physical connectivity front as compared to peers (see exhibit below).
The Government’s focus on improving physical infrastructureholds the potential of dramatically improving mobility
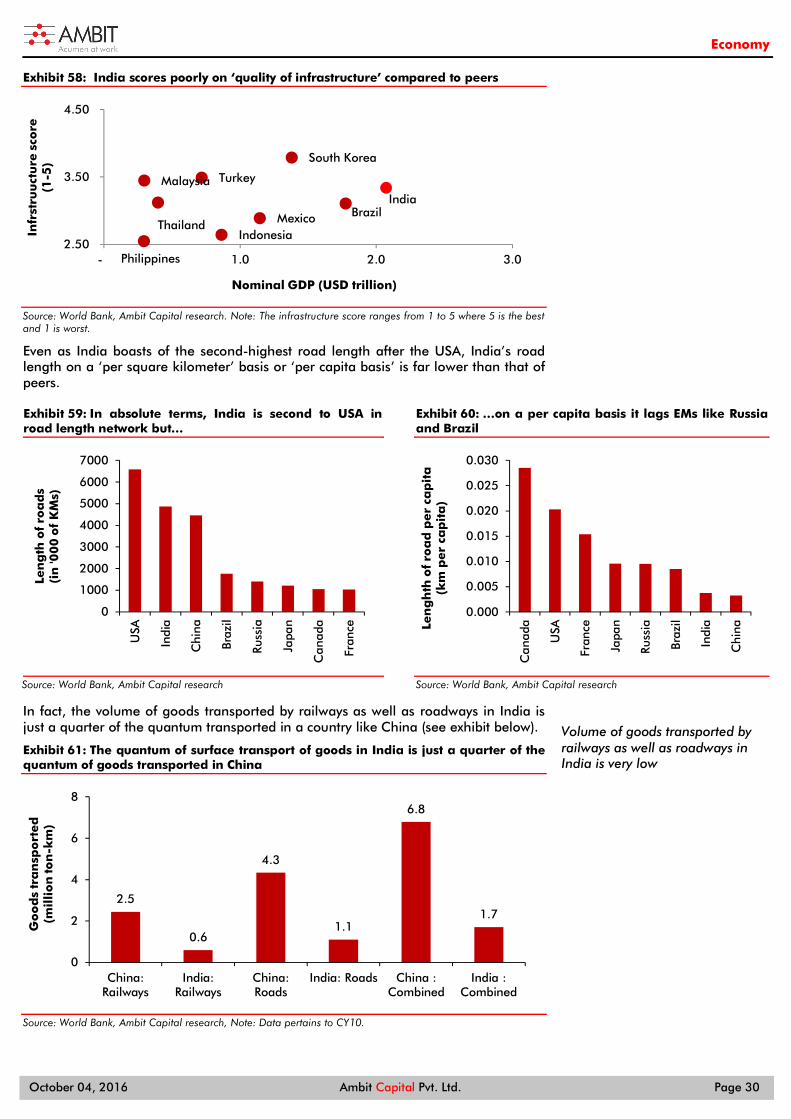
Economy
October 04, 2016 Ambit Capital Pvt. Ltd. Page 30
Exhibit 58: India scores poorly on ‘quality of infrastructure’ compared to peers
Source: World Bank, Ambit Capital research. Note: The infrastructure score ranges from 1 to 5 where 5 is the best and 1 is worst.
Even as India boasts of the second-highest road length after the USA, India’s road length on a ‘per square kilometer’ basis or ‘per capita basis’ is far lower than that of peers.
Exhibit 59: In absolute terms, India is second to USA in road length network but…
Source: World Bank, Ambit Capital research
Exhibit 60: …on a per capita basis it lags EMs like Russia and Brazil
Source: World Bank, Ambit Capital research
In fact, the volume of goods transported by railways as well as roadways in India is just a quarter of the quantum transported in a country like China (see exhibit below).
Exhibit 61: The quantum of surface transport of goods in India is just a quarter of the quantum of goods transported in China
Source: World Bank, Ambit Capital research, Note: Data pertains to CY10.
South Korea
TurkeyMalaysia
India
Thailand BrazilMexico
Indonesia
Philippines 2.50
3.50
4.50
- 1.0 2.0 3.0
Infr
stru
uct
ure
sco
re(1
-5)
Nominal GDP (USD trillion)
0
1000
2000
3000
4000
5000
6000
7000
USA
Indi
a
Chi
na
Braz
il
Russ
ia
Japa
n
Can
ada
Fran
ce
Len
gth
of
roa
ds
(in
'00
0 o
f K
Ms)
0.000
0.005
0.010
0.015
0.020
0.025
0.030
Can
ada
USA
Fran
ce
Japa
n
Russ
ia
Braz
il
Indi
a
Chi
naLen
gh
th o
f ro
ad
per
cap
ita
(km
per
cap
ita
)
2.5
0.6
4.3
1.1
6.8
1.7
0
2
4
6
8
China:Railways
India:Railways
China:Roads
India: Roads China :Combined
India :Combined
Go
od
s tr
an
spo
rted
(mil
lio
n to
n-k
m)
Volume of goods transported by railways as well as roadways in India is very low

Economy
October 04, 2016 Ambit Capital Pvt. Ltd. Page 31
The Modi-led Government is keen to improve connectivity for the masses
India’s ambitious Prime Minister is keen to establish his political perpetuity by improving access to a range of basic services and amenities for India’s large populace. Besides access to banking, the current dispensation has shown a great degree of focus on improving physical connectivity for India’s vast population.
For instance, the Central Government’s spending on roads and railways (including on-balance-sheet as well as off-balance-sheet funding) has risen significantly under NDA-II as compared to the spending under UPA-I and UPA-II (see exhibit below).
Exhibit 62: The Central Government’s budgetary support for infrastructure has increased systematically under the Modi Government
Source: Union Budget documents. Infrastructure spending includes spending on National Highways, railways, power, shipping and rural roads.
In terms of specific programmes, the most ambitious programme that the NDA Government is working on is the three industrial corridors planned in and around the dedicated freight corridors (DFC). These three corridors will be built around the Delhi-Mumbai, Kolkata-Amritsar and Chennai-Vishakhapatnam industrial corridors (see exhibit below).
Exhibit 63: The three Industrial Corridors that the Modi Government plans to build
Source: Media reports
2.0%
3.1% 3.0%
3.6%
0%
1%
2%
3%
4%
FY14 FY15 FY16 FY17 (BE)
Go
vt. sp
en
din
g o
n
infr
ast
ruct
ure
(as
% o
f G
DP
)
Besides access to banking, the current dispensation has shown a great degree of focus in improving physical connectivity
The most ambitious program that the NDA Government is working on is the three industrial corridors

Economy
October 04, 2016 Ambit Capital Pvt. Ltd. Page 32
Whilst two of these three corridors were conceptualised by the UPA-II, data suggests that work has progressed faster under the current Government (see exhibit above and below).
Exhibit 64: The NDA Government intends to build three industrial corridors around the proposed DFCs
DFC Percentage of work
completed under UPAII Percentage of work
completed under NDAII Description
Delhi-Mumbai Industrial Corridor (DMIC)
23% 43%
The DMIC seeks to improve both the industrial and physical infrastructure in seven key states in India through the proposed dedicated freight corridor between Delhi and Mumbai. This will cover an overall length of 1,483km passing through the States of UP, Delhi, Haryana, Rajasthan, Gujarat and Maharashtra, with end terminals at Dadri in the National Capital Region of Delhi and Jawaharlal Nehru Port near Mumbai.
Amritsar-Delhi-Kolkata Industrial Corridor
17% 39%
In a similar pattern as the DMIC, the NDA Government has planned to develop the Amritsar-Delhi-Kolkata Industrial Corridor which will use the Eastern-dedicated Freight Corridor (DFC) as its backbone. The Eastern DFC extends from Ludhiana in Punjab to Dankuni near Kolkata. Therefore, the Amritsar-Delhi-Kolkata Industrial Corridor will be structured around the Eastern DFC and the highway system that exists on this route.
Chennai-Vishakhapatnam Corridor
0% 13%
The Chennnai-Visakhapatnam industrial corridor is an important part of the East Coast economic corridor and the extent of it is considered from Pydibheemavaram in Srikakulam district to Chennai in Tamilnadu. The corridor is therefore covering the coast of AP comprehensively. In the corridor a number of infrastructure projects are planned which would link various manufacturing clusters and gateways such as ports and airports to a central spinal road, rail and utilities infrastructure.
Source: Ambit Capital research Note: The data pertains to June 2016
Besides these industrial corridor, the Government is likely to embark on its most ambitious infrastructure project since the NDA I developed the Golden Quadrilateral connecting Delhi, Mumbai, Chennai and Kolkata.
According to Government sources, the Government is planning to develop 40 economic corridors spanning 21,000kms which will be completed in next four years. This is likely to entail an expenditure of Rs3tn (US$45bn or 2% of GDP) (see exhibit below).
Exhibit 65: The Government is planning its most ambitious infrastructure project since the Golden Quadrilateral
Head Details
Total number of corridors to be constructed
40 (Notable corridors: Mumbai-Kochi-Kanyakumari, Bangalore-Mangalore, Hyderabad-Panji and Sambalpur-Ranchi).
Total length of roads to built 21,000 km
Total expenditure Rs3 trillion (US$45bn or 2% of GDP)
Project expected to be completed by CY20
Source: Ministry of road transport and Highways, Ambit Capital research
As regards railways, the Government has laid down an ambitious Rs8.5tn (US$127bn) capex plan for the next five years. Most of the said amount will be spent on network decongestion and network expansion (see exhibit below).
Exhibit 66: Railways has set up an ambitious capex plan for the next few years
Head Investment target
(Rs bn) Network Decongestion (including DFC + electrification, Doubling + electrification & traffic facilities) 1,993
Network Expansion (including electrification) 1,930
National Projects (North Eastern & Kashmir connectivity projects) 390
Safety (Track renewal, bridge works) 1,270
Information Technology / Research 50
Rolling Stock (Locomotives, coaches, wagons – production & maintenance) 1,020
Passenger Amenities 125
High Speed Rail & Elevated corridor 650
Station redevelopment + logistic parks 1,000
Others 132
Total 8,560
Timeline By end-FY20
Source: Ministry of Railways, Ambit Capital research
Government is planning to develop 40 economic corridors spanning 21,000kms
For Railways, Government has laid down an ambitious capex plan for the next five years

Economy
October 04, 2016 Ambit Capital Pvt. Ltd. Page 33
Besides ground transport, the NDA-II has spent a substantial quantum of funds on inland waterways as well. India’s current network of waterways is fairly rudimentary. For instance, inland waterways in India make up a paltry 3% of the total volume of transport compared with China’s 47%, according to data from National Waterways Authority of India.
The NDA Government passed the New National Waterways Act in February 2016 which proposes to build 106 new waterways on the existing six National Waterways (see exhibit below for details) throughout the country, thereby expanding the volume of goods and passengers moved via inland waterways (see exhibit below).
Exhibit 67: The New Waterways Act, 2016 aims to add 106 national waterways
Head Description
What the National Waterways act seeks?
The act seeks to add 106 inland waterways to the existing six National Waterways on the recommendations of the Parliamentary Standing Committee on Transport, Tourism and Culture and comments of several state governments
Progress
The act will also look after the renovation and maintenance of the existing waterways. Out of the 106 new waterways, 18 have already been identified. These include five waterways each from Karnataka and Meghalaya, three each from Maharashtra and Kerala, one each from Tamil Nadu and Rajasthan.
Other provisions in the act
The act also aims to help the Inland Waterways Authority of India (IWAI) to develop the feasible stretches for Shipping and Navigation.
Timelines To be completed by CY20 Source: National Waterways Authority of India, Ambit Capital research
The new aviation policy released by the NDA Government in June 2016 tries to increase the last mile connectivity for smaller towns (see exhibit below).
Exhibit 68: The NDA’s New Aviation Policy launched in June 2016 attempts to enhance connectivity to smaller towns
Head Description
5/20 changes to 0/20: To increase pressure on domestic yields in short term, international yields in medium to long term
The 5/20 rule states that the 5/20 rule shall now be replaced by only a requirement of deploying 20 aircrafts or 20% of total capacity, whichever is higher, on domestic operations before the airline goes international.
Regional Connectivity Scheme: To help regional airlines grow; to increase domestic competition
For airports under Regional Connectivity Scheme (RCS), the fares are capped at Rs2,500 for 500-600km (~1hr). The Government will also provide Viability Gap Funding (VGF). The sharing between Central and State Government will in the 80-20 ratio.
Source: Ministry of civil aviation, Government of India, Ambit Capital research
According to Ambit’s aviation analyst, Parita Ashar, the measures announced by the Government will help increase air connectivity to tier II and tier III towns in India which historically have had very poor connectivity through air.
As regards power, the Government has made steady progress to reform the sector and has come up with a plan to revive the state distribution companies through Ujjwal Discom Assurance Yojna. The Government has also set an ambitious 175GW target for renewable energy by FY22 (see exhibit below). All of this would help increase availability power to consumers as well as industries.
Exhibit 69: The government has made steady progress in the power sector
UDAY – SEB restructuring
The Central Government on 5th November 2015 announced the Ujwal Discom Assurance Yojana (UDAY) scheme to address the financial woes of distressed state electricity boards (SEBs). SEBs’ total debt as of FY14 stood at Rs3.6tn vs FY14 revenue of Rs3.5tn and FY14 losses of Rs0.37tn. The objective of the scheme is to bail out stressed SEBs through: (a) reduction in interest rate; (b) transfer of debt to the state government’s balance sheet; and (c) rewarding SEBs through devolution of grant under the Deen Dayal Upadhya Gram Jyoti Yojana (DDUGJY) and Integrated Power Development Scheme (IPDS).
Ambitious 175GW target of renewable energy by FY22
The Government has set an ambitious target of increasing solar and wind capacity to 100GW (from 3.7GW) and 60GW (from 23.4GW) by FY22. This implies an aggressive per annum target of adding 13.7GW in solar and 5.2GW in wind over the next seven years (vs per annum capacity addition of 0.7GW in solar and 2.6GW in wind over the last five years).
Transmission and Distribution (T&D)
T&D has seen relative underinvestment vs power-gen (33% of total power spends over FY08-14 vs 50% ideal); evolving consumption patterns, generation centres and type of power (more renewables) will necessitate higher spending in the former. Central Government’s reform intent - discom debt restructuring (UDAY), Central Government schemes (DDUGJY, IPDS; Rs1.6tn) and legislation (more TBCB, content carriage separation) - will boost T&D spending sustainably over the next five years (like in the previous cycle FY04-09 where these were the triggers). Central funding for distribution infrastructure will free up state resources to invest in upgrading state-level transmission systems to increase capacity and improve quality of power.
Source: Ministry of Power, Ambit Capital research
The NDA-II has spent a substantial quantum of funds on inland waterways
The measures announced by the Government will help increase air connectivity to tier II and tier III towns

Economy
October 04, 2016 Ambit Capital Pvt. Ltd. Page 34
Section 2: Macroeconomic Implications The three transformations in access (listed above in Section 1) are likely to trigger a U-shaped recovery in India over the next five years. In specific,
Impact#1: The combination of superior physical infrastructure and tax reforms like the rollout of the GST system (expected in 2HFY18) is likely to boost access to end-markets as well as inputs. Cross-country experience suggests that improved market access and easier access to inputs boosts productivity in a gradual manner – thereby suggesting that the growth pattern in India is likely to follow a U-shaped pattern.
Impact#2: Cross-country experience suggests that greater competition ‘amongst banks’ and ‘to banks’ is likely to drive lower lending rates. This is likely to result in a reduction in the cost of debt capital in India.
The lowering of the cost of debt capital and democratisation of credit access appear likely to add to consumption growth in the short term. However, the lower cost of debt capital is likely to boost investment growth only once capacity utilisation levels begin rising. Thus, the lowering of cost of debt capital too is likely to propel a U-shaped economic recovery in India as investment growth remains compromised.
Articulating our GDP forecast for FY18: Based on the conclusions arrived above, we articulate our GDP growth forecast for FY18. We expect GDP growth in FY18 to be recorded at 7.5% YoY, thereby marking a 50bps acceleration from 6.8% in FY17.
Impact#1: Improved market access and access to inputs of production is likely to yield gradual improvements in GDP growth in India
The best comparator to the road-building activity underway in India is the road building boom that occurred in USA in the late 1950s and 1960s triggered by the passage of the Federal-Aid Highway Act of 1956 under the Presidency of Dwight D. Eisenhower (see exhibit below for details).
Exhibit 70: The passage of the Federal-Aid Highway Act of 1956 paved the way for road construction boom in USA
Head Description
The Federal-Aid Highway Act of 1956
A new Federal-Aid Highway Act passed in June 1956. The law authorised the construction of a 41,000-mile network of interstate highways that would span the nation. It also allocated US$26 billion to pay for them.
Under the terms of the law, the federal government would pay 90 percent of the cost of expressway construction. The money came from an increased gasoline tax–now 3 cents a gallon instead of 2–that went into a non-divertible Highway Trust Fund.
Financing
About 70% of the construction and maintenance costs of Interstate Highways in the United States have been paid through user fees, primarily the fuel taxes collected by the federal, state, and local governments. To a much lesser extent they have been paid for by tolls collected on toll highways and bridges. The Highway Trust Fund, established by the Highway Revenue Act in 1956, prescribed a three-cent-per-gallon fuel tax, soon increased to 4.5 cents per gallon.
Source: Federal highway commission, Ambit Capital research
Research suggests that the building of interstate highways in USA in the late 1950s and 1960s had a long-lasting positive impact on the GDP growth (see exhibit below).
Exhibit 71: The road construction boom in the USA in 1950s and 1960s had a positive impact on GDP growth Study Key relevant finding
An economic analysis of transportation infrastructure investment, The White House, July 2014
Research suggests that public infrastructure investments have some of the highest multipliers, or effects on short run GDP of any fiscal intervention. The investments in road infrastructure raised the level of GDP by 2 to 2.5% during 1950 and 1960s
A new economic analysis of infrastructure investment, a report prepared by the department of the treasury, USA, March 2012
A study by John Fernald makes progress on establishing causality by comparing the impact of infrastructure investment on industries that a priori should experience different benefits from infrastructure spending. He finds that the construction of the interstate highway system in the 1950s and 1960s corresponded with a significant increase in the productivity of vehicle-intensive industries (such as transportation and gas utilities), relative to industries that do not depend on vehicles (such as apparel and textiles and industrial machinery). Fernald’s findings suggest that previous investments in infrastructure led to substantial productivity gains, and highlight the potential for further increases in productivity through additional, well-targeted investments.
Source: Academic publications, Ambit Capital research
The three transformations in access are likely to trigger a U-shaped recovery
The lowering of the cost ofdebt capital and democratisation of credit access appear likely to add to consumption growth
The best comparator to the road-building activity underway in India is the road building boom thatoccurred in USA in the 1960s
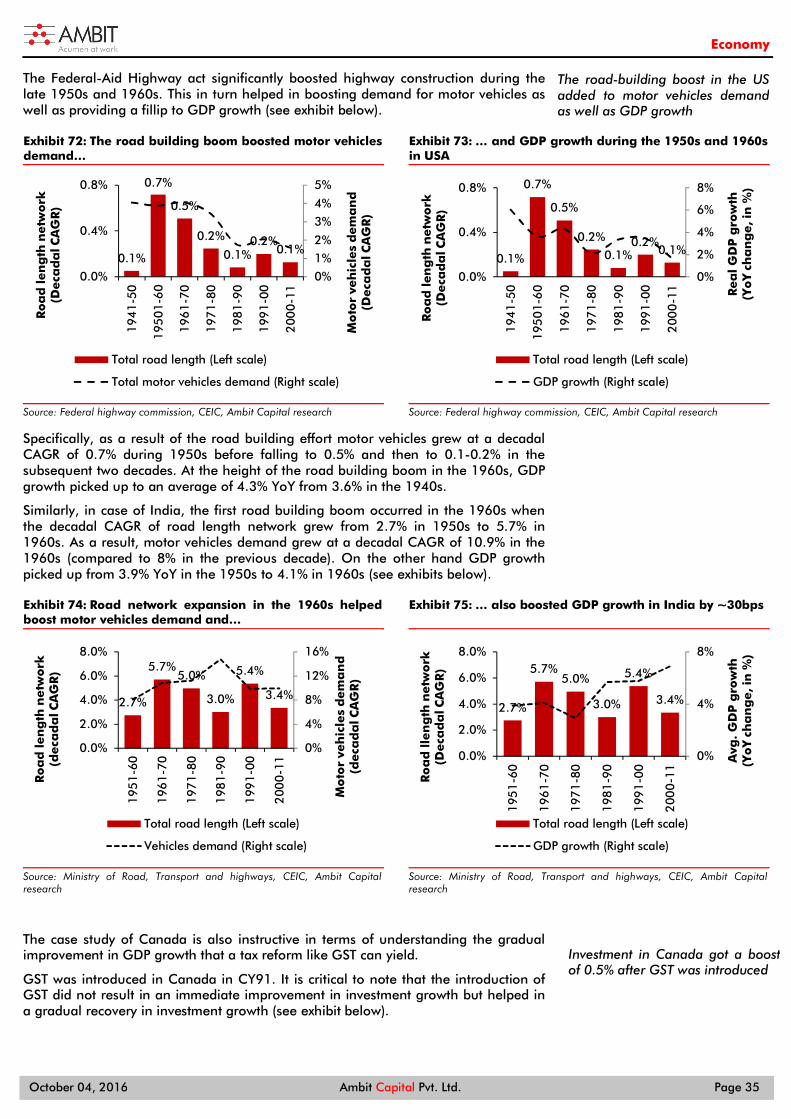
Economy
October 04, 2016 Ambit Capital Pvt. Ltd. Page 35
The Federal-Aid Highway act significantly boosted highway construction during the late 1950s and 1960s. This in turn helped in boosting demand for motor vehicles as well as providing a fillip to GDP growth (see exhibit below).
Exhibit 72: The road building boom boosted motor vehicles demand…
Source: Federal highway commission, CEIC, Ambit Capital research
Exhibit 73: … and GDP growth during the 1950s and 1960s in USA
Source: Federal highway commission, CEIC, Ambit Capital research
Specifically, as a result of the road building effort motor vehicles grew at a decadal CAGR of 0.7% during 1950s before falling to 0.5% and then to 0.1-0.2% in the subsequent two decades. At the height of the road building boom in the 1960s, GDP growth picked up to an average of 4.3% YoY from 3.6% in the 1940s.
Similarly, in case of India, the first road building boom occurred in the 1960s when the decadal CAGR of road length network grew from 2.7% in 1950s to 5.7% in 1960s. As a result, motor vehicles demand grew at a decadal CAGR of 10.9% in the 1960s (compared to 8% in the previous decade). On the other hand GDP growth picked up from 3.9% YoY in the 1950s to 4.1% in 1960s (see exhibits below).
Exhibit 74: Road network expansion in the 1960s helped boost motor vehicles demand and…
Source: Ministry of Road, Transport and highways, CEIC, Ambit Capital research
Exhibit 75: … also boosted GDP growth in India by ~30bps
Source: Ministry of Road, Transport and highways, CEIC, Ambit Capital research
The case study of Canada is also instructive in terms of understanding the gradual improvement in GDP growth that a tax reform like GST can yield.
GST was introduced in Canada in CY91. It is critical to note that the introduction of GST did not result in an immediate improvement in investment growth but helped in a gradual recovery in investment growth (see exhibit below).
0.1%
0.7%
0.5%
0.2%
0.1%0.2%
0.1%
0%
1%
2%
3%
4%
5%
0.0%
0.4%
0.8%
194
1-5
0
195
01-
60
196
1-7
0
197
1-8
0
198
1-9
0
199
1-0
0
200
0-1
1
Mo
tor
veh
icle
s d
em
an
d(D
eca
da
l CA
GR
)
Ro
ad
len
gth
netw
ork
(Deca
da
l CA
GR
)
Total road length (Left scale)
Total motor vehicles demand (Right scale)
0.1%
0.7%
0.5%
0.2%
0.1%0.2%
0.1%
0%
2%
4%
6%
8%
0.0%
0.4%
0.8%
194
1-5
0
195
01-
60
196
1-7
0
197
1-8
0
198
1-9
0
199
1-0
0
200
0-1
1 Rea
l G
DP
gro
wth
(Yo
Y c
ha
ng
e, i
n %
)
Ro
ad
len
gth
netw
ork
(Deca
da
l CA
GR
)
Total road length (Left scale)
GDP growth (Right scale)
2.7%
5.7%5.0%
3.0%
5.4%
3.4%
0%
4%
8%
12%
16%
0.0%
2.0%
4.0%
6.0%
8.0%
195
1-6
0
196
1-7
0
197
1-8
0
198
1-9
0
199
1-0
0
200
0-1
1
Mo
tor
veh
icle
s d
em
an
d(d
eca
da
l CA
GR
)
Ro
ad
len
gth
netw
ork
(deca
da
l CA
GR
)
Total road length (Left scale)
Vehicles demand (Right scale)
2.7%
5.7%5.0%
3.0%
5.4%
3.4%
0%
4%
8%
0.0%
2.0%
4.0%
6.0%
8.0%
195
1-6
0
196
1-7
0
197
1-8
0
198
1-9
0
199
1-0
0
200
0-1
1
Avg
. G
DP
gro
wth
(Yo
Y c
ha
ng
e, i
n %
)
Ro
ad
lle
ng
th n
etw
ork
(Deca
da
l CA
GR
)
Total road length (Left scale)
GDP growth (Right scale)
The road-building boost in the US added to motor vehicles demand as well as GDP growth
Investment in Canada got a boost of 0.5% after GST was introduced
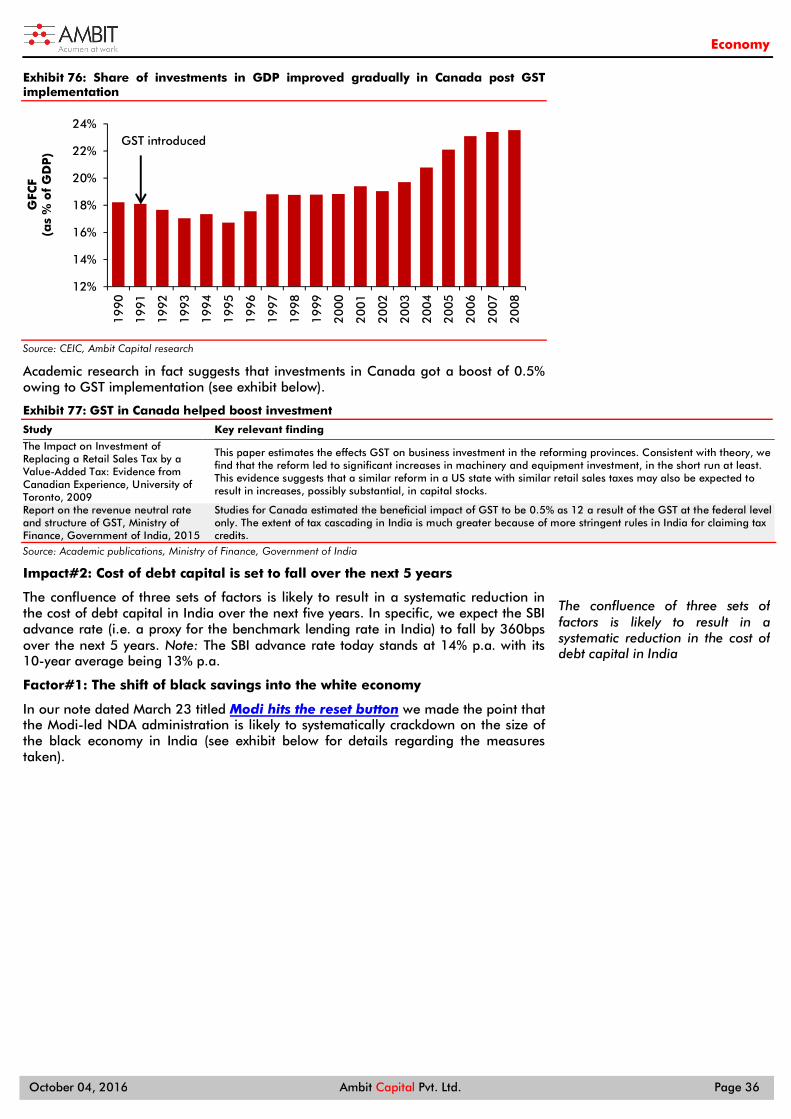
Economy
October 04, 2016 Ambit Capital Pvt. Ltd. Page 36
Exhibit 76: Share of investments in GDP improved gradually in Canada post GST implementation
Source: CEIC, Ambit Capital research
Academic research in fact suggests that investments in Canada got a boost of 0.5% owing to GST implementation (see exhibit below).
Exhibit 77: GST in Canada helped boost investment
Study Key relevant finding
The Impact on Investment of Replacing a Retail Sales Tax by a Value-Added Tax: Evidence from Canadian Experience, University of Toronto, 2009
This paper estimates the effects GST on business investment in the reforming provinces. Consistent with theory, we find that the reform led to significant increases in machinery and equipment investment, in the short run at least. This evidence suggests that a similar reform in a US state with similar retail sales taxes may also be expected to result in increases, possibly substantial, in capital stocks.
Report on the revenue neutral rate and structure of GST, Ministry of Finance, Government of India, 2015
Studies for Canada estimated the beneficial impact of GST to be 0.5% as 12 a result of the GST at the federal level only. The extent of tax cascading in India is much greater because of more stringent rules in India for claiming tax credits.
Source: Academic publications, Ministry of Finance, Government of India
Impact#2: Cost of debt capital is set to fall over the next 5 years
The confluence of three sets of factors is likely to result in a systematic reduction in the cost of debt capital in India over the next five years. In specific, we expect the SBI advance rate (i.e. a proxy for the benchmark lending rate in India) to fall by 360bps over the next 5 years. Note: The SBI advance rate today stands at 14% p.a. with its 10-year average being 13% p.a.
Factor#1: The shift of black savings into the white economy
In our note dated March 23 titled Modi hits the reset button we made the point that the Modi-led NDA administration is likely to systematically crackdown on the size of the black economy in India (see exhibit below for details regarding the measures taken).
12%
14%
16%
18%
20%
22%
24% 1
990
19
91
19
92
19
93
19
94
19
95
19
96
19
97
19
98
19
99
20
00
20
01
20
02
20
03
20
04
20
05
20
06
20
07
20
08
GFC
F(a
s %
of
GD
P)
The confluence of three sets of factors is likely to result in a systematic reduction in the cost of debt capital in India
GST introduced

Economy
October 04, 2016 Ambit Capital Pvt. Ltd. Page 37
Exhibit 78: The Modi Government has taken a range of steps to curb the easy flow of black money
Head Before May 2014 After May 2014
Cash transaction for movable property
No PAN card was required whilst purchasing goods and services of any value.
According to a Central Board of Direct Taxes (CBDT) notice dated 15 December 2015 producing a PAN card is mandatory for purchase of goods/services whose value exceeds INR200,000.
The Undisclosed Foreign Income and Assets (imposition of tax) Act, 2015
Non-declaration of foreign income and assets was treated as a civil and not a criminal offence.
The NDA Government passed a Black Money Act under which parking of ill-gotten money outside the country will be charged as a criminal offence and will attract a ten-year jail sentence.
Equity Markets There existed no prescribed criteria to detect money laundering in the capital markets.
In January 2015, SEBI halted trading in 300 shell companies, accusing them of being set up to evade income tax (source: http://goo.gl/qbQbrP).
In February 2015, SEBI identified three parameters for taking action against shell companies and the trading would be suspended in the shares of those entities that satisfy more than one of three criteria. "These parameters include these companies being non-existent on their mentioned address, misuse of preferential allotment and weak fundamentals not supporting price rise," a senior SEBI official said (source: http://goo.gl/B4YGec).
In July 2015, SEBI clamped down on a large number of organised syndicates which had set up 'shops' to convert black money into legitimate-looking funds through the stock market platform (source: http://goo.gl/7LbmST).
Real Estate Regulatory Act No real estate regulatory bill in place
As per the provisions, the builders cannot divert funds collected from buyers for other purposes such as land acquisition. The funds have to be used only for construction activities.
Ban on cash transactions exceeding Rs300,000*
Not Applicable The SIT has recommended that there should be a total ban on cash transactions exceeding Rs300,000 in value and an Act ought to be framed to declare such transactions as illegal and punishable under law.
Cash holding limit of Rs1,500,000*
Not Applicable The SIT has suggested an upper limit of Rs1,500,000. Furthermore, any person or industry that needs to hold more cash must obtain necessary permission from the Commissioner of Income tax of the area.
Source: Media reports, Ambit Capital research, Note: The changes marked with an asterisk are in the process of being discussed and have not been implemented yet.
The motivation for such a crackdown is likely to be two-fold, namely: (1) the NDA’s desire to ensure that the opposition’s access to election funding (which in India mainly flows through the black economy) is compromised and (2) the NDA Government’s needs to create jobs by making manufacturing competitive in India by lowering the cost of debt capital.
Our analysis suggests that as the quantum of India’s savings increases by ~4% of GDP over FY17-FY20, lending rates (defined as the SBI advance rate) are likely to fall by 360bps assuming that investments as a percentage of GDP remain constant during this period.
The steps taken to arrive at this conclusion is as follows:
Setp#1: Data suggests that 41% of the savings are held in physical assets. We assume that 50% of these are black savings.
Step#2: India is characterised by a perpetual current account deficit since India’s investments (34% of GDP in FY15) are in excess of its savings (33% of GDP in FY15). Applying the assumption from step#1, the total size of India’s ‘black’ savings is likely to be 7% of India’s GDP.
Step#3: Assuming that every year from FY16 onwards this 7% of GDP of black savings decreases by 200bps each year and transitions into white savings, then the white savings ratio will rise to 30% of GDP by FY20 whilst the black savings ratio will fall to 3.5% of GDP by FY20.
As the quantum of s India’s savings increases by ~4% of GDP over FY17-FY20, lending rates are likely to fall

Economy
October 04, 2016 Ambit Capital Pvt. Ltd. Page 38
Exhibit 79: The quantum of white savings in India is set to rise even if India’s GDP growth rate does not accelerate
Metric FY13 FY14 FY15 FY16 FY17 E FY18 E FY19 E FY20 E
Investment ratio (as a % of GDP) 38.3% 34.7% 34.1% 33.3% 32.8% 32.8% 33.2% 33.6%
White savings ratio (as a % of GDP) 26.9% 26.3% 26.2% 27.4% 28.1% 28.8% 29.5% 30.1%
Black savings ratio (as a % of GDP) 6.9% 6.8% 6.8% 6.2% 5.6% 4.9% 4.2% 3.5%
Nominal GDP growth rate (YoY change, in %)
14% 13% 11% 9% 11% 11% 11% 11%
Nominal GDP (in INR tn) 100 113 125 136 151 167 186 206
White savings (in INR tn) 26.8 29.6 32.7 37.2 42.4 48.1 54.7 62.1
Black savings (in INR tn) 6.2 6.9 7.6 8.4 8.5 8.4 8.2 7.8
Investments (in INR tn)
43 44 46 50 55 61 68 75
Savings and Investment gap (in INR tn)
9 6 5 4 4 5 6 6
Source: CEIC, Ambit Capital research. Nominal GDP is assumed to grow at 11% from FY17 onwards.
Step#4: The lending rate in an economy is a function of the gap between rate of savings (supply of funds) and investments (demand for funds). A larger pool of savings will reduce the cost of funding and vice versa.
A linear regression analysis suggests that every 100bps increase in the white savings ratio is likely to reduce the lending rate by 90bps (see exhibit below for the details of the regression results).
Exhibit 80: As savings increase, lending rates fall
Coefficients t Stat
Intercept 0.2 11.4
Investment (as % of GDP) 0.8 3.7
Savings (as % of GDP) -0.9 -3.8
Source: Ambit Capital research. Note: The independent variable used is the SBI advance rate. The adjusted R squared for the model is 26%. The total number of observations used is 45.
Factor#2: The crackdown on ‘crony capitalism’ is likely to help lower inflation structurally
Until the 1990s, the predominant model of corruption in India was the ‘cream-skimming kind of corruption’ whereby private companies were required to pay an extra 5-10% of their project outlay to the local powers that be. During the ten years of UPA rule, however, India’s core model of corruption shifted to a different level whereby various political-business cliques captured large sectors of the economy and then suppressed competition in the sector in a bid to maximise their gains (see the exhibit below for details).
Exhibit 81: How high degree of corruption led to higher inflation
Source: Ambit Capital research

Economy
October 04, 2016 Ambit Capital Pvt. Ltd. Page 39
This changed in November 2010 when the Comptroller and Auditor General (CAG) of India began publishing a series of hard-hitting reports on many issues, including the irregularities in the allocation of 2G telecom bandwidth as well as coal block allocations. Vinod Rai’s CAG reports and the media coverage that they received created a situation in which the crony capitalist construct was weakened. Furthermore, the NDA’s election then meant that even after Vinod stepped down as CAG, the crony capitalists were kept on the defensive and were denied political patronage.
Two clear illustrations of this dynamic are the dramatic reduction in food prices and merchant power prices achieved under the Modi Government.
The Modi-led Government administered a range of supply augmenting reforms in the food (mainly cereals and pulses) and power sectors over the last two years (see exhibit below), which has effectively hampered the ability of producers to push through unusually high prices.
Exhibit 82: The Government has made steady progress on food and power sector reforms
Sector Reforms
Food related reforms
Overhaul of the Food Corporation of India (FCI): Within two months of assuming power, the Government constituted a commission under parliamentarian Shanta Kumar to suggest ways to restructure the FCI. The Government is likely to implement the recommendations of the committee, which will dramatically bring down the operational cost to maintain the FCI. Low MSP hikes: The Government has administered very low hikes in MSPs for major crops like wheat and paddy. This has helped keep cereal prices under check
Power sector reforms
UDAY – SEB restructuring: The Central Government on 5th November 2015 announced the Ujwal Discom Assurance Yojana (UDAY) scheme to address the financial woes of distressed state electricity boards (SEBs). The objective of the scheme is to bail out stressed SEBs through: (a) reduction in interest rate; (b) transfer of debt to the state government’s balance sheet; and (c) rewarding SEBs through devolution of grant under the Deen Dayal Upadhya Gram Jyoti Yojana (DDUGJY) and Integrated Power Development Scheme (IPDS).
Ambitious 175GW target of renewable energy by FY22: The NDA-led Central Government has set an ambitious target of increasing solar and wind capacity to 100GW (from 3.7GW) and 60GW (from 23.4GW) by FY22. This implies an aggressive per annum target of adding 13.7GW in solar and 5.2GW in wind over the next seven years (vs per annum capacity addition of 0.7GW in solar and 2.6GW in wind over the last five years).
Transmission and Distribution (T&D): T&D has seen relative underinvestment vs power-gen (33% of total power spends over FY08-14 vs 50% ideal); evolving consumption patterns, generation centres and type of power (more renewables) will necessitate higher spending in the former. Central Government’s reform intent - discom debt restructuring (UDAY), Central Govt schemes (DDUGJY, IPDS; Rs1.6tn) and legislation (more TBCB, content carriage separation) - will boost T&D spending sustainably over the next five years (like in the previous cycle FY04-09 where these were the triggers).
Source: Ministry of food and civil supplies, Ministry of Power, Ambit Capital research
This has resulted in a systematic reduction in the cost of both power and food in India under the NDA Government (see exhibit below).
Exhibit 83: Food and power prices have come down in the recent past
Source: IEX, CEIC, Ambit Capital research.
0%2%4%6%8%10%12%14%16%18%20%
0
2
4
6
8
10
2Q
FY0
9
4Q
FY0
9
2Q
FY1
0
4Q
FY1
0
2Q
FY1
1
4Q
FY1
1
2Q
FY1
2
4Q
FY1
2
2Q
FY1
3
4Q
FY1
3
2Q
FY1
4
4Q
FY1
4
2Q
FY1
5
4Q
FY1
5
2Q
FY1
6
4Q
FY1
6
CP
I fo
od
(Yo
Y c
ha
ng
e, i
n %
)
Merc
ha
nt p
ow
er
pri
ces
(IN
R/u
nit
)
Merchant power prices (Left scale) CPI food (Right scale)
Vinod Rai’s CAG reports and the media coverage that they received created a situation in which the crony capitalist construct was weakened
The Modi-led Government administered a range of supply augmenting reforms in the foo

Economy
October 04, 2016 Ambit Capital Pvt. Ltd. Page 40
It will be fair to say that structurally lower prices as result of Vinod Rai’s CAG reports and a subsequent crackdown on crony capitalists by the NDA Government could allow the RBI to maintain a lower interest rate structure in India (see exhibit below).
Exhibit 84: Inflation has structurally declined under the NDA
Source: CEIC, Ambit Capital research
Factor#3: The development of the corporate bond market is likely to lower the cost of funding for corporates
On a like-to-like basis, the same corporate will be able to access funds at a lower cost via the corporate bond market as opposed to raising the same funds via bank lending since the cost of intermediation is lower.
The example of Korea illustrates the degree to which a vibrant corporate bond market can help lower the cost of debt capital for a corporate. Korea adopted a range of corporate bond market related reforms in the 1980s and 1990s (see exhibit below for details).
Exhibit 85: Korea adopted a range of measures to liberalise the corporate bond market
Period Steps taken
1980-82 Interest rates were deregulated during 1981 Financial institutions were granted managerial autonomy
1997-98
Foreigners were allowed to purchase long-term non-guaranteed bonds issued by SMEs and long-term non-guaranteed domestic corporate bonds issued by large firms in June 1997.
Foreigners were allowed to buy long-term non-guaranteed bonds issued by large firms from January 1998. The ceiling on foreign holdings of most bonds was completely abolished from December 1997.
Private firms involved in major infrastructure projects were allowed to borrow overseas in January 1997. Overseas borrowing of private companies was liberalised for borrowings with a maturity of more than three years in December 1997.
Source: Bank of Korea, Ambit Capital research
This translated into a reduction in the AAA corporate bond yield. As a result, the AAA corporate bond yield became lesser than the bank lending rate in CY98. After CY98 the AAA corporate bond yield has now been lower than the bank lending rate by an average of 80bps (see exhibit below).
10.4%
5.8%
0%
2%
4%
6%
8%
10%
12%
UPA II NDA II
CP
I in
fla
tio
n (in
%)
CPI inflation
Corporates will be able to access funds at a lower cost via the corporate bond market
AAA corporate bond yield became lesser than the bank lending rate in CY98 for Korea
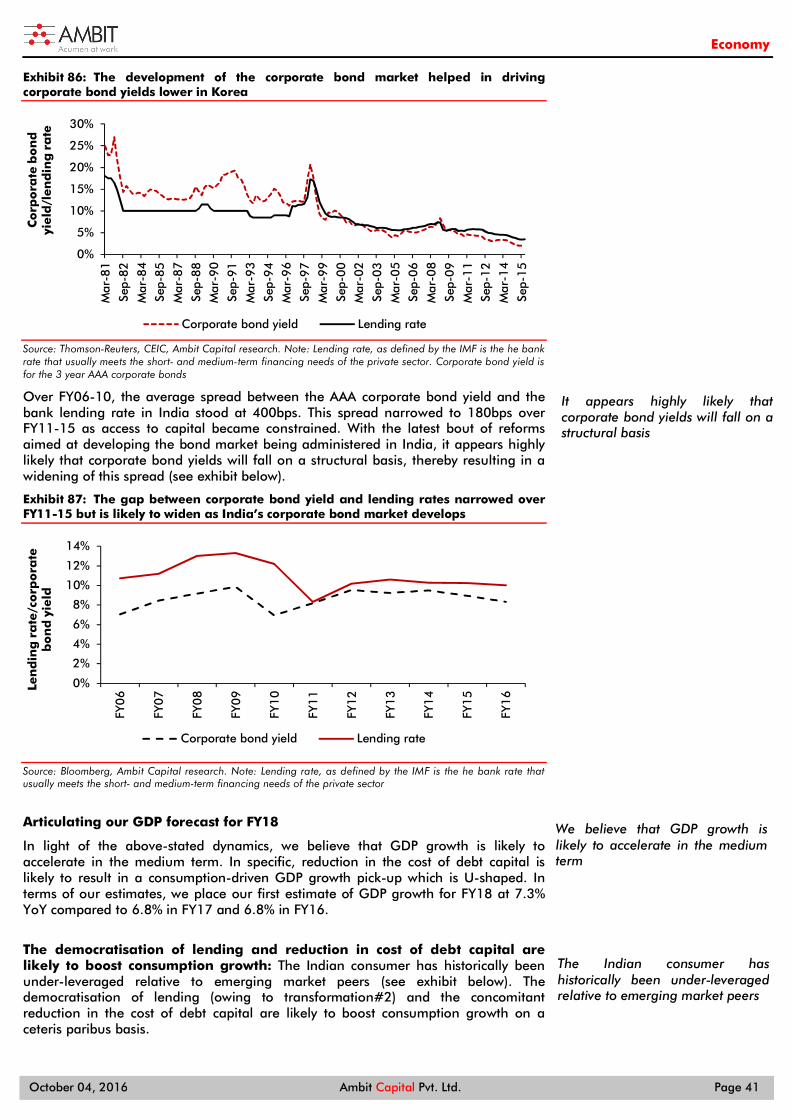
Economy
October 04, 2016 Ambit Capital Pvt. Ltd. Page 41
Exhibit 86: The development of the corporate bond market helped in driving corporate bond yields lower in Korea
Source: Thomson-Reuters, CEIC, Ambit Capital research. Note: Lending rate, as defined by the IMF is the he bank rate that usually meets the short- and medium-term financing needs of the private sector. Corporate bond yield is for the 3 year AAA corporate bonds
Over FY06-10, the average spread between the AAA corporate bond yield and the bank lending rate in India stood at 400bps. This spread narrowed to 180bps over FY11-15 as access to capital became constrained. With the latest bout of reforms aimed at developing the bond market being administered in India, it appears highly likely that corporate bond yields will fall on a structural basis, thereby resulting in a widening of this spread (see exhibit below).
Exhibit 87: The gap between corporate bond yield and lending rates narrowed over FY11-15 but is likely to widen as India’s corporate bond market develops
Source: Bloomberg, Ambit Capital research. Note: Lending rate, as defined by the IMF is the he bank rate that usually meets the short- and medium-term financing needs of the private sector
Articulating our GDP forecast for FY18
In light of the above-stated dynamics, we believe that GDP growth is likely to accelerate in the medium term. In specific, reduction in the cost of debt capital is likely to result in a consumption-driven GDP growth pick-up which is U-shaped. In terms of our estimates, we place our first estimate of GDP growth for FY18 at 7.3% YoY compared to 6.8% in FY17 and 6.8% in FY16.
The democratisation of lending and reduction in cost of debt capital are likely to boost consumption growth: The Indian consumer has historically been under-leveraged relative to emerging market peers (see exhibit below). The democratisation of lending (owing to transformation#2) and the concomitant reduction in the cost of debt capital are likely to boost consumption growth on a ceteris paribus basis.
0%
5%
10%
15%
20%
25%
30%
Mar
-81
Sep-
82
Mar
-84
Sep-
85
Mar
-87
Sep-
88
Mar
-90
Sep-
91
Mar
-93
Sep-
94
Mar
-96
Sep-
97
Mar
-99
Sep-
00
Mar
-02
Sep-
03
Mar
-05
Sep-
06
Mar
-08
Sep-
09
Mar
-11
Sep-
12
Mar
-14
Sep-
15
Co
rpo
rate
bo
nd
yi
eld
/len
din
g r
ate
Corporate bond yield Lending rate
0%
2%
4%
6%
8%
10%
12%
14%
FY0
6
FY0
7
FY0
8
FY0
9
FY1
0
FY1
1
FY1
2
FY1
3
FY1
4
FY1
5
FY1
6
Len
din
g r
ate
/co
rpo
rate
b
on
d y
ield
Corporate bond yield Lending rate
It appears highly likely that corporate bond yields will fall on a structural basis
We believe that GDP growth is likely to accelerate in the medium term
The Indian consumer has historically been under-leveraged relative to emerging market peers
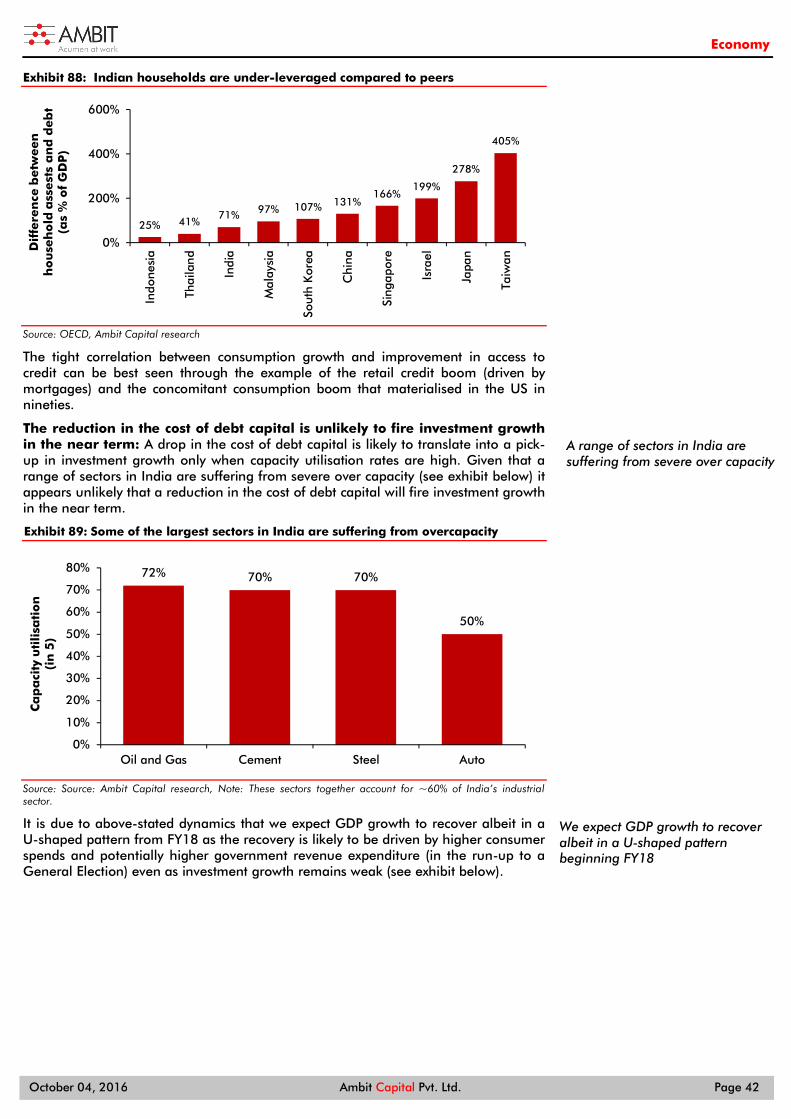
Economy
October 04, 2016 Ambit Capital Pvt. Ltd. Page 42
Exhibit 88: Indian households are under-leveraged compared to peers
Source: OECD, Ambit Capital research
The tight correlation between consumption growth and improvement in access to credit can be best seen through the example of the retail credit boom (driven by mortgages) and the concomitant consumption boom that materialised in the US in nineties.
The reduction in the cost of debt capital is unlikely to fire investment growth in the near term: A drop in the cost of debt capital is likely to translate into a pick-up in investment growth only when capacity utilisation rates are high. Given that a range of sectors in India are suffering from severe over capacity (see exhibit below) it appears unlikely that a reduction in the cost of debt capital will fire investment growth in the near term.
Exhibit 89: Some of the largest sectors in India are suffering from overcapacity
Source: Source: Ambit Capital research, Note: These sectors together account for ~60% of India’s industrial sector.
It is due to above-stated dynamics that we expect GDP growth to recover albeit in a U-shaped pattern from FY18 as the recovery is likely to be driven by higher consumer spends and potentially higher government revenue expenditure (in the run-up to a General Election) even as investment growth remains weak (see exhibit below).
25% 41%71% 97% 107% 131%
166%199%
278%
405%
0%
200%
400%
600%
Indo
nesi
a
Thai
lan
d
Indi
a
Mal
aysi
a
Sout
h K
orea
Chi
na
Sing
apor
e
Isra
el
Japa
n
Taiw
an
Dif
fere
nce
betw
een
h
ou
seh
old
ass
est
s a
nd
deb
t(a
s %
of
GD
P)
72% 70% 70%
50%
0%
10%
20%
30%
40%
50%
60%
70%
80%
Oil and Gas Cement Steel Auto
Ca
pa
city
uti
lisa
tio
n(i
n 5
)
A range of sectors in India are suffering from severe over capacity
We expect GDP growth to recover albeit in a U-shaped pattern beginning FY18
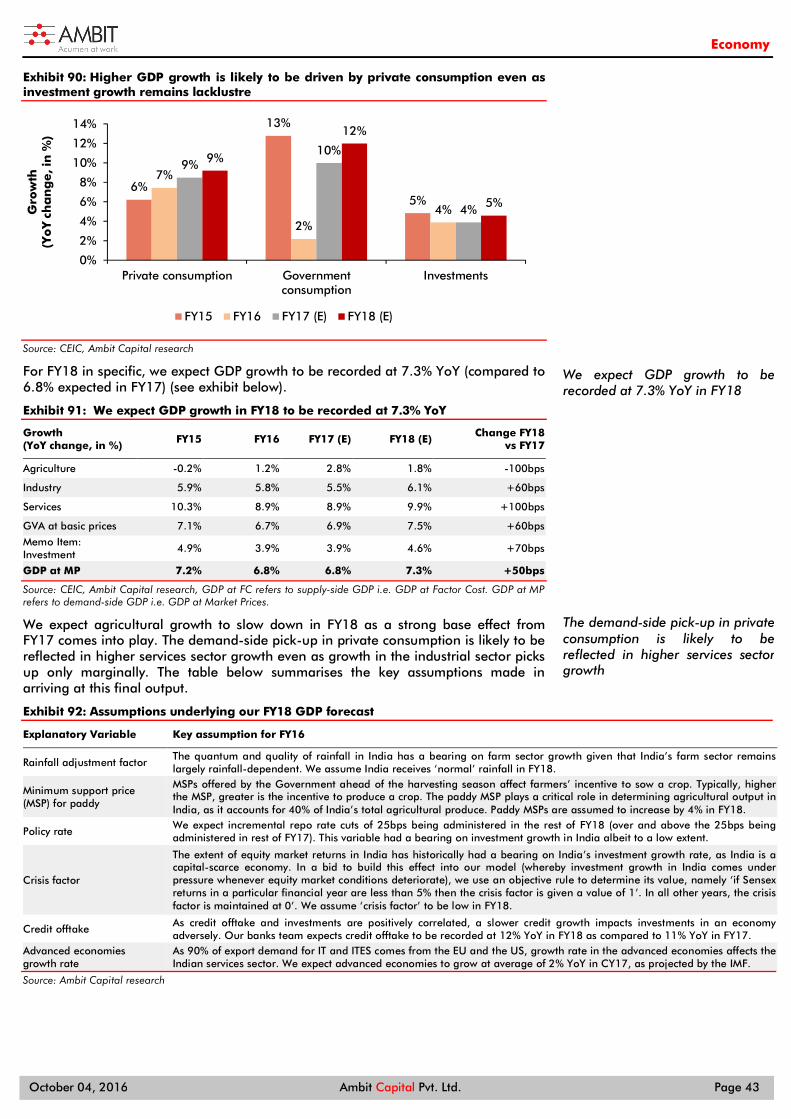
Economy
October 04, 2016 Ambit Capital Pvt. Ltd. Page 43
Exhibit 90: Higher GDP growth is likely to be driven by private consumption even as investment growth remains lacklustre
Source: CEIC, Ambit Capital research
For FY18 in specific, we expect GDP growth to be recorded at 7.3% YoY (compared to 6.8% expected in FY17) (see exhibit below).
Exhibit 91: We expect GDP growth in FY18 to be recorded at 7.3% YoY
Growth (YoY change, in %)
FY15
FY16
FY17 (E)
FY18 (E)
Change FY18 vs FY17
Agriculture -0.2% 1.2% 2.8% 1.8% -100bps
Industry 5.9% 5.8% 5.5% 6.1% +60bps
Services 10.3% 8.9% 8.9% 9.9% +100bps
GVA at basic prices 7.1% 6.7% 6.9% 7.5% +60bps
Memo Item: Investment
4.9% 3.9% 3.9% 4.6% +70bps
GDP at MP 7.2% 6.8% 6.8% 7.3% +50bps
Source: CEIC, Ambit Capital research, GDP at FC refers to supply-side GDP i.e. GDP at Factor Cost. GDP at MP refers to demand-side GDP i.e. GDP at Market Prices.
We expect agricultural growth to slow down in FY18 as a strong base effect from FY17 comes into play. The demand-side pick-up in private consumption is likely to be reflected in higher services sector growth even as growth in the industrial sector picks up only marginally. The table below summarises the key assumptions made in arriving at this final output.
Exhibit 92: Assumptions underlying our FY18 GDP forecast
Explanatory Variable Key assumption for FY16
Rainfall adjustment factor The quantum and quality of rainfall in India has a bearing on farm sector growth given that India’s farm sector remains largely rainfall-dependent. We assume India receives ‘normal’ rainfall in FY18.
Minimum support price (MSP) for paddy
MSPs offered by the Government ahead of the harvesting season affect farmers’ incentive to sow a crop. Typically, higher the MSP, greater is the incentive to produce a crop. The paddy MSP plays a critical role in determining agricultural output in India, as it accounts for 40% of India’s total agricultural produce. Paddy MSPs are assumed to increase by 4% in FY18.
Policy rate We expect incremental repo rate cuts of 25bps being administered in the rest of FY18 (over and above the 25bps being administered in rest of FY17). This variable had a bearing on investment growth in India albeit to a low extent.
Crisis factor
The extent of equity market returns in India has historically had a bearing on India’s investment growth rate, as India is a capital-scarce economy. In a bid to build this effect into our model (whereby investment growth in India comes under pressure whenever equity market conditions deteriorate), we use an objective rule to determine its value, namely ‘if Sensex returns in a particular financial year are less than 5% then the crisis factor is given a value of 1’. In all other years, the crisis factor is maintained at 0’. We assume ‘crisis factor’ to be low in FY18.
Credit offtake As credit offtake and investments are positively correlated, a slower credit growth impacts investments in an economy adversely. Our banks team expects credit offtake to be recorded at 12% YoY in FY18 as compared to 11% YoY in FY17.
Advanced economies growth rate
As 90% of export demand for IT and ITES comes from the EU and the US, growth rate in the advanced economies affects the Indian services sector. We expect advanced economies to grow at average of 2% YoY in CY17, as projected by the IMF.
Source: Ambit Capital research
6%
13%
5%
7%
2%4%
9%10%
4%
9%
12%
5%
0%
2%
4%
6%
8%
10%
12%
14%
Private consumption Governmentconsumption
Investments
Gro
wth
(Yo
Y c
ha
ng
e, i
n %
)
FY15 FY16 FY17 (E) FY18 (E)
We expect GDP growth to be recorded at 7.3% YoY in FY18
The demand-side pick-up in private consumption is likely to be reflected in higher services sector growth

Economy
October 04, 2016 Ambit Capital Pvt. Ltd. Page 44
Section 3: Investment Implications In light of the silent revolution in ‘access’ that has been triggered by M+R+T, we urge investors to BUY plays on enhanced consumption (Asian Paints, Havells and TTK Prestige and Trent), plays on a more competitive financial system (Axis Bank, Cholamandalam and City Union Bank) and plays on the improved transport network in India Ashok Leyland, Ashoka Buildcon and Sadhbhav infrastructure).
Exhibit 93: Stocks in focus Stock Ticker MCap (USD mn) Upside
Plays on enhanced consumption
Asian Paints APNT IN 17,198 3%
Havells HAVL IN 4,049 -4%
TTK Prestige TTKPT IN 938 6%
Trent TRENT IN 1,114 0%
Plays on a more competitive financial system
Axis Bank AXSB IN 19,761 9%
Cholamandalam CIFC IN 2,772 10%
City Union Bank CUBK IN 1,216 7%
Plays on an improved transport network
Ashok Leyland AL IN 3,554 23%
Sadbhav Infrastructure SINP IN 569 20%
Ashoka Buildcon ASBL IN 492 29%
Source: Bloomberg, Ambit Capital research
Refer to the section below for details.
Investment theme 1: Plays on enhanced consumption
As cost of capital falls along the lines described in the preceding sections, we are likely to see an upsurge in credit-funded consumption growth. Alongside that, as access to end-consumers improves for manufacturers, improved selling reach will also enhance consumption. Our top picks on this theme are:
Asian Paints (APNT IN, BUY, mkt cap in $17,198bn, 6m ADV $15.8 mn, 3% upside): Asian Paints’ strong foundation has been built by focusing on: a) hiring top quality talent; b) using technology proactively to improve operating efficiencies; c) empowering professionals and Independent Directors on the Board in strategic decision making; and d) establishing deep-rooted relationships with dealers. Over the next two decades, labour cost would increase to 85-90% of paint project cost (from ~65% now), resulting in emergence of: (a) DIY segment for economy paints; (b) highly value-added labour involvement for premium paints; (c) upgrade formats of dealer stores. Asian Paints is successfully implementing new initiatives to lead these evolutionary trends. Asian Paints is currently trading ~10% premium to the sector median PE. We believe this premium is justified due to the firm’s strong foundation and initiatives taken for the next phase of evolution in the industry. We expect the firm to deliver 18.4% revenue CAGR and 22.6% EPS CAGR over FY16-21 with ROCE improving from 33% to 36% over this period. Our DCF based TP of Rs1,230 implies 42x FY18E P/E. For more details (Click here) for our 19th Aug, 2016 note.
Havells (HAVL IN, BUY, mkt cap in $4049mn, 6m ADV $10.3mn): Havells is India’s largest light electricals company with 7% market share in overall light electricals category. It is the leader in the switchgear segment. It is also the third-largest player in cables & wires and fans and the fifth-largest in lighting. Given its premium brand and majority of revenues coming from premium products, Havells will benefit from upgrade in Indian consumers’ lifestyle. The company is also investing in next-generation, lifestyle products with automation in lighting and appliances. The company is strengthening its presence in premium consumer appliances by increasing SKUs, expanding distribution network and launching new products such as air purifiers and air coolers. Havells is trading at 31x FY18E P/E, at a meagre 4% premium to Crompton/V-Guard despite a diversified franchise, strong moats and pan-India franchise. Click here for our note dated 21 December 2015 for further details.
As cost of capital falls along the lines described in the preceding sections, we are likely to see an upsurge in credit-funded consumption growth

Economy
October 04, 2016 Ambit Capital Pvt. Ltd. Page 45
TTK Prestige (TTKPT IN, BUY, mkt cap in $938 mn, 6m ADV $0.6 mn, 6% upside): TTK Prestige has cemented its leadership in the kitchenware industry by (1) having a strong control on its distributor-based, pan-India channel expansion; (2) consistently investing in maintaining an aspirational brand recall; and (3) leveraging its dominance in pressure cookers to expand to cookware and appliances in the past 15 years. After the appointment of Sudeendra Koushik (from Phillips) as the head of product innovation two years ago, TTK delivered a strong pipeline of new products in its existing categories in FY16. The product innovation momentum is likely to continue over the next 5-10 years and is aimed at capitalising on: (a) lack of innovation in the pressure cooker and cookware segments in India; and (b) the potential to differentiate on product characteristics in appliances where most players import replicable products from China. With high operating leverage accorded by an increase in capacity utilisation at the Gujarat facility, we expect TTK Prestige to deliver 23% revenue CAGR and 40% EPS CAGR over FY16-19 with average ROCE of 23%. Our DCF-based TP of Rs5,660 implies 28x FY18E P/E.
Trent (TRENT IN, BUY, mkt cap in $1,114 mn, 6m ADV $0.7 mn, 0% upside): Trent will become one of India’s largest women’s wear and fast fashion companies (Rs20bn) in FY17E as it maximises its own brand portfolio and fast fashion brand under its JV with Inditex. Taking a cue from successful own brand global retailers which have predominantly been women-oriented, the company’s strategy of building women-centric products is paying off as it realises that the size of the women’s wardrobe is larger and diverse as it expands into underpenetrated regions. Also, supply chain built for design-to-product and balance sheet strength will help it penetrate deeper into the largely unorganised US$18bn women’s wear market. Current multiple of 21x FY18E EBITDA is not expensive as it doesn’t capture the long-term franchise (akin to what Madura built in men’s wear over FY05-16) that Westside is building in the US$18bn largely unorganised but evolving women’s wear market, turnaround of Star, and sustainability of the Zara JV. For more details click here for our note dated September 29, 2015.
Investment theme 2: Plays on a more competitive financial system
As the changes introduced by Rajan when he was the RBI Governor create a more competitive lending industry and as the PSU lenders slowly fade away, lenders with: (a) superior access to funding; and (b) the ability to lend profitably to Indian corporates and SMEs will benefit. Our top picks on this theme are:
Axis Bank: (AXSB IN, BUY, mkt cap US$19,761, 6m ADV US$84.4mn, 9%): Axis Bank’s track record as perhaps the best bond house traces its roots to its initial years when bankers with long track records in credit from the SBI group came together at UTI Bank (renamed Axis Bank in CY07). The smaller balance sheet of a start-up bank led to these experienced bankers to respond with an originate and syndicate model, which leveraged their deep understanding of credit and maximized commercial benefit in the form of fee income for a bank that could not have taken large exposures. Axis Bank has consistently topped league tables on debt syndication. With PSU banks likely to remain constrained on capital/profitability in funding Indian corporate capex, the government/regulator has been pushing to evolve the debt market in India to take the burden away from Indian banks. Data shows that the bond market has commanded ~37% market share in Indian corporate borrowing in the last two years. Axis Bank’s track record in DCM (debt capital markets) places it better than its peers to protect/gain market share in the changing dynamics towards bonds and away from bank credit. At 1.9x FY17E BV, Axis Bank trades at ~25% discount to its new private sector bank peers with average forecast RoE of 15.3% (FY17-18E) and EPS CAGR of 14% (FY17-18E). We value the bank at 2.2x FY18E BV, implying a TP of Rs620 (upside of 15%). For more details click here for our April 26, 2016 note.
Lenders with superior access to funding; and the ability to lend profitably to Indian corporates and SMEs will benefit
Economy
October 04, 2016 Ambit Capital Pvt. Ltd. Page 46
Cholamandalam: (CIFC IN, BUY, mkt cap in $2,772mn, 6m ADV $4.6mn, 10% upside): CIFC is well-positioned to register profitable and structural growth in LCV financing with its competitive strengths of lower origination costs, lower delinquencies and efficiencies of scale. Moreover, it should continue to gain market share in the used CV financing space due to its strength in collections and a captive customer base for cross-selling. That said, having delivered consistent 18% RoEs over FY13-16, Cholamandalam is now evolving from a highly cyclical auto NBFC to a diversified lender that could deliver 20% RoEs on a sustainable basis. This is underpinned by: i) deeper penetration of the home equity business; and ii) expansion of affordable housing finance business. Whilst current premium valuations of 12-month forward P/B of 3.5x and 12-month forward P/E of 20x adequately factor in a reasonable 30% EPS CAGR as its AUM growth and RoEs improve, scaling up of the housing financing business will be the next rerating catalyst. Our target price values the company at 12-month forward P/B of 4.3x and 12-month forward P/E of 23x for a stock that can surprise on earnings growth sustainability
City Union Bank (CUBK IN, BUY, mkt cap US$1,216mn, 6m ADV US$0.8mn, 7%): The strong performance of City Union Bank on cost to income ratio (FY16: 40%) is a function of both its strong income profile and tights control on costs. About 52% of its loan book accounts for granular high-yielding MSME/trade loans, which drive its industry-best loan yields of 12.8% (FY16). This, however, has not come at the cost of asset quality as its conservative lending practices (high collateralization) and relationship banking model have accorded it superior asset quality among peers (stressed loans largely unchanged at 3.5% in the last five years). A very high level of employee engagement – ESOPs and loyal staff base with a significant share being second and third generation employees and strong state and community identity connect – has helped the bank control costs without compromising productivity. With PSU banks in the bank’s home state Tamil Nadu under immense asset quality and capital pressure, there is market share waiting to be picked. However, so far, the bank has been selective about taking customers from struggling PSUs. This benign competitive situation reflects in the bank’s strong pricing power (NIM currently, at 4.1%). At 2x FY18E BV, City Union Bank trades at a 60% premium to old private sector bank peers but at a 15% discount to new private sector bank peers despite an equally strong long-term track record. With average forecast RoE of 16.6% (FY17-18E) and EPS CAGR of 21% (FY17-18E), we value the bank at 2.3x FY18E BV, implying a TP of Rs150 (upside of 14%). For more details click here for our June 19, 2015 note.
Investment theme 3: Plays on an improved transport network
As the Government improves India’s road and waterway network and as more powerful trucks becoming increasingly common on Indian highways, road transport will increasingly pull away from rail as the preferred way to move freight in India. Our top picks on this theme are:
Ashok Leyland (AL IN, BUY, mkt cap in $3,554mn, 6m ADV $18.7 mn, 23% upside): While we expect domestic MHCV industry volume growth to taper from 30% in FY16, it should still record a healthy 9% growth in FY17 (helped by pre-buying in 4QFY17 ahead of BSIV norms becoming mandatory across India w.e.f. 1 April 2017) and 10% in FY18 (driven by favorable macros). AL continues to perform well on market share in domestic MHCV goods, with a gain of 790bps over FY15-16 and a further 30bps YoY in April-August 2016. We expect AL to largely maintain its market share due to opportunity to gain share in the non-south market (currently 21%), which should offset the threat from newer players like Volvo Eicher and Bharat Benz. Given its leadership in South India (market share of ~51% in domestic MHCV goods segment), it would benefit from faster economic growth in the region. Overall, we expect Ashok Leyland to deliver 9% CAGR in volumes over FY16-18. The company continues to deleverage its balance sheet with net debt declining substantially to Rs11bn (net-debt:equity at 0.2x) as of FY16-end from Rs26.0bn as of FY15-end. The core standalone business currently trades at 8.1x FY18E EBITDA.
Road transport will increasingly pull away from rail as the preferred way to move freight in India.

Economy
October 04, 2016 Ambit Capital Pvt. Ltd. Page 47
Ashoka Buildcon ASBL IN, BUY, mkt cap in $492mn, 6m ADV $1.1 mn, 29% upside): Ashoka Buildcon stands out as the best on our ranking of road developers due to its strong EPC franchise as also efficient capital allocation and cash management. It has maintained sanity in road construction through: (a) consortium bidding in large projects, followed by a strategic partnership with SBI-Macquarie; and (b) financial discipline in the form of low leverage in the construction business. Upsides in Ashoka’s valuations will be driven by: (1) improving execution momentum in the EPC business (12% revenue CAGR; FY16-18E vs -2% in FY16) given strong order book and waning land issues; (2) better cash generation as working capital in standalone reduces and BOT projects become cash generative; and (3) limited equity needs, barring Rs3.5bn-4bn for new assets, that will lower leverage. ASBL is amongst the better placed contractors to weather any EPC order award decline given strong order book and headroom to invest equity. Also, low leverage (standalone net debt/equity at 0.1x) makes valuations of 7x FY18E core EPS for the construction business (excluding embedded value of Rs113) compelling. For more details click here for our Sep-16 note.
Sadbhav Infrastructure (SINP IN, BUY, mkt cap in $569mn, 6m ADV $0.3 mn, 20% upside): Sadbhav is the only pure-play listed BOT player with a largely operational portfolio of assets created with sensible bidding. The entire portfolio, except the recently won HAM projects, will be operational by FY17E. This should result in cash surplus (EBITDA less interest) from FY17E and limit further equity requirements. We expect an EBITDA CAGR of 70% over FY16E-FY18E for the asset portfolio but only a 26% CAGR for interest costs. This will also provide growth capital and enable the company to further reduce interest cost. The company is valued at 1.1x restated equity, an inexpensive multiple for a company with a project IRR of 15.4% on its assets. Our NAV-based valuation of Rs127 implies a multiple of 1.5x restated equity.

Economy
October 04, 2016 Ambit Capital Pvt. Ltd. Page 48
Institutional Equities Team Saurabh Mukherjea, CFA CEO, Institutional Equities (022) 30433174 [email protected]
Research Analysts
Name Industry Sectors Desk-Phone E-mail
Nitin Bhasin - Head of Research E&C / Infra / Cement / Industrials (022) 30433241 [email protected]
Aadesh Mehta, CFA Banking / Financial Services (022) 30433239 [email protected]
Abhishek Ranganathan, CFA Retail (022) 30433085 [email protected]
Achint Bhagat, CFA Cement / Home Building (022) 30433178 [email protected]
Anuj Bansal Mid-caps (022) 30433122 [email protected]
Aditi Singh Economy / Strategy (022) 30433284 [email protected] Ashvin Shetty, CFA Automobile (022) 30433285 [email protected]
Bhargav Buddhadev Power Utilities / Capital Goods (022) 30433252 [email protected]
Deepesh Agarwal, CFA Power Utilities / Capital Goods (022) 30433275 [email protected]
Dhiraj Mistry, CFA Consumer (022) 30433264 [email protected]
Gaurav Khandelwal, CFA Automobile (022) 30433132 [email protected] Girisha Saraf Mid-caps / Small-caps (022) 30433211 [email protected]
Karan Khanna, CFA Strategy (022) 30433251 [email protected]
Pankaj Agarwal, CFA Banking / Financial Services (022) 30433206 [email protected]
Paresh Dave, CFA Healthcare (022) 30433212 [email protected]
Parita Ashar, CFA Metals & Mining / Aviation (022) 30433223 [email protected]
Prashant Mittal, CFA Strategy / Derivatives (022) 30433218 [email protected]
Rahil Shah Banking / Financial Services (022) 30433217 [email protected]
Rakshit Ranjan, CFA Consumer (022) 30433201 [email protected]
Ravi Singh Banking / Financial Services (022) 30433181 [email protected]
Ritesh Gupta, CFA Oil & Gas / Chemicals / Agri Inputs (022) 30433242 [email protected]
Ritesh Vaidya, CFA Consumer (022) 30433246 [email protected]
Ritika Mankar Mukherjee, CFA Economy / Strategy (022) 30433175 [email protected]
Ritu Modi Automobile (022) 30433292 [email protected]
Sagar Rastogi Technology (022) 30433291 [email protected]
Sudheer Guntupalli Technology (022) 30433203 [email protected]
Sumit Shekhar Economy / Strategy (022) 30433229 [email protected]
Utsav Mehta, CFA E&C / Industrials (022) 30433209 [email protected]
Vivekanand Subbaraman, CFA Media (022) 30433261 [email protected]
Sales
Name Regions Desk-Phone E-mail
Sarojini Ramachandran - Head of Sales UK +44 (0) 20 7886 2740 [email protected]
Dharmen Shah India / Asia (022) 30433289 [email protected]
Dipti Mehta India / USA (022) 30433053 [email protected]
Hitakshi Mehra India (022) 30433204 [email protected]
Krishnan V India / Asia (022) 30433295 [email protected]
Nityam Shah, CFA USA / Europe (022) 30433259 [email protected] Parees Purohit, CFA UK / USA (022) 30433169 [email protected]
Praveena Pattabiraman India / Asia (022) 30433268 [email protected]
Shaleen Silori India (022) 30433256 [email protected]
Vishal Mehta India / Asia (022) 30433198 [email protected]
Singapore
Pramod Gubbi, CFA – Director Singapore +65 8606 6476 [email protected]
Shashank Abhisheik Singapore +65 6536 1935 [email protected]
USA / Canada
Ravilochan Pola - CEO Americas +1(646) 361 3107 [email protected]
Production
Sajid Merchant Production (022) 30433247 [email protected]
Sharoz G Hussain Production (022) 30433183 [email protected]
Jestin George Editor (022) 30433272 [email protected]
Nikhil Pillai Database (022) 30433265 [email protected]

Economy
October 04, 2016 Ambit Capital Pvt. Ltd. Page 49
Explanation of Investment Rating
Investment Rating Expected return (over 12-month)
BUY >10%
SELL <10%
NO STANCE We have forward looking estimates for the stock but we refrain from assigning valuation and recommendation
UNDER REVIEW We will revisit our recommendation, valuation and estimates on the stock following recent events
NOT RATED We do not have any forward looking estimates, valuation or recommendation for the stock POSITIVE We have a positive view on the sector and most of stocks under our coverage in the sector are BUYs
NEGATIVE We have a negative view on the sector and most of stocks under our coverage in the sector are SELLs
Disclaimer This report or any portion hereof may not be reprinted, sold or redistributed without the written consent of Ambit Capital. AMBIT Capital Research is disseminated and available primarily electronically, and, in some cases, in printed form.
Additional information on recommended securities is available on request.
Disclaimer
1. AMBIT Capital Private Limited (“AMBIT Capital”) and its affiliates are a full service, integrated investment banking, investment advisory and brokerage group. AMBIT Capital is a Stock Broker, Portfolio Manager and Depository Participant registered with Securities and Exchange Board of India Limited (SEBI) and is regulated by SEBI
2. AMBIT Capital makes best endeavours to ensure that the research analyst(s) use current, reliable, comprehensive information and obtain such information from sources which the analyst(s) believes to be reliable. However, such information has not been independently verified by AMBIT Capital and/or the analyst(s) and no representation or warranty, express or implied, is made as to the accuracy or completeness of any information obtained from third parties. The information, opinions, views expressed in this Research Report are those of the research analyst as at the date of this Research Report which are subject to change and do not represent to be an authority on the subject. AMBIT Capital may or may not subscribe to any and/ or all the views expressed herein.
3. This Research Report should be read and relied upon at the sole discretion and risk of the recipient. If you are dissatisfied with the contents of this complimentary Research Report or with the terms of this Disclaimer, your sole and exclusive remedy is to stop using this Research Report and AMBIT Capital or its affiliates shall not be responsible and/ or liable for any direct/consequential loss howsoever directly or indirectly, from any use of this Research Report.
4. If this Research Report is received by any client of AMBIT Capital or its affiliate, the relationship of AMBIT Capital/its affiliate with such client will continue to be governed by the terms and conditions in place between AMBIT Capital/ such affiliate and the client.
5. This Research Report is issued for information only and the 'Buy', 'Sell', or ‘Other Recommendation’ made in this Research Report such should not be construed as an investment advice to any recipient to acquire, subscribe, purchase, sell, dispose of, retain any securities and should not be intended or treated as a substitute for necessary review or validation or any professional advice. Recipients should consider this Research Report as only a single factor in making any investment decisions. This Research Report is not an offer to sell or the solicitation of an offer to purchase or subscribe for any investment or as an official endorsement of any investment.
6. This Research Report is being supplied to you solely for your information and may not be reproduced, redistributed or passed on, directly or indirectly, to any other person or published, copied in whole or in part, for any purpose. Neither this Research Report nor any copy of it may be taken or transmitted or distributed, directly or indirectly within India or into any other country including United States (to US Persons), Canada or Japan or to any resident thereof. The distribution of this Research Report in other jurisdictions may be strictly restricted and/ or prohibited by law or contract, and persons into whose possession this Research Report comes should inform themselves about such restriction and/ or prohibition, and observe any such restrictions and/ or prohibition.
7. Ambit Capital Private Limited is registered as a Research Entity under the SEBI (Research Analysts) Regulations, 2014. SEBI Reg.No.- INH000000313.
Conflict of Interests
8. In the normal course of AMBIT Capital’s business circumstances may arise that could result in the interests of AMBIT Capital conflicting with the interests of clients or one client’s interests conflicting with the interest of another client. AMBIT Capital makes best efforts to ensure that conflicts are identified and managed and that clients’ interests are protected. AMBIT Capital has policies and procedures in place to control the flow and use of non-public, price sensitive information and employees’ personal account trading. Where appropriate and reasonably achievable, AMBIT Capital segregates the activities of staff working in areas where conflicts of interest may arise. However, clients/potential clients of AMBIT Capital should be aware of these possible conflicts of interests and should make informed decisions in relation to AMBIT Capital’s services.
9. AMBIT Capital and/or its affiliates may from time to time have or solicit investment banking, investment advisory and other business relationships with companies covered in this Research Report and may receive compensation for the same.
Additional Disclaimer for U.S. Persons
10. The research report is solely a product of AMBIT Capital
11. AMBIT Capital is the employer of the research analyst(s) who has prepared the research report
12. Any subsequent transactions in securities discussed in the research reports should be effected through Enclave Capital LLC. (“Enclave”).
13. Enclave does not accept or receive any compensation of any kind for the dissemination of the AMBIT Capital research reports.
14. The research analyst(s) preparing the email / Research Report/ attachment is resident outside the United States and is/are not associated persons of any U.S. regulated broker-dealer and that therefore the analyst(s) is/are not subject to supervision by a U.S. broker-dealer, and is/are not required to satisfy the regulatory licensing requirements of FINRA or required to otherwise comply with U.S. rules or regulations regarding, among other things, communications with a subject company, public appearances and trading securities held by a research analyst account.
15. This report is prepared, approved, published and distributed by the Ambit Capital located outside of the United States (a non-US Group Company”). This report is distributed in the U.S.by Enclave Capital LLC, a U.S. registered broker dealer, on behalf of Ambit Capital only to major U.S. institutional investors (as defined in Rule 15a-6 under the U.S. Securities Exchange Act of 1934 (the “Exchange Act”)) pursuant to the exemption in Rule 15a-6 and any transaction effected by a U.S. customer in the securities described in this report must be effected through Enclave Capital LLC (19 West 44th Street, suite 1700, New York, NY 10036). In order to receive any additional information about or to effect a transaction in any security or financial instrument mentioned herein, please contact a registered representative of Enclave Capital LLC., by phone at 646 361 3107.
16. As of the publication of this report Enclave Capital LLC, does not make a market in the subject securities.
17. This document does not constitute an offer of, or an invitation by or on behalf of Ambit Capital or its affiliates or any other company to any person, to buy or sell any security. The information contained herein has been obtained from published information and other sources, which Ambit Capital or its Affiliates consider to be reliable. None of Ambit Capital accepts any liability or responsibility whatsoever for the accuracy or completeness of any such information. All estimates, expressions of opinion and other subjective judgments contained herein are made as of the date of this document. Emerging securities markets may be subject to risks significantly higher than more established markets. In particular, the political and economic environment, company practices and market prices and volumes may be subject to significant variations. The ability to assess such risks may also be limited due to significantly lower information quantity and quality. By accepting this document, you agree to be bound by all the foregoing provisions.
Additional Disclaimer for Canadian Persons
18. AMBIT Capital is not registered in the Province of Ontario and /or Province of Québec to trade in securities and/or to provide advice with respect to securities.
19. AMBIT Capital's head office or principal place of business is located in India.
20. All or substantially all of AMBIT Capital's assets may be situated outside of Canada.
21. It may be difficult for enforcing legal rights against AMBIT Capital because of the above.
22. Name and address of AMBIT Capital's agent for service of process in the Province of Ontario is: Torys LLP, 79 Wellington St. W., 30th Floor, Box 270, TD South Tower, Toronto, Ontario M5K 1N2 Canada.
23. Name and address of AMBIT Capital's agent for service of process in the Province of Montréal is Torys Law Firm LLP, 1 Place Ville Marie, Suite 1919 Montréal, Québec H3B 2C3 Canada.
Additional Disclaimer for Singapore Persons
24. This Report is prepared and distributed by Ambit Capital Private Limited and distributed as per the approved arrangement under Paragraph 9 of Third Schedule of Securities and Futures Act (CAP 289) and Paragraph 11 of the First Schedule to the Financial Advisors Act (CAP 110) provided to Ambit Singapore Pte. Limited by Monetary Authority of Singapore.
25. This Report is only available to persons in Singapore who are institutional investors (as defined in section 4A of the Securities and Futures Act (Cap. 289) of Singapore (the “SFA”).” Accordingly, if a Singapore Person is not or ceases to be such an institutional investor, such Singapore Person must immediately discontinue any use of this Report and inform Ambit Singapore Pte. Limited.

Economy
October 04, 2016 Ambit Capital Pvt. Ltd. Page 50
Additional Disclaimer for UK Persons
26. All of the recommendations and views about the securities and companies in this report accurately reflect the personal views of the research analyst named on the cover. No part of this research analyst’s compensation was, is, or will be directly or indirectly related to the specific recommendations or views expressed by the research analyst in this research report. This report may not be reproduced, redistributed or copied in whole or in part for any purpose.
27. This report is a marketing communication and has been prepared by Ambit Capital Pvt Ltd of Mumbai, India (“Ambit”) and has been approved in the UK by Ambit Capital (UK) Limited (“ACUK”) solely for the purposes of section 21 of the Financial Services and Markets Act 2000. Ambit is regulated by the Securities and Exchange Board of India and is registered as a Research Entity under the SEBI (Research Analysts) Regulations, 2014. ACUK is regulated by the UK Financial Services Authority and has registered office at C/o Panmure Gordon & Co PL, One New Change, London, EC4M9AF.
28. In the UK, this report is directed at and is for distribution only to persons who (i) fall within Article 19(1) (persons who have professional experience in matters relating to investments) or Article 49(2)(a) to (d) (high net worth companies, unincorporated associations etc) of the Financial Services and Markets Act 2000 (Financial Promotions) Order 2005 (as amended) or (ii) are professional customers or eligible counterparties of ACUK (all such persons together being referred to as "relevant persons"). This report must not be acted on or relied upon by persons in the UK who are not relevant persons.
29. Neither Ambit nor ACUK is a US registered broker-dealer. Transactions undertaken in the US in any security mentioned herein must be effected through a US-registered broker-dealer, in conformity with SEC Rule 15a-6.
30. Neither this report nor any copy or part thereof may be distributed in any other jurisdictions where its distribution may be restricted by law and persons into whose possession this report comes should inform themselves about, and observe, any such restrictions. Distribution of this report in any such other jurisdictions may constitute a violation of UK or US securities laws, or the law of any such other jurisdictions.
31. This report does not constitute an offer or solicitation to buy or sell any securities referred to herein. It should not be so construed, nor should it or any part of it form the basis of, or be relied on in connection with, any contract or commitment whatsoever. The information in this report, or on which this report is based, has been obtained from publicly available sources that Ambit believes to be reliable and accurate. However, it has not been prepared in accordance with legal requirements designed to promote the independence of investment research. It has also not been independently verified and no representation or warranty, express or implied, is made as to the accuracy or completeness of any information obtained from third parties.
32. The information or opinions are provided as at the date of this report and are subject to change without notice. The information and opinions provided in this report take no account of the investors’ individual circumstances and should not be taken as specific advice on the merits of any investment decision. Investors should consider this report as only a single factor in making any investment decisions. Further information is available upon request. No member or employee of Ambit or ACUK accepts any liability whatsoever for any direct or consequential loss howsoever arising, directly or indirectly, from any use of this report or its contents.
33. The value of any investment made at your discretion based on this Report, or income therefrom, maybe affected by changes in economic, financial and/or political factors and may go down as well as go up and you may not get back the original amount invested. Some securities and/or investments involve substantial risk and are not suitable for all investors.
34. Ambit and its affiliates and their respective officers directors and employees may hold positions in any securities mentioned in this Report (or in any related investment) and may from time to time add to or dispose of any such securities (or investment). Ambit and ACUK may from time to time render advisory and other services to companies referred to in this Report and may receive compensation for the same.
35. Ambit and its affiliates may act as a market maker or risk arbitrator or liquidity provider or may have assumed an underwriting commitment in the securities of companies discussed in this Report (or in related investments) or may sell them or buy them from clients on a principal to principal basis or may be involved in proprietary trading and may also perform or seek to perform investment banking or underwriting services for or relating to those companies.
36. Ambit and ACUK may sell or buy any securities or make any investment which may be contrary to or inconsistent with this Report and are not subject to any prohibition on dealing. By accepting this report you agree to be bound by the foregoing limitations. In the normal course of Ambit and its affiliates’ business, circumstances may arise that could result in the interests of Ambit conflicting with the interests of clients or one client’s interests conflicting with the interest of another client. Ambit makes best efforts to ensure that conflicts are identified, managed and clients’ interests are protected. However, clients/potential clients of Ambit should be aware of these possible conflicts of interests and should make informed decisions in relation to Ambit services.
Disclosures
37. The analyst (s) has/have not served as an officer, director or employee of the subject company.
38. There is no material disciplinary action that has been taken by any regulatory authority impacting equity research analysis activities. 39. All market data included in this report are dated as at the previous stock market closing day from the date of this report.
Analyst Certification
Each of the analysts identified in this report certifies, with respect to the companies or securities that the individual analyses, that (1) the views expressed in this report reflect his or her personal views about all of the subject companies and securities and (2) no part of his or her compensation was, is or will be directly or indirectly dependent on the specific recommendations or views expressed in this report. © Copyright 2015 AMBIT Capital Private Limited. All rights reserved.
Ambit Capital Pvt. Ltd. Ambit House, 3rd Floor. 449, Senapati Bapat Marg, Lower Parel, Mumbai 400 013, India. Phone: +91-22-3043 3000 | Fax: +91-22-3043 3100 CIN: U74140MH1997PTC107598 www.ambitcapital.com