economy of indiabinet-repository.weebly.com/uploads/2/1/0/0/21005390/...most overland trade was...
TRANSCRIPT

Economy of India 1
Economy of India
Economy of India
Mumbai, The entertainment, fashion, and commercial centre of India
Rank 10th (nominal) / 3rd (PPP)
Currency 1 (INR) ( ) = 100 Paise
Fiscal year 1 April – 31 March
Trade organizations WTO, SAFTA, G-20 and others
Statistics
GDP $1.824 trillion (nominal) 10th; 2012)[]
$4.684 trillion (PPP: 3rd; 2012)[]
GDP growth 6.5% (2012 est)
GDP per capita $1,491 (nominal: 141th; 2012)[]
$3,829 (PPP: 130th; 2012)[]
GDP by sector agriculture: 17.2%, industry: 26.4%, services: 56.4% (2011 est.)
Inflation (CPI) CPI: 9.31%, WPI: 4.7% (April 2013)
Populationbelow poverty line
29.8% (2010)
Gini coefficient 36.8 (List of countries)
Labour force 498.4 million (2012 est.)
Labour forceby occupation
agriculture: 53%, industry: 19%, services: 28% (2011 est.)
Unemployment 3.8% (2011 est.)[]
Average gross salary $1,410 yearly (2011)[]
Main industries textiles, chemicals, food processing, steel, transportation equipment, cement, mining, petroleum, machinery,software, pharmaceuticals
Ease of Doing BusinessRank
132nd[] (2012)
External
Exports $142 billion (2012 est.) [1]

Economy of India 2
Export goods petroleum products, precious stones, machinery, iron and steel, chemicals, vehicles, apparel
Main export partners United Arab Emirates 12.7% United States 10.8% China 6.2% Singapore 5.3% Hong Kong 4.1% (2011 est.)[2]
Imports $235 billion (2012 est.) [3]
Import goods crude oil, raw precious stones, machinery, fertilizer, iron and steel, chemicals
Main import partners China 11.9% United Arab Emirates 7.7%
Switzerland 6.8% Saudi Arabia 6.1% United States 4.9% (2011 est.)[4]
FDI stock $47 billion (2011–12)[5]
Gross external debt $299.2 billion (31 December 2012)
Public finances
Public debt 67.59% of GDP (2012 est.)[6]
Budget deficit 5.2% of GDP (2011–12)
Revenues $171.5 billion billion (2012 est.)
Expenses $281 billion billion (2012 est.)
Economic aid $2.107 billion (2008)[7]
Credit rating BBB- (Domestic)BBB- (Foreign)BBB+ (T&C Assessment)Outlook: Stable(Standard & Poor's)[8]
Foreign reserves $295.29 billion (October 2012)[9]
Main data source: CIA World Fact Book [10]
All values, unless otherwise stated, are in US dollars
The economy of India is the ninth-largest in the world by nominal GDP and the third-largest by purchasing powerparity (PPP).[] The country is one of the G-20 major economies and a member of BRICS. On a per-capita-incomebasis, India ranked 141st by nominal GDP and 130th by GDP (PPP) in 2012, according to the IMF.[11] India is the19th-largest exporter and the 10th-largest importer in the world. Economic growth rate slowed to around 5.0% forthe 2012–13 fiscal year compared with 6.2% in the previous fiscal.[12] It is to be noted that India's GDP grew by anastounding 9.3% in 2010–11. Thus, the growth rate has nearly halved in just three years. GDP growth went upmarginally to 4.8% during the quarter through March 2013, from about 4.7% in the previous quarter. Thegovernment has forecasted a growth of 6.1%-6.7% for the year 2013-14, whilst the RBI expects the same to be at5.7%.The independence-era Indian economy (from 1947 to 1991) was based on a mixed economy combining features ofcapitalism and socialism, resulting in an inward-looking, interventionist policies and import-substituting economythat failed to take advantage of the post-war expansion of trade.[13] This model contributed to widespreadinefficiencies and corruption, and the failings of this system were due largely to its poor implementation.[13]

Economy of India 3
In 1991, India adopted liberal and free-market principles and liberalized its economy to international trade under theguidance of P.V. Narasimha Rao, prime minister from 1991 to 1996, who had eliminated License Raj, a pre- andpost-British era mechanism of strict government controls on setting up new industry. Following these majoreconomic reforms, and a strong focus on developing national infrastructure such as the Golden Quadrilateral projectby Atal Bihari vajpayee, prime minister, the country's economic growth progressed at a rapid pace, with relativelylarge increases in per-capita incomes.[]
OverviewThe combination of protectionist, import-substitution, and Fabian social democractic-inspired policies governedIndia for sometime after the end of British occupation. The economy was then characterised by extensive regulation,protectionism, public ownership of large monopolies, pervasive corruption and slow growth.[][14] Since 1991,continuing economic liberalisation has moved the country towards a market-based economy.[][14] By 2008, India hadestablished itself as one of the world's fastest growing economies. Growth significantly slowed to 6.8% in 2008–09,but subsequently recovered to 7.4% in 2009–10, while the fiscal deficit rose from 5.9% to a high 6.5% during thesame period.[15] India's current account deficit surged to 4.1% of GDP during Q2 FY11 against 3.2% the previousquarter. The unemployment rate for 2010–11, according to the state Labour Bureau, was 9.8% nationwide.[] As of2011, India's public debt stood at 68.05% of GDP which is highest among the emerging economies.[16] However,inflation remains stubbornly high with 7.55% in August 2012, the highest amotrade (counting exports and imports)stands at $606.7 billion[] and is currently the 9th largest in the world. During 2011–12, India's foreign trade grew byan impressive 30.6% to reach $792.3 billion (Exports-38.33% & Imports-61.67%).
History
Pre-colonial period (up to 1773)The citizens of the Indus Valley civilisation, a permanent settlement that flourished between 2800 BC and 1800 BC,practiced agriculture, domesticated animals, used uniform weights and measures, made tools and weapons, andtraded with other cities. Evidence of well-planned streets, a drainage system and water supply reveals theirknowledge of urban planning, which included the world's first urban sanitation systems and the existence of a formof municipal government.[]
The spice trade between India and Europe wasthe main catalyst for the Age of Discovery.[17]
Maritime trade was carried out extensively between South India andsoutheast and West Asia from early times until around the fourteenthcentury AD. Both the Malabar and Coromandel Coasts were the sitesof important trading centres from as early as the first century BC, usedfor import and export as well as transit points between theMediterranean region and southeast Asia.[18] Over time, tradersorganised themselves into associations which received state patronage.Raychaudhuri and Habib claim this state patronage for overseas tradecame to an end by the thirteenth century AD, when it was largely takenover by the local Parsi, Jewish and Muslim communities, initially onthe Malabar and subsequently on the Coromandel coast.[19]

Economy of India 4
Atashgah is a temple built by Indiantraders before 1745. The temple iswest of Caspian Sea, between West
Asia and Eastern Europe. Theinscription shown is in Sanskrit
(above) and Persian.
Other scholars suggest trading from India to West Asia and Eastern Europe wasactive between 14th and 18th century.[][][] During this period, Indian traders hadsettled in Surakhani, a suburb of greater Baku, Azerbaijan. These traders hadbuilt a Hindu temple, now preserved by the government of Azerbaijan. FrenchJesuit Villotte, who lived in Azerbaijan in late 1600s, wrote this Indian templewas revered by Hindus;[20] the temple has numerous carvings in Sanskrit orPunjabi, dated to be between 1500 and 1745 AD. The Atashgah temple built bythe Baku-resident traders from India suggests commerce was active andprosperous for Indians by the 17th century.[][][][]
Further north, the Saurashtra and Bengal coasts played an important role inmaritime trade, and the Gangetic plains and the Indus valley housed severalcentres of river-borne commerce. Most overland trade was carried out via theKhyber Pass connecting the Punjab region with Afghanistan and onward to theMiddle East and Central Asia.[21] Although many kingdoms and rulers issuedcoins, barter was prevalent. Villages paid a portion of their agricultural produce
as revenue to the rulers, while their craftsmen received a part of the crops at harvest time for their services.[]
Silver coin of the Maurya Empire, 3rd century BC.
Silver coin of the Gupta dynasty, 5th century AD.Sean Harkin estimates China and India may have accounted for 60 to 70 percent of world GDP in the 17thcentury.[22]
Assessment of India's pre-colonial economy is mostly qualitative, owing to the lack of quantitative information. TheMughal economy functioned on an elaborate system of coined currency, land revenue and trade. Gold, silver andcopper coins were issued by the royal mints which functioned on the basis of free coinage.[23] The political stabilityand uniform revenue policy resulting from a centralised administration under the Mughals, coupled with awell-developed internal trade network, ensured that India, before the arrival of the British, was to a large extenteconomically unified, despite having a traditional agrarian economy characterised by a predominance of subsistenceagriculture dependent on primitive technology.[24] After the decline of the Mughals, western, central and parts ofsouth and north India were integrated and administered by the Maratha Empire. After the loss at the Third Battle ofPanipat, the Maratha Empire disintegrated into several confederate states, and the resulting political instability andarmed conflict severely affected economic life in several parts of the country, although this was compensated for tosome extent by localised prosperity in the new provincial kingdoms.[25] By the end of the eighteenth century, theBritish East India Company entered the Indian political theatre and established its dominance over other Europeanpowers. This marked a determinative shift in India's trade, and a less powerful impact on the rest of the economy.[26]

Economy of India 5
Colonial period (1773–1947)
An aerial view of Calcutta Port taken in 1945.Calcutta, which was the economic hub of British
India, saw increased industrial activity duringWorld War II.
There is no doubt that our grievances against the British Empirehad a sound basis. As the painstaking statistical work of theCambridge historian Angus Maddison has shown, India's shareof world income collapsed from 22.6% in 1700, almost equal toEurope's share of 23.3% at that time, to as low as 3.8% in 1952.Indeed, at the beginning of the 20th century, "the brightest jewelin the British Crown" was the poorest country in the world interms of per capita income.
— Manmohan Singh[]
"I have travelled across the length and breadth of India and I have notseen one person who is a beggar, who is a thief. Such wealth I haveseen in this country, such high moral values, people of such calibre,that I do not think we would ever conquer this country, unless webreak the very backbone of this nation, which is her spiritual and cultural heritage, and, therefore, I propose that wereplace her old and ancient education system, her culture, for if the Indians think that all that is foreign and English isgood and greater than their own, they will lose their self-esteem, their native culture and they will become what wewant them, a truly dominated nation." | Lord T. B. Macaulay's address to British Parliament, dated the 2nd February1835.
Company rule in India brought a major change in the taxation and agricultural policies, which tended to promotecommercialisation of agriculture with a focus on trade, resulting in decreased production of food crops, massimpoverishment and destitution of farmers, and in the short term, led to numerous famines.[27] The economicpolicies of the British Raj caused a severe decline in the handicrafts and handloom sectors, due to reduced demandand dipping employment.[28] After the removal of international restrictions by the Charter of 1813, Indian tradeexpanded substantially and over the long term showed an upward trend.[29] The result was a significant transfer ofcapital from India to England, which, due to the colonial policies of the British, led to a massive drain of revenuerather than any systematic effort at modernisation of the domestic economy.[30]
Estimates of the per capita income of India(1857–1900) as per 1948–49 prices.[]
India's colonisation by the British created an institutional environmentthat, on paper, guaranteed property rights among the colonisers,encouraged free trade, and created a single currency with fixedexchange rates, standardised weights and measures and capitalmarkets. It also established a well-developed system of railways andtelegraphs, a civil service that aimed to be free from politicalinterference, a common-law and an adversarial legal system.[31] Thiscoincided with major changes in the world economy –industrialisation, and significant growth in production and trade.
However, at the end of colonial rule, India inherited an economy that was one of the poorest in the developingworld,[] with industrial development stalled, agriculture unable to feed a rapidly growing population, a largelyilliterate and unskilled labour force, and extremely inadequate infrastructure.[]
The 1872 census revealed that 91.3% of the population of the region constituting present-day India resided invillages,[] and urbanisation generally remained sluggish until the 1920s, due to the lack of industrialisation andabsence of adequate transportation. Subsequently, the policy of discriminating protection (where certain importantindustries were given financial protection by the state), coupled with the Second World War, saw the developmentand dispersal of industries, encouraging rural-urban migration, and in particular the large port cities of Bombay,Calcutta and Madras grew rapidly. Despite this, only one-sixth of India's population lived in cities by 1951.[32]

Economy of India 6
The impact of British occupation on India's economy is a controversial topic. Leaders of the Indian independencemovement and economic historians have blamed colonial occupation for the dismal state of India's economy in itsaftermath and argued that financial strength required for industrial development in Europe was derived from thewealth taken from colonies in Asia and Africa. At the same time, right-wing historians have countered that India'slow economic performance was due to various sectors being in a state of growth and decline due to changes broughtin by colonialism and a world that was moving towards industrialisation and economic integration.[]
Pre-liberalisation period (1947–1991)Indian economic policy after independence was influenced by the colonial experience, which was seen by Indianleaders as exploitative, and by those leaders' exposure to British social democracy as well as the progress achievedby the planned economy of the Soviet Union.[] Domestic policy tended towards protectionism, with a strongemphasis on import substitution industrialisation, economic interventionism, a large public sector, businessregulation, and central planning,[33] while trade and foreign investment policies were relatively liberal.[34] Five-YearPlans of India resembled central planning in the Soviet Union. Steel, mining, machine tools, telecommunications,insurance, and power plants, among other industries, were effectively nationalised in the mid-1950s.[]
“ Never talk to me about profit, Jeh, it is a dirtyword. ”
—Nehru, India's Fabian Socialism inspired first prime minister to industrialist J.R.D. Tata, when Tata suggested state-owned companies should beprofitable, []
Jawaharlal Nehru, the first prime minister of India, along with the statistician Prasanta Chandra Mahalanobis,formulated and oversaw economic policy during the initial years of the country's independence. They expectedfavorable outcomes from their strategy, involving the rapid development of heavy industry by both public andprivate sectors, and based on direct and indirect state intervention, rather than the more extreme Soviet-style centralcommand system.[35][] The policy of concentrating simultaneously on capital- and technology-intensive heavyindustry and subsidising manual, low-skill cottage industries was criticised by economist Milton Friedman, whothought it would waste capital and labour, and retard the development of small manufacturers.[] The rate of growth ofthe Indian economy in the first three decades after independence was derisively referred to as the Hindu rate ofgrowth by economists, because of the unfavourable comparison with growth rates in other Asian countries.[36][37]
“(In the current Indian regulatory system,) I cannot decide how much to borrow, what shares to issue, at what price, what wages and bonus topay, and what dividend to give. I even need the government's permission for the salary I pay to a senior executive. ”
—J. R. D. Tata in 1969, []
Since 1965, the use of high-yielding varieties of seeds, increased fertilisers and improved irrigation facilitiescollectively contributed to the Green Revolution in India, which improved the condition of agriculture by increasingcrop productivity, improving crop patterns and strengthening forward and backward linkages between agricultureand industry.[38] However, it has also been criticised as an unsustainable effort, resulting in the growth of capitalisticfarming, ignoring institutional reforms and widening income disparities.[39]
Subsequently the Emergency and Garibi Hatao concept under which income tax levels at one point rose to amaximum of 97.5%, a record in the world for non-communist economies, started diluting the earlier efforts.

Economy of India 7
Post-liberalisation period (since 1991)
GDP of India has risen rapidly since 1991.
In the late 1970s, the government led byMorarji Desai eased restrictions on capacityexpansion for incumbent companies,removed price controls, reduced corporatetaxes and promoted the creation of smallscale industries in large numbers. However,the subsequent government policy of Fabiansocialism hampered the benefits of theeconomy, leading to high fiscal deficits anda worsening current account. The collapseof the Soviet Union, which was India'smajor trading partner, and the Gulf War,which caused a spike in oil prices, resultedin a major balance-of-payments crisis forIndia, which found itself facing the prospect of defaulting on its loans.[] India asked for a $1.8 billion bailout loanfrom the International Monetary Fund (IMF), which in return demanded reforms.[40]
In response, Prime Minister Narasimha Rao, along with his finance minister Manmohan Singh, initiated theeconomic liberalisation of 1991. The reforms did away with the Licence Raj, reduced tariffs and interest rates andended many public monopolies, allowing automatic approval of foreign direct investment in many sectors.[41] Sincethen, the overall thrust of liberalisation has remained the same, although no government has tried to take on powerfullobbies such as trade unions and farmers, on contentious issues such as reforming labour laws and reducingagricultural subsidies.[] By the turn of the 21st century, India had progressed towards a free-market economy, with asubstantial reduction in state control of the economy and increased financial liberalisation.[42] This has beenaccompanied by increases in life expectancy, literacy rates and food security, although urban residents havebenefited more than agricultural residents.[43]
While the credit rating of India was hit by its nuclear weapons tests in 1998, it has since been raised to investmentlevel in 2003 by S&P and Moody's.[44] In 2003, Goldman Sachs predicted that India's GDP in current prices wouldovertake France and Italy by 2020, Germany, UK and Russia by 2025 and Japan by 2035, making it the third largesteconomy of the world, behind the US and China. India is often seen by most economists as a rising economicsuperpower and is believed to play a major role in the global economy in the 21st century.[][]
Sectors
Industry and servicesIndustry accounts for 28% of the GDP and employs 14% of the total workforce.[45] India is 11th in the world interms of nominal factory output according data is compiled through CIA World Factbook figures. The Indianindustrial sector underwent significant changes as a result of the economic liberalisation in India economic reformsof 1991, which removed import restrictions, brought in foreign competition, led to privatization of certain publicsector industries, liberalised the FDI regime, improved infrastructure and led to an expansion in the production offast moving consumer goods.[46] Post-liberalisation, the Indian private sector was faced with increasing domestic aswell as foreign competition, including the threat of cheaper Chinese imports. It has since handled the change bysqueezing costs, revamping management, and relying on cheap labor and new technology. However, this has alsoreduced employment generation even by smaller manufacturers who earlier relied on relatively labour-intensiveprocesses.[47]

Economy of India 8
Textile
Textile manufacturing is the 2nd largest source of employment after agriculture and accounts for 20% ofmanufacturing output, providing employment to over 20 million people.[48] A previous Indian Minister of TextilesShankersinh Vaghela, has stated that the transformation of the textile industry from a declining to a rapidlydeveloping one has become the biggest achievement of the central government. After freeing the industry in2004–2005 from a number of limitations, primarily financial, the government gave a green light to massiveinvestment inflows – both domestic and foreign. During the period from 2004 to 2008, total investment amounted to27 billion dollars. By 2012, this figure was predicted to reach 38 billion and was expected to create an additional 17million jobs. However, demand for Indian textiles in world markets continues to fall. Ludhiana produces 90% ofwoollens in India and is known as the Manchester of India. Tirupur has gained universal recognition as the leadingsource of hosiery, knitted garments, casual wear and sportswear. Considering the Rs 15,000,000,000 revenue fromtextile sales with an approximate of a nominal 20% net profit and with around 257,572 residents of the city, percapita income of Ichalkaranji is 116,472, among one of the highest per capita incomes in the country. TextileDevelopment Cluster : To enhance and improve the infrastructure facilities of the city, the Municipal Council alongwith Ichalkaranji Co-operative Industrial Estate, Laxmi Co-operative Industrial Estate, Parvati Industrial Estate andDKTE Textile and Engineering Institute have jointly come together and formed a Special Purpose Vehicle (SPV)company viz. "Ichalkaranji Textile Development Cluster Limited (ITDC).The individual members will contribute tothe extent of about 50% of the project cost and the balance amount would come in from the grant in aid fromDepartment of Industrial Promotion and Policy, Government of India,under the Industrial Infrastructure up-gradationScheme (IIUS).[49]
Services
India is 13th in services output. The services sector provides employment to 23% of the work force and is growingquickly, with a growth rate of 7.5% in 1991–2000, up from 4.5% in 1951–80. It has the largest share in the GDP,accounting for 55% in 2007, up from 15% in 1950.[] Information technology and business process outsourcing areamong the fastest growing sectors, having a cumulative growth rate of revenue 33.6% between 1997 and 1998 and2002–03 and contributing to 25% of the country's total exports in 2007–08.[50] The growth in the IT sector isattributed to increased specialisation, and an availability of a large pool of low cost, highly skilled, educated andfluent English-speaking workers, on the supply side, matched on the demand side by increased demand from foreignconsumers interested in India's service exports, or those looking to outsource their operations. The share of theIndian IT industry in the country's GDP increased from 4.8% in 2005–06 to 7% in 2008.[] In 2009, seven Indianfirms were listed among the top 15 technology outsourcing companies in the world.[51]
Retail
Retail industry is one of the pillars of Indian economy and accounts for 14–15% of its GDP.[][52] The Indian retailmarket is estimated to be US$ 450 billion and one of the top five retail markets in the world by economic value.India is one of the fastest growing retail market in the world, with 1.2 billion people.[53][54]
India's retailing industry essentially consists of the local mom and pop store, owner manned general stores,convenience stores, hand cart and pavement vendors, etc.[55] Organised retail supermarkets account for 4% of themarket as of 2008.[] Regulations prevent most foreign investment in retailing. In 2012 government permitted 51%FDI in multi brand retail and 100% FDI in single brand retail. Moreover, over thirty regulations such as "signboardlicences" and "anti-hoarding measures" may have to be complied before a store can open doors. There are taxes formoving goods from state to state, and even within states.[]

Economy of India 9
Tourism
Tourism in India is relatively undeveloped, but a high growth sector. It contributes 6.23% to the national GDP and8.78% of the total employment. The majority of foreign tourists come from USA and UK.[56] India's rich history andits cultural and geographical diversity make its international tourism appeal large and diverse. It presents heritageand cultural tourism along with medical, business and sports tourism. India has one of the largest and fastest growingmedical tourism sectors.[]
Mining
Mining forms an important segment of the Indian economy, with the country producing 79 different minerals(excluding fuel and atomic resources) in 2009–10, including iron ore, manganese, mica, bauxite, chromite,limestone, asbestos, fluorite, gypsum, ochre, phosphorite and silica sand.[57]
AgricultureIndia ranks second worldwide in farm output. Agriculture and allied sectors like forestry, logging and fishingaccounted for 15.7% of the GDP in 2009–10, employed 52.1% of the total workforce, and despite a steady decline ofits share in the GDP, is still the largest economic sector and a significant piece of the overall socio-economicdevelopment of India.[58] Crop yield per unit area of all crops have grown since 1950, due to the special emphasisplaced on agriculture in the five-year plans and steady improvements in irrigation, technology, application of modernagricultural practices and provision of agricultural credit and subsidies since the Green Revolution in India.However, international comparisons reveal the average yield in India is generally 30% to 50% of the highest averageyield in the world.[] Indian states Uttar Pradesh, Punjab, Haryana, Madhya Pradesh, Andhra Pradesh, Bihar, WestBengal, Gujarat and Maharashtra are key agricultural contributing states of India.India receives an average annual rainfall of 1,208 millimetres (47.6 in) and a total annual precipitation of4000 billion cubic metres, with the total utilisable water resources, including surface and groundwater, amounting to1123 billion cubic metres.[59] 546,820 square kilometres (211,130 sq mi) of the land area, or about 39% of the totalcultivated area, is irrigated.[] India's inland water resources including rivers, canals, ponds and lakes and marineresources comprising the east and west coasts of the Indian ocean and other gulfs and bays provide employment tonearly six million people in the fisheries sector. In 2008, India had the world's third largest fishing industry.[60]
India is the largest producer in the world of milk, jute and pulses, and also has the world's second largest cattlepopulation with 175 million animals in 2008.[] It is the second largest producer of rice, wheat, sugarcane, cotton andgroundnuts, as well as the second largest fruit and vegetable producer, accounting for 10.9% and 8.6% of the worldfruit and vegetable production respectively.[] India is also the second largest producer and the largest consumer ofsilk in the world, producing 77,000 million tons in 2005.[]
Banking and financeThe Indian money market is classified into the organised sector, comprising private, public and foreign ownedcommercial banks and cooperative banks, together known as scheduled banks, and the unorganised sector, whichincludes individual or family owned indigenous bankers or money lenders and non-banking financial companies.[61]
The unorganised sector and microcredit are still preferred over traditional banks in rural and sub-urban areas,especially for non-productive purposes, like ceremonies and short duration loans.[]
Prime Minister Indira Gandhi nationalised 14 banks in 1969, followed by six others in 1980, and made it mandatory for banks to provide 40% of their net credit to priority sectors like agriculture, small-scale industry, retail trade, small businesses, etc. to ensure that the banks fulfill their social and developmental goals. Since then, the number of bank branches has increased from 8,260 in 1969 to 72,170 in 2007 and the population covered by a branch decreased from 63,800 to 15,000 during the same period. The total bank deposits increased from 59.1 billion (US$1.0 billion) in 1970–71 to 38,309.22 billion (US$660 billion) in 2008–09. Despite an increase of rural branches, from 1,860 or

Economy of India 10
22% of the total number of branches in 1969 to 30,590 or 42% in 2007, only 32,270 out of 500,000 villages arecovered by a scheduled bank.[][]
India's gross domestic saving in 2006–07 as a percentage of GDP stood at a high 32.7%.[62] More than half ofpersonal savings are invested in physical assets such as land, houses, cattle, and gold.[63] The public sector bankshold over 75% of total assets of the banking industry, with the private and foreign banks holding 18.2% and 6.5%respectively.[] Since liberalisation, the government has approved significant banking reforms. While some of theserelate to nationalised banks, like encouraging mergers, reducing government interference and increasing profitabilityand competitiveness, other reforms have opened up the banking and insurance sectors to private and foreignplayers.[][]
Energy and power
As of 2010, India imported about 70% of itscrude oil requirements.[] Shown here is an
ONGC platform at Mumbai High in the ArabianSea, one of the few sites of domestic production.
As of 2009, India is the fourth largest producer of electricity and oilproducts and the fourth largest importer of coal and crude-oil in theworld.[] Coal and oil together account for 66% of the energyconsumption of India.[]
India's oil reserves meet 25% of the country's domestic oil demand.[][]
As of 2009, India's total proven oil reserves stood at 775 million metrictonnes while gas reserves stood at 1074 billion cubic metres.[] Oil andnatural gas fields are located offshore at Mumbai High, KrishnaGodavari Basin and the Cauvery Delta, and onshore mainly in thestates of Assam, Gujarat and Rajasthan.[] India is the fourth largestconsumer of oil in the world and imported $82.1 billion worth of oil inthe first three quarters of 2010, which had an adverse effect on itscurrent account deficit.[] The petroleum industry in India mostly consists of public sector companies such as Oil andNatural Gas Corporation (ONGC), Hindustan Petroleum Corporation Limited (HPCL), Bharat PetroleumCorporation Limited (BPCL) and Indian Oil Corporation Limited (IOCL). There are some major private Indiancompanies in the oil sector such as Reliance Industries Limited (RIL) which operates the world's largest oil refiningcomplex.[64]
As of December 2011, India had an installed power generation capacity of 185.5 Giga Watts(GW), of which thermalpower contributed 65.87%, hydroelectricity 20.75%, other sources of renewable energy 10.80%, and nuclear power2.56%.[] India meets most of its domestic energy demand through its 106 billion tonnes of coal reserves.[65] India isalso rich in certain alternative sources of energy with significant future potential such as solar, wind and biofuels(jatropha, sugarcane). India's huge thorium reserves – about 25% of world's reserves – are expected to fuel thecountry's ambitious nuclear energy program in the long-run. India's dwindling uranium reserves stagnated the growthof nuclear energy in the country for many years.[66] However, the Indo-US nuclear deal has paved the way for Indiato import uranium from other countries.[67]

Economy of India 11
InfrastructureIndia has the world's third largest road network,[] covering more than 4.3 million kilometers and carrying 60% offreight and 87% of passenger traffic.[] Indian Railways is the fourth largest rail network in the world, with a tracklength of 114,500 kilometers.India has 13 major ports, handling a cargo volume of 850 million tonnes in 2010.[68]
India has a national teledensity rate of 74.15% with 926.53 million telephone subscribers, two-thirds of them inurban areas,[69] but Internet use is rare, with around 13.3 million broadband lines in India in December 2011.[70]
However, this is growing and is expected to boom following the expansion of 3G and WiMAX services.[71]
External trade and investment
Global trade relations
A map showing the global distribution of Indian exports in 2006 as a percentage of thetop market (USA – $20,902,500,000).
Until the liberalisation of 1991, Indiawas largely and intentionally isolatedfrom the world markets, to protect itseconomy and to achieve self-reliance.Foreign trade was subject to importtariffs, export taxes and quantitativerestrictions, while foreign directinvestment (FDI) was restricted byupper-limit equity participation,restrictions on technology transfer,export obligations and governmentapprovals; these approvals wereneeded for nearly 60% of new FDI in the industrial sector. The restrictions ensured that FDI averaged only around$200 million annually between 1985 and 1991; a large percentage of the capital flows consisted of foreign aid,commercial borrowing and deposits of non-resident Indians.[] India's exports were stagnant for the first 15 years afterindependence, due to general neglect of trade policy by the government of that period. Imports in the same period,due to industrialisation being nascent, consisted predominantly of machinery, raw materials and consumer goods.[72]
Graphical depiction of India's product exports in 28color-coded categories.
Since liberalisation, the value of India's international trade hasincreased sharply,[73] with the contribution of total trade in goodsand services to the GDP rising from 16% in 1990–91 to 47% in2008–10.[][] India accounts for 1.44% of exports and 2.12% ofimports for merchandise trade and 3.34% of exports and 3.31% ofimports for commercial services trade worldwide.[] India's majortrading partners are the European Union, China, the United Statesof America and the United Arab Emirates.[] In 2006–07, majorexport commodities included engineering goods, petroleumproducts, chemicals and pharmaceuticals, gems and jewellery,textiles and garments, agricultural products, iron ore and otherminerals. Major import commodities included crude oil and relatedproducts, machinery, electronic goods, gold and silver.[74] In
November 2010, exports increased 22.3% year-on-year to 850.63 billion (US$15 billion), while imports were up7.5% at 1,251.33 billion (US$22 billion). Trade deficit for the same month dropped from 468.65 billion(US$8.1 billion) in 2009 to 400.7 billion (US$6.9 billion) in 2010.[75]

Economy of India 12
India is a founding-member of General Agreement on Tariffs and Trade (GATT) since 1947 and its successor, theWTO. While participating actively in its general council meetings, India has been crucial in voicing the concerns ofthe developing world. For instance, India has continued its opposition to the inclusion of such matters as labour andenvironment issues and other non-tariff barriers to trade into the WTO policies.[]
Balance of payments
Cumulative Current Account Balance 1980–2008based on IMF data
Since independence, India's balance of payments on its current accounthas been negative. Since economic liberalisation in the 1990s,precipitated by a balance of payment crisis, India's exports roseconsistently, covering 80.3% of its imports in 2002–03, up from 66.2%in 1990–91.[76] However, the global economic slump followed by ageneral deceleration in world trade saw the exports as a percentage ofimports drop to 61.4% in 2008–09.[77] India's growing oil import bill isseen as the main driver behind the large current account deficit,[] whichrose to $118.7 billion, or 9.7% of GDP, in 2008–09.[78] Between January and October 2010, India imported$82.1 billion worth of crude oil.[]
Due to the global late-2000s recession, both Indian exports and imports declined by 29.2% and 39.2% respectively inJune 2009.[] The steep decline was because countries hit hardest by the global recession, such as United States andmembers of the European Union, account for more than 60% of Indian exports.[79] However, since the decline inimports was much sharper compared to the decline in exports, India's trade deficit reduced to 252.5 billion(US$4.3 billion).[] As of June 2011, exports and imports have both registered impressive growth with monthlyexports reaching $25.9 billion for the month of May 2011 and monthly imports reaching $40.9 billion for the samemonth. This represents a year on year growth of 56.9% for exports and 54.1% for imports.[]
India's reliance on external assistance and concessional debt has decreased since liberalisation of the economy, andthe debt service ratio decreased from 35.3% in 1990–91 to 4.4% in 2008–09.[80] In India, External CommercialBorrowings (ECBs), or commercial loans from non-resident lenders, are being permitted by the Government forproviding an additional source of funds to Indian corporates. The Ministry of Finance monitors and regulates themthrough ECB policy guidelines issued by the Reserve Bank of India under the Foreign Exchange Management Act of1999.[81] India's foreign exchange reserves have steadily risen from $5.8 billion in March 1991 to $283.5 billion inDecember 2009. [82]
Foreign direct investmentSee also Foreign direct investment, India section.
Share of top five investing countries in FDI inflows. (2000–2010)[]
Rank Country Inflows(million USD)
Inflows (%)
1 Mauritius 50,164 42.00
2 Singapore 11,275 9.00
3 USA 8,914 7.00
4 UK 6,158 5.00
5 Netherlands 4,968 4.00
As the third-largest economy in the world in PPP terms, India is a preferred destination for FDI;[] During the year 2011, FDI inflow into India stood at $36.5 billion, 51.1% higher than 2010 figure of $24.15 billion. India has

Economy of India 13
strengths in telecommunication, information technology and other significant areas such as auto components,chemicals, apparels, pharmaceuticals, and jewellery. Despite a surge in foreign investments, rigid FDI [] policieswere a significant hindrance. However, due to positive economic reforms aimed at deregulating the economy andstimulating foreign investment, India has positioned itself as one of the front-runners of the rapidly growingAsia-Pacific region.[] India has a large pool of skilled managerial and technical expertise. The size of themiddle-class population stands at 300 million and represents a growing consumer market.[83]
During 2000–10, the country attracted $178 billion as FDI.[84] The inordinately high investment from Mauritius isdue to routing of international funds through the country given significant tax advantages; double taxation is avoideddue to a tax treaty between India and Mauritius, and Mauritius is a capital gains tax haven, effectively creating azero-taxation FDI channel.[85]
India's recently liberalised FDI policy (2005) allows up to a 100% FDI stake in ventures. Industrial policy reformshave substantially reduced industrial licensing requirements, removed restrictions on expansion and facilitated easyaccess to foreign technology and foreign direct investment FDI. The upward moving growth curve of the real-estatesector owes some credit to a booming economy and liberalised FDI regime. In March 2005, the governmentamended the rules to allow 100% FDI in the construction sector, including built-up infrastructure and constructiondevelopment projects comprising housing, commercial premises, hospitals, educational institutions, recreationalfacilities, and city- and regional-level infrastructure.[86] Despite a number of changes in the FDI policy to removecaps in most sectors, there still remains an unfinished agenda of permitting greater FDI in politically sensitive areassuch as insurance and retailing. The total FDI equity inflow into India in 2008–09 stood at 1,229.19 billion(US$21 billion), a growth of 25% in rupee terms over the previous period.[87]. India's trade and business sector hasgrown fast. India currently accounts for 1.5% of world trade as of 2007 according to the World Trade Statistics ofthe WTO in 2006.
Currency
The RBI's new headquarters in Mumbai
The Indian rupee ( ) is the only legal tender in India, and is also accepted aslegal tender in the neighbouring Nepal and Bhutan, both of which peg theircurrency to that of the Indian rupee. The rupee is divided into 100 paise. Thehighest-denomination banknote is the 1,000 note; the lowest-denominationcoin in circulation is the 50 paise coin;[88] with effect from 30 June 2011 alldenominations below 50 paise have ceased to be legal currency.[89][90] India'smonetary system is managed by the Reserve Bank of India (RBI), thecountry's central bank.[91] Established on 1 April 1935 and nationalised in1949, the RBI serves as the nation's monetary authority, regulator andsupervisor of the monetary system, banker to the government, custodian offoreign exchange reserves, and as an issuer of currency. It is governed by acentral board of directors, headed by a governor who is appointed by theGovernment of India.[92]
The rupee was linked to the British pound from 1927 to 1946 and then theU.S. dollar till 1975 through a fixed exchange rate. It was devalued in September 1975 and the system of fixed parrate was replaced with a basket of four major international currencies – the British pound, the U.S. dollar, theJapanese yen and the Deutsche mark.[93] From 2003 to 2008, the rupee appreciated against the U.S. dollar;thereafter, it has sharply depreciated. Between 2010 and 2012, the rupee value had depreciated by about 30% of itsvalue to the U.S. dollar in 2010.[94]

Economy of India 14
Income and consumption
World map showing the Gini coefficient, a measure ofincome inequality. India has a Gini coefficient of
0.368.
India's gross national income per capita had experienced highgrowth rates since 2002. India's Per Capita Income has tripledfrom Rs. 19,040 in 2002–03 to Rs. 53,331 in 2010–11, averaging13.7% growth over these eight years peaking 15.6% in2010–11.[95] However growth in the inflation adjusted Per capitaincome of the nation slowed to 5.6% in 2010–11, down from 6.4%in the previous year. As of 2010, according to World Bankstatistics, about 400 million people in India, as compared to 1.29billion people worldwide, live on less than $1.25 (PPP) per day.These consumption levels are on an individual basis, nothousehold.[96]
Per 2011 census, India has about 330 million houses and 247 million households. The household size in India hasdropped in recent years, with 2011 census reporting 50% of households have 4 or less members. Some householdshave 6 or more members, including the grandparents.[][][97] These households produced a GDP of about $1.7Trillion.[98] The household consumption patterns per 2011 census: about 67 percent of households use firewood,crop residue or cow dung cakes for cooking purposes; 53 percent do not have sanitation or drainage facilities onpremises; 83 percent have water supply within their premises or 100 meters from their house in urban areas and 500meters from the house in rural areas; 67 percent of the households have access to electricity; 63 percent ofhouseholds have landline or mobile telephone connection; 43 percent have a television; 26 percent have either a twowheel (motorcycle) or four wheel (car) vehicle. Compared to 2001, these income and consumption trends representmoderate to significant improvements.[][] One report in 2010 claimed that the number of high income households hascrossed lower income households.[99]
List of countries by GNI (nominal, Atlas method) percapitaGNI per capita: India (1,170 $) Higher GNI per
capita compared to India Lower GNI per capitacompared to India
India has about 61 million children under the age of 5 who arechronically malnourished, compared to 150 million childrenworldwide. Majority of malnourished children of India live inrural areas. Girls tend to be more malnourished than boys.Malnourishment, claims this report, is not a matter of income,rather it is education as in other parts of the world. A third ofchildren from the wealthiest fifth of India's population aremalnourished. This is because of poor feeding practices –foremost among them a failure exclusively to breastfeed in thefirst six months – play as big a role in India's malnutrition rates asfood shortages. India's government has launched several major programs with mandated social spending programs toaddress child malnourishment problem. However, Indian government has largely failed. A public distribution systemthat targets subsidised food to the poor and a vast midday-meal scheme, to which 120 million children subscribe—are hampered by inefficiency and corruption[citation needed]. Another government-paid program named IntegratedChildhood Development Service (ICDS) has been operating since 1975 and it too has been ineffective and a wastefulprogram.[100] A 2011 UNICEF report claims recent encouraging signs. Between 1990 to 2010, India has achieved a45 percent reduction in under age 5 mortality rates, and now ranks 46 in 188 countries on this metric.[101]
PovertyAccording to World Bank international poverty line methodology, India's poverty dropped from 42% of its totalpopulation in 2005 to about 33% in 2010.[] In rural India, about 34 percent of the population lives on less than $1.25a day, down from 44 percent in 2005; while in urban India, 29 percent of the population lived below that absolutepoverty line in 2010, down from 36 percent in 2005, according to the World Bank report.[102]

Economy of India 15
Since the early 1950s, successive governments have implemented various schemes to alleviate poverty, under centralplanning, that have met with partial success. All these programmes have relied upon the strategies of the Food forwork programme and National Rural Employment Programme of the 1980s, which attempted to use the unemployedto generate productive assets and build rural infrastructure.[] In 2005, Indian government enacted the MahatmaGandhi National Rural Employment Guarantee Act, guaranteeing 100 days of minimum wage employment to everyrural household in all the districts of India.[] The question of whether these government spending programs orwhether economic reforms reduce poverty, by improving income of the poorest, remains in controversy.[] In 2011,the Mahatma Gandhi National Rural Employment Guarantee programme was widely criticised as no more effectivethan other poverty reduction programs in India. Despite its best intentions, MGNREGA is beset with controversyabout corrupt officials, deficit financing as the source of funds, poor quality of infrastructure built under thisprogram, and unintended destructive effect on poverty.[][][103]
EmploymentIndia's labor regulations – among the most restrictive and complex in the world – have constrained the growthof the formal manufacturing sector where these laws have their widest application. Better designed laborregulations can attract more labor- intensive investment and create jobs for India's unemployed millions andthose trapped in poor quality jobs. Given the country's momentum of growth, the window of opportunity mustnot be lost for improving the job prospects for the 80 million new entrants who are expected to join the workforce over the next decade.
— World Bank: India Country Overview 2008.[]
Agricultural and allied sectors accounted for about 52.1% of the total workforce in 2009–10.[58] While agriculturehas faced stagnation in growth, services have seen a steady growth. Of the total workforce, 7% is in the organisedsector, two-thirds of which are in the public sector.[104] The NSSO survey estimated that in 2004–05, 8.3% of thepopulation was unemployed, an increase of 2.2% over 1993 levels, with unemployment uniformly higher in urbanareas and among women.[105][106] Growth of labour stagnated at around 2% for the decade between 1994 and 2005,about the same as that for the preceding decade.[] Avenues for employment generation have been identified in the ITand travel and tourism sectors, which have been experiencing high annual growth rates of above 9%.[107]
Unemployment in India is characterised by chronic (disguised) unemployment. Government schemes that targeteradication of both poverty and unemployment (which in recent decades has sent millions of poor and unskilledpeople into urban areas in search of livelihoods) attempt to solve the problem, by providing financial assistance forsetting up businesses, skill honing, setting up public sector enterprises, reservations in governments, etc. The declinein organised employment due to the decreased role of the public sector after liberalisation has further underlined theneed for focusing on better education and has also put political pressure on further reforms.[108][] India's labourregulations are heavy even by developing country standards and analysts have urged the government to abolish ormodify them in order to make the environment more conducive for employment generation.[109][110] The 11thfive-year plan has also identified the need for a congenial environment to be created for employment generation, byreducing the number of permissions and other bureaucratic clearances required.[111] Further, inequalities andinadequacies in the education system have been identified as an obstacle preventing the benefits of increasedemployment opportunities from reaching all sectors of society.[112]
Child labour in India is a complex problem that is basically rooted in poverty, coupled with a failure of governmental policy, which has focused on subsidising higher rather than elementary education, as a result benefiting the privileged rather than the poorer sections of society.[113] The Indian government is implementing the world's largest child labour elimination program, with primary education targeted for ~250 million. Numerous non-governmental and voluntary organisations are also involved. Special investigation cells have been set up in states to enforce existing laws banning the employment of children under 14 in hazardous industries. The allocation of the Government of India for the eradication of child labour was $21 million in 2007.[] Public campaigns, provision of
Economy of India 16
meals in school and other incentives have proven successful in increasing attendance rates in schools in somestates.[114]
In 2009–10, remittances from Indian migrants overseas stood at 2,500 billion (US$43 billion), the highest in theworld, but their share in FDI remained low at around 1%.[115] India ranked 133rd on the Ease of Doing BusinessIndex 2010, behind countries such as China (89th), Pakistan (85th), and Nigeria (125th).[116]
Women in India are mainly employed in agriculture and caring for livestock with only about 20% of the employedwomen engaging in activities outside agriculture. When employed, women earn substantially less than men, onlyabout 66% of the male incomes in agriculture and 57% of the male incomes outside agriculture.[118] [117]
Economic trends and issues
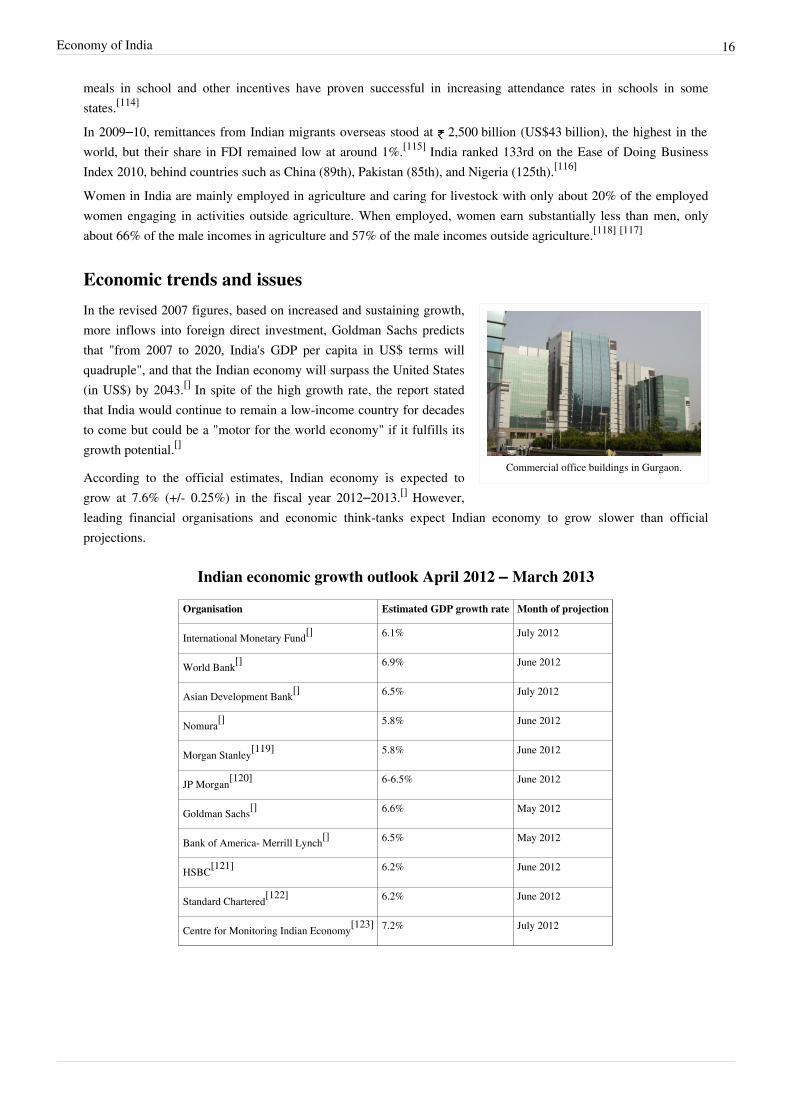
Commercial office buildings in Gurgaon.
In the revised 2007 figures, based on increased and sustaining growth,more inflows into foreign direct investment, Goldman Sachs predictsthat "from 2007 to 2020, India's GDP per capita in US$ terms willquadruple", and that the Indian economy will surpass the United States(in US$) by 2043.[] In spite of the high growth rate, the report statedthat India would continue to remain a low-income country for decadesto come but could be a "motor for the world economy" if it fulfills itsgrowth potential.[]
According to the official estimates, Indian economy is expected togrow at 7.6% (+/- 0.25%) in the fiscal year 2012–2013.[] However,leading financial organisations and economic think-tanks expect Indian economy to grow slower than officialprojections.
Indian economic growth outlook April 2012 – March 2013
Organisation Estimated GDP growth rate Month of projection
International Monetary Fund[] 6.1% July 2012
World Bank[] 6.9% June 2012
Asian Development Bank[] 6.5% July 2012
Nomura[] 5.8% June 2012
Morgan Stanley[119] 5.8% June 2012
JP Morgan[120] 6-6.5% June 2012
Goldman Sachs[] 6.6% May 2012
Bank of America- Merrill Lynch[] 6.5% May 2012
HSBC[121] 6.2% June 2012
Standard Chartered[122] 6.2% June 2012
Centre for Monitoring Indian Economy[123] 7.2% July 2012

Economy of India 17
AgricultureSlow agricultural growth is a concern for policymakers as some two-thirds of India's people depend on ruralemployment for a living. Current agricultural practices are neither economically nor environmentallysustainable and India's yields for many agricultural commodities are low. Poorly maintained irrigation systemsand almost universal lack of good extension services are among the factors responsible. Farmers' access tomarkets is hampered by poor roads, rudimentary market infrastructure, and excessive regulation.
— World Bank: "India Country Overview 2008"[]
Agriculture is an important part of Indian economy. In 2008, a New York Times article claimed, with the righttechnology and policies, India could contribute to feeding not just itself but the world. However, agricultural outputof India lags far behind its potential.[] The low productivity in India is a result of several factors. According to theWorld Bank, India's large agricultural subsidies are hampering productivity-enhancing investment. Whileoverregulation of agriculture has increased costs, price risks and uncertainty, governmental intervention in labour,land, and credit markets are hurting the market. Infrastructure such as rural roads, electricity, ports, food storage,retail markets and services are inadequate.[] Further, the average size of land holdings is very small, with 70% ofholdings being less than one hectare in size.[124] The partial failure of land reforms in many states, exacerbated bypoorly maintained or non-existent land records, has resulted in sharecropping with cultivators lacking ownershiprights, and consequently low productivity of labour.[125] Adoption of modern agricultural practices and use oftechnology is inadequate, hampered by ignorance of such practices, high costs, illiteracy, slow progress inimplementing land reforms, inadequate or inefficient finance and marketing services for farm produce andimpracticality in the case of small land holdings. The allocation of water is inefficient, unsustainable and inequitable.The irrigation infrastructure is deteriorating.[] Irrigation facilities are inadequate, as revealed by the fact that only39% of the total cultivable land was irrigated as of 2010,[] resulting in farmers still being dependent on rainfall,specifically the monsoon season, which is often inconsistent and unevenly distributed across the country.[126]
Corruption
Overview of the index of perception ofcorruption, 2010
Corruption has been one of the pervasive problems affecting India. A2005 study by Transparency International (TI) found that more thanhalf of those surveyed had firsthand experience of paying bribe orpeddling influence to get a job done in a public office in the previousyear.[] A follow-on 2008 TI study found this rate to be 40 percent.[127]
In 2011, Transparency International ranked India at 95th placeamongst 183 countries in perceived levels of public sector corruption.[]
In 1996, red tape, bureaucracy and the Licence Raj were suggested as a cause for the institutionalised corruption andinefficiency.[128] More recent reports[][][129] suggest the causes of corruption in India include excessive regulationsand approval requirements, mandated spending programs, monopoly of certain goods and service providers bygovernment controlled institutions, bureaucracy with discretionary powers, and lack of transparent laws andprocesses.The Right to Information Act (2005) which requires government officials to furnish information requested bycitizens or face punitive action, computerisation of services, and various central and state government acts thatestablished vigilance commissions, have considerably reduced corruption and opened up avenues to redressgrievances.[]

Economy of India 18
The number of people employed in non-agriculturaloccupations in the public and private sectors. Totals arerounded. Private sector data relates to non-agriculture
establishments with 10 or more employees.[]
The current government has concluded that most spendingfails to reach its intended recipients. A large, cumbersome andtumor-like bureaucracy sponges up or siphons off spendingbudgets.[] India's absence rates are one of the worst in theworld; one study found that 25% of public sector teachers and40% of public sector medical workers could not be found atthe workplace.[130][131]
Corruption is also endemic in the Indian technology andscientific development industries. CSIR has been flagged inongoing efforts to root out corruption in India.[] Primeminister Manmohan Singh spoke at the 99th Indian ScienceCongress and commented on the state of the sciences in India,after an advisory council informed him there were problems with "the overall environment for innovation andcreative work" and a 'warlike' approach was needed.[132] There are many issues facing Indian scientists, with some –such as MIT systems scientist VA Shiva Ayyadurai – calling for transparency, a meritocratic system, and anoverhaul of the bureaucratic agencies that oversee science and technology.[][133]
The Indian economy has an underground economy, with an alleged 2006 report by the Swiss Bankers Associationsuggesting India topped the worldwide list for black money with almost $1,456 billion stashed in Swiss banks. Thisamounts to 13 times the country's total external debt.[134][135] These allegations have been denied by Swiss BankingAssociation. James Nason, the Head of International Communications for Swiss Banking Association, suggests "The(black money) figures were rapidly picked up in the Indian media and in Indian opposition circles, and circulated asgospel truth. However, this story was a complete fabrication. The Swiss Bankers Association never published such areport. Anyone claiming to have such figures (for India) should be forced to identify their source and explain themethodology used to produce them."[136][137]
EducationIndia has made huge progress in terms of increasing primary education attendance rate and expanding literacy toapproximately three-fourths of the population.[] India's literacy rate had grown from 52.2% in 1991 to 74.04% in2011. The right to education at elementary level has been made one of the fundamental rights under the eighty-sixthAmendment of 2002, and legislation has been enacted to further the objective of providing free education to allchildren.[138] However, the literacy rate of 74% is still lower than the worldwide average and the country suffersfrom a high dropout rate.[] Further, there exists a severe disparity in literacy rates and educational opportunitiesbetween males and females, urban and rural areas, and among different social groups.[139]
Economic disparitiesIndia continues to grow at a rapid pace, although the government recently reduced its annual GDP growthprojection from 9% to 8% for the current fiscal year ending March 2012. The slowdown is marked by a sharpdrop in investment growth resulting from political uncertainties, a tightening of macroeconomic policies aimedat addressing a high fiscal deficit and high inflation (going well beyond food and fuel prices), and fromrenewed concerns about the European and US economies. Although the Government was quite successful incushioning the impact of the global financial crisis on India, it is now clear that a number of MDG targets willonly be met under the Twelfth Five Year Plan (2012–17)..
— World Bank: India Country Overview 2011[]
A critical problem facing India's economy is the sharp and growing regional variations among India's different states and territories in terms of poverty, availability of infrastructure and socio-economic development.[] Six low-income

Economy of India 19
states – Bihar, Chhattisgarh, Jharkhand, Madhya Pradesh, Odisha and Uttar Pradesh – are home to more thanone-third of India's population.[] Severe disparities exist among states in terms of income, literacy rates, lifeexpectancy and living conditions.[140]
The five-year plans, especially in the pre-liberalisation era, attempted to reduce regional disparities by encouragingindustrial development in the interior regions and distributing industries across states, but the results have not beenvery encouraging since these measures in fact increased inefficiency and hampered effective industrial growth.[141]
After liberalisation, the more advanced states have been better placed to benefit from them, with well-developedinfrastructure and an educated and skilled workforce, which attract the manufacturing and service sectors. Thegovernments of backward regions are trying to reduce disparities by offering tax holidays and cheap land, andfocusing more on sectors like tourism which, although being geographically and historically determined, can becomea source of growth and develops faster than other sectors.[][] In fact, the economists fail to realize that ultimately theproblem of equitable growth or inclusive growth is intricately related to the problems of good governance andtransparency.In 2011 Engineering Jobs in India have been showing signs of steady growth.[]
Critics of the neoliberal turn to policymaking in India, and the world in general, since the mid-1980s have pointedout that the growth process under a neoliberal regime is inherently anti-poor. Most of the dividends of economicgrowth is cornered by the already well off. In parallel with an inegalitarian growth process, neoliberalism alsowhittles down whatever welfare State measures might have been in place before its adoption. Inegalitarian growthand erosion of State assisted welfare provisioning increases socio-economic inequality drastically. Drawing on somerecent research, this article has provided empirical evidence in support of such a view.Two comparison groups provide a powerful and disturbing insight into India's growth process. First, there are manycountries which have grown at rates very similar to India's but which have managed to register marked declines insocio-economic inequalities. In stark contrast to this, India has witnessed an increase in socio-economic inequalitysince 1990. Second, in comparison to its close neighbours, with whom India has many geographical, climactic,cultural and social commonalities, India emerges as the worst performer among the South Asian countries.The growth process currently underway in India is inherently biased against the poor, the marginalized andunderprivileged. If economic growth is to lead to substantial improvements in the living standards (measured byindicators of well being like life expectancy, literacy, infant mortality) of the vast majority of the world's population,a radically different socio-economic paradigm must be put in place of the currently dominant neoliberal one. [142]
Notes[1] http:/ / www. guardian. co. uk/ news/ datablog/ 2013/ feb/ 22/ cameron-india-trade-exports-imports-partners[3] http:/ / www. guardian. co. uk/ news/ datablog/ 2013/ feb/ 22/ cameron-india-trade-exports-imports-partners[5] FACT SHEET ON FOREIIGN DIIRECT IINVESTMENT (http:/ / dipp. nic. in/ English/ Publications/ FDI_Statistics/ 2012/
india_FDI_March2012. pdf) date= March 2012[6] World Economic Outlook Database, October 2012 (http:/ / www. imf. org/ external/ pubs/ ft/ weo/ 2012/ 02/ weodata/ weorept.
aspx?sy=2010& ey=2017& scsm=1& ssd=1& sort=country& ds=. & br=1& c=534& s=NGDP_RPCH,NGDPD,GGXWDG_NGDP& grp=0&a=& pr. x=45& pr. y=12)
[10] https:/ / www. cia. gov/ library/ publications/ the-world-factbook/ geos/ in. html[12] (http:/ / www. moneycontrol. com/ news/ economy/ indian-gdp-estimated-at-5fy13-lowest-since-fy04-govt_829548. html)[13] The India Model, by Das, Gurcharan. 1936. Foreign Affairs, Vol. 85, No. 4 (Jul. – Aug. 2006), p. 4: "Father and daughter shackled the
energies of the Indian people under a mixed economy that combined the worst features of capitalism and socialism. Their model wasinward-looking and import—substituting rather than an outward-looking and export-promoting, and it denied India a share in the prosperitythat a massive expansion in global trade brought in the post-World War II era."
[14] ref name="potential">[15] Economic Survey 2010, pp. 1–2.[16] Public debt (http:/ / www. imf. org/ external/ pubs/ ft/ weo/ 2012/ 01/ weodata/ weorept. aspx?sy=2011& ey=2011& ssd=1& sort=country&
ds=. & br=1&c=512,941,914,446,612,666,614,668,311,672,213,946,911,137,193,962,122,674,912,676,313,548,419,556,513,678,316,181,913,682,124,684,339,273,638,921,514,948,218,943,963,686,616,688,223,518,516,728,918,558,748,138,618,196,522,278,622,692,156,694,624,142,626,449,628,564,228,283,924,853,233,288,632,293,636,566,634,964,238,182,662,453,960,968,423,922,935,714,128,862,611,716,321,456,243,722,248,942,469,718,253,724,642,576,643,936,939,961,644,813,819,199,172,184,132,524,646,361,648,362,915,364,134,732,652,366,174,734,328,144,258,146,656,463,654,528,336,923,263,738,268,578,532,537,944,742,176,866,534,369,536,744,429,186,433,925,178,869,436,746,136,926,343,466,158,112,439,111,916,298,664,927,826,846,542,299,967,582,443,474,917,754,544,698&s=GGXWDG_NGDP& grp=0& a=& pr. x=39& pr. y=7), IMF, accessed on 29 April 2011.

Economy of India 20
[40][40] Task Force Report 2006, p. 7.[41] Task Force Report 2006, pp. 7–8.[43] Task Force Report 2006, pp. 17–20.[46] Task Force Report 2006, pp. 9–10.[55] " ICRIER Begins Survey of Indian Retail Sector (http:/ / www. indianrealtynews. com/ retail-market/
icrier-begins-survey-of-indian-retail-sector. html)." 19 March 2007.[58][58] Economic Survey 2010, p. 180.[77] Economic Survey 2010, pp. 127–129.[78][78] Economic Survey 2010, p. 127.[80] Economic Survey 2010, pp. 142–144.[82][82] Economic Survey 2010, p. 132.[87][87] Economic Survey 2010, p. 225.[94] Indian Rupee versus US Dollar exchange rate – historical trends (http:/ / finance. yahoo. com/ echarts?s=USDINR=X+
Interactive#symbol=;range=20021219,20120729;compare=;indicator=volume;charttype=area;crosshair=on;ohlcvalues=0;logscale=off;source=undefined;)[108] Economic Survey 2010, pp. 275–277.[117] http:/ / ihds. umd. edu/ IHDS_files/ 04HDinIndia. pdf[118][118] Desai, Sonalde, Amaresh Dubey, B.L. Joshi, Mitali Sen, Abusaleh Shariff and Reeve Vanneman. 2010. India Human Development in
India: Challenges for a Society in Transition. New Delhi: Oxford University Press.[138] Economic Survey 2010, pp. 280–281.[142][142] Socio-economic Inequality in India and the World since 1990, Deepankar Basu
ReferencesBooks• Datt, Ruddar; Sundharam, K.P.M. (2009). Indian Economy. New Delhi: S. Chand Group. p. 976.
ISBN 978-81-219-0298-4.• Drèze, John; Sen, Amartya (1996). India: Economic Development and Social Opportunity. Oxford University
Press. p. 292. ISBN 978-0-19-564082-3.• Kumar, Dharma (2005). The Cambridge Economic History of India, Volume II : c. 1757–2003. New Delhi:
Orient Longman. p. 1115. ISBN 978-81-250-2710-2.• Nehru, Jawaharlal (1946). The Discovery of India. Penguin Books. ISBN 0-14-303103-1.• Panagariya, Arvind (2008). India: The Emerging Giant. Oxford University Press. p. 514.
ISBN 978-0-19-531503-5.• Raychaudhuri, Tapan; Habib, Irfan (2004). The Cambridge Economic History of India, Volume I : c. 1200 – c.
1750. New Delhi: Orient Longman. p. 543. ISBN 978-81-250-2709-6.• Roy, Tirthankar (2006). The Economic History of India 1857–1947. Oxford University Press. p. 385.
ISBN 978-0-19-568430-8.Papers and reports• "Economic reforms in India: Task force report" (http:/ / harrisschool. uchicago. edu/ News/ press-releases/ IPP
Economic Reform in India. pdf) (PDF). University of Chicago. p. 32.• "Economic Survey 2009–10" (http:/ / indiabudget. nic. in/ es2009-10/ chapt2010/ chapter. zip). Ministry of
Finance, Government of India. p. 294.

Economy of India 21
Further readingBooks• Alamgir, Jalal (2008). India's Open-Economy Policy. Routledge. ISBN 978-0-415-77684-4.• Bharadwaj, Krishna (1991). "Regional differentiation in India". In Sathyamurthy, T.V. Industry & agriculture in
India since independence. Oxford University Press. pp. 189–199. ISBN 0-19-564394-1.Articles• "Growth of India" (http:/ / www. janderie. live. haverford. edu/ wiki/ index. php?title=India_growth). Retrieved
2005-08-10.• "Milton Friedman on the Nehru/Mahalanobis Plan" (http:/ / www. indiapolicy. org/ debate/ Notes/ fried_opinion.
html). Retrieved 2005-07-16.• "Infrastructure in India: Requirements and favorable climate for foreign investment" (http:/ / www. asiatradehub.
com/ india/ intro. asp). Retrieved 2005-08-14.• Bernardi, Luigi and Fraschini, Angela (2005). Tax System And Tax Reforms in India (http:/ / ideas. repec. org/ p/
uca/ ucapdv/ 45. html). Working paper n. 51.• Centre for Media Studies (2005). India Corruption Study 2005: To Improve Governance Volume – I: Key
Highlights (http:/ / www. prajanet. org/ newsroom/ internal/ tii/ ICS2k5_Vol1. pdf) (PDF). TransparencyInternational India. Retrieved 2009-06-21.
• Ghosh, Jayati. "Bank Nationalisation: The Record" (http:/ / www. macroscan. com/ cur/ jul05/cur210705Bank_Nationalisation. htm). Macroscan. Retrieved 2005-08-05.
• Gordon, Jim and Gupta, Poonam (2003). Understanding India's Services Revolution (http:/ / www. imf. org/external/ np/ apd/ seminars/ 2003/ newdelhi/ gordon. pdf) (PDF). 12 November 2003. Retrieved 2009-06-21.
• Panagariya, Arvind (2004). India in the 1980s and 1990s: A Triumph of Reforms (http:/ / ideas. repec. org/ p/wpa/ wuwpit/ 0403005. html).
• Sachs, D. Jeffrey; Bajpai, Nirupam and Ramiah, Ananthi (2002). Understanding Regional Economic Growth inIndia (http:/ / web. archive. org/ web/ 20070701042205/ http:/ / www2. cid. harvard. edu/ cidwp/ 088. pdf) (PDF).Working paper 88. Archived from the original (http:/ / www2. cid. harvard. edu/ cidwp/ 088. pdf) on 1 July 2007.
• Srinivasan, T.N. (2002). Economic Reforms and Global Integration (http:/ / www. econ. yale. edu/ ~srinivas/ec_reforms. pdf) (PDF). 17 January 2002. Retrieved 2009-06-21.
• Kurian, N.J. "Regional disparities in india" (http:/ / planningcommission. nic. in/ reports/ sereport/ ser/vision2025/ regdsprty. doc). Retrieved 2005-08-06.
News• Ravi S Jha. "India, the Goliath, Falls with a Thud" (http:/ / www. khaleejtimes. com/ kt-article-display-1.
asp?section=business& xfile=data/ business/ 2008/ october/ business_october347. xml).• "India says 21 of 29 states to launch new tax" (http:/ / www. dailytimes. com. pk/ default.
asp?page=story_25-3-2005_pg5_13). Daily Times. 25 March 2005.• "Economic structure" (http:/ / www. economist. com/ countries/ India/ profile. cfm?folder=Profile-Economic
Structure). The Economist. 6 October 2003.a• "Regional stock exchanges – Bulldozed by the Big Two" (http:/ / www. thehindubusinessline. com/ businessline/
2001/ 07/ 20/ stories/ 0420. 62& nbsp;billion. htm). Retrieved 2005-08-10.• "FinMin considers three single-brand retail FDI proposals" (http:/ / news. indiamart. com/ story/
finmin-considers-three-single-brand-retail-fdi-proposals-169557. html).

Economy of India 22
External linksGovernment of India websites• Ministry of Finance, Government of India (http:/ / finmin. nic. in/ )• Department of Commerce, Government of India (http:/ / commerce. nic. in/ )• Department of Industrial Policy & Promotion (http:/ / dipp. nic. in/ English/ default. aspx)• Office of the Economic Adviser (http:/ / eaindustry. nic. in/ )• India in Business (http:/ / www. indiainbusiness. nic. in/ )- Official website for Investment and Trade in India• Union Budget & Economic Survey (http:/ / indiabudget. nic. in/ index. asp)• Income Tax Department of India (http:/ / www. incometaxindia. gov. in/ home. asp)• Central Board of Excise and Customs (http:/ / www. cbec. gov. in/ cae1-english. htm)• Reserve Bank of India's database on the Indian economy (http:/ / www. rbi. org. in/ scripts/ Statistics. aspx)Publications and statistics• Key indicators of household consumer expenditure in India 2011-2012 (http:/ / www. indiaenvironmentportal.
org. in/ reports-documents/ key-indicators-household-consumer-expenditure-india-2011-2012)• World Bank – India Country Overview (http:/ / www. worldbank. org. in/ WBSITE/ EXTERNAL/ COUNTRIES/
SOUTHASIAEXT/ INDIAEXTN/0,,contentMDK:20195738~menuPK:295591~pagePK:141137~piPK:141127~theSitePK:295584,00. html)
• Ernst & Young 2011 report on doing Business in India (http:/ / www. ey. com/ Publication/ vwLUAssets/Doing_business_in_India_2011/ $FILE/ Doing_business_in_India_2011. pdf)
• IMF, India (http:/ / www. imf. org/ external/ country/ IND/ index. htm)• CIA – The World Factbook – India (https:/ / www. cia. gov/ library/ publications/ the-world-factbook/ geos/ in.
html)

Article Sources and Contributors 23
Article Sources and ContributorsEconomy of India Source: http://en.wikipedia.org/w/index.php?oldid=563214073 Contributors: 12 Noon, 25 Cents FC, 99econ, A Stop at Willoughby, A.arvind.arasu, AJIT KANKARIYA,Aathma123, Abanerjee054, Abecedare, Abhaynagale, Abhiag, Abhishekc2q, AbhisheksinghWIKI, Abhowmick, Abjerer, Achmad Fahri, Acs4b, Adityaconsul, Adityapatadia, Adived, Aeonx,AgniKalpa, Agrawalmayur, Ajoykt, Alaadw, Alan Liefting, Alanscottwalker, Alexius08, AlexiusHoratius, Aliyevramin, Alokagrawal8, Alongla, Alpha 4615, Amartyabag, Amaury,Ambuj.Saxena, Amos Tori, Anbu121, Andreakoo, Anir1uph, Anirvan, Anishurahman, Ankitbhatt, Ankururdu, Anon200401, Antandrus, Anwar saadat, Apeloverage, ApostleVonColorado,Apurv1980, AreJay, Arjun024, Armyjawan1, Arnsy, Arsonal, Ascendantbias, Ashok4himself, Asmit adgaonkar, Astute neophyte, Atulsnischal, Au7, Aude, Aurorion, Australian cowboy,Autostat, Av9, Avi malu, Awareoftypes, AxG, Axl, Azileretsis, BD2412, Baileypalblue, Banes, Bangalore102, Barek, Battlecry, Bcs09, Bdebbarma, Belagola, Beland, Belinda-Rikku,Bharatgopal, Biker Biker, Billmcn, Bilwaj, Birju wishmaster, Bjalring, Blacksun, Bobblewik, Bobbytheonlyone, Bobo192, Boiscoupe, Bongwarrior, Bookofjude, Boromir123, Bowei Huang 2,Brad101, Brainboy109, BrightStarSky, Brighterorange, Bryan Derksen, Bugnot, Bunchofgrapes, Bunnyhop11, By78, C mon, CWii, Caknuck, CalJW, Can't sleep, clown will eat me, Capricorn42,Catgut, Cfplp, Chaitanya.lala, Challengetheodds, Chamarty, Chanakyathegreat, Charlesdrakew, CharlieEchoTango, Cheatae, Ched, Chengroop, Chetanshaw, Chinimilli.naresh, Chipmunkdavis,Chris the speller, Christopher140691, Ckatz, Cleanningup, Closedmouth, Cntras, Colesbury, CommonsDelinker, Coolcat101cara, Cordless Larry, Cosmos416, Cpl Syx, Crackedge,Cremepuff555, Crux, Curps, Cyfal, D, DIEGO RICARDO PEREIRA, DSachan, DaGizza, DadaNeem, Dana boomer, Dandv, DanielCD, Danilomath, Darguz Parsilvan, Dark Shikari, DarthPanda, Datastat, Datizyou, David Biddulph, Dbachmann, Debo eco1982, Dede2008, Deepak, Dekisugi, Delhipro, Delirium, Deville, Dewan357, Discospinster, Divoc, Diwas, DocWatson42,DocendoDiscimus, Doldrums, Draumr, Dudafiery, Duncan, Dupz, Duroy, ESkog, EWikist, Edgar181, Edward, Eggman64, Ekabhishek, Emperor Genius, Endgame1, Enghinmatsci, EnigmaBlues, Enthusiast10, Epbr123, Euchiasmus, Eug.galeotti, Evano1van, Everyking, Exist early now, Eyewax, Falcon8765, Ferntipr, Filcopper, Firsfron, Flat Out, Fowler&fowler, Francs2000,Freeworldforever, Funandtrvl, Gadfium, Gadget850, Gaius Cornelius, Ganesh.rao, Ganeshk, Gaurav1146, Generalboss3, Ghaighai, Gilliam, Gimmetrow, GingerGeek, Gloriamarie, Gmaxwell,GoShow, Gogo Dodo, Gold Standard, Goleyo, Goodwin-Brent, Gourav7999, Gppande, Grafen, Gralo, Green Giant, GregorB, Greice70, Ground Zero, Gscshoyru, Gthorvey, Gunjankg, Gurch,Gurubrahma, HIDECCHI001, HappyCamper, Harsha850, Harshasur1, Hashimzia, Haymaker, Haza-w, Headbomb, Herbu, Herbythyme, Hibernian, Hindigo, Hintha, Hkelkar, Hmains, HolyGanga, Honorablesir, Hu12, Huaiwei, Huniebunie, ITA 01, Ias2008, IceBrotherhood, IceKarma, Icecoolsushobhan, Idleguy, IdreamofJeanie, Igordebraga, Ilmari Karonen, Imc, Incidious, Incrazy,Indiabuff, Indianbllood, Indianstar, Indon, InduProjectsLimited, Insanity Incarnate, Intgr, Iridescent, IvanCrives, J mareeswaran, Jackol, Jafferhamdani83, Jagged 85, Jalamgir,JamesabhirupZZZZ, Jamesontai, Jasonuhl, Jaxl, Jay, Jay Turner, JayC, Jb3141, Jd027, Jeroje, Jgnbr, Jillids, Jim1138, Joelr31, JohnCD, Johnuniq, Jolly Janner, Jonathanfu, Jonoikobangali,Jorunn, Jose Icaza, Joseph Solis in Australia, Joshfinnie, Jovianeye, Joyson Prabhu, Jswaminathan, Jtkachuk, Jtkiefer, JuJube, Judgesurreal777, Ka Faraq Gatri, Kaaenaat, Kaal, Kaaveh Ahangar,Kanonkas, Kapitop, Karlhahn, Karthikndr, Kattabomman, Kbdank71, Kbh3rd, Kearstyn, Ketiltrout, Khalidshou, Khazar2, King Zebu, Kintetsubuffalo, Kiore, Kishore.kp100, Kkm010,Kkumaresan26, KnightRider, KnowledgeHegemony, KnowledgeHegemonyPart2, Kothesk, Kotis, Kozuch, Kristod, Kungfuadam, Kuru, Kusha21, KuwarOnline, L Kensington, LaMenta3,Lacrimosus, Ladril, Lalit Jagannath, Leandrod, LeaveSleaves, Ledenierhomme, Legolas2186, LemonTwinkle, Lightmouse, Lights, Ligulem, LilSanta, LittleDan, LogicDictates, Lolcrap,Lordharrypotter, Lordofwar1, Loren.wilton, MER-C, Maa sekhar, Madavpv, Madchester, Madhava 1947, Madstat, Magioladitis, Maheshkumaryadav, Maitreyayadav, Malcolmxl5,Manaspunhani, Manassingh1989, Manubrel, Mark Arsten, Marshall1984, Marskell, MartinDK, Materialscientist, Mathaiman, MattieTK, Mattisse, Maurice07, Maxamegalon2000,MaximvsDecimvs, Mayur.thakare, Maziotis, Meelar, Mentifisto, Merbabu, Michael Devore, Michael Hardy, MightyWarrior, Mike Rosoft, Mithridates, Mittal.fdk, Mjpieters, Mmalhi,Money.news, Moreschi, Mowgli, Mr Stephen, Mrt3366, MsDivagin, Mschiffler, Muhandes, Munci, Mvinas, MythNReality, Nakon, Namenotek, Nanu1212, Nathan Johnson, Navhus,NawlinWiki, Neelkamala, NeilN, Neqitan, Netpilot43556, Neverquick, Niceguyedc, Nichalp, Nickshanks, Nihiltres, Nikkul, Nilei.net, Nirvana888, Nishkid64, Nitinku5021a, Nitnaga, NityaDharma, Nobleeagle, Noitazilivic, Nosedown, Notashamed, Nsaa, Nubin wiki, NuclearWarfare, OMERZEN, Oblivious, ObscureReality, Ocaasi, Ohconfucius, Oli Filth, OllieFury,Orangewhitegreen, Otolemur crassicaudatus, Ottre, PDH, PakEconomist, Pamri, Panandh, Parunach, PathFinder, PaulHanson, Pawan Kaul, Paxsimius, Perspicacite, Petemclaren, Petrb, Pharaohof the Wizards, Phil Boswell, Philip Trueman, Piano non troppo, Picaroon, Pinkadelica, Piyushshukla970, Pizzadeliveryboy, Plinkit, Pmlineditor, Poeloq, Politicalpandit, Polylerus, Poseidon123,Possum, Ppntori, Pragvansh7, Prakashkool007, Pranshil gourkar, Preetikapoor0, Prince20080, Profbond07, Quadell, Quannam, QuéSéYo2, Qwyrxian, R'n'B, RA0808, RG2, RTC, Raguks,RainbowOfLight, Raja Hussain, Rajaram Sarangapani, Rajputbhatti, Rakesh999991, Ralphrau, Rameshplm, Ramitmahajan, Rammstein737, Ramprasad002053, Ramu coolhimesh, Ranmehta,Rao Ravindra, Rathosubrat, Ravikiran r, Rconner, Reach Out to the Truth, ReluctantPhilosopher, Removepoverty, Rettetast, RexNL, Riana, Rich Farmbrough, Richard D. LeCour,Richard-of-Earth, Rinju9, Rishab1988, Rjwilmsi, Rmky87, RoadTrain, RobertG, Robertvan1, Rocko181, Roux, RoyBoy, Rr2503, Rsrikanth05, S.saurabh.p, S3000, SBC-YPR, SDas, SSZ,Sachincrai, Sadiqkhan 6384, Sailsbystars, Saksham, Salamurai, Sam Hocevar, Samar60, Samkitshah64198618, Sandiprouth, SandyGeorgia, Sandyqbg, Sanjeevsofteng, Sanyasi, Sapnam,Saravask, Sarosh8, Saturn HT, Saurabhzutshi, SchmuckyTheCat, Sdeox, Seaphoto, Sen dp, Senhorak, Seraphiel, Sghatak22, Shahab, Shankar mallapur, Sharkkiller2050, Shashank.131, Shawx,Shelvinc, Shiljuhere, Shivap, Shovon76, Shrini37, Shyam, Signswork, Silvrous, SiobhanHansa, Sionus, Sir Edgar, SivaKumar, Sjock, Sjö, Skarebo, Skcpublic, Skier Dude, Skinsmoke,SkyWalker, SlimVirgin, Smano555, Snigbrook, Snow Blizzard, Soccer2020, Someguy1221, Sophie2895, SpNeo, SpacemanSpiff, SpikeToronto, Spliffy, Spruceforest, Sreejithk2000,Srimanta.Bhuyan, Ssanagav, StasMalyga, Stelpa, Strike Eagle, SubZero..Vighu.., Sudoman, Suhail sharma, Sukucivil, Sumanch, Sumanthk, Sundar, Sunilshamnur, Sunny planet, Sunray,Superprof, Surinamer, Suryapsingh, Sushant gupta, Suyogaerospace, Svmandke, Sweetmusician, Tabletop, Tadkashadka, Tarun.Varshney, Tarunmah, TastyPoutine, Tatiraju.rishabh, Taxman,Tbhotch, Telugodu123, Terrace4, Thakur rigved, That Guy, From That Show!, Thatguyflint, The Thing That Should Not Be, The Wikimon, The idiot, Theda, ThevikasIN, ThisIsAce,Thunderboltz, Tide rolls, Tim1357, Titodutta, Tmopkisn, Tolly4bolly, Tony1, Toy111, Tpbradbury, Trakesht, Treatakbar, Treemapper, Treisijs, Tri400, Troy44, Trust Is All You Need, TurloLomon, TurquoiseThreads, Ujwal10101, Us bison power, User2004, Utcursch, V.Chowla, Van helsing, Varghesejacob, Vedant, Vensatry, Vikram infodrive, Vimalkalyan, Vinaypv5,VirtualSteve, VishalB, Vishibt, Vishvajit87, Vivek7de, Vjz666, Vkailasa, Vkshah2, Vkvora2001, Voltigeur, Vp singh11, Wasbeer, Wavelength, Wayne Slam, Wayward, Wenli, WetFirefighter,WhaleWey, WhatisFeelings?, Whiskey in the Jar, Widr, WikHead, Wiki alf, Wikipelli, Wikirao, Williamvoor, Win.monroe, Wingsoop, Woohookitty, Worldwatcher2000, Wpedzich, Wushi-En,Xiaojeng, Xman1, Yabaluri Goutham, Yasht101, Yintan, Yogesh Khandke, Zangar, Zbxgscqf, Zhonghuo, Zlerman, Zuggernaut, ~shuri, Žiedas, రవిచంద్ర, ಪ್ರದೀಪ್, 1960 anonymous edits
Image Sources, Licenses and ContributorsFile:High Rise.JPG Source: http://en.wikipedia.org/w/index.php?title=File:High_Rise.JPG License: Creative Commons Attribution-Sharealike 3.0 Contributors: User:RakeshpateImage:Indian Rupee symbol.svg Source: http://en.wikipedia.org/w/index.php?title=File:Indian_Rupee_symbol.svg License: Public Domain Contributors: OrionistFile:Flag of the United Arab Emirates.svg Source: http://en.wikipedia.org/w/index.php?title=File:Flag_of_the_United_Arab_Emirates.svg License: Public Domain Contributors: AnimeAddict AA, Avala, Dbenbenn, Duduziq, F l a n k e r, Fry1989, Fukaumi, Gryffindor, Guanaco, Homo lupus, Kacir, Klemen Kocjancic, Krun, Madden, Neq00, Nightstallion, Piccadilly Circus,Pmsyyz, RamzyAbueita, Ricordisamoa, Zscout370, 5 anonymous editsFile:Flag of the United States.svg Source: http://en.wikipedia.org/w/index.php?title=File:Flag_of_the_United_States.svg License: Public Domain Contributors: AnomieFile:Flag of the People's Republic of China.svg Source: http://en.wikipedia.org/w/index.php?title=File:Flag_of_the_People's_Republic_of_China.svg License: Public Domain Contributors:Drawn by User:SKopp, redrawn by User:Denelson83 and User:Zscout370 Recode by cs:User:-xfi- (code), User:Shizhao (colors)File:Flag of Singapore.svg Source: http://en.wikipedia.org/w/index.php?title=File:Flag_of_Singapore.svg License: Public Domain Contributors: VariousFile:Flag of Hong Kong.svg Source: http://en.wikipedia.org/w/index.php?title=File:Flag_of_Hong_Kong.svg License: Public Domain Contributors: Designed byFile:Flag of Switzerland.svg Source: http://en.wikipedia.org/w/index.php?title=File:Flag_of_Switzerland.svg License: Public Domain Contributors: User:Marc Mongenet Credits: User:-xfi-User:Zscout370File:Flag of Saudi Arabia.svg Source: http://en.wikipedia.org/w/index.php?title=File:Flag_of_Saudi_Arabia.svg License: Public Domain Contributors: UnknownFile:Silk route.jpg Source: http://en.wikipedia.org/w/index.php?title=File:Silk_route.jpg License: Public Domain Contributors: Whole_world_-_land_and_oceans_12000.jpg: NASA/GoddardSpace Flight Center derivative work: Splette (talk)File:Atashgah-inscription-jackson1911.jpg Source: http://en.wikipedia.org/w/index.php?title=File:Atashgah-inscription-jackson1911.jpg License: Public Domain Contributors: A. V.Williams Jackson (1862 – 1937)file:MauryanCoin.JPG Source: http://en.wikipedia.org/w/index.php?title=File:MauryanCoin.JPG License: Public domain Contributors: en:User:PHG (now en:User:Per Honor et Gloria) akaUser:PHGCOM (now User:World Imaging) on Commonsfile:Kumaragupta.JPG Source: http://en.wikipedia.org/w/index.php?title=File:Kumaragupta.JPG License: GNU Free Documentation License Contributors: Original uploader was Per Honor etGloria at en.wikipediaFile:HooglyKolkata1945.jpg Source: http://en.wikipedia.org/w/index.php?title=File:HooglyKolkata1945.jpg License: Public Domain Contributors: Claude Waddell, military photographerFile:Precolonial national income of India(1857-1900).png Source: http://en.wikipedia.org/w/index.php?title=File:Precolonial_national_income_of_India(1857-1900).png License: PublicDomain Contributors: User:PamriFile:India GDP without labels.PNG Source: http://en.wikipedia.org/w/index.php?title=File:India_GDP_without_labels.PNG License: Creative Commons Zero Contributors: Magog the Ogre,Roland zh

Image Sources, Licenses and Contributors 24
File:ONGC Oil Platform.jpg Source: http://en.wikipedia.org/w/index.php?title=File:ONGC_Oil_Platform.jpg License: Creative Commons Attribution 2.0 Contributors: Nandu Chitnis fromPune, IndiaFile:2006Indian exports.PNG Source: http://en.wikipedia.org/w/index.php?title=File:2006Indian_exports.PNG License: Creative Commons Attribution-Sharealike 3.0 Contributors: Originaluploader was Anwar saadat at en.wikipediaFile:India treemap.png Source: http://en.wikipedia.org/w/index.php?title=File:India_treemap.png License: Creative Commons Attribution-Sharealike 3.0 Contributors: Clusternote,Donarreiskoffer, TreemapperFile:Cumulative Current Account Balance.png Source: http://en.wikipedia.org/w/index.php?title=File:Cumulative_Current_Account_Balance.png License: Creative CommonsAttribution-ShareAlike 1.0 Generic Contributors: Emilfaro, SBC-YPR, 2 anonymous editsFile:RBI-Tower.jpg Source: http://en.wikipedia.org/w/index.php?title=File:RBI-Tower.jpg License: Creative Commons Attribution-ShareAlike 3.0 Unported Contributors: User:NichalpFile:Gini Coefficient World CIA Report 2009-1.png Source: http://en.wikipedia.org/w/index.php?title=File:Gini_Coefficient_World_CIA_Report_2009-1.png License: Public Domain Contributors: Gini_Coefficient_World_CIA_Report_2009.png: Hysohan derivative work: Narfsort (talk)File:Ind world GNI percapita.PNG Source: http://en.wikipedia.org/w/index.php?title=File:Ind_world_GNI_percapita.PNG License: Public Domain Contributors: DatastatFile:Cyber Green Building, Gurgaon, Haryana, India - 20070613.jpg Source:http://en.wikipedia.org/w/index.php?title=File:Cyber_Green_Building,_Gurgaon,_Haryana,_India_-_20070613.jpg License: Creative Commons Attribution 2.0 Contributors: User:NikkulFile:World Map Index of perception of corruption.svg Source: http://en.wikipedia.org/w/index.php?title=File:World_Map_Index_of_perception_of_corruption.svg License: Public Domain Contributors: derivate work: TalkstosocksFile:Private and public industry employment in India(2003).png Source: http://en.wikipedia.org/w/index.php?title=File:Private_and_public_industry_employment_in_India(2003).png License: Public Domain Contributors: User:Pamri
LicenseCreative Commons Attribution-Share Alike 3.0 Unported//creativecommons.org/licenses/by-sa/3.0/